


1. Introduction
Integrating sustainability into product design is an ethical imperative (Chan Reference Charter and Clark2018), and has been so even before the term ‘sustainability’ was coined (Papanek Reference Papanek1995), but it has been difficult. Many claim that considering sustainability can improve product innovation (Hawken, Lovins & Lovins Reference Hawken, Lovins and Lovins1999; Charter & Clark Reference Charter and Clark2007; Aronson Reference Aronson2013; Keskin, Diehl & Molenaar Reference Keskin, Diehl and Molenaar2013), but others have found it to inhibit creativity (Collado-Ruiz & Ghorabi Reference Collado-Ruiz and Ghorabi2010). The very definition of sustainability is not consistent, though there is a general consensus that it should include environmental, social and economic benefits, as described in the UN Sustainable Development Goals (UN 2015) or the Brundtland report (Brundtland et al. Reference Brundtland, Khalid, Agnelli, Al-Athel and Chidzero1987), versus focusing primarily on environmental sustainability as in Ecological Design (Cowan & Ryn Reference Cowan and Ryn1996).
Definitions of innovation are also not consistent, varying from measuring Quantity, Quality, Novelty and Variety (Shah, Smith & Vargas-Hernandez Reference Shah, Smith and Vargas-Hernandez2003) or variants thereof (Oman et al. Reference Oman, Tumer, Wood and Seepersad2013) to the ‘Sapphire’ method (Srinivasan & Chakrabarti Reference Srinivasan and Chakrabarti2010), ‘linkography’ (Vidal, Mulet & Gómez-Senent Reference Vidal, Mulet and Gómez-Senent2004), ‘Creative Product Semantic Scale’ (Besemer & O’Quin Reference Besemer and O’Quin1986), and others. However, a general consensus is that innovation is creativity that improves product or service value versus the competition, especially financial value (Baregheh et al. Reference Baregheh, Rowley and Sambrook2009).
Thus, industry needs effective tools in order to drive substantive sustainability innovations, especially as sustainable design evolves from individual products to larger socio-technical systems (Scott, Bakker & Quist Reference Scott, Bakker and Quist2012; Ceschin & Gaziulusoy Reference Ceschin and Gaziulusoy2016; da Costa, Diehl & Snelders Reference da Costa, Diehl and Snelders2019). Hundreds of sustainable design methods exist (Oehlberg et al. Reference Oehlberg, Bayley, Hartman and Agogino2012), many existing for decades (Keoleian & Menerey Reference Keoleian and Menerey1994), though few are used. Which methods will pay off in sustainability and innovation value for a specific design team on a specific project?
To help practitioners choose between sustainable design methods, most experts provide theoretical analyses displaying differences by environmental or social considerations, application to life cycle phases or other factors (Brink, Destandau & Hamlett Reference Brink, Destandau and Hamlett2009a; Shedroff Reference Shedroff2009; Oehlberg et al. Reference Oehlberg, Bayley, Hartman and Agogino2012; Ceschin & Gaziulusoy Reference Ceschin and Gaziulusoy2016; Faludi Reference Faludi2017a). However, this study’s empirical testing found theoretical analyses are not always supported by facts. It also treated design methods not as competitors, but as prototypes to user test, enabling future iteration to improve each design method or hybridize components from different methods into more effective and inspiring practice. The study asked professional designers, engineers, managers and sustainability specialists what they valued about three different design methods, after they participated in workshops on each method performing green redesigns of their own real products. The goal was to find where and why practitioners found sustainability value, innovation value or other business value in each design method, as the practitioners defined these values. This should help practitioners to more mindfully choose design methods (or components thereof) that optimize for their circumstances.
2. Background and theory
Previous empirical studies on sustainable design have usually studied individual methods in isolation (Devanathan et al. Reference Devanathan, Ramanujan, Bernstein, Zhao and Ramani2010; Uang & Liu Reference Uang, Liu and Kurosu2013; Reap & Bras Reference Reap and Bras2014; Tempelman et al. Reference Tempelman, Pauw, Grinten, Mul and Grevers2015; Arlitt et al. Reference Arlitt, Van Bossuyt, Stone and Tumer2017; Mattson et al. Reference Mattson, Pack, Lofthouse and Bhamra2019) or considered all sustainable design practices as the same (see first paragraph citations). Some have compared whole design methods to each other (Behrisch, Ramirez & Giurco Reference Behrisch, Ramirez and Giurco2011a; Behrisch, Ramirez & Giurco Reference Behrisch, Ramirez and Giurco2011b). However, these may not be optimal approaches; designers have been found to use far fewer tools than are available to them (Gonçalves, Cardoso & Badke-Schaub Reference Gonçalves, Cardoso and Badke-Schaub2014), and one study found industry sustainable design choices depended more on designers’ expertise than the methods they use (Vallet et al. Reference Vallet, Eynard, Millet, Mahut, Tyl and Bertoluci2013a). Interviews with professional sustainable design experts revealed that they rarely use whole sustainable design methods; rather, they usually mix parts of several methods opportunistically, or use only parts of a method (Faludi & Agogino Reference Faludi and Agogino2018).
While studies of this for sustainable design are lacking, researchers of traditional design methods have long documented practitioners mixing parts of methods opportunistically (Homans Reference Homans1949; Visser Reference Visser1990; Pahl et al. Reference Pahl, Badke-Schaub and Frankenberger1999; Cross Reference Cross, Eastman, Newstatter and McCracken2001). Studies have also found managers often prefer using multiple strategy tools at once (Jarratt & Stiles Reference Jarratt and Stiles2010; Wright, Paroutis & Blettner Reference Wright, Paroutis and Blettner2013), and this helps drive innovation (Andriopoulos & Lewis Reference Andriopoulos and Lewis2010). Because design teams are acknowledged to combine multiple methods, traditional design methods have been deconstructed to measure component-level innovation value (Shah et al. Reference Shah, Smith and Vargas-Hernandez2003; Hernandez, Shah & Smith Reference Hernandez, Shah and Smith2010; Kramer, Roschuni & Agogino Reference Kramer, Roschuni and Agogino2016); some studies deconstruct even further to substages of ideation techniques (Gonçalves, Cardoso & Badke-Schaub Reference Gonçalves, Cardoso and Badke-Schaub2016). Such deconstruction allows practitioners to be more flexible and mindful in their application of design practices (Cardin Reference Cardin2013).
The opportunistic mixing described above means designers do not use sustainable design methods as monolithic tunnels of process to pass through completely and in order, but as toolboxes to pull from as needed. Therefore, sustainable design methods should be examined at their component level, since these components are largely what designers will actually use. This study empirically assessed innovation value, sustainability value, and other business value in components of three sustainable design methods: The Natural Step (Robèrt Reference Robèrt1991; Baxter et al. Reference Baxter, Boisvert, Lindberg and Mackrael2009), Whole System Mapping (Faludi & Danby Reference Faludi and Danby2010; Faludi Reference Faludi2015), and one implementation of Biomimicry (Faludi & Menter Reference Faludi and Menter2013), of which there are several variants (Benyus Reference Benyus1997; Baumeister et al. Reference Baumeister, Tocke, Dwyer, Ritter and Benyus2008; Baumeister et al. Reference Baumeister, Tocke, Dwyer, Ritter and Benyus2013; Reap & Bras Reference Reap and Bras2014). Other work performed the same empirical testing of these three design methods with students, but student responses do not perfectly predict those of experienced professionals (Faludi et al. Reference Faludi, Yiu, Srour, Kamareddine, Ali and Mecanna2019).
These design methods were chosen because of a combination of them being recommended by industry experts previously interviewed by the authors, and the belief that they would be complementary to each other based on theoretical analysis explained below. Note that the Whole System Mapping method was developed by the lead author of this paper. This is not a conflict of interest because this research was not a comparison to determine which method is best; instead, as mentioned above, the goal was to find both strong and weak points in all three design methods, to enable future hybridization or other improvement of all the methods. Just as human centred design user-tests product prototypes and recombines their features for an improved final product, this user testing can enable others to create improved sustainable design practices by recombining components of these and/or other sustainable design methods.
To enable this perspective, the units of analysis for most of this study were ‘activities’ (what practitioners physically enact) and ‘mindsets’ (what practitioners mentally consider, from individual ideas to entire paradigms). While terminology is not universal, most engineering design literature uses ‘activities’ (Stoyell et al. Reference Stoyell, Kane, Norman and Ritchey2001; Kudrowitz Reference Kudrowitz2010; Vallet et al. Reference Vallet, Eynard, Millet, Mahut, Tyl and Bertoluci2013b; Cash, Stanković & Štorga Reference Cash, Stanković and Štorga2014; Montagna & Cantamessa Reference Montagna and Cantamessa2019). Smith (Reference Smith1998) found 172 ideation practices were merely combinations of 50 core activities. Others use ‘techniques’ (Hanington & Martin Reference Hanington and Martin2012). Business management literature often breaks practices into ‘toolsets, skillsets and mindsets’ (Horth & Vehar Reference Horth and Vehar2012); however, ‘skillsets’ imply previous training, which not all activities described here require. Theorists often do not distinguish between low-level activities and ordered collections thereof, calling both ‘methods’ (Stout Reference Stout2003; Ostergaard & Summers Reference Ostergaard and Summers2009; Roschuni, Agogino & Beckman Reference Roschuni, Agogino and Beckman2011; Roschuni, Kramer & Agogino Reference Roschuni, Kramer and Agogino2015). Here, ‘method’ is defined as an ordered collection of activities and/or mindsets; any collection of activities, mindsets and/or methods is generically called a ‘practice’.
Terminology is less consistent on mental activities. While some use ‘mindsets’ (Horth & Vehar Reference Horth and Vehar2012; IDEO.org 2015; Kramer et al. Reference Kramer, Roschuni and Agogino2016; da Costa et al. Reference da Costa, Diehl and Snelders2019), others use ‘strategies’ (De Pauw, Karana & Kandachar Reference De Pauw, Karana and Kandachar2012; Haemmerle, Shekar & Walker Reference Haemmerle, Shekar and Walker2012; White, Belletire & Pierre Reference White, Belletire and Pierre2013), ‘guidelines’ (Telenko, Seepersad & Webber Reference Telenko, Seepersad and Webber2008; Knight & Jenkins Reference Knight and Jenkins2009; Telenko & Seepersad Reference Telenko and Seepersad2010), ‘framing’ (Cross Reference Cross2004; Björklund Reference Björklund2013), ‘internal logic’ (Wright et al. Reference Wright, Paroutis and Blettner2013), or ‘principles’ (Telenko et al. Reference Telenko, Seepersad and Webber2008; Brink, Destandau & Hamlett Reference Brink, Destandau and Hamlett2009b; Oehlberg et al. Reference Oehlberg, Bayley, Hartman and Agogino2012). Abstract overarching concepts are often called design ‘paradigms’ (Fuad-Luke Reference Fuad-Luke2008; De Pauw et al. Reference De Pauw, Kandachar, Karana, Peck and Wever2010). Here, ‘mindset’ includes all these variants. Regardless of terminology, Badke-Schaub described how important shared mental models are in design processes (Badke-Schaub et al. Reference Badke-Schaub, Neumann, Lauche and Mohammed2007). In fact, much sustainable design literature and training proposes no specific activities, only proposing goals or strategies to consider during normal design activities (Papanek Reference Papanek1995; Hawken et al. Reference Hawken, Lovins and Lovins1999; McDonough & Braungart Reference McDonough and Braungart2002; White et al. Reference White, Belletire and Pierre2013).
Sustainable design methods generally perform several functions, as traditional design and business strategy methods do (Ulrich & Eppinger Reference Ulrich and Eppinger1995; Frost Reference Frost2003). The three sustainable design methods here (and others) have been deconstructed into their constituent activities and mindsets (Faludi Reference Faludi2017a). For readers unfamiliar with these design methods, summaries follow. Readers requiring a more extensive description of the methods and workshop procedures (3000 words) may read chapter 4 of Faludi (Reference Faludi2017b), or may contact the authors.
The Natural Step uses the notion of ‘Backcasting’ to begin with the ultimate goal in mind and move toward it. This begins with defining perfect sustainability for the product system (Awareness/Vision activity); this uses the method’s Four System Conditions mindset to define perfect sustainability. Then practitioners perform a gap analysis between this vision and today’s circumstances (Baseline activity). They then generate ideas to close the gaps (Creative Solutions activity). Finally, they choose which of these ideas to act on (Decide on Priorities activity), using the Three Prioritizing Questions mindsets. These mindsets prioritize ideas based on how much they push towards the ideal vision, provide return on investment (either economic or environmental or social), and provide long-term as well as short-term progress.
Whole System Mapping begins by practitioners cooperatively creating a visual map of the product’s system (Draw Whole System Map activity). They then use Life-Cycle Assessment (LCA) to identify environmental hot-spots; these hot-spots inform the Prioritized Design Spec, along with business priorities. Then practitioners ideate solutions using the system map (Brainstorm on System Map activity) with the goals of having new ideas about every part of the system (Brainstorm All System Nodes mindset) and eliminating parts of the system to drive radical creativity (Eliminate System Nodes mindset). Winning ideas are chosen by comparing to the design priorities (Decide activity).
Biomimicry (as taught) looks to nature for inspiration. First, practitioners redefine the problem in biological terms (Define Problem Biologically activity). Then they seek inspiration in nature (Nature as Model, Nature as Mentor), first by examining physical natural specimens (Discover Models in Life, Learn Life Model Strategies) then using the online database AskNature.org (Discover Model Strategies Online). Then practitioners brainstorm how to imitate these strategies with existing materials and technology (Translate to Buildable Things). Abstract concepts of how nature designs (Nature’s Principles) are used to test for sustainability (Choose Nature’s Principles), and for ideation (Brainstorm Nature’s Principles).
Figure 1 summarizes these, classifying activities as Research (R), Analysis (A), Ideation (I), Build (B), Decision (D), Goal-setting (G), and Communication (C) types. It classifies mindsets as Systems Thinking (ST), Checklists (C), Priorities (P), Determine Own Goals (OG), and Predetermined Goals (PG); the latter were subdivided into Environmental (PG-E), Social (PG-S), Abstract (PG-A), and Concrete (PG-C) goal types. Note that Biomimicry’s Discover Models in Life and Discover Model Strategies Online have been revised from the cited analysis to be both Research and Ideation, based on participant feedback in this study (described in Section 6).
Activities and mindsets in the studied design methods, with categorizations. Image adapted from Faludi (Reference Faludi2017a).
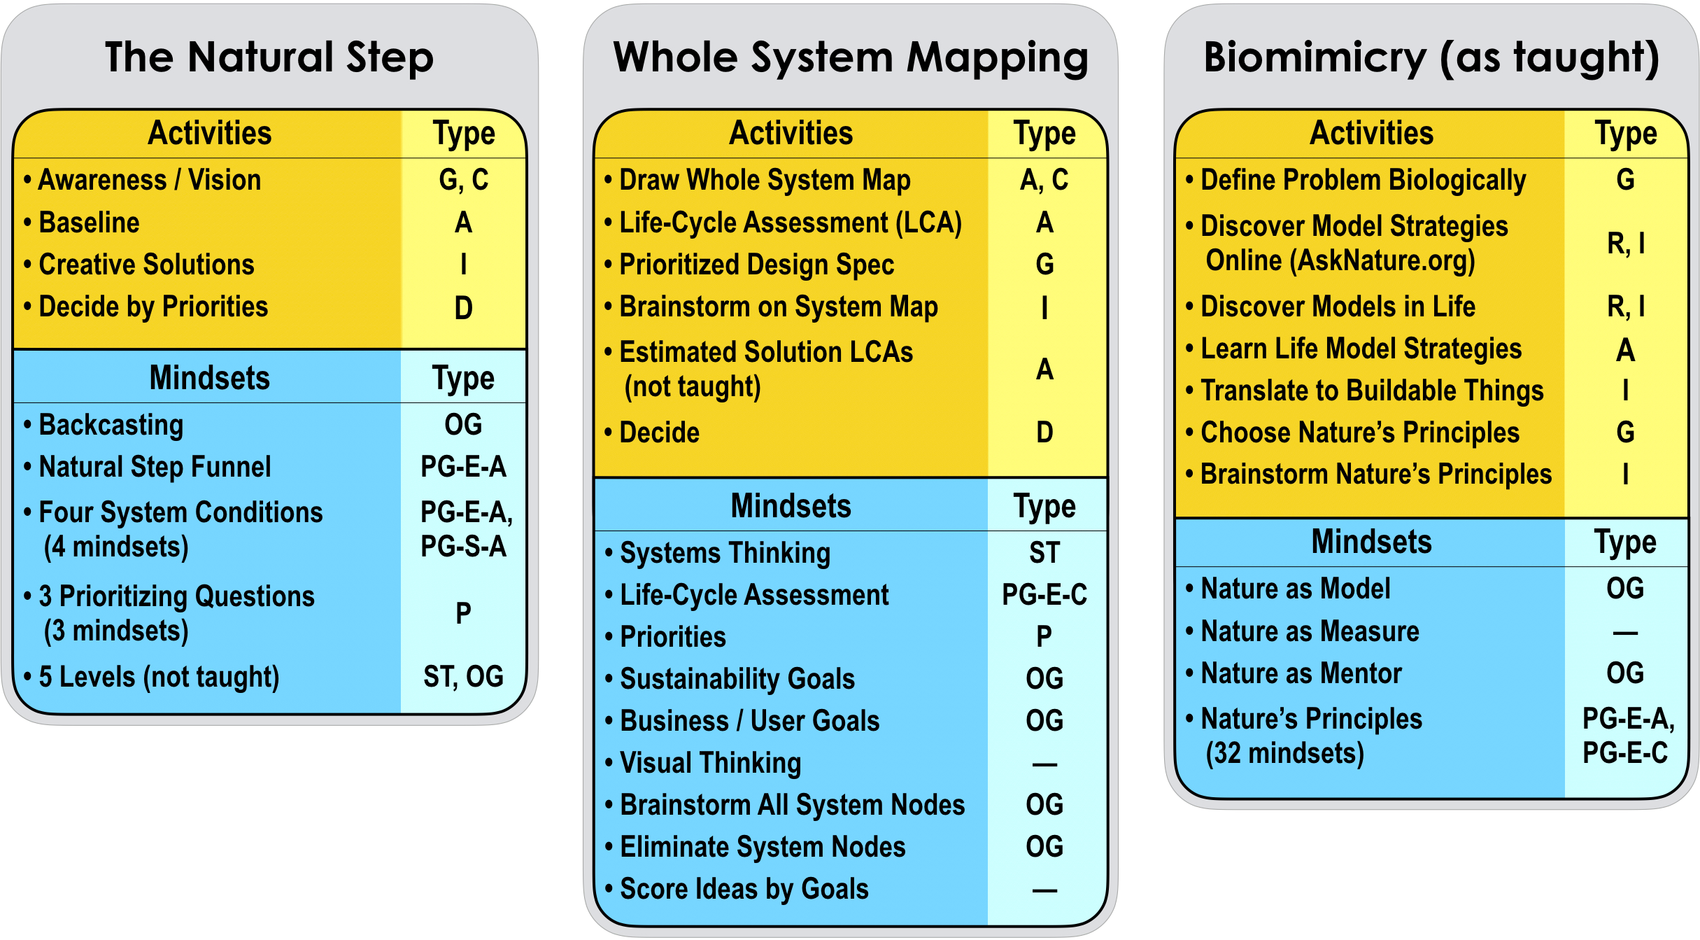
These three design methods were believed to be complementary because product development requires activities in most categories listed above, in balance (Ulrich & Eppinger Reference Ulrich and Eppinger1995; Cash, Hicks & Culley Reference Cash, Hicks and Culley2013). As Figure 1 shows, Biomimicry has more Research and Ideation activities than Whole System Mapping or The Natural Step, while Whole System Mapping has more Analysis activities, and The Natural Step is fairly balanced across goal-setting, analysis, ideation and decision-making activities. They were also believed complementary because The Natural Step contains only Abstract Predetermined Goal mindsets, while the others contain Concrete Predetermined Goals, but it is the only one with social goals; likewise, Biomimicry has no Prioritization, whereas the others do, and Whole System Mapping contains no Abstract Predetermined Goals. Also note the lack of ‘Build’ activities in any of the methods; having a balanced development process implies combining these design methods with traditional design methods such as Human-Centred Design to fill that gap. Overall, finding which activities and mindsets are most valued should help practitioners choose what components to use or combine.
These design methods are recommended by their creators and others for various theoretical reasons: Descriptions of The Natural Step (and its descendent, the Framework for Strategic Sustainable Development; Broman & Robèrt Reference Broman and Robèrt2017) emphasize primarily its mindsets defining sustainability, the Four System Conditions, and secondarily its Backcasting activity (Robèrt Reference Robèrt1991; Baxter et al. Reference Baxter, Boisvert, Lindberg and Mackrael2009; Keen & Bailey Reference Keen and Bailey2012). Descriptions of Whole System Mapping emphasize primarily its visual systems thinking (Draw System Map activity) and secondarily its integration of LCA into early-stage design (Faludi Reference Faludi2015; Egenhoefer Reference Egenhoefer2017). Descriptions of Biomimicry emphasize primarily Nature as Model or Nature as Mentor (they are generally conflated in the act of seeking inspiring models from mentors) and secondarily Nature’s Principles (Benyus Reference Benyus1997; Vincent & Mann Reference Vincent and Mann2002; Kennedy et al. Reference Kennedy, Fecheyr-Lippens, Hsiung, Niewiarowski and Kolodziej2015). The theoretical analysis cited above (Faludi Reference Faludi2017a) also made recommendations by job type: The Natural Step was recommended primarily to managers due to its strategy-level approach and abstract goals; Biomimicry was recommended to designers and engineers due to its concrete goals and focus on research and ideation; Whole System Mapping was recommended equally to all three job types because of its balance of high-level systems thinking with detailed analysis and ideation.
3. Aims
This study aims to help practitioners choose sustainable design practices. Specifically, it aims to help them choose components of design methods to recombine with each other or different design practices, for greater effectiveness and inspiration. To enable this, the study aims to test whether theoretical recommendations are supported empirically.
These hypotheses were tested:
H1: Some components of design methods are valued more than others, and valued for different reasons.
• H1A: Each design method will have some component(s) much more valued than others, such that design teams might choose to only use those components.
• H1B: Perceived sustainability value will be highest in Analysis and Goal-Setting activities, because those are where environmental and social performance are assessed or decided upon, while perceived innovation value will be highest in Ideation and Research activities, because those are where most new ideas are created or found.
• H1C: Highly valued components of the different methods will be complementary, so that a design team could benefit from mixing parts of the three design methods.
H2: Theory accurately predicts what professionals value.
• H2A: The most valued component of The Natural Step will be the Four System Conditions, mostly valued for sustainability; next will be Backcasting, valued for strategic planning.
• H2B: The most valued component of Whole System Mapping will be the Draw System Map activity, mostly valued for systems thinking; next will be LCA, valued for sustainability.
• H2C: The most valued component of Biomimicry will be Nature as Model and/or Nature as Mentor, valued for both sustainability and innovation; next will be Nature’s Principles, also valued for both.
• H2D: The Natural Step will be more valued by managers than designers or engineers; Biomimicry will be the reverse; and Whole System Mapping will be similarly valued by all three job types.
Only hypothesis H2D was tested at the level of whole design methods; all other hypotheses were tested at the component level. The results may help practitioners find best practices for their circumstances, or help mix and match practices from different sustainable design methods.
4. Significance
This study’s significance is twofold: First, to show the need for empirical validation of theoretical recommendations for sustainable design practices, especially at the granular level of activities and mindsets, including sustainability value and innovation value. Second, to show specific recommendations for practitioners on these three design methods and their many activities and mindsets, to help practitioners consider what to use and what to learn.
5. Methods
To assess what professionals valued and why, this study followed Creswell’s ‘concurrent nested’ approach (Creswell Reference Creswell2013) to mixing quantitative and qualitative methods, as well as Blessing and Chakrabarti’s ‘descriptive study II’ phase of design research method #4 (Blessing & Chakrabarti Reference Blessing and Chakrabarti2009). Each design method was taught by the lead author in a separate workshop. Most companies performed each design method on a product currently in development.
5.1. Participant and workshop demographics
Twenty-three workshops were performed for 258 total attendees from over 30 different companies, including several Fortune 500 and Fortune 100 manufacturers. Note that 26 participants were disqualified due to having nondesign-related job roles (e.g., marketing), and 60 did not respond to surveys, thus leaving 172 qualified respondents from 27 companies. Participants were allowed to complete surveys anonymously if desired, so details of job role, gender, and so on are not available for all respondents. For each workshop, participants were divided into teams of four to six people, though teams were occasionally as small as three or as large as eight.
Each design method was performed with five or more companies of different sizes, industries and types. Companies chose which workshops they took, but researchers helped decide the order and continued recruiting companies until enough participants for each design method were reached. Most companies received two or more workshops performed in different orders, and, when possible, weeks or months apart and/or with different participants, to minimize ‘carryover effect’ interaction bias and order effects.
Almost all participants were completely unfamiliar with all three design methods; presurveys showed that only nine participants from any companies had used Biomimicry, and fewer had used the other two methods, so there should not be significant bias due to different levels of familiarity. Most companies received dedicated workshops at their offices for existing teams, but one workshop at the SustainableBrands conference conglomerated participants from many different companies into teams, and one workshop at Singularity University taught several companies’ separate existing teams.
Companies in different industries were specifically sought out, especially consumer electronics, apparel, and furniture, to attempt to find conclusions broadly generalizable across industries. Each team workshopped a different product, even within the same company. Consumer electronics products included a laptop, a home stereo, a wearable health monitor and others. Apparel included a waterproof jacket, rock climbing pants, a swimsuit and others. Furniture included a writing desk, an office chair and others. Other products included a bicycle, a refrigerator, food products, an industrial flow sensor and others. While there are valid arguments for the specificity of design practices by product sector or even company team, many of the most successful design consultancies, such as IDEO, Frog Design, Teague, Designworks, Lunar and more, pride themselves on the applicability of their practices across product sectors. Design Thinking is often claimed universally-applicable (Martin Reference Martin2009; Goldschmidt & Rodgers Reference Goldschmidt and Rodgers2013), and most design pedagogy strives for universality (Pahl & Beitz Reference Pahl and Beitz1984; Ulrich & Eppinger Reference Ulrich and Eppinger1995).
Workshops were taught step-by-step with everything applied to the company products; full descriptions would be prohibitively long, but they are publicly available (Faludi Reference Faludi2017b). The descriptions in the Background and Theory section above summarize them. All workshops were taught by the lead author. Workshop sizes varied from 3 to 50 participants. All three design methods were taught in 4-hour and 2-hour versions. In the shorter workshops, some were simplified or eliminated. In Whole System Mapping, LCA was simplified from interactive use of LCA software in long workshops to a slide of typical LCA results in short workshops; also, in the ‘Decide’ activity, decision matrices for the ‘Score Ideas by Goals’ mindset were shortened to dot voting. In Biomimicry, the activities ‘Choose Nature’s Principles’ and ‘Brainstorm Nature’s Principles’ were abbreviated from 40 minutes to 10 minutes.
Companies were anonymized using ‘C’ for product development consultancy and ‘M’ for manufacturer, followed by a number. Table 1 lists the number of qualified participants from each company and demographic; some companies do not appear due to all participants being disqualified or nonresponsive. The division for ‘small’ versus ‘large’ company was 100 employees. Note that the ‘Responses/Attendees Total’ column is often less than the sum of individual workshop columns because many people participated in more than one workshop.
Demographics by company

‘Apparel’ includes apparel and soft goods.
Abbreviations: Anon., anonymous; Cons., product development consultancy; Cons.elec., consumer electronics; L, large; Mfr., manufacturers; Responses/Attendees, number of qualified respondents followed by number of attendees and percent of attendees responding; S, small.
Table 2 lists demographics by number of people responding, not by number of survey responses as in Table 1. Note that in job roles, the number of people sums to over 172, with a total percentage over 100%, because many participants performed more than one role. Similarly, industry sector sums to over 100% because some consultancies design products in multiple industries.
Demographics by participant

Each demographic is listed with the number of respondents and percentage of total qualified respondents from that demographic.
5.2. Data collection and analysis
Surveys were performed on-site immediately preceding and following each workshop, via Google Forms for those with computers and on paper for those without. Presurveys asked demographic questions, as well as other questions not discussed in this paper. (See the Appendix for full text.) Postsurveys asked what activities or mindsets from the design method they perceived to be most useful, not valuable, drive innovative ideas, what improve product sustainability, and drive any other business value not related to innovation or sustainability. Postsurveys also asked for feedback on the workshops, and other questions not discussed in this paper. (See the Appendix for full text.) All value, including sustainability and innovation value, was measured by self-reporting because all workshops produced large numbers of early-stage ideas, many of which were vague or unclear; thus, objectively assessing them for sustainability and innovation was deemed too subjective and too highly uncertain.
Surveys were not constrained to multiple choice lists of activities or mindsets, participants wrote free text. Most mentions of activities and mindsets matched those identified in Figure 1, but not all – some were surprises. Responses saying that they valued ‘all’ activities or mindsets were counted as valuing all activities and mindsets identified in Figure 1, but not counted as valuing the surprises. Survey text was qualitatively coded at the level of words or phrases for mentions of specific activities or mindsets, mentions of sustainability, innovation, or other benefits, positive or negative statements about an activity or mindset or the overall method, and reasons why. Initial ‘open coding’ of these responses were clustered into code categories for final coding.
Several measures were taken to try to avoid bias in survey responses. As mentioned above, performing workshops in different orders and weeks apart minimized ‘carryover effect’ interaction bias and order effects. To avoid social pressure bias, all surveys were private and most submitted electronically, and participants had the option to submit their surveys anonymously, as noted above. Of the 172 respondents, only 3 had a personal connection to any authors. The primary author, who led all workshops, did not discuss his involvement in their creation. Researchers specifically asked for negative feedback as well as positive, to reduce potential optimism bias. However, because all workshops were voluntary, there may have been selection bias, where those who attended were more interested in sustainability, thus rating the methods higher than those who did not attend or did not complete surveys. To compare this study to another study of the same design methods but performed with students in a nonsustainability-focused class where workshop attendance was required, see Faludi et al. (Reference Faludi, Yiu, Srour, Kamareddine, Ali and Mecanna2019).
MaxQDA software was used to quantify co-occurrences of these codes in text. Co-occurrences were only counted once per participant, to prevent vocal minorities from swaying results; however, an analysis counting all mentions was compared to the one-person-one-vote approach as a validity check for enthusiasm. Counting mentions were then consolidated into four main questions: what do practitioners value, what do they criticize, what do they say drives sustainability, what do they say drives innovation? It was not assumed that mentions of driving sustainability or innovation should also count as mentions of value; mentions of value were only counted in the other questions, not the sustainability question or innovation question. However, most activities or mindsets mentioned as driving sustainability or innovation were also mentioned as valuable in other questions as well. All 373 pre- and postsurveys were coded by both the author and a research assistant to check reliability. The author established coding rubrics by providing the research assistant 30 coded surveys for training; after one iteration of checking intercoder agreement and discussing for consensus adjusting codes, the final intercoder reliability had a Cohen’s Kappa of 0.84 for presurveys and 0.83 for postsurveys. This measure was used to be more robust than merely measuring percent agreement, accounting for possible agreements by chance.
All hypotheses of ‘most’ valued or ‘more’ valued were tested by quantifying self-reported value in surveys. ‘Most’ valued was measured by an item being mentioned more than the average of all other items beyond 95% binomial confidence intervals. This is a conservative measure compared to single standard deviation confidence intervals, to ensure greater reliability of conclusions. These confidence intervals were calculated by an Adjusted Wald method for greater accuracy at small numbers of respondents (Agresti & Coull Reference Agresti and Coull1998; Bonett & Price Reference Bonett and Price2012). ‘More’ valued was measured by pairwise comparisons being beyond 95% confidence intervals. Differences were deemed ‘statistically significant’ only for p values below 0.05 for disproving the null hypothesis; while this does not automatically indicate significance (Browner & Newman Reference Browner and Newman1987), it is a strong indicator, and was considered meaningful after qualitative validation. Especially when testing demographic differences, where there were a large number of comparisons, qualitative analysis was combined with inductive reasoning estimating how different demographics might respond, and was used to check consistency among responses to similar activities or mindsets, to determine validity of p values below 0.05.
6. Results
This section first discusses results within each of the three design methods, then results by activity category, then results by demographic.
6.1. Results within each design method
6.1.1. The Natural Step
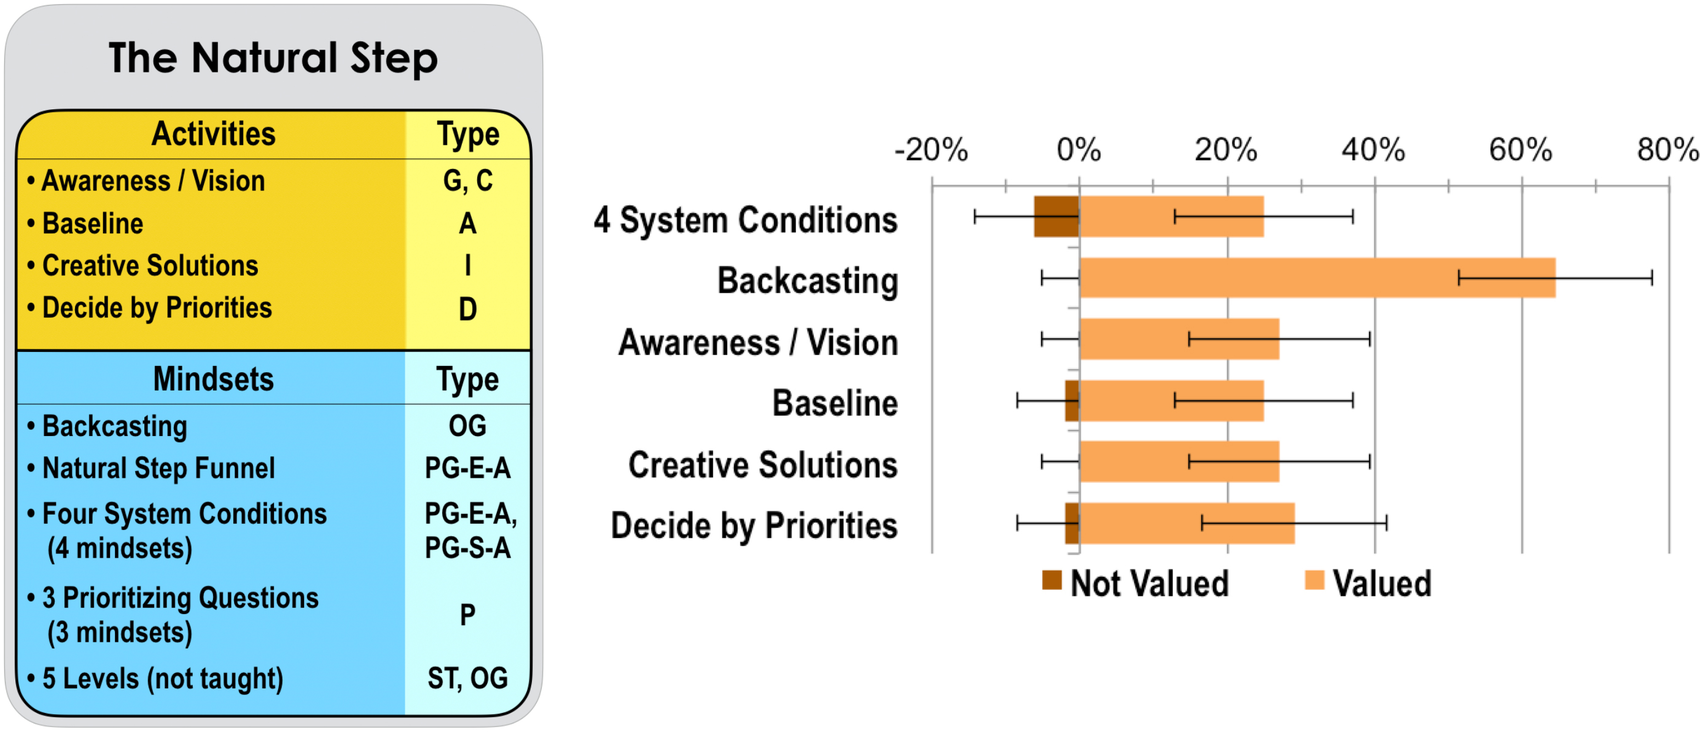
Figures 2 and 3 show quantitative results for overall value and sustainability or innovation value of components in The Natural Step. Table 3 shows qualitative reasons for these values with illustrative quotes. Figure 2 and forthcoming figures show, at left, all activities and mindsets identified by literature in the introduction; at right, they show only the activities or mindsets mentioned as being valued or criticized overall by more than five people. Note that these graphs only count percentages of respondents mentioning each activity or mindset in their survey text; they do not count number of mentions (to avoid vocal minorities), nor do they count the strength of praise or criticism in each response. Table 3 and forthcoming tables list frequently-mentioned and notable reasons why survey respondents valued or criticized the components of the design method. Since these were validated with postworkshop interviews and follow-up interviews months later, which generated lengthier responses, some quotes are from interviews rather than surveys.
Percent of respondents mentioning activities or mindsets they generally value or do not value in The Natural Step; n = 48. Error bars represent 95% confidence intervals.
Percent of respondents mentioning anything driving sustainability or innovation in The Natural Step n = 48. Error bars represent 95% confidence intervals.

Qualitative categories of reasons for valuing or criticizing components of The Natural Step, with supporting quotes

Quotes are from surveys except [PWI] = postworkshop interview or [FUI] = follow-up interview.
Figure 2 shows that Backcasting was valued most often (p = 0.003 compared to the average of other activities and mindsets). All other components in Figure 2 were valued by similar percentages of people, but for different reasons (see qualitative results below). Postworkshop and follow-up interviews supported these findings.
Figure 3 shows that Creative Solutions (an ideation activity) scored highly for innovation, but not statistically significantly more than the goal-setting activity Awareness/Vision. See reasons why in Table 3. Similarly, while the goal-setting of Awareness/Vision and Four System Conditions were highly valued for sustainability, they were not statistically significantly more so than Creative Solutions ideation; indeed, all components were similarly valued for sustainability.
Comparing Figure 3 to Figure 2 shows that rates of general value are similar to the greater of the rates of perceived sustainability or innovation value; this means neither sustainability nor innovation was clearly valued more, but if an activity or mindset was highly valued for either, it was highly valued generally. However, Backcasting was valued overall far more than its sustainability or innovation value; this is likely because it was mentioned as connecting all four activities into a strategic whole (see Table 3).
6.1.2. Whole System Mapping
Figures 4 and 5 show quantitative results for overall value and sustainability or innovation value of components in Whole System Mapping. Table 4 shows qualitative reasons for these values, with illustrative quotes. Note that Prioritized Design Spec was always called just ‘Priorities’ by participants, so text from here forward matches this. Also, respondents sometimes mentioned the Brainstorm on System Map activity as two different activities, based on the two mindsets ‘Brainstorm All System Nodes’ and ‘Eliminate System Nodes’, despite them happening simultaneously. This illustrated the interplay between mindsets and activities. To accommodate this, the combination of activity and mindsets was recoded as ‘Brainstorm All System’ and ‘Brainstorm to Eliminate’. Figure 4 shows Brainstorm to Eliminate being mentioned much less for two reasons: First, because mentions of Brainstorm on System Map, Brainstorm All System Nodes, and general brainstorming were often difficult to distinguish from each other textually; second, because it was not counted in mentions of valuing ‘all’ activities, but only mentions of it specifically.
Percent of respondents mentioning activities or mindsets they generally value or do not value in Whole System Mapping; n = 96. Priorities, Prioritized Design Spec. ‘Brainstorm All System’ is the Brainstorm on System Map activity with the Brainstorm All System Nodes mindset. ‘Brainstorm to Eliminate’ is the Brainstorm on System Map activity with the Eliminate System Nodes mindset. Error bars represent 95% confidence intervals.

Percent of respondents mentioning anything driving sustainability or innovation in Whole System Mapping; n = 96. Error bars represent 95% confidence intervals.

Qualitative categories of reasons for valuing or criticizing components of Whole System Mapping, with supporting quotes

Quotes are from surveys except [PWI] = post-workshop interview or [FUI] = followup interview.
Figure 4 shows that Draw System Map was the most valued part of the design method, significantly more than the average of other activities and mindsets (p = 0.0001). Some mindsets were seldom mentioned: Sustainability Goals, Business/User Goals, Scoring Ideas by Goals, and Visual Thinking (the latter was mentioned five times, but as a reason for valuing Draw System Map, not for itself). Postworkshop and follow-up interviews supported these findings.
Figure 5 shows that several activities were valued for perceived sustainability; none is a statistically significant favorite. LCA was highly valued for sustainability but not innovation. Draw System Map and Brainstorm All System Nodes were each highly rated for both sustainability and innovation. Comparing Figure 5 with Figure 4 shows that Draw System Map’s overall value is far higher than its sustainability or innovation value, similar to Backcasting. Its primary value may be in uniting other components, or other business benefits (see Table 4).
6.1.3. Biomimicry
Figures 6 and 7 show quantitative results for overall value and sustainability or innovation value of components in Biomimicry. Table 5 shows qualitative reasons for these values, with illustrative quotes. Note the activity Discover Model Strategies Online was always referred to by participants simply as ‘AskNature.org’, so it is referred to as such from here forward. Also, participants frequently mentioned one item not appearing in literature analysis: Examples (describing biomimetic product examples during the workshop’s lecture). See Table 5 for reasons.
Percent of respondents mentioning activities or mindsets they generally value or do not value in Biomimicry; n = 57. ‘Models in Life’, Discover Models in Life; ‘Translate to Buildable’, Translate to Buildable Things. Error bars represent 95% confidence intervals.

Percent of respondents mentioning anything driving sustainability or innovation in Biomimicry; n = 57. ‘Models in Life’, Discover Models in Life; ‘Translate to Buildable’, Translate to Buildable Things. Error bars represent 95% confidence intervals.

Qualitative categories of reasons for valuing or criticizing components of Biomimicry, with supporting quotes

Quotes are from surveys except [PWI] = postworkshop interview or [FUI] = follow-up interview.
Figure 6 shows that the most often valued mindset was Nature as Mentor (p < 0.0001 compared to the average of others), and the most often valued activity was AskNature.org (p = 0.03). These are intertwined, as AskNature.org physically enacts Nature as Mentor (and Nature as Model), as does Discover Models in Life. Note that these and the qualitative responses caused AskNature.org to be reclassified from a research-only activity to a research and ideation activity. Some activities and mindsets were seldom mentioned: Learn Life Model Strategies, Nature as Measure, and Nature as Model. Postworkshop and follow-up interviews supported these findings.
Figure 7 shows AskNature.org was the most highly rated for innovation of any activity or mindset in any of the three design methods (p = 0.0006 compared to average of all acomponents of all methods). No activities or mindsets scored highly for sustainability; Nature’s Principles may have scored highest, but not statistically significantly so.
6.2. Results by activity type
To determine if entire categories of design activity were similarly valued regardless of what design method the activities come from, as hypothesized in H1B, results from activities in all three design methods were combined by type (see Figure 1). To summarize which activities comprise which categories, see Table 6; for results, see Figure 8.
Categories of design activities in each design method

Percentage of respondents mentioning different types of activities or mindsets from all three design methods: valued or not valued overall, and valued for sustainability or innovation. Note: there were no Build activities in any of the three design methods.

Figure 8 shows that there may be differences in overall value; analysis and communication were mentioned more often than the average of others (p = 0.005), but qualitative comments did not clearly explain this. It may be a statistical artifact, or it may be due to business benefits described in the qualitative results tables. For perceived sustainability value, analysis and goal-setting were not more highly valued than the average of all activity types; indeed, there was no significant winner for perceived sustainability value. For perceived innovation value, research activities were more valued than the average of the others (p = 0.017), due to the high value of AskNature.org. However, ideation activities were not significantly more valued for innovation than average. As noted earlier, none of these methods had ‘Build’ activities; the graph includes it simply because it is an important stage of product development, which designers must address with activities outside of these methods.
6.3. Results by demographics
As mentioned in Section 5, demographic divisions were by job role (designer, engineer, manager/executive and sustainability specialist), company type (manufacturer, product development consultancy), company size (under or over 100 employees), industry sector (consumer electronics, furniture, apparel and other) and gender (female and male). Of the 172 qualified participants, some data was incomplete, as 25% of participants did not answer demographic questions for privacy, so numbers of demographic subdivisions did not add to 100% of participants.
There were almost no statistically-significant differences in how different demographics perceived the value of design activities, mindsets, or whole design methods. The one significant difference with both quantitative and qualitative evidence was that fewer engineers valued Biomimicry for sustainability, compared to designers, managers/executives and sustainability professionals, as shown in Figure 9.
Percent of respondents mentioning anything driving sustainability in all three design methods. Dsn, Designer; Eng, Engineer; Mgr, Manager; Sust, Sustainability Specialist. Error bars represent 95% confidence intervals. Grey background bars show 95% confidence intervals for all respondents combined.

This lack of difference was not only by job role, but all demographics analysed. This includes thousands of comparisons, due to the dozens of variables: general value/criticism, sustainability value, and innovation value of all 35 activities and mindsets from all three design methods; and sustainability value and innovation value of the three design methods overall. The thousands of comparisons resulted in some with p values below 0.05, but these were checked against qualitative text analysis and inductive reasoning to test consistency of responses within demographics that might indicate meaningful differences rather than inevitable coincidences from high numbers. No demographic differences in valued activities or mindsets were supported by qualitative analysis. For all 64 graphs of quantitative comparisons, see the doctoral dissertation (Faludi Reference Faludi2017b).
Figure 9 shows fewer engineers mentioning sustainability value in Biomimicry than other job roles (p = 0.01). The statistical significance was confirmed qualitatively by quotes from three engineers. For example: ‘I do not agree that biomimicry should be in as part of the sustainability discussion. …if I mimic something, but man it’s destroyed the environment cause I’ve got to do this chemical process to get those little gecko foot pads. …For me as an engineer, biomimicry is probably the most interesting one just from a mechanism point of view, or new materials, or new processes point of view’. However, engineers did still value Biomimicry overall, and for innovation. This same difference (valuing Biomimicry less for sustainability but highly for innovation and overall) was also found to a lesser degree in Consultancies (versus Manufacturers) and Small companies (versus Large companies), but this was due to the preponderance of engineers in the consultancies, which were also predominantly the small companies, in this study.
7. Discussion
Results above showed some hypotheses supported and some unsupported. Most of H1 was supported: Some components of design methods were valued more than others, and valued for different reasons. H1A was entirely supported: Each design method had some component(s) much more valued than others, the most overall valued being Backcasting from The Natural Step, Draw System Map from Whole System Mapping and Nature as Mentor or AskNature.org from Biomimicry. Some seldom-mentioned activities or mindsets may be expendable, or may be so intertwined with others (such as Whole System Mapping’s Sustainability Goals being conflated with its Priorities activity) that they were indistinguishable to participants.
Interestingly, all of these top-rated components were valued for reasons other than (or in addition to) sustainability – either for innovation or other business benefits. For example, Backcasting was valued for innovation and business value. AskNature.org was the most valued activity for innovation in any of the three design methods, even said to have marketing value for consultancies. Draw System Map was used after workshops to facilitate brainstorms cutting cost and time. Such benefits are clearly important to build the business case for sustainable design practices. However, we must not let such benefits dilute sustainability improvements.
Also supporting H1A, some components were more criticized and respondents mentioned potentially using highly-valued components without others. For example, using Backcasting without the Four System Conditions: ‘It’s a good method for brainstorming independent of sustainability’. LCA was perhaps the most criticized, both in its easier and more thorough versions, as Table 4 showed. Participants in 4-hour workshops performing (simplistic) estimated LCAs sometimes called it too difficult or time-consuming, while participants in 2-hour workshops, not performing LCAs but using precalculated graphs for common product categories, sometimes called it too generic to be applicable. Indeed, teaching LCA must always balance the level of detail required for meaningful LCA results, without overburdening participants with technical details. Even so, many more participants praised LCA than criticized it (p = 0.002).
It may, however, be difficult to use highly valued activities or mindsets without some less-valued ones. There was much interaction between components, and both highly valued and less-valued components were often valued for strengthening others. For example, in The Natural Step, Awareness/Vision goals and Baseline analyses were valued for focusing thought in Creative Solutions ideation (‘I think more than any, the Baseline work would guide this because it allows you to really focus on where the product currently is. Without that, the concepts would be too scattered’). One respondent even suggested improving the design method through deeper connection (‘The Concepts section felt innovative, but more so if we had time to iterate back and forth between that and the Awareness section, which was not possible today’.) Similarly, in Whole System Mapping, Draw System Map analysis was valued for focusing thought in Brainstorm on System Map ideation. In Biomimicry, Translate to Buildable made AskNature.org ideations more practically viable.
H1B had mixed, inconclusive support: results by activity type showed that perceived sustainability value was not always higher in Analysis and Goal-Setting activities, while innovation value was not always higher in Ideation activities, though it was highest in the combined Research and Ideation activity (AskNature.org). Sometimes Analysis activities were valued for innovation because of their influence on later ideation activities (‘thinking of big picture awareness first led us to come up with different specifics and paths than we would have otherwise’). Surprisingly, ideation activities were often valued as much for sustainability as analysis or goal-setting activities whose entire purpose is sustainability, because these are where implementable solutions are proposed (‘the real meat of the value to what can I apply to future designs? What is the most tangible thing I can do’). This reinforces the degree of interconnection between some activities and mindsets. However, AskNature.org had no dependencies mentioned, so activities can provide high innovation value when used alone.
H1C was supported: Highly valued components of the different methods were valued for complementary reasons, with Backcasting uniquely valued for focusing thought towards a desired outcome, Draw System Map uniquely valued for broadening scope to the whole system and for collaboration, and AskNature.org uniquely valued for its new lens of biological mentors and for being inspiring. These unique values suggest that a design team could benefit from mixing parts of the three design methods. Even activities and mindsets that were not the most popular still had unique value. The Four System Conditions was uniquely valued for including social, not just environmental, sustainability. LCA was valued for its quantitative environmental impact comparisons. Define Problem Biologically was noted as a form of functional decomposition (Kusiak & Larson Reference Kusiak and Larson1995). Even such less-valued components from one design method might greatly multiply the value of components in another design method, such as LCA improving sustainability value of Biomimicry by rating new ideas.
Methodologically, using free-text surveys rather than multiple choice showed that practitioners sometimes understand design methods differently than their creators, for example distinguishing one activity as two when it involved two different mindsets (Whole System Mapping’s ‘Brainstorm All System’ and ‘Brainstorm To Eliminate’), or identifying explanatory examples as a mindset with as much value as some workshop activities (in Biomimicry). This further supports the hypothesis that some design activities might be strengthened by hybridizing them with new mindsets. Further research should investigate such recombination of practices.
The second main hypothesis, that theory accurately predicts what professionals value, was only half-supported at best, showing theory alone is not enough to predict value in industry. H2A was less than half-supported: The Four System Conditions were not the most valued component of The Natural Step, nor were they most highly valued for sustainability. Backcasting was by far the most highly valued, but theory correctly predicted it being valued for strategic planning.
H2B was more than half-supported: The most valued component of Whole System Mapping was indeed the Draw System Map activity, and it was mostly valued for systems thinking; however, it was also valued for collaboration, which theory did not predict and might drive adoption in companies more than its perceived sustainability value. LCA was not as highly valued as theory predicted, due to frustrations with its difficulty or imprecision or both. It was highly valued for sustainability, but not remarkably more than other activities or mindsets, as predicted. This implies that the Whole System Mapping method might benefit from other metrics or goal-setting from other design methods, such as eco-label certification checklists.
H2C was less than half-supported: Nature as Mentor was tied for the most valued component, but AskNature.org was similarly valued, and while the latter was extremely highly valued for innovation, nothing in Biomimicry was highly valued for sustainability. Also, Nature’s Principles were not particularly highly valued, and were just valued moderately for sustainability and innovation.
Finally, H2D was unsupported: different demographics did not value design methods differently in most ways. The Natural Step was not more valued by managers than designers or engineers, despite being valued strongly for strategic planning. Biomimicry was not more valued by designers and engineers, despite being valued primarily for innovation. The one demographic difference was Biomimicry being less valued for sustainability by engineers, which was surprising, given the reverence for nature implicit in Biomimicry’s paradigm. However, engineers felt that sustainability requires more concrete targets or metrics than it provided. They still valued it highly for innovation. Whole System Mapping was similarly valued by all three job types, as predicted, but because the other two design methods were also, this is not considered a meaningful result.
The lack of significant demographic differences may be because the demographic splits most anticipated to produce differences (Job Role and Industry Sector) were also splits between several subgroups, thus dividing the total participant pool into small demographic groups (average n = 20, sometimes as low as n = 1 for certain demographics in some workshops). These small sample sizes made statistical significance less likely. However, the Manufacturer versus Consultancy split resulted in reasonable sample sizes (average n = 38), as did Male versus Female (average n = 29), and they produced no statistically significant results.
Note that despite the lack of reported value difference, some business strategy benefits might not be actionable for design consultancies or teams with limited scope. As one followup interviewee stated, ‘I think it’s quite interesting if you think of holistic impact, like what are the systems we can skip [Brainstorm to Eliminate], but it comes back to my role as a designer… I would never do any calls, come up with any ideas for that. I think that would be at a little bit of a higher level of advancement in the company’.
The overall lack of differences by demographics is actually a positive outcome, convenient for those teaching sustainable design. It means that overall, different job roles or other demographics need not learn different design methods, and these design methods need not be modified for the different demographics tested.
8. Limitations and future work
This study had several limitations, which could affect results and suggest future research: Workshops were voluntary, so respondents only participated in design methods they were interested in; this may introduce selection bias, as mentioned in Section 5. Timing in the product development process was not controlled, since real projects were used and professionals’ schedules were constrained; this may have made different design practices more or less relevant to teams than they would be at other times. The large number of workshops performed for different companies was an attempt to minimize the influence of this variable. Workshops were performed in different orders at different companies to attempt to eliminate ordering effects, but there was not a large enough sample size of combinations for this to be truly eliminated. Sample size, while large by the standards of design method case studies, was still small for statistical analysis, and was confined to participants in the San Francisco bay area, California; Grand Rapids, Michigan; and attendees of the 2016 U.S. SustainableBrands conference (largely U.S. companies).
Sustainability and innovation value were both measured by self-reporting, because assessing them for the early-stage ideas in the workshops was deemed too subjective and too highly uncertain, but self-assessments may contain biases or inaccuracies. Future studies could attempt to objectively quantify these factors. Value was not measured by enthusiasm of mentions, only by the number of participants mentioning an item; this was done to avoid vocal minorities, but might skew results to favour items merely acceptable to more practitioners rather than the best for a subset of them. Workshops are not necessarily a direct reflection of what would occur in situ in companies, especially over the long term. Finally, this study did not test how well highly valued activities or mindsets can be used alone, or in recombination with those from other design methods.
Future studies overcoming any or all of these limitations would be valuable. Most importantly, future research should use this study’s results of most-valued components in different design methods and attempt to recombine them into improved hybrid design methods, then test those new methods in industry, just as human centred design user-tests prototypes and recombines features among them.
9. Conclusions
Because theory was only half-right at best in predicting which components of these sustainable design methods were valued by professionals, and why, the field should rely less on theory and more on empirical testing of sustainable design methods. However, the fact that different job roles did not prefer different design methods means that any of these methods could be taught fairly universally, for easier integration into company processes. In any case, testing sustainable design methods with companies is beneficial in itself, as it makes industry designers, engineers, and managers consider environmental and social implications of their products more than they otherwise would.
More important, it was useful to analyse design methods not as unified tunnels of process, but as toolboxes containing components that could be mixed and matched across methods. Professional practitioners were legitimized in mixing components of methods, because theory successfully predicted that each design method would have some activity or mindset valued far more than the rest, and predicted that they would be valued for different reasons, complementary to each other. This invites hybridization. As one of the designers said, ‘formal design methods are like musical scales; real design practice is jazz’.
Some design activities or mindsets may stumble without others that they depend on in their design method, but others may enhance the activities or mindsets of other design methods. Future research should use human centred design principles, treating design methods as prototypes to user test and recombine features from, to find more optimal combinations and see how they vary for different circumstances. Future research should also test sustainable design practices crafted not as unified methods but as collections of independent tools.
Empirically testing what practitioners value in sustainable design methods can help them improve design practices. Designers, engineers, and managers in different industries and company types can use these results to mindfully choose design activities and mindsets to maximize sustainability value, innovation value and other design process value. Finding more effective and inspiring sustainable design practices in this way can make them not just responsible choices, but even desired by design teams.
Financial support
This work was partially supported by National Science Foundation Integrative Graduate Education and Research Traineeship grant #1144885.
Acknowledgements
The authors thank many industry participants, especially those organizing teams, and thanks to SustainableBrands and Singularity University for helping organize two of the workshops.
Appendix A. Survey Questions
Note: questions marked with an asterisk (*) were not used in this paper’s results. For results pertaining to them, see Faludi (Reference Faludi2017b).
A.1. Pre-survey questions full text
1. In your practice, what design methods, activities, or mindsets do you get the most value from? Why?*
2. How do you measure the innovativeness of your design ideas?*
3. In your experience, what effect does sustainability usually have on design? (Check all that apply)*
3.1. Increases legal risk
3.2. Decreases legal risk
3.3. Increases design process cost
3.4. Decreases design process cost
3.5. Increases final product cost
3.6. Decreases final product cost
3.7. Restricts creativity
3.8. Enhances creativity
3.9. Increases your motivation
3.10. Decreases your motivation
3.11. Eases manufacturing
3.12. Complicates manufacturing
3.13. Increases product quality
3.14. Decreases product quality
3.15. Increases product marketability
3.16. Decreases product marketability
3.17. Other: ____________
4. What is your job role?
5. What is your gender?
A.2. Post-survey questions full text
1. Which design workshop are you giving feedback for? (Mark only one.)
1.1. The Natural Step
1.2. Biomimicry
1.3. Whole System Mapping
2. In your opinion, what activities or mindsets from the design method were most useful? (If none, say none.)
3. In your opinion, what activities or mindsets were not valuable, or not valuable enough to be worth your time? (If none, say none.)
4. In your opinion, which of the design method’s activities or mindsets gave you innovative ideas? (If none, say none.)
5. In your opinion, which of the design method’s activities or mindsets improved product sustainability? (If none, say none.)
6. In your opinion, did anything in the design method provide any other value, not related to innovation or sustainability? If so, when or how?
7. How do you think this design method, or the ideas you got from it, will affect your product design? (Check all that apply)*
7.1. Increases legal risk
7.2. Decreases legal risk
7.3. Increases design process cost
7.4. Decreases design process cost
7.5. Increases final product cost
7.6. Decreases final product cost
7.7. Restricts creativity
7.8. Enhances creativity
7.9. Increases your motivation
7.10. Decreases your motivation
7.11. Eases manufacturing
7.12. Complicates manufacturing
7.13. Increases product quality
7.14. Decreases product quality
7.15. Increases product marketability
7.16. Decreases product marketability
7.17. Other: ____________
8. Would you recommend this workshop to others? If so, what would you say?
9. Anything else you would like to say?


 Open access