

Introduction
Mass balance of temperate glaciers is very sensitive to variations in local meteorology. To assess the physical processes governing the melt of such glaciers, a better understanding of the relations between the prevailing local meteorological conditions and glacier mass balance is necessary (e.g. Reference Klok, Nolan and van den BroekeKuhn, 1981; Reference Levallois and KovalevskyOerlemans, 2001). A number of energy-balance studies have already been performed on mountain glaciers over several months and in a few cases over several years. A review of these surface energy-balance experiments and processes was presented, for example, by Reference HockHock (2005).
The topic of this work is the relationship between meteorological variables and the snow/ice ablation on Glacier de Saint-Sorlin, French Alps, during two very contrasting months in 2006 (July and August). For this purpose, radiative surface energy fluxes have been measured and turbulent fluxes calculated with a high temporal resolution (half-hourly means). Atmospheric and surface controls on mass balance were established with this complete set of measurements, especially the role of local surface albedo. Energy-balance modelling and temperature-index methods were used to simulate mass balance during these two months. This paper aims to compare the performance of the two methods and explains the importance of space and time surface aspect variations in both calculations.
Location and Experimental Set-up
Glacier de Saint-Sorlin is located in the western part of the French Alps (Grandes Rousses massif; 45° N, 6° E), covering a ![]() area (Fig. 1). The annual mass balance of the glacier has been monitored since 1957. All data are available in Reference Haeberli, Zemp, Frauenfelder, Hoelzle and A.Haeberli and others (2005) and at http://www-lgge.obs.ujf-grenoble.fr/ServiceObs/index.htm.
area (Fig. 1). The annual mass balance of the glacier has been monitored since 1957. All data are available in Reference Haeberli, Zemp, Frauenfelder, Hoelzle and A.Haeberli and others (2005) and at http://www-lgge.obs.ujf-grenoble.fr/ServiceObs/index.htm.
Map of Glacier Saint-Sorlin (45° N, 6° E), established from aerial pictures taken in 2003. The positions of the station AWSg, ablation stake number 10, Col des Quirlies and Etendard peak are indicated.

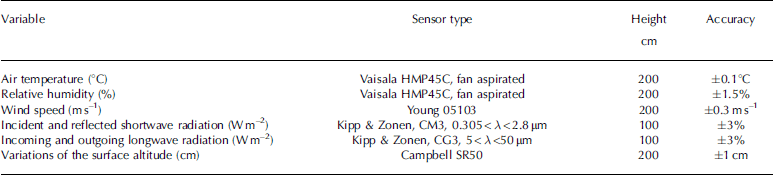
Meteorological experiments were carried out in the ablation zone from 9 July to 28 August 2006. A portable automatic weather station, fixed in the ice, was set up at an elevation of 2760 m in the middle of the zone near ablation stake number 10 (Fig. 1). The station (named AWSg in this paper) recorded wind speed u, air temperature T, relative humidity RH, incident (SWin) and reflected (SWref) shortwave radiation, and incoming (LWin) and outgoing (LWout) long-wave radiation at half-hourly steps. Surface height variations were recorded using a sonic ranger (ice density fixed at 900 kgm–3 and mean snow density fixed at 400 kgm–3 according to measurements in the field). This sonic ranger was set up ∽10m away from AWSg. Table 1 lists the sensors and their characteristics. In addition to this meteorological experiment, pictures of the glacier were taken with a digital camera from AWSg (Fig. 1) three times a day, in order to assess the evolution of the surface (snow or ice), the days of snow precipitation and the degree of cloud cover.
List of the sensors and their characteristics at AWSg. The heights were registered each time instruments were visited and adjusted to the heights given in the table
Atmospheric Conditions During The Summer 2006 Measurement Period
The mean daily cycles of July (J06 hereafter) and August 2006 (A06 hereafter), from midnight to midnight local time, of each meteorological parameter are presented in Figure 2. Mean values and standard deviations over the entire measurement period and over the two months are summarized in Table 2. As can be seen, the weather characteristics showed strong differences between J06 and A06.
Mean daily cycle from midnight to midnight (local time) at AWSg, from 9 to 31 July and from 1 to 28 August, for (a) air temperature (T (°C)); (b) relative humidity (RH (%)); (c) wind speed (u (m s–1)); (d) incident shortwave radiation (SWin (Wm–2)); (e) reflected shortwave radiation (SWref (Wm–2)); (f) incoming longwave radiation (LWin (Wm–2)); and (g) outgoing longwave radiation (LWout (Wm–2)).

Means and standard deviations for meteorological variables recorded at AWSg for 9–31 July and 1–28 August, and the mean over both months. Cloudiness values (in tenths) were given by the climatic model SAFRAN (Météo France, personal communication from Y. Durand). Daily albedo is SWin mean daily value divided by SWref mean daily value from 0900 to 1800 h
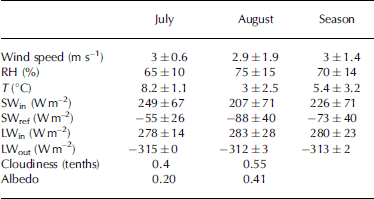
The mean J06 temperature was higher than A06 (8.2 vs 3°C). Indeed, July 2006 was the warmest July since 1950, and August 2006 the coldest August since 1979 (Météo France measurements). Though daily variability was small in J06 (1.1°C), mean daily temperatures in A06 varied significantly, with, for example, a difference of 9°C between 14 and 24 August.
The mean wind speed was similar for both months (2.9 and 3ms–1 in J06 and A06, respectively), although the standard deviation was three times higher in A06 than J06. This higher variability can be explained by the variations in wind direction. On Saint-Sorlin, winds clearly tended to blow in two directions, which differed in July and August: mainly south-southwest in July (the wind came down the glacier’s slope from Col des Quirlies and Etendard peak 55% of the time, only 15% from the north) and less clearly defined in August (from the north, coming up from the valley, and from the south (Fig. 1)). No daily wind cycle is visible in Figure 2.
July was mostly sunny and the mean SWin was high (249Wm–2). In August the mean value was only 207Wm–2. Our data showed that the difference in SWin between J06 and A06 was higher in the morning (mean of 120Wm–2) than in the afternoon (70Wm–2), indicating that clouds preferentially appeared in the afternoon in J06.
SWref increased by 33 Wm–2 between J06 and A06, due to the presence of occasional fresh snow on the glacier surface. Digital pictures showed that no snowfall was observed from 9 to 31 July (relatively clean ice at the beginning of the month, moving to dirty ice). In August the glacier was snow-covered during 11 days. Mean albedo values were 0.20 in J06 and 0.41 in A06 (mean daily albedo was calculated as the mean daily value of SWref divided by the mean daily value of SWin from 0900 to 1800 h).
Mean LWin was similar in J06 and A06, with respective values of 278 and 283Wm–2: July was warmer (increasing LWin) and August more cloudy (also increasing LWin). Due to more variable weather, standard deviation was twice as high in A06 as in J06: variations close to 80Wm–2 were observed from day to day over A06 (not shown). In J06, LWin was lower during clear nights and increased with air temperature, humidity and cloudiness during the daytime.
The diurnal cycle of LWout showed that in A06, negative surface temperatures were observed in the morning and early in the evening (melt started around 1200 and ceased around 1800 h), while in J06, melt started around 0900h and continued throughout the day.
Calculating Snow and Ice Ablation
Two different approaches were used to calculate ablation at AWSg: one using a simple temperature-index method, the other involving a more physically based method using the energy-balance model.
Temperature-index method
As air temperature is generally the most widely available variable over a large area, temperature-index methods have often been used for estimating snow- and ice melt, even though they do not describe all the physical processes involved in melting (e.g. Reference BraithwaiteBraithwaite, 1995; Reference HockHock, 2003). This method assumes a linear relation between melt and positive air temperature (Reference HockHock, 1999):
DDFsnowface is the degree-day factor (mm d–1 °C–1), which differs for snow and ice, T is the air temperature on the glacier and n is the number of steps per day (n = 48; half-hourly values). A review of DDF for snow and ice at different locations is given by Reference Braithwaite and ZhangBraithwaite and Zhang 2000, (table 4) and Reference HockHock (2003). We adjusted DDFice to the observed melt for 21–31 July, which were sunny days, with no new snowfall occurring on the glacier and the surface always in ice. The best DDFice was thus found to be equal to 6.4mmd–1 °C–1. Validation was carried out between 9 and 20 July, and the total calculated melt was 64 cmw.e. compared to 57cmw.e. measured by the sonic height ranger. Reference PatersonVincent and Vallon (1997) found DDFice equal to 6.2 mmd–1 °C–1 on Glacier de Sarennes, 5 km from Saint-Sorlin. For snow conditions, DDFsnow was calibrated on the first period with snow cover (4–9 August) and gave a value of 4 mmd–1 °C–1. Vincent and Vallon found 3.8 mmd–1 °C–1 on Sarennes. Reference HockHock (1999) and Reference De QuervainDe Quervain (1979) used 4.4mmd–1°C–1 on Storglaciaren, Sweden, and at Weissfluhjoch, Switzerland, respectively.
Energy-balance calculation
The surface energy-balance equation for a temperate glacier is written as (Reference MartinOke, 1987)
Energy fluxes directed towards the surface are defined as positive. R is the net all-wave radiation, and H and LE are the turbulent sensible and latent heat fluxes, respectively. The heat advected by precipitation P can be neglected (Reference OerlemansPaterson, 1994). The total energy available in the volume is Q. The variation of Q is used in the melting process. In steady melting conditions, Q can thus be converted into the melting rate M (mmw.e. s–1 or kgm–2 s–1). Occasional snowfalls on the glacier were taken into account in our calculations (Météo France data, snow density fixed at 400 kgm–3).
Net all-wave radiation R at the surface is the sum of incident (SWin) and reflected (SWref) shortwave radiation and incoming (LWin) and outgoing (LWout) longwave radiation:
where α is the albedo of the snow or ice surface. An uncertainty was found in the effects of slope and orientation of the surface on solar radiation income on the sensor. Corrections on shortwave radiation were then made using the complete formulation detailed in Reference FavierFavier (2004), based on Reference BarryBarry (1992) and adapted by Reference Grenfell, Warren and MullenGrenfell and others (1994) for small slope angles. Even if the slope was low around AWSg (∽5°), our calculations showed that in August (for which corrections on the southwest were higher due to the lower position of the sun), the corrected mass balance calculated with the energy balance was reduced by 10% (<2% in July).
The turbulent fluxes H and LE were calculated using the bulk aerodynamic approach, including stability correction (e.g. Reference BrutsaertBrutsaert, 1982; Reference Sicart, Wagnon and RibsteinWagnon and others, 2001). This method is commonly used for practical reasons because it allows the turbulent heat fluxes to be estimated from only one level of measurement (Reference Arck and D.Arck and Scherer, 2002).
Results
Measured and computed summer mass balance
Computed mass balance with the temperature-index method and the energy-balance calculation was compared to the measurements of the sonic ranger and of the stake number 10 (Fig. 3). Mass balance in J06 was more than twice that in A06.
Total mass balance from 9 July to 28 August 2006 at AWSg calculated with a degree-day method, with a complete energy balance (SEB in the legend), with an energy balance without turbulent fluxes, and compared to the measured value at the sonic ranger and at stake number 10. Uncertainties affecting the overall energy-balance calculation are shown at the end of July and at the end of the period. Mean daily albedo (0900–1800 h) is reported on the right axis.

In J06, degree-day and energy-balance calculations were in very good agreement with measurements: a total of 1.16 mw.e. was measured with the sonic ranger, 1.23 mw.e. was calculated with the degree-day model and 1.17mw.e. was calculated with the surface energy balance (+6% and < +1%, respectively). The contribution of the turbulent fluxes of J06 was 21%, explaining 0.24 mw.e. of the mass balance, and consequently cannot be neglected (calculation only based on radiation).
In A06,mass-balance calculations were less reliable. The total mass balance measured was 0.45 mw.e.; 0.52 mw.e. was calculated with the degree-day model and 0.61 mw.e. with the surface energy balance (+15% and +36%, respectively). Without corrections on radiation, the mass balance should have been 0.67mw.e. with the energy-balance method. These values and Figure 3 show that if total mass balance calculated with the degree-day method was close to the observed value at the end of August, day after day calculated mass balance differed from that observed, especially after 15 August. There were also quite large discrepancies between the energy-balance method and observations, especially after 20 August. The sonic ranger did not record melt after this date (and recorded negative mass balance after 25 August, meaning accumulation), whereas the degree-day and energy-balance methods continued to calculate melt. Globally, the contribution of the turbulent fluxes of A06 was 16%, explaining 0.07 mw.e. of the mass balance.
The contribution of turbulent fluxes to the melt was thus high for the two months. The mass-balance difference observed between July and August can be attributed not only to a different ratio of the radiative and turbulent fluxes in the energy budget but to a variation in these fluxes.
Meteorological controls on snow and ice ablation on Saint-Sorlin
Table 3 summarizes monthly means for each energy-budget term. Differences between J06 and A06 are given in the last column of the table. The mass-balance difference observed between the two periods can be attributed to the computed energy available for melting (R +H+LE) divided by almost 2 between J06 and A06: +198Wm–2 in July compared with only +107Wm–2 in August (–91Wm–2, –46%), explained
Mean monthly values of the four radiative fluxes (SWin, SWref, LWin, LWout) and their sums (SWnet, LWnet and R) and the two turbulent fluxes (H and LE) at AWSg during 9–31 July and during 1–28 August (Wm–2). The percentage of net radiation and turbulent fluxes in the global energy available for melting is given in parentheses. The last column gives the variations of each flux from July to August
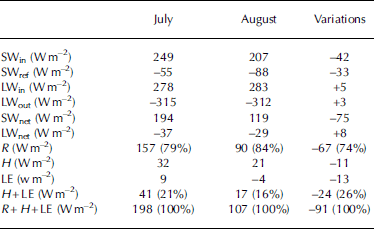
by the decrease of R (–67Wm–2, meaning 74% of the decrease of R +H+ LE) and by the decrease of turbulent fluxes (–24Wm–2, 26%).
The decrease of R was mostly due to a decrease of SWnet (–75Wm–2). The longwave radiation changes, LWnet, are negligible. The decrease of SWnet was firstly due to the decrease in SWin from 249Wm–2 to 207Wm–2 (–42Wm–2, 17%). This decrease is partly explained by the lower position of the sun in August: according to our calculation based on Reference KuhnLevallois and Kovalevsky (1969) and using a digital elevation model of the glacier from 2003, the potential insulation at noon at the top of the atmosphere is reduced by 12% (–30Wm–2) between 9 July and 28 August. This decrease of SWin was also due to greater cloud cover in A06, 0.4 (in tenths) in J06 against 0.55 in A06. Data are from Météo France (personal communication from Y. Durand), representing –12Wm–2 (–5%). Thus 56% of the change of SWnet was due to lower position of the sun and cloud cover. Secondly, the mean albedo has been multiplied by two in August due to snowfalls (0.20–0.41): 44% of the change of SWnet was thus controlled by surface albedo changes.
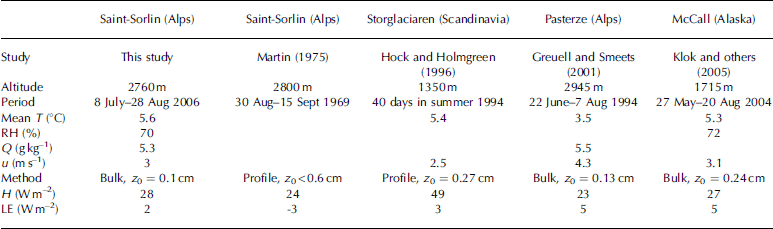
The turbulent fluxes decreased by 24Wm–2, and H decreased by 11Wm–2. In July, the air coming down the glacier slope and the temperature gradient resulted in a significant energy contribution at the surface (higher H values). LE varied from +9Wm–2 in J06 (0.30mmd–1 of water condensation) to –4Wm–2 in A06 (<0.12mmw.e. d–1 of sublimation). H and LE values on Saint-Sorlin were similar to those of other studies, especially that by Reference Greuell and SmeetsGreuell and Smeets (2001) carried out in the Austrian Alps, more or less at the same altitude as on Saint-Sorlin (Table 4).
Turbulent fluxes H and LE compared to different studies. T is the mean air temperature (°C), RH the relative humidity (%), q the specific humidity (g kg–1), u the mean wind speed (m s–1) and z 0 the roughness parameter (cm)
Discussion
Accuracy of field measurements and calculations
In the overall energy budget (Equations (2) and (3)), four fluxes were directly measured (SWin, SWref, LWin, LWout) and two fluxes were calculated (H and LE). Due to the sensor’s accuracy, uncertainty in mass balance without turbulent fluxes was estimated at ±0.04mw.e. for J06 and ±0.02mw.e for A06.
H and LE were calculated using a bulk aerodynamic method. In addition to uncertainties affecting temperature, relative humidity and wind-speed sensors, their calculation itself could be a source of uncertainty. In particular, the choice of the roughness lengths z 0 was critical. A summary of different z 0 values was reported by Reference BraithwaiteBraithwaite (1995), and values were highly dependent on local conditions. In our study, z 0 was not based on observations but various tests were realized and we finally kept z 0 = 0.1 cm for the best adjustment of calculated and observed monthly mass balance. z 0 was taken constant for July and August. With z 0 = 0.5 cm, H increased by 62% in July and by 64% in August. As mentioned by Reference OkeSicart and others (2005), the uncertainty in surface roughness and the inappropriate level of measurements relative to the maximum glacier wind speed were a major source of error when calculating H and LE. In this study, the accuracy on H and LE was not better than ±20%.
Adding up all the uncertainties (20% on H and LE and the sensors’ accuracy on the radiative budget), mass-balance uncertainty for J06 was ±10cmw.e., and for A06 was ±12cmw.e. Overall mass balance calculated with the energy-balance method at the end of the season was 1.78±0.22mw.e., whereas 1.61 mw.e. was observed. Calculations and observations were in the same range. Uncertainties in the degree-day method were calculated using the sensors’ accuracy on temperature. At the end of August, a total of ±0.06mw.e. can be attributed to the error on temperature.
Role of turbulent fluxes and surface aspect
This study showed that the two methods (degree-day and energy-balance) were in agreement with the observed mass balance until approximately 15 and 20 August, respectively. The difference between observations and degree-day calculations can be attributed to the role of the turbulent fluxes which played an important part in the melt (e.g. between 15 and 20 August). Although the sensible heat flux, H, was mainly controlled by air temperature, specific humidity and wind also played an important part in the distribution of temperature and the humidity profile, and consequently in H. This was not included in the simple formulation of the degree-day method. The question is ,why was the degree-day method in agreement until 15 August, whereas radiative and turbulent fluxes controlled the melt? The variation of the total energy budget R + H + LE between J06 and A06 (–91Wm–2) is mostly explained by a –42Wm–2 change of SWin due to cloud-cover difference and lower position of the sun, a –24Wm–2 change in turbulent fluxes and a –33Wm–2 change in SWref. Indeed, if the shortwave radiation SWin had been equal in July and August, then the surface albedo change would have explained 50Wm–2 of the R +H+LE variations. This value was attenuated by summer variations of SWin and then reduced to –33Wm–2. The melt was thus mainly controlled by variations in radiative factors, but correlation between temperature and radiation was still poor: R 2˙ = 0.32 in J06 and 0.12 in A06 between air temperature and SWin. The reconstructed melting from the degree-day method is thus strongly related to the ablation measurements only because the temperature-index model includes the air-temperature and the albedo changes via the DDFs.
The difference of 17cmw.e. between observations and energy-balance results at the end of August cannot be attributed solely to condensation because the latent heat flux should rise 400Wm–2 for 1 cm of condensation on the daily mean. The difference between the energy-balance method and observations can be explained by the sonic ranger and the radiometer, >10m apart, not being focused exactly on the same area of ground. Considering the height of both instruments, the radiometer received 90% of the energy in a 3 m diameter circle, whereas the surface seen by the sonic ranger was only a 40 cm diameter circle. When the fresh snow disappeared, the surface exhibited a mosaic of snow-and ice patches (this was observed during field visits). This could explain the differences occurring around 11 August and after 20 August. In such conditions, SWref could consequently be low for the surface under the radiometer sensor (SWnet, which was a source for the melt, would consequently be high), whereas the melt could be low under the sonic ranger due to a whiter snow surface. After 25 August, the total melt given by the sonic ranger decreased, probably due to small snowfalls not being taken sufficiently into account in our calculation. The total precipitation given by Météo France was very small (5mm of water from 25 to 28 August) and probably not in agreement with the field reality. Snow could be accumulated in holes under the sonic ranger and not under the radiation sensor. This observation highlights the crucial role of local albedo regarding ablation.
The difference of 17cmw.e. between observations and energy-balance results at the end of August cannot be attributed solely to condensation because the latent heat flux should rise 400Wm–2 for 1 cm of condensation on the daily mean. The difference between the energy-balance method and observations can be explained by the sonic ranger and the radiometer, >10m apart, not being focused exactly on the same area of ground. Considering the height of both instruments, the radiometer received 90% of the energy in a 3 m diameter circle, whereas the surface seen by the sonic ranger was only a 40 cm diameter circle. When the fresh snow disappeared, the surface exhibited a mosaic of snow-and ice patches (this was observed during field visits). This could explain the differences occurring around 11 August and after 20 August. In such conditions, SWref could consequently be low for the surface under the radiometer sensor (SWnet, which was a source for the melt, would consequently be high), whereas the melt could be low under the sonic ranger due to a whiter snow surface. After 25 August, the total melt given by the sonic ranger decreased, probably due to small snowfalls not being taken sufficiently into account in our calculation. The total precipitation given by Météo France was very small (5mm of water from 25 to 28 August) and probably not in agreement with the field reality. Snow could be accumulated in holes under the sonic ranger and not under the radiation sensor. This observation highlights the crucial role of local albedo regarding ablation.
Conclusion
On Glacier de Saint-Sorlin, two very contrasting months in summer 2006 have been analyzed in terms of surface energy balance and mass balance. J06, the warmest July month in the French Alps since 1950, exhibited strong ablation. However, in A06, the coldest August month since 1979, the melt was just over half that in J06. This difference in mass balance can be partly explained by a decrease in the turbulent fluxes but mainly by a sharp increase in albedo, which was responsible for an efficient decrease of net shortwave radiation (already lower in A06 than in J06 due to lower position of the sun and an increase in cloud cover). This comparison between the two months showed that albedo was the main parameter governing summer melt in the Saint-Sorlin ablation zone. Since albedo was mainly controlled by snowfall, occasional solid precipitation played a key role in the ablation of alpine glaciers in summer. At daily scale, a temperature-index model including two different degree-day factors for snow and ice was as reliable as an energy-balance model for simulating melting at the glacier surface, especially when meteorological conditions varied little from day to day, such as in J06. The good performance of the degree-day model is explained by the fact that this approach included not only the effects of temperature (mainly on sensible heat flux and little on incident longwave radiation) but also of albedo through the DDFs. Consequently, in order to correctly estimate the melting and the mass balance of alpine glaciers, special care must be taken with albedo parameterization at local scale and at the glacier scale. On Saint-Sorlin, a special device using daily terrestrial pictures of the glacier has been developed to accurately reproduce the spatial albedo variations. Moreover, although less important than radiation fluxes, the turbulent fluxes cannot be neglected in mass-balance simulations and they have to be assessed with a better accuracy using eddy correlation measurements.
Acknowledgements
Glaciological measurements on Saint-Sorlin were developed by the French observatory GLACIOCLIM, supported by Institut National des Sciences de l’Univers (CNRS-INSU). In the framework of a new turbulent-fluxes experiment carried out on the ice surface and supported by Agence National de la Recherche, France, in 2006 (‘Turbulence et Ablation Glaciaire’; principal investigator: J.E. Sicart), the automatic weather station AWSg was set up on the glacier in July and August 2006. We thank Météo France, and especially Y. Durand, for providing SAFRAN data covering summer 2006.


