

Childhood obesity is an important public health issue worldwide and a growing threat to child health( Reference Lazzeri, Panatto and Pammolli 1 ). However, childhood thinness has received relatively less attention and fewer studies have reported the prevalence of thinness. Childhood thinness is an important indicator of malnutrition or eating disorders, which may influence cognitive development and school performance( Reference Rollet, Gray and Previl 2 , Reference Smith, Craig and Raja 3 ). A few studies in the UK( Reference Smith, Craig and Raja 3 ), Australia( Reference O’Dea and Dibley 4 , Reference Martin, Rosenberg and Pratt 5 ), Haiti( Reference Rollet, Gray and Previl 2 ), Mexico( Reference Malina, Pena-Reyes and Bali-Chavez 6 ), Nigeria( Reference Ene-Obong, Ibeanu and Onuoha 7 ), Pakistan( Reference Mushtaq, Gull and Khurshid 8 ) and India( Reference Maiti, Ghosh and Paul 9 ) have examined the issue of underweight or thinness. To our knowledge, one Chinese study has included a thinness outcome. That study in Shandong Province, China, found a double burden of overweight and thinness among children and the overall prevalence of thinness was 9·78 % in boys and 15·07 % in girls( Reference Zhang, Wang and Wang 10 ). However, Shanghai is a mega-city; it is quite different in social conditions, economic development, health policy and historical context compared with Shandong. In view of the lack of data, thinness is worthy of attention for Shanghai children.
The association between thinness and low socio-economic status (SES) has become less pronounced in China over the last few decades( Reference Chen and Shi 11 ). Children in low-SES families are more vulnerable to inadequate nutrition, with a greater intake of higher-energy foods and lower levels of physical activity. It is not common to find childhood obesity and malnutrition issues existing side by side( Reference Motta and Silva 12 ). However, different studies have found positive, negative or no correlations between SES and obesity or thinness in children, thus it is difficult to draw general conclusions( Reference O’Dea, Chiang and Peralta 13 – Reference Navti, Ferrari and Tange 16 ).
Several epidemiological studies have been carried out to assess the prevalence of overweight or obesity among Shanghai children( Reference Li, Shen and Wen 17 – Reference Li, Xu and Yao 22 ), but there are few data about the prevalence of thinness in Chinese children. Here, we conducted a secondary analysis of data collected as part of a large cross-sectional survey of autism spectrum disorder to investigate the prevalence of grade 1, 2 and 3 thinness and the comprehensive distribution of thinness, overweight and obesity among 3–12-year-old children in Shanghai. We also explored whether SES is associated with BMI in children to understand the relationship of SES with thinness better. Such information is of value in formulating effective public health policies for child health.
Materials and methods
Study design and sample
The study was a population, school-based cross-sectional study; it was part of a governmental population survey of autism spectrum disorder. We conducted multistage, stratified cluster random sampling in 3–12-year-old children across Shanghai, China in June 2014. The seventeen districts of Shanghai were stratified into eight urban in the central area and nine suburban districts in suburban areas according to the geographical and social population distribution; people living in urban and suburban districts were defined urban and suburban residents. We randomly chose three urban districts (Yangpu, Xuhui, and Jing’an) and four suburban districts (Minhang, Pudong, Fengxian and Chongming) by a random number generator. Kindergartens and elementary schools were sampled randomly from a list of schools, and the number of students recruited was chosen according to the proportion of students in each selected administrative district to the total sampled districts. In total, 134 of 949 (14·12 %) kindergartens and seventy of 436 (16·06 %) elementary schools were sampled, and 84 075 of 576 621 (14·58 %) children were recruited. Our study used children’s family social environment and growth questionnaires. Unified and trained teachers distributed questionnaires to students, asked students to take the questionnaire home and students’ parents fill in the questionnaire. The teachers collected the completed questionnaires and then returned them to the investigator. Parents offered their child’s information regarding age, sex, weight, height, family income, education levels, etc. in the questionnaire by self-report. Participants with complete weight and height data constituted the final sample.
Family income was collected in nine categories (<10 000, 10 000–30 000, 30 000–50 000, 50 000–100 000, 100 000–150 000, 150 000–200 000, 200 000–300 000, 300 000–500 000 and >500 000 Chinese Yuan); the number of missing values for family income was 1560 (2·15 %). SES was divided into low, middle and high levels according to total family income using cut-offs of 50 000 and 200 000 Chinese Yuan according to the definition of social science( Reference Li 23 , Reference Ye 24 ). Most households comprised three persons, including two adults and one child according to the special Chinese family planning policy. Parental education was also collected, it was divided into three categories of low (illiterate, primary school and junior school), middle (high school, technical school and college) and high (undergraduate, master and doctor). Local residents were defined as those children born in Shanghai; children born in other provinces were considered the migration population.
Data entry and quality control
Data were inputted using EpiData 3·1 (EpiData Association, Odense, Denmark) and a logic error check was applied. We examined the consistency by randomly sampling 15 % of the questionnaires for repeat data entry to ensure inputted data were correct.
BMI was calculated as weight divided by the square of height (kg/m2). The International Obesity Task Force definitions of thinness, overweight and obesity were used according to the centile curves of BMI cut-offs at age 18 years of respectively 18·5, 17·0 and 16·0 kg/m2 for grades 1, 2 and 3 thinness, 25·0 kg/m2 for overweight, 30·0 kg/m2 for obesity and 35·0 kg/m2 for severe obesity( Reference Cole and Lobstein 25 ); these provide age- and sex-specific cut-off points for children aged 2–18 years. Overweight excluded obesity, and obesity excluded severe obesity.
The questionnaires were unified and anonymous and the code for each child was independent and unique. Parents were given notification and information about the investigation at the beginning of the questionnaire, to reduce non-response bias. Teachers participating in the survey underwent training so that they could give detailed instructions for filling, distribution and collection of the questionnaires to reduce bias in the study. The study was approved by the Institutional Review Boards of the Shanghai Municipal Commission of Health and Family Planning.
Statistical analysis
The prevalence of thinness, overweight and obesity was calculated directly and the χ 2 test was performed to compare rates between boys and girls, urban and suburban groups, and low-, middle- and high-SES groups. In single variable logistic regression analysis, the odds ratio and 95 % confidence interval were determined to estimate the relative risk of thinness, overweight and obesity. Two-sided P values <0·05 were considered statistically significant. All analyses were conducted using the statistical software package IBM SPSS Statistics Version 21.
Results
In total 84 075 questionnaires were distributed, of which 81 384 completed questionnaires were returned, a response rate of 96·80 %. Complete data on weight and height were available for 72 349 children, including 38 550 boys and 33 799 girls aged 3–12 years.
Table 1 shows the prevalence of grade 1, 2 and 3 thinness according to age and sex. Overall, the prevalence of thinness was 13·92 % for boys and 18·45 % for girls; grade 1 thinness was present in 8·89 % of boys and 11·78 % of girls, grade 2 thinness in 2·80 % of boys and 3·74 % of girls, and grade 3 thinness occurred in 2·23 % of boys and 2·93 % of girls (all P<0·01). Subtotal, the prevalence of grade 1, 2 and 3 thinness in boys aged 3–7 years was higher than in boys aged 7–12 years; however, the prevalence of grade 1 and 2 and total thinness in 3–7-year-old girls was lower than that in 7–12-year-old girls. There was an obvious variation in thinness by sex.
Prevalence of thinness in boys and girls aged 3–12 years (n 72 349), Shanghai, China, June 2014

§P value from χ 2 test comparing the prevalence in boys and girls.
In total 44 034 children were local residents and the prevalence of thinness was 12·83 % for boys, 17·09 % for girls; 25 757 children belonged to the migration population and the prevalence of thinness was 15·50 % for boys, 21·18 % for girls. The prevalence of thinness in local residents was lower than that in the migration population for both boys and girls (P<0·01). Our results revealed that the prevalence of thinness decreased with age in boys, especially grade 1 thinness, while thinness in girls showed a relatively smooth prevalence. There was generally a higher prevalence of thinness in girls above 5 years of age.
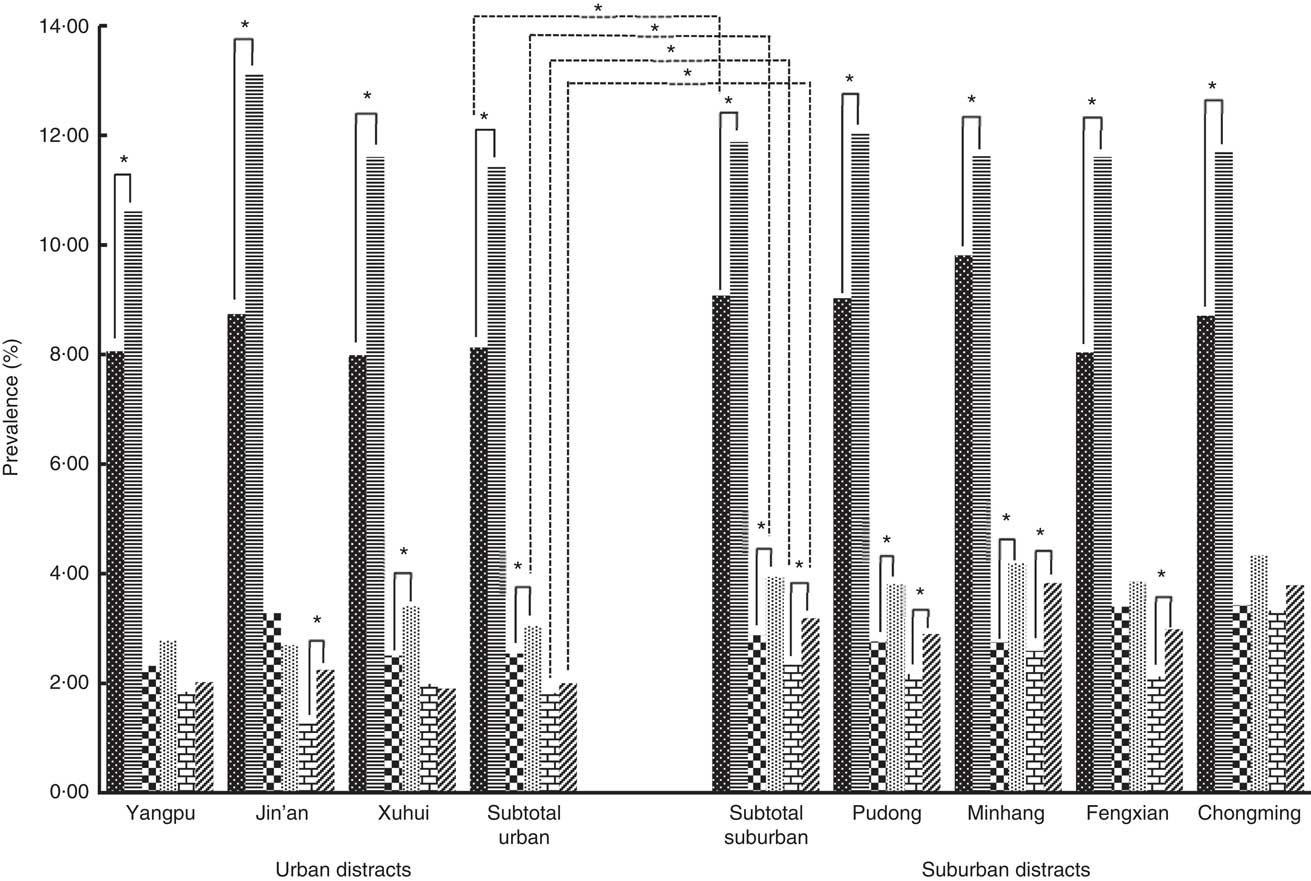
Overall, in suburban and urban areas respectively, the prevalence of grade 1 thinness was 10·18 % and 9·51% (OR = 1·11; 95% CI 1·09, 1·14), of grade 2 thinness was 3·32% and 2·73% (OR = 1·21; 95% CI 1·09, 1·35) and of grade 3 thinness was 2·73% and 1·92% (OR = 1·42; 95% CI 1·25, 1·61). Suburban children were more likely to be thin. Figure 1 shows histograms of the prevalence of grade 1, 2 and 3 thinness in boys and girls in the three urban and four suburban districts. The prevalence of grade 1 thinness in girls was significantly higher than that in boys in both urban and suburban districts (all P<0·01). There was a significant sex difference in the prevalence of grade 2 thinness in some urban (Xuhui, P=0·02) and suburban districts (Pudong, P<0·01; Minhang, P<0·01). For grade 3 thinness, there was a significant sex difference in prevalence in one urban district (Jin’an, P<0·01) and three suburban districts (Pudong, P<0·01; Minhang, P<0·01; Fengxian, P=0·04). There was a significant difference between overall urban and suburban districts in the prevalence of grade 1 thinness for boys (P=0·01), grade 2 thinness for girls (P<0·01) and grade 3 thinness for both boys and girls (P<0·05); the prevalence of thinness in suburban districts was higher than that in urban districts.
Prevalence of grade 1, 2 and 3 thinness in boys and girls aged 3–12 years (n 72 349) from three urban districts (Yangpu, Jing’an, Xuhui) and four suburban districts (Pudong, Minhang, Fengxian, Chongming) in Shanghai, China, June 2014: ![]() , boys with grade 1 thinness;
, boys with grade 1 thinness; ![]() , girls with grade 1 thinness;
, girls with grade 1 thinness; ![]() , boys with grade 2 thinness;
, boys with grade 2 thinness; ![]() , girls with grade 2 thinness;
, girls with grade 2 thinness; ![]() , boys with grade 3 thinness;
, boys with grade 3 thinness; ![]() , girls with grade 3 thinness. Subtotal urban and subtotal suburban represent mean prevalence of the above three urban and above four suburban districts, respectively. *Statistically significant difference in prevalence between boys and girls (χ
2 test): P<0·05
, girls with grade 3 thinness. Subtotal urban and subtotal suburban represent mean prevalence of the above three urban and above four suburban districts, respectively. *Statistically significant difference in prevalence between boys and girls (χ
2 test): P<0·05
Association between urbanicity, socio-economic status, parental education and thinness in boys and girls aged 3–12 years (n 72 349), Shanghai China, June 2014
Ref., reference category.
Model 1: univariate logistic regression, adjusted for age.
*Statistically significant: P<0·05.
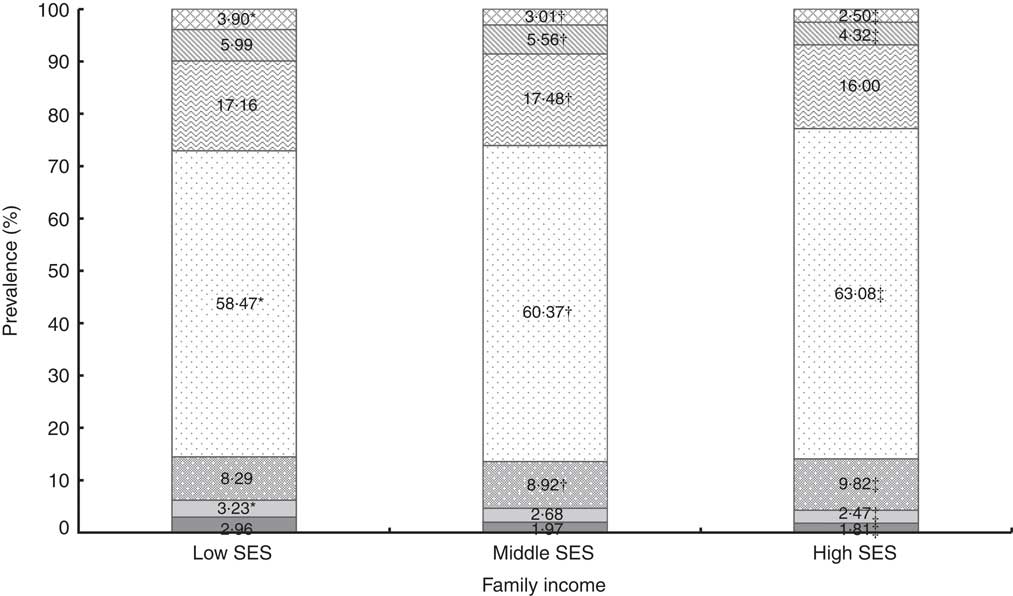
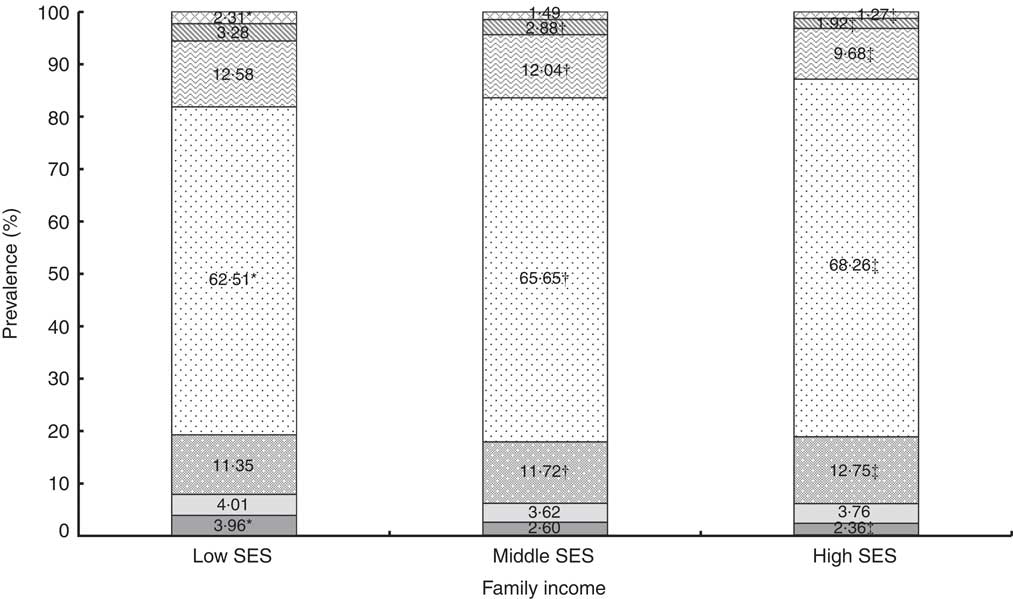
In low-, middle- and high-SES boys (Fig. 2), the prevalence of grade 2 thinness (3·23 %, 2·68 %, 2·47 %), grade 3 thinness (2·96 %, 1·97 %, 1·81 %), obesity (5·99 %, 5·56 %, 4·32 %) and severe obesity (3·90 %, 3·01 %, 2·50 %) was higher in the low-SES group; however, the prevalence of grade 1 thinness (8·29 %, 8·92 %, 9·82 %), healthy weight (58·47 %, 60·37 %, 63·08 %) and overweight (17·16 %, 17·48 %, 16·00 %) was higher in high-SES group. The pattern was similar in girls (Fig. 3), except that the prevalence of overweight was higher in low SES and the trend of grade 2 thinness was not obvious. Low-SES children were more likely to have grade 2 or 3 thinness, overweight and obesity, while high-SES children were more likely to have grade 1 thinness (P<0·05) both in boys and girls. In the logistic regression analysis (Table 2), the OR for thinness was higher in low SES. For example, low-SES boys were more likely to be thin than high-SES boys (grade 2 thinness: OR=1·55, 95 % CI 1·27, 1·89; grade 3 thinness: OR=2·10, 95 % CI 1·68, 2·63). Meanwhile, parental education was a clear and consistent correlate of grade 3 thinness for boys and girls and of grade 2 thinness for boys.
Distribution of the prevalence of thinness, overweight and obesity in boys aged 3–12 years (n 38 550) of low, middle and high socio-economic status, Shanghai, June 2014: ![]() , severe obesity;
, severe obesity; ![]() , obesity;
, obesity; ![]() , overweight;
, overweight; ![]() , healthy weight;
, healthy weight; ![]() , grade 1 thinness;
, grade 1 thinness; ![]() , grade 2 thinness;
, grade 2 thinness; ![]() , grade 3 thinness. *Statistically significant difference in prevalence between low SES and middle SES (χ
2 test): P<0·05; †statistically significant difference in prevalence between middle SES and high SES (χ
2 test): P<0·05; ‡statistically significant difference in prevalence between low SES and high SES (χ
2 test): P<0·05
, grade 3 thinness. *Statistically significant difference in prevalence between low SES and middle SES (χ
2 test): P<0·05; †statistically significant difference in prevalence between middle SES and high SES (χ
2 test): P<0·05; ‡statistically significant difference in prevalence between low SES and high SES (χ
2 test): P<0·05
Distribution of the prevalence of thinness, overweight and obesity in girls aged 3–12 years (n 33 799) of low, middle and high socio-economic status, Shanghai, June 2014: ![]() , severe obesity;
, severe obesity; ![]() , obesity;
, obesity; ![]() , overweight;
, overweight; ![]() , healthy weight;
, healthy weight; ![]() , grade 1 thinness;
, grade 1 thinness; ![]() , grade 2 thinness;
, grade 2 thinness; ![]() , grade 3 thinness. *Statistically significant difference in prevalence between low SES and middle SES (χ
2 test): P<0·05; †statistically significant difference in prevalence between middle SES and high SES (χ
2 test): P<0·05; ‡statistically significant difference in prevalence between low SES and high SES (χ
2 test): P<0·05
, grade 3 thinness. *Statistically significant difference in prevalence between low SES and middle SES (χ
2 test): P<0·05; †statistically significant difference in prevalence between middle SES and high SES (χ
2 test): P<0·05; ‡statistically significant difference in prevalence between low SES and high SES (χ
2 test): P<0·05
Discussion
The present paper describes a large, randomly sampled, population, school-based field survey of grade 1, 2 and 3 thinness, overweight, obesity and severe obesity in the mega-city of Shanghai. Our study uniquely provided the prevalence of thinness as 15·76 % for boys and 17·72 % for girls aged 3–6 years in Mainland China and gives a valuable insight into thinness and obesity issues in Shanghai children. The high prevalence of overweight, obesity, severe obesity and thinness within the same group of children suggests that Shanghai is currently in the midst of a nutritional transition as the proportion of grade 2 and 3 thinness in low-, middle- and high-SES children is higher than that of severe obesity for both boys and girls (Figs 2 and 3). Hardy et al. reported that the proportion of thinness in low, middle and high SES is lower than that of obesity in both boys and girls in an Australian population( Reference Hardy, Cosgrove and King 26 ). Our findings also provide evidence of substantial consistency in prevalence of thinness between urban and suburban districts, local and migrant populations, among low-, middle- and high-SES groups. The prevalence of thinness in local residents was lower than that in the migration population in both boys and girls, and the prevalence of thinness in urban districts was lower than that in suburban districts, because the proportions of local residents and high-SES children in urban districts are higher than those in suburban districts.
In our study, 16·04 % of Shanghai children were thin (13·92 % for boys, 18·45 % for girls). Based on the same International Obesity Task Force reference( Reference Cole, Flegal and Nicholls 27 ), Zhang et al. reported the prevalence of thinness to be 8·72 % in boys and 14·90 % in girls aged 7–12 years in Shandong Province( Reference Zhang, Lin and Sun 28 ); these values are lower than the prevalence of 12·57 % for boys and 19·01 % for girls aged 7–12 years in present study, especially in grade 2 and 3 thinness (Table 1). The overall prevalence of thinness in our study (13·92 % for boys, 18·45 % for girls) is lower than values from Hong Kong( Reference Mak, Ho and Lo 29 ) (16·7 % for boys, 22·3 % for girls), India( Reference Maiti, Ghosh and Paul 9 ) (58·30 % for total) and the Seychelles( Reference Bovet, Kizirian and Madeleine 30 ) (30·3 % for boys, 29·2 % for girls); and higher than values from Australia( Reference O’Dea and Dibley 4 ), the Netherlands( Reference Schonbeck, van Dommelen and HiraSing 31 ), the UK( Reference Smith, Craig and Raja 3 ), Nigeria( Reference Ene-Obong, Ibeanu and Onuoha 7 ), Cameroon( Reference Wamba, Enyong Oben and Cianflone 32 ) and Portugal( Reference Marques-Vidal, Ferreira and Oliveira 33 ). The variation may be related to differences in race, rate of urbanization, socio-economic development and so forth.
The present study indicated that SES was significantly related to thinness in children. There was a particular SES pattern for thinness in both boys and girls. A significant negative association between SES level and prevalence of grade 3 thinness existed in our study, while SES level was positively associated with the prevalence of grade 1 thinness (Figs 2 and 3). Low-SES children were more likely to be overweight or obese than their higher-SES counterparts, and these findings were consistent with reports from Australia( Reference O’Dea and Dibley 4 , Reference O’Dea, Chiang and Peralta 13 ) but contrasted with reports from Shandong, China( Reference Zhang and Wang 14 ). The discrepancy in the results may be related to differences in the proportion of urban population between Shanghai and Shandong and variations between districts in living standards, nutritional conditions and public health policies.
There was a higher risk of grade 2 thinness, grade 3 thinness and obesity in children living in lower-SES groups. People in high-SES groups or living in urban areas are more like to have higher intakes of energy, cholesterol, protein, total fat, SFA, PUFA and MUFA, and lower intakes of carbohydrates and fibre( Reference Shang, Li and Liu 34 ). These dietary patterns, in conjunction with inadequate physical exercise, can result in sharp increases in childhood malnutrition issues. The present study suggests that thinness is a significant issue that is overlooked. As in some other developed and developing countries around the world, China faces a double burden of thinness and overweight arising from poor nutrition. The occurrence of thinness, overweight or obesity within the same group of children has been previously reported in countries undergoing nutritional transition( Reference Ene-Obong, Ibeanu and Onuoha 7 , Reference Caleyachetty, Rudnicka and Echouffo-Tcheugui 35 , Reference Armstrong, Dorosty and Reilly 36 ). Therefore, it is important to face the public health challenge posed by thinness. Special attention should be paid to controlling the tendency towards a polarization of nutritional status in children.
The strengths of our study include the following: (i) it was a large, representative, multistage proportional cluster sample of children aged 3–12 years; (ii) it found a particular pattern in grade 1, 2 and 3 thinness in different SES groups; (iii) it provided a comprehensive profile of the distribution of overall BMI status including grade 1, grade 2, grade 3 thinness, healthy weight, overweight, obesity and severe obesity in Shanghai; and (iv) it allowed us to explore the influence of SES, parental education and urban or suburban geography. However, some limitations should be acknowledged. First, data on children’s height and weight from parental reports may be inaccurate. Second, the absence of sufficient and detailed information concerning dietary patterns, physical activity and socio-economic information at the individual level also limits our analysis. Factors related to both diet and socio-economics should be considered simultaneously in the exploration of thinness prevalence in future studies.
Conclusion
In conclusion, the present study found a higher prevalence of grade 2 and 3 thinness, obesity and severe obesity in children from low-SES groups and children living in suburban districts. The pattern of thinness and obesity in Shanghai provides further insights into BMI patterns in mega-cities in developing countries.
Acknowledgements
Acknowledgements: The authors are grateful to all parents and teachers of the children for their assistance and cooperation in this study. Financial support: The present study was supported by the Shanghai Municipal Commission of Health and Family Planning: Shanghai Municipal Enhancing Public Health 3-year Program (2011–2013) (grant no. 11PH1951202). It had no role in the design, analysis or writing of this article. The study did not receive any other specific grant from any commercial or not-for-profit organization. Conflict of interest: All authors declare they have no conflicts of interest. Authorship: C.C. and Z.J. contributed equally to this work. X.J., Z.J. and S.L. designed the research; Z.J., H.H., F.J. and Y.Y. performed the study; C.C. and S.L. drafted the manuscript and performed statistical analyses; S.L. contributed to interpretation of the results and critically reviewed the manuscript; S.L. had primary responsibility for final content. All authors read and approved the final manuscript. Ethics of human subject participation: This study was conducted according to the guidelines in the World Medical Association (2000) Declaration of Helsinki: Ethical Principles for Medical Research Involving Human Subjects (http://www.wma.net/en/30publications/10policies/b3/) and the Guidelines for the Ethical Conduct of Medical Research Involving Children, revised in 2000 by the Royal College of Paediatrics and Child Health: Ethics Advisory Committee (Arch Dis Child 2000, 82, 177–182). All procedures involving human subjects were approved by the Institutional Review Boards of the Shanghai Municipal Commission of Health and Family Planning. Verbal informed consent was obtained from all participants, and witnessed and formally recorded.


