


Poor diet quality is a preventable chronic disease risk factor(Reference Afshin, Sur and Fay1). Multi-level interventions aiming to increase healthy food access and availability in various food environments (i.e. schools, communities, workplaces)(Reference Whelan, Love and Millar2–Reference Glanz and Hoelscher7) have the potential to improve diet quality, and such efforts may be enhanced through use of novel dietary assessment methods that complement existing measures of intake(Reference Cade8). The home food environment, determined by micro- (e.g. taste preferences, food security) and macro-level factors (e.g. policy, marketing), substantially influences individual-level diet quality(Reference Story, Kaphingst and Robinson-O’Brien9), making it a desirable target for interventions.
Measuring the home food environment is challenging as few tools are validated and a range of data sources (e.g. receipts, inventories, checklists, etc.) reduces comparability(Reference McKinnon, Reedy and Morrissette10–Reference Gamba, Schuchter and Rutt12). The Grocery Purchase Quality Index (GPQI) presents an opportunity to evaluate home food environments more accurately using objective food purchasing data to calculate ratios of actual v. recommended spending within food groups as a proxy for diet quality(Reference Brewster, Guenther and Jordan13). Similar to the commonly used Healthy Eating Index (HEI)(Reference Krebs-Smith, Pannucci and Subar14), the GPQI assesses adherence to the Dietary Guidelines for Americans, containing both adequacy and moderation components(Reference Brewster, Guenther and Jordan13). However, unlike the HEI, the GPQI relies on less detailed data to categorise foods into broader food groups without assessing nutrient components, making it a more flexible tool for evaluating household diet quality, and potentially individual-level intake. Despite relying on less detailed data, a recent study found a strong positive correlation (r 0·70) between GPQI and HEI scores both calculated with objective, household-level purchasing data(Reference Brewster, Durward and Hurdle15), demonstrating that the GPQI validly assesses diet quality despite broader categorisation of foods.
To date, limited research has explored the relationship between purchase quality and intake quality. Notably, Appelhans et al. (Reference Appelhans, French and Tangney16) found a moderate correlation between HEI scores calculated from complete grocery purchase records and 24-h recalls (ρc = 0·57, P < 0·0001), suggesting that grocery purchasing data may be a useful proxy of intake quality. Further research is needed to evaluate associations between household grocery purchase quality and individual-level diet quality when only a partial grocery purchasing record is available and determine how shopper characteristics influence the association.
Within the Smart Cart pilot randomised controlled trial, the present study assessed whether diet quality of the home food environment provided valid estimates of individual-level diet quality. The GPQI reflected purchase quality based on 3 months of partial (≥50 %) grocery purchasing data from one supermarket while the HEI assessed individual-level diet quality prior to the start of the study and at 3 months so that concordance between measures could be compared both prospectively and retrospectively. Concordance between the GPQI and HEI was evaluated with: (1) overall and subgroup partially adjusted correlations, (2) percentage score differences adjusting for confounding variables, (3) cross-classifying participants with high or low diet quality and (4) weighted κ coefficients assessing consistency in tertile assignments.
Methods
This secondary data analysis was completed within the Smart Cart study (registered at clinicaltrials.gov, NCT03748056: Targeted Food Incentives to Improve Diet Quality and Health Among Adults), a pilot randomised controlled cross-over trial examining the impact of individually targeted coupons on grocery purchase quality; study details have been published elsewhere(Reference Vadiveloo, Guan and Parker17). The Smart Cart study was conducted according to the guidelines laid down in the Declaration of Helsinki, and all procedures involving human subjects were approved by the University of Rhode Island Institutional Review Board; #1240194. Written informed consent was obtained from all subjects.
Participants (n 224) who regularly grocery shopped at the participating medium-sized grocery store in Rhode Island were recruited between July and October 2018. The participating grocery store is a full-service, independent, locally owned specialty market featuring an in-house bakery and extensive selection of fresh prepared foods that are known for its healthy options and local produce. Eligible participants were ≥18 years, English-speaking, the primary grocery shopper in their household, completed ≥50 % of their grocery shopping at the participating store, had email for study communication, were not pregnant or planning to become pregnant during the study and were enrolled or willing to enroll in the store’s loyalty programme.
Recruited participants completed a demographics and grocery shopping habits survey using RedCap and a validated online FFQ reflecting 3 months of individual-level intake; the online FFQ contained branching logic with complex skip patterns to reduce participant burden and therefore included a variable number of questions for each participant(18,Reference Kristal, Kolar and Fisher19) . Participants were randomised to the intervention group which received targeted weekly coupons and nutrition education content (based on purchased and self-reported diet history) or the control group which received non-targeted nutrition education content and occasional generic coupons (i.e. $2 off any purchase). After the first 13-week intervention period, 3-month FFQ were administered during a 2–4 week washout period, after which experimental groups crossed over.
Loyalty cards were used to collect purchasing data, distribute coupons and provide a 5 % discount on grocery purchases. The analytic sample (n 209; online Supplementary Fig. S1) excluded fifteen participants from the full sample with no purchases in any study period (n 8) or total period spending <1 % (n 4) or >99 % (n 3) of the sample distribution. A sensitivity analysis was conducted eliminating participants who completed the baseline or 3-month FFQ in <10 min (n 11); results were unchanged, so these participants were included in the analytic sample.
Dietary variables
Household-level diet quality was measured using the GPQI-16 which has been validated against the HEI-15, displaying reasonable convergent and criterion validity(Reference Brewster, Durward and Hurdle15). GPQI scores were calculated with objective point-of-sale purchasing data from the participating store over a 3-month period (September–December 2018). The GPQI is scored out of 75 points and comprised of eleven components, including eight adequacy (e.g. fruit, vegetables, where intake is encouraged) and three moderation components (e.g. refined grains, sweets, where intake is discouraged). GPQI scores are derived by comparing percentage of total spending within each component to standardised expenditure shares, which reflect the United States Department of Agriculture Food Plans (i.e. guidance for cost-effective grocery purchasing that aligns with national nutrition guidelines). Brewster et al. (Reference Brewster, Durward and Hurdle15) derived standardised expenditure shares by census-weighting age- and sex-specific Food Plan component expenditures and averaging across four income strata. To calculate GPQI scores, all purchased items were assigned one of thirteen mutually exclusive categories (eleven GPQI components, non-categorised food items (i.e. oils, coffee, prepared and mixed dishes), or non-food items). After excluding non-food items, total spending was summed for overall and component-specific food purchases. Component scores are based on the ratio of actual percentage spending to standardised expenditure shares. A greater percentage spending on adequacy components (and lesser percentage spending on moderation components) reflects greater adherence to the Dietary Guidelines for Americans and equates to higher GPQI scores.
Individual-level diet quality was measured using the extensively validated HEI-2010(Reference Guenther, Kirkpatrick and Reedy20). HEI-2010 scores were calculated from the participants’ responses to a 3-month FFQ administered at enrollment and 3 months. The HEI is scored out of 100 points and comprised of twelve components, including nine where intake is encouraged (i.e. adequacy) and three where intake is discouraged (i.e. moderation)(Reference Guenther, Casavale and Reedy21). The HEI includes all eight of the GPQI adequacy components (i.e. total fruit, whole fruit, total vegetables, greens and beans, whole grains, dairy products, total protein foods and seafood and nuts/plant proteins) plus fatty acids. Both indexes have three adequacy components, including refined grains which is common to both indexes; the GPQI additionally contains processed meats and sweets and sodas, while the HEI contains Na and ‘empty calories’ (includes solid fats, added sugar and alcohol)(Reference Brewster, Durward and Hurdle15,Reference Guenther, Casavale and Reedy21) .
Consistent with best practices for validity analyses(Reference Kirkpatrick, Baranowski and Subar22), the 3-month FFQ recall period is temporally aligned with GPQI scores; complete data were available for 182 of the analytic sample at 3 months. Because data were available at both time points, this analysis was able to assess whether baseline HEI (HEIBL; July–October 2018) was predictive of future GPQI scores and whether the GPQI validly reflected 3-month HEI scores (HEIMID; December 2018–January 2019). For both measures (HEI and GPQI), higher total and component scores indicate a healthier diet. Due to different score ranges (GPQI = 0–75; HEI = 0–100), scores were scaled to 100 points for comparability. Estimated energy and macronutrient intakes were calculated from FFQ responses but since energy and macronutrient content of grocery purchases could not be estimated, analyses strictly focused on diet quality overall and component scores.
Statistical methods
Analyses were completed in SAS 9.4 (SAS Institute Inc.) and the α threshold for significance was set at P < 0·05, with Bonferroni and Tukey corrections used to adjust the α threshold for multiple comparisons(Reference Ludbrook23). GPQI scores were sorted in ascending order and participants were divided into tertiles (T), which roughly categorised participants into groups of low, medium and high grocery purchase quality. Descriptive statistics (including means and standard errors and numbers and percentages) were calculated for the overall sample and compared across GPQI tertiles with unadjusted generalised linear and logistic regression models. The analytic sample’s representativeness of the full study sample was examined by comparing descriptive characteristics among those included v. excluded at 3 months using t tests for continuous variables and χ 2 for categorical variables.
Several validity measures assessed concordance between GPQI and HEI scores including correlation coefficients, percentage score differences, cross-classification and weighted κ coefficients. Bonferroni-corrected Pearson correlations (partially adjusted for age and sex) characterised the strength and direction of association between continuous GPQI and HEI scores at baseline and 3 months, stratified by shopper- and household-level characteristics.
Covariate-adjusted generalised linear models compared percentage score differences (i.e. GPQI – HEI) and mean HEIBL, HEIMID and GPQI scores across GPQI tertiles for total and nine component scores common to both indexes. Covariates were selected partly based on previous literature; therefore, sex and age were included in all adjusted models(Reference Hiza, Casavale and Guenther24). Based on R 2 and mean score differences when singly added to the model, additional individual- and household-level measures self-reported at baseline were considered for adjustment, including baseline experimental group assignment, educational attainment (≤ or >bachelor’s degree), annual pre-tax household income (< or ≥$100 000), continuous BMI (self-reported weight and height), household size (i.e. the number of people groceries were purchased for; 1, 2, or >2 people), children in household (yes/no), smokers in household (yes/no) and whether or not (yes/no) participants also grocery shopped at farmer’s markets, superstores or other grocery stores. The fully adjusted model was controlled for age, sex, BMI and income; Tukey correction was used for post hoc comparisons.
Cross-classification was used to determine whether participants with high or low GPQI scores (i.e. T3 or T1) would be similarly classified as having high or low HEI score (i.e. defined a priori as ≥80 or <60 points from previous literature(Reference Krebs-Smith, Pannucci and Subar14)). Logistic regression models adjusted for age, sex, BMI and income compared the odds of obtaining high (≥80 v. <80) and low (<60 v. ≥60) HEI scores within each GPQI tertile.
Lastly, weighted κ coefficients characterised agreement between GPQI and HEI tertile rankings. For interpretability and to count partial agreements, Fleiss–Cohen quadratic weights were used(Reference Vanbelle25). A weight of one reflecting perfect agreement was given to identical rankings (e.g. GPQI T3 and HEI T3), a weight of 0·75 reflected partial agreement (e.g. HEI T2 and GPQI T1) and a weight of zero reflected opposite assignments (e.g. GPQI T1 and HEI T3).
The Smart Cart Study was initially powered to detect a 3 % difference in GPQI scores across experimental groups in a cross-over study design. Therefore, 224 participants were recruited, resulting in a final sample of 200 predicting 10 % loss-to-follow-up(Reference Vadiveloo, Guan and Parker17). For this secondary analysis, to obtain 80 % power and detect a medium effect size (r 0·3)(Reference Cohen26), a sample size of eighty-four was needed. The analytic sample (n 209) was adequately powered for this analysis.
Results
Table 1 presents descriptive characteristics within the overall sample and by GPQI tertiles, where GPQI T1 has the least healthy grocery purchases (range 22·8–50·9) and GPQI T3 (range 58·5–79) has the healthiest purchases. Mean age (55·4 (13·9) years) decreased from 58·1 to 53·6 years across increasing GPQI tertiles (P for trend = 0·05). Similarly, mean BMI (25·4 (4·6) kg/m2) decreased from 26·8 in T1 to 24·1 in T3 (P trend < 0·001). Participants were predominately female (90·3 %), higher socio-economic status (49·7 % income <$100 000; 51·0 % ≤bachelor’s degree), shopping for households with 2·3 (1·1) members who were largely non-smoking (96·6 %) and without children (70·7 %). Most participants bought groceries at other grocery stores (85·7 %), nearly half shopped at farmer’s markets (49·8 %) and few shopped at superstores (17·2 %). As purchase quality increased across GPQI tertiles, fewer participants reported shopping at other grocery stores (92·6 % in T1 v. 80·0 % in T3, P trend = 0·04). Unadjusted mean HEI scores increased across GPQI tertiles (P for trend < 0·001) and were descriptively higher for the HEI (HEIBL = 73·2 (9·1) %; HEIMID = 72·4 (9·4) %) compared with the GPQI (54·8 (9·1) %). Experimental group, sex, socio-economic status and household characteristics did not differ across GPQI tertiles. Characteristics in the full study sample (n 224) were compared among those included (n 182) v. excluded (n 42) at 3 months in online Supplementary Table S1. Participants were comparable (P > 0·05) in terms of BMI, sex, education, income, smoking, GPQI and HEIBL scores, and experimental group. Participants excluded from the analytic sample were younger (50·9 (13·0) v. 56·1 (13·9) years, P = 0·03) and had larger household sizes (3·0 (1·5) v. 2·2 (1·1), P = 0·003).
Descriptive characteristics across tertiles of Grocery Purchase Quality Index (GPQI) scores in a sample of shoppers from a single, local grocery store (n 209)
(Mean values and standard deviations; percentages)
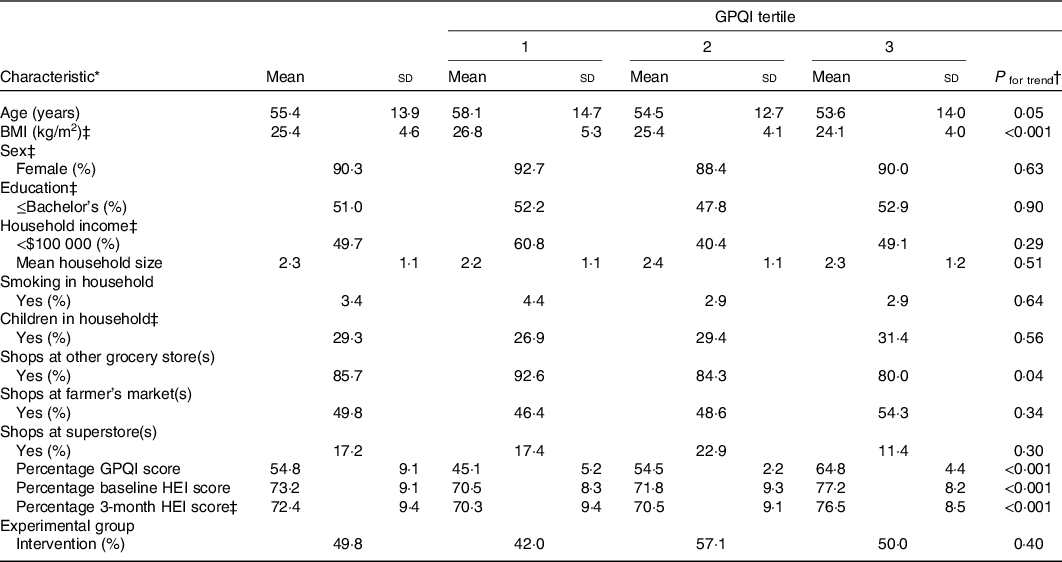
HEI, Healthy Eating Index.
* All characteristics were self-reported by primary shopper in the household. HEI, GPQI, experimental group, income, household size, children in household and smoking status reflect household characteristics; age, sex, education, BMI, shopping at farmer’s market(s), other grocery store(s) or superstore(s) reflect primary shopper characteristics.
† P for trend obtained using unadjusted generalised linear models for continuous variables and unadjusted logistic regression for categorical variables.
‡ Missing data were present among BMI (n 11), sex (n 2), education (n 1), household income (n 48), children in household (n 4), and 3-month HEI score (n 27).
Table 2 presents age and sex partially adjusted GPQI and HEI correlations at baseline and 3 months, overall and stratified by participant characteristics. At both time points, the GPQI was moderately correlated with the HEI (HEIBL r 0·41, HEIMID, r 0·31, P < 0·001), indicating acceptable agreement (r 0·20–0·49)(Reference Lombard, Steyn and Charlton27). Similarly, there was acceptable agreement between the GPQI and HEI at both time points for participants who were female, ≤bachelor’s degree and without children. Participants with >bachelor’s degree, income ≥$100 000 and normal weight BMI only had acceptable agreement between these measures at baseline. At baseline, good agreement (r > 0·49) was observed in participants with children (r 0·56) and >65 years old (r 0·51). The remaining correlations were not significant at the Bonferroni-adjusted threshold of P < 0·0017.
Partially adjusted (for age and sex) correlations between the Healthy Eating Index-2010 (HEI) and Grocery Purchase Quality Index (GPQI) scores among different characteristics
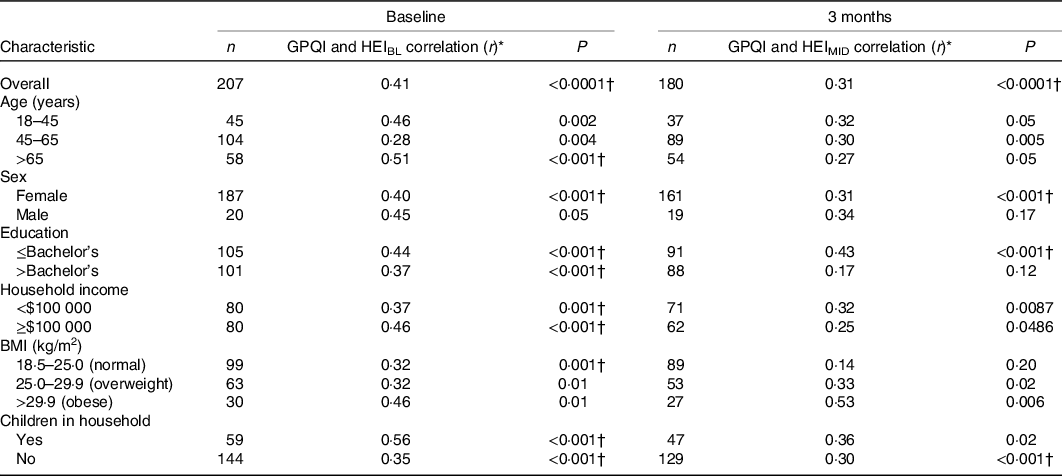
HEIBL, baseline HEI; HEIMID, 3 months HEI.
* Correlations are partially adjusted for age (except age-stratified correlations) and sex (except sex-stratified correlations).
† P values indicate significance at P < 0·0017 (Bonferroni correction for thirty tests at P < 0·05).
Online Supplementary Table S2 shows the model fit details for each covariate added to the fully adjusted model which had R 2 values of 43·9 % with HEIBL and 42·0 % with HEIMID, indicating an improvement in variance explained over the unadjusted and age- and sex-adjusted (28·4–30·5 %) models. Fig. 1 displays the multivariable-adjusted concordance between GPQI and HEI scores across GPQI tertiles. In all tertiles and at both time points, GPQI scores were lower than HEI scores and concordance between scores (i.e. mean GPQI score – mean HEI score) was highest in the healthiest tertile (at baseline, T1 = −26·1 %, T2 = −16·7 %, T3 = 8·2 %; at 3 months, T1 = −26·1 %, T2 = −15·6 %, T1 = −10·0 %; P < 0·0001 for both time points).
Score differences* in grocery purchase diet quality (Grocery Purchase Quality Index; GPQI) and individual-level diet quality (Healthy Eating Index; HEI) across GPQI tertiles†. a,b,c Unlike letters indicate significant Tukey-adjusted post hoc comparisons of score differences across GPQI tertiles; all tertile comparisons of score differences were significant. ![]() , GPQI;
, GPQI; ![]() , HEI. * Score differences (GPQI-HEI, depicted with Δ and brackets) are adjusted for age, sex, BMI and income. For ease of interpretation, GPQI scores and HEI scores (depicted with bars) were derived from separate models adjusted for age, sex, BMI and income. Adjusted HEI scores reflect the HEIMID (3-month) assessment; however, adjusted HEIBL (baseline) measures were similar to HEIMID (tertile 1 = 71, tertile 2 = 71·3, tertile 3 = 75·5). Adjusted differences calculated with the baseline HEI assessment (GPQI – HEIBL) were identical for GPQI tertile 1 (−26·1 %) and similar for tertiles 2 (−15·6 %) and 3 (−8·2 %). † GPQI mean (se): tertile 1 = 44·9 (0·82); tertile 2 = 54·6 (0·73); tertile 3 = 65·5 (0·75).
, HEI. * Score differences (GPQI-HEI, depicted with Δ and brackets) are adjusted for age, sex, BMI and income. For ease of interpretation, GPQI scores and HEI scores (depicted with bars) were derived from separate models adjusted for age, sex, BMI and income. Adjusted HEI scores reflect the HEIMID (3-month) assessment; however, adjusted HEIBL (baseline) measures were similar to HEIMID (tertile 1 = 71, tertile 2 = 71·3, tertile 3 = 75·5). Adjusted differences calculated with the baseline HEI assessment (GPQI – HEIBL) were identical for GPQI tertile 1 (−26·1 %) and similar for tertiles 2 (−15·6 %) and 3 (−8·2 %). † GPQI mean (se): tertile 1 = 44·9 (0·82); tertile 2 = 54·6 (0·73); tertile 3 = 65·5 (0·75).
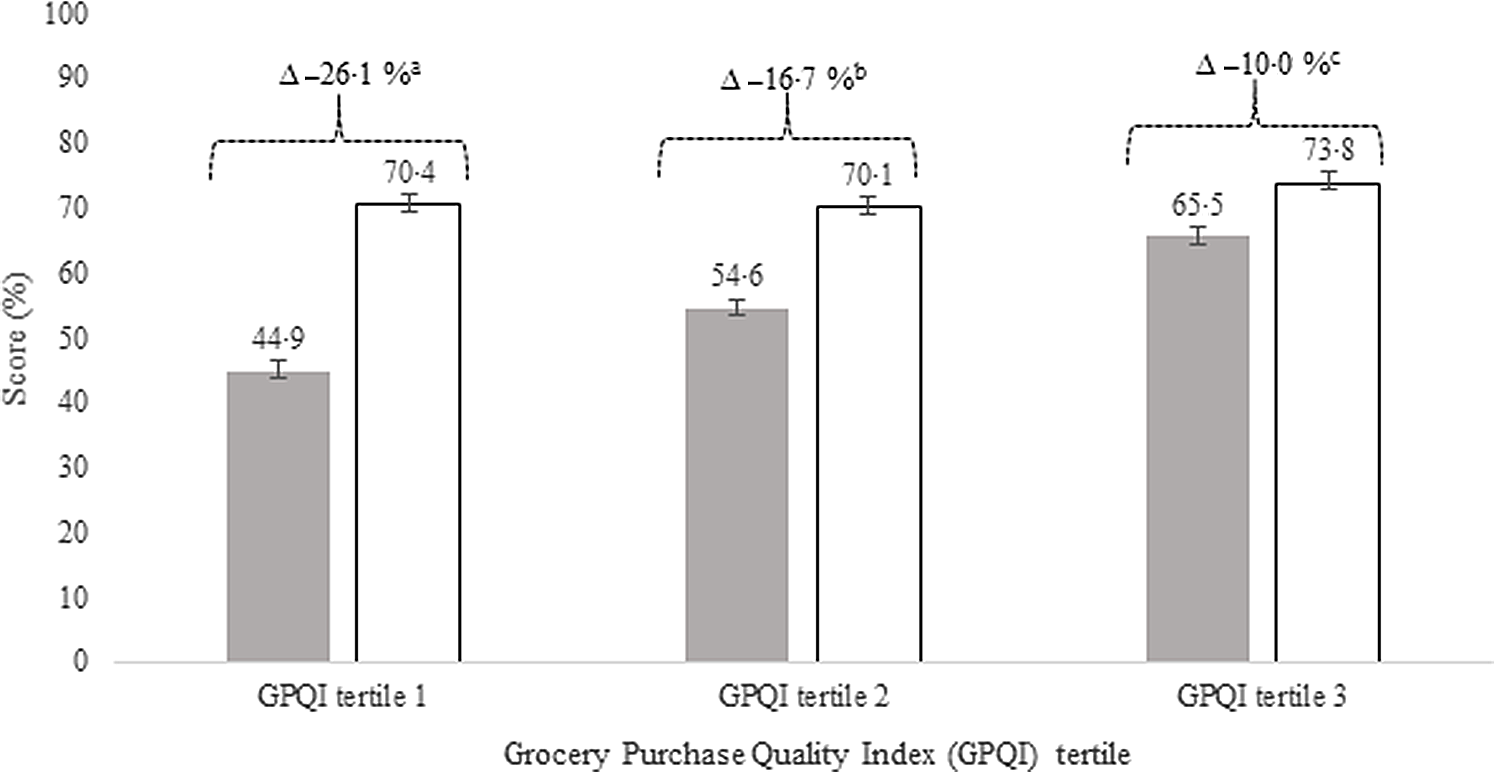
Table 3 displays multivariable-adjusted mean component score differences at baseline and 3 months across GPQI tertiles. For components except dairy products, concordance increased across tertiles and HEI scores exceeded GPQI scores. In dairy products, concordance decreased across tertiles and HEI scores were lower than GPQI scores (HEI < GPQI by 3·6–2·2 points). Descriptively, concordance was lowest for refined grains (HEI > GPQI by 8·9–7·4 points), dairy products, and greens and beans (HEI > GPQI 3·1–2·0 points), and highest for whole fruit (HEI > GPQI 0·3–1·6 points).
Grocery purchase diet quality (Grocery Purchase Quality Index; GPQI) and consumed diet quality (Healthy Eating Index; HEI) component mean scores and mean differences by GPQI tertiles
(Mean values with their standard errors)
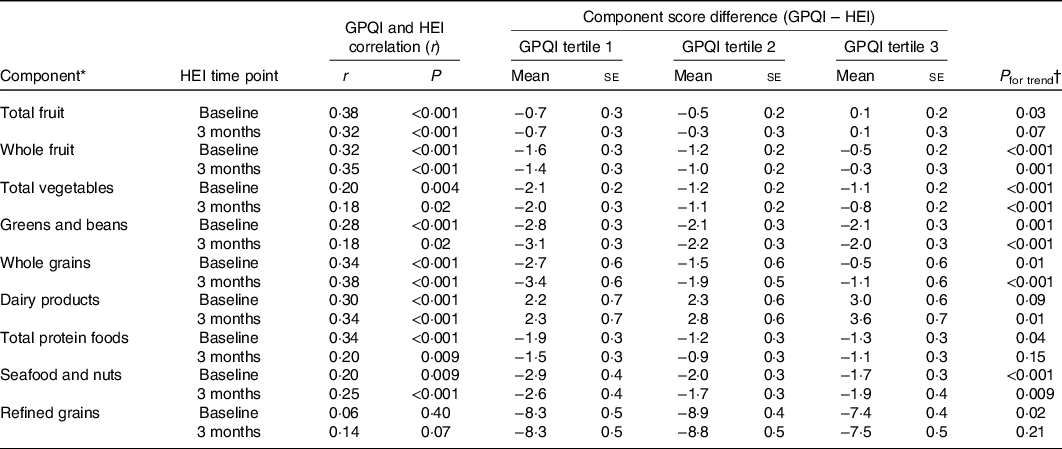
* HEI seafood/plant protein component includes seafood, nuts, seeds, soya products (other than beverages) and legumes (beans and peas); GPQI seafood/nuts component includes fish, fish products, nuts, nut butters and seeds. Maximum GPQI component scores: total fruit = 5; whole fruit = 5; total vegetables = 5; greens and beans = 5; WG = 10; dairy products = 10; TPF = 5; seafood and nuts = 5; refined grains = 10. Maximum HEI component scores: total fruit = 5; whole fruit = 5; total vegetables = 5; greens and beans = 5; WG = 10; dairy products = 10; TPF = 5; seafood and plant proteins = 5; refined grains = 10.
† P for trend was obtained using unadjusted generalised linear models.
Online Supplementary Tables S3 and S4 compare frequencies and adjusted odds of high (≥80 points) and low (<60 points) HEI scores across GPQI tertiles. High HEI scores attained by 21·1 % of participants at baseline and 18·7 % at 3 months were more frequent among participants in the highest grocery purchase quality tertile (35·6, 41·4 %) v. the lowest tertile (8·1, 8·7 %); participants in T3 also had increased odds of HEI scores ≥80 v. participants in T1 (HEIBL OR = 7·32 (2·04, 26·24), HEIMID OR = 10·55 (1·92, 57·97)). Odds were not significantly different for T2 (HEIBL OR = 1·84 (0·48, 7·04), HEIMID OR = 3·07 (0·52, 18·21)). Alternatively, low HEI scores were observed for 8·6 % of participants at baseline and 8·8 % at midpoint, with fewer in GPQI T3 (2·9, 3·4 %) compared with T2 (7·1, 11·5 %) and T1 (11·3, 15·9 %). There was no difference between T3 and T2 v. T1 in odds of having HEIBL or HEIMID scores <60 points in the fully adjusted model.
Weighted κ statistics indicating agreement between tertile rankings of the GPQI and HEI scores were 0·25 at both baseline and 3 months. Both κ statistics obtained from baseline and 3 months were within the fair agreement range (κ = 0·21–0·49)(Reference Lombard, Steyn and Charlton27).
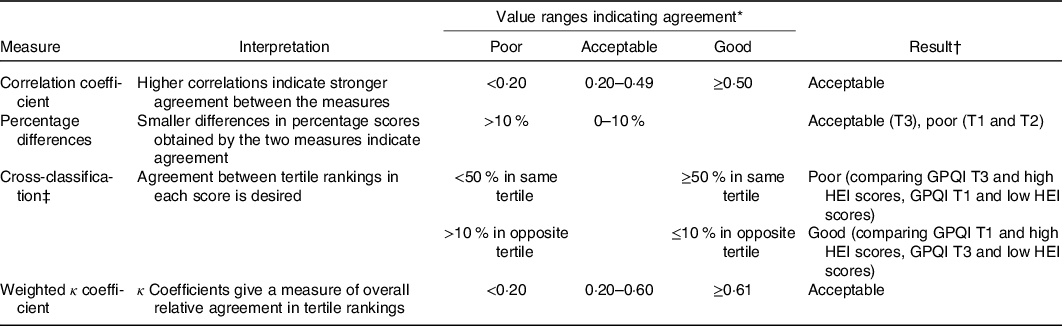
Table 4 summarises results and interpretations(Reference Lombard, Steyn and Charlton27) of the validity measures used to examine agreement between the GPQI and the HEI. Despite weaker correlations at 3 months (r 0·31) compared with baseline (r 0·41), both correlations indicate acceptable agreement, as did both weighted κ coefficients. Score differences for T3 at both time points similarly had acceptable agreement, whereas T1 and T2 indicated poor agreement. In cross-classification, <10 % of participants with a high HEI were grouped in the lowest GPQI tertile and <10 % of people with a low HEI were grouped in the highest GPQI tertile, indicating good agreement. Conversely, <50 % of participants in GPQI T3 also had high HEI scores, similarly to participants in GPQI T1 with low HEI scores, indicating poor agreement(Reference Lombard, Steyn and Charlton27).
Summary of results from validity measures examined and thresholds indicating agreement
T3, tertile 3; T1, tertile 1; T2, tertile 2; GPQI, Grocery Purchase Quality Index; HEI, Healthy Eating Index.
* Ranges indicating poor, acceptable and good agreement were adapted from Lombard et al. (Reference Vanbelle25).
† Overall results displayed were the same at baseline and 3 months.
‡ In cross-classification, instead of comparing tertile memberships across scores, analyses compared how often participants in GPQI T3 aligned with an a priori high (≥80 points) HEI score as well as how often participants with low GPQI scores (T1) aligned with a priori low (<60 points) HEI scores.
Discussion
The present study found that diet quality calculated with partial grocery purchasing data was fairly to moderately concordant with individual-level diet quality, underscoring the promise of using purchasing data as a complementary, objective diet assessment tool(Reference Thompson, Kirkpatrick and Subar28). Numerous validation tests (summarised in Table 4) indicate generally acceptable agreement between the GPQI and HEI. Higher grocery purchase quality was associated with better score concordance and covariate adjustment (age, sex, BMI and income) accounted for >40 % of the variance in models, suggesting that adjustment for covariates may further contribute to the utility of the GPQI as a metric on individual-level diet quality. Interestingly, HEI scores measured at baseline were more strongly predictive of grocery purchase quality than those at 3 months which temporally aligned with the GPQI measurement period.
The acceptable level of agreement between partial purchase data and self-reported dietary intake suggests that combining these measures should be further explored as a means to address measurement error in dietary assessment, which remains a major barrier in nutrition research(Reference Naska, Lagiou and Lagiou29). Self-reported diet assessment methods are affected by measurement error and bias(Reference Kipnis, Subar and Midthune30). Point-of-sale data are an objective measure of household food environments(Reference Chidambaram, Brewster and Jordan31,Reference Mamiya, Moodie and Buckeridge32) , and therefore may be useful for correction of measurement error in dietary recalls, similarly to how FFQ can help to account for usual intake variability not captured in multiple 24-h recalls(Reference Naska, Lagiou and Lagiou29). In this analysis, accounting for socio-demographic variables (age, sex, BMI, income) explained 42–44 % of the total variance in score concordance. Therefore, taking personal characteristics into account likely helped reduce person-specific bias(Reference Naska, Lagiou and Lagiou29).
Score concordance also varied within our sample and was strongest in participants who had the healthiest grocery purchases (i.e. GPQI T3); these participants had significantly higher odds of being identified as having high HEI scores compared to participants with the least healthy grocery purchases (i.e. GPQI T1), but odds of low HEI scores were not different between GPQI tertiles. Participants with the highest concordance and the healthiest grocery purchases reported shopping at other non-study grocery stores significantly less than other participants, indicating that more complete grocery purchasing data or adjustment for the relative completeness may strengthen concordance. Collectively, these results indicate that partial household purchasing data are a viable proxy of individual-level intake, particularly after adjusting for participant characteristics. Further research should explore adjustment for factors related to the completeness of grocery data (e.g. amount of groceries obtained elsewhere) that could improve model fit and concordance.
In the present study, individual-level HEI scores reflecting two different 3-month time frames of self-reported intake were examined. The first assessment took place during study enrollment (HEIBL), aligning with the start of the grocery purchasing data collection; the second assessment was taken at the end of the 3-month grocery purchasing data time period (HEIMID), aligning the periods of recall and purchase data analysis. Using these two HEI measures, analyses assessed whether HEIBL predicted GPQI scores and whether the HEIMID would prospectively correlate with the GPQI when measurement periods aligned. When assessing validity with two imperfect measures (e.g. GPQI from incomplete purchase data, self-reported HEI), best practices indicate that comparisons should be made within the same time frame(Reference Kirkpatrick, Baranowski and Subar22). Interestingly, the HEIBL which reflected a time frame not captured in the GPQI was more strongly correlated with grocery purchase quality compared with the HEIMID (r 0·41 v. 0·31). HEI scores at 3 months were 0·8 points lower than baseline, which may be driven by dietary changes in the winter/holiday season(Reference Jahns, Johnson and Scheett33); seasonal bias in FFQ can lead to overemphasis of more recent consumption(Reference Subar, Frey and Harlan34). Therefore, lower agreement at 3 months was likely influenced by seasonal changes in eating and shopping habits around the winter holidays. Additionally, some participants with higher HEIBL and GPQI scores did not complete the HEIMID and were therefore excluded from the 3-month analytic sample which likely contributed to the reduced strength of the overall correlation. Some exploratory analyses (data not shown) suggested that loss of higher scoring participants may explain why some groups had more substantial attenuation of the 3-month correlations (e.g. >bachelor’s degree, ≥$100 000 income, normal BMI); among high-income participants, for example, participants included only at baseline scored descriptively higher than participants included at both time points on the HEIBL (73·7 v. 72·0) and GPQI (56·1 v. 54·6).
This analysis contributes to the applications of food purchasing data to complement current methods of diet assessment. Building on previous research by Appelhans et al. (Reference Appelhans, French and Tangney16), who found that HEI scores calculated from complete purchasing data and repeated 24-h recalls were moderately correlated (ρc = 0·67), the present analysis yielded a moderate correlation between partial grocery purchasing data and individual-level diet quality metrics. Present research utilising grocery purchasing data has largely analysed data from third-party companies (e.g. Nielsen) who collect, pool and process data from pre-selected consumer panels(Reference Bandy, Adhikari and Jebb35). Therefore, our study contributes to the understudied research area of local, non-chain grocery data as a means for assessing diet quality in a nutrition intervention, though consideration must be given to the challenges associated with collecting and analysing grocery purchasing data.
Utilising grocery purchasing data for diet assessment can be analytically challenging due to variation in manufactures’ products and point-of-sale systems. Given the promise of grocery purchasing data as a diet quality metric, novel data processing methods should be further explored to address analytic challenges. For example, Tran et al. (Reference Tran, Brewster and Chidambaram36) correctly linked 77–100 % of grocery purchase items to the Food Patterns Equivalent Database groups via utilisation of natural language processing and food concept maps. Similarly, recent efforts have utilised probabilistic and semantic matching to link consumer and retailer data from over 800 000 grocery items to United States Department of Agriculture nutrient composition databases(Reference Carlson, Page and Zimmerman37). Further efforts to automate linkages between purchase data and nutritional information are needed for scaling grocery purchase data analysis methods for broader use.
The present study has some limitations. The participating grocery store is an independent specialty market known for its healthier products and has relatively high-income customers who are unlikely to be representative of the general population. Subsequently, the generalisability of our findings is limited by the homogeneity of our sample which had average HEI scores approximately 14 % higher than the general US population(38). At baseline, participants reported all store types where they purchased groceries during the last month and estimated their total weekly grocery spending across all stores. Participants were not asked to quantify relative contributions of grocery sources, so models were not adjusted for the relative completeness of the partial grocery purchasing data. However, using estimated weekly grocery spending reported at baseline (data not shown), it can be approximated that 49 % total grocery spending was accounted for at the participating grocery store. Furthermore, while US grocery shoppers visit approximately 4·4 different stores per month, over 90 % of shoppers purchase the majority of their groceries at a single primary store(Reference Markenson39), suggesting that the present analysis of grocery purchases from a single store represented a considerable portion of the sample’s total grocery purchases. But for 48·9 % of participants who reported shopping at farmer’s markets, it is possible that GPQI scores for fruits and vegetables were underestimated. Despite this, >40 % of variance was explained by accounting for demographic characteristics. The present study also had numerous strengths. This analysis comprehensively examined concordance between the GPQI and HEI at two different time points using a variety of validity measures in a relatively large sample. Furthermore, the present study is a major contribution to the diet assessment literature due to our novel examination and comparison of partial grocery data and self-reported dietary data.
In conclusion, this comprehensive analysis found that household-level GPQI scores derived from partial grocery purchasing data were fairly to moderately reflective of the individual-level diet quality of the primary shopper, particularly with adjustment for participant characteristics. Using partial grocery purchase records to validly identify individuals with high and low diet quality may be especially important for dietary interventions by reducing the expenses associated with numerous self-reported dietary assessments and issues-related non-response bias. Future research in more heterogeneous samples is warranted.
Acknowledgements
The authors thank the Smart Cart study team for their assistance that made this analysis possible.
The Smart Cart study was funded by the Foundation for Food and Agricultural Research New Innovator Award (534298). The Foundation for Food and Agricultural Research had no role in the design, analysis or writing of this article.
Author contributions were as follows: H. W. P., M. K. V. and A. N. T. designed the research; H. W. P. conducted analyses; H. W. P. and C. D. A. wrote the paper; M. K. V. and A. N. T. critically reviewed the manuscript; and M. K. V. had primary responsibility for final content. All authors read and approved the final version.
There are no conflicts of interest.
Supplementary material
For supplementary materials referred to in this article, please visit https://doi.org/10.1017/S0007114520004833


