

Archaeologists have long argued that their field should engage concretely with contemporary issues, including urbanization, markets, standards of living, inequality, demography, resource depletion, climate change, and social transformation (d'Alpoim Guedes et al. Reference d'Alpoim Guedes, Crabtree, Bocinsky and Kohler2016; Diamond Reference Diamond2005; Hegmon Reference Hegmon2016; Hegmon et al. Reference Hegmon, Peeples, Kinzig, Kulow, Meegan and Nelson2008; Kintigh et al. Reference Kintigh, Altshul, Beaudry, Drennan, Kinzig, Kohler, Limp, Maschner, Michener, Pauketat, Peregrine, Sabloff, Wilkinson, Wright and Zeder2014; Kohler and Reese Reference Kohler and Reese2014; Schwindt et al. Reference Schwindt, Bocinsky, Ortman, Glowacki, Varien and Kohler2016; Smith et al. Reference Smith, Dennehy, Kamp-Whittaker, Colon and Harkness2014; Smith et al. Reference Smith, Feinman, Drennan, Earle and Morris2012; Van der Leeuw and Redman Reference Van der Leeuw and Redman2002). We support these efforts and here address an issue we believe needs resolution if archaeology is to achieve this goal.
The issue is that human societies today are much larger and more complex than those we learn about through archaeology. There will soon be more than 10 billion people on earth, and most live in cities of millions. Today, only 2% of the US population produces food, and people spend decades developing the capacity to do extremely specialized work. As a result, we are more interdependent today than ever before. A financial system moves capital instantly and effortlessly across the globe; expanding human knowledge enables us to create cars, computers, chemotherapy, the Internet, and robots that can drive around Mars; and human consumption drives changes in earth's basic geology and ecology. Researchers from many fields, including some archaeologists, conclude from this reality that archaeology can help us to understand how this world came to be, and to imagine alternative worlds, but it is not very relevant for the decisions we need to make now and in the future. If this is true, the prospects for a policy-relevant archaeology would seem limited. So if archaeologists want to change this conclusion, our first order of business should be to develop a way of thinking about human societies that dissolves this boundary between past and present by characterizing the structure and functioning of human societies at any scale, and in a way that allows us to use data from the past to make predictions about the future.
In this paper, we take some initial steps in this direction by testing the extent to which scaling relationships observed in contemporary cities, and in past complex societies, are also apparent in archaeological data from village-scale societies. Specifically, we investigate the possibility that these different scales of settlement express the same fundamental process: namely, the concentration of social interactions and their products in space and time, subject to a variety of constraints. Our results suggest that allometric scaling analysis as developed here and in other recent publications (Bettencourt Reference Bettencourt2013, Reference Bettencourt2014; Cesaretti et al. Reference Cesaretti, Lobo, Bettencourt, Ortman and Smith2016; Ortman et al. Reference Ortman, Cabaniss, Sturm and Bettencourt2014; Ortman et al. Reference Ortman, Cabaniss, Sturm and Bettencourt2015; Ortman et al. Reference Ortman, Davis, Lobo, Smith and Cabaniss2016) captures something fundamental and generalizable about human societies and may provide the foundations of a scale-free approach to archaeological research on human social dynamics. In our view, this should make our findings not only more interesting, but also more useful.
To make these points, we first review empirical patterns documented through recent research on urban scaling. Then we discuss emerging theory that seeks to explain these patterns and why we believe that this theory should apply to the archaeological record of middle-range societies as well. We then demonstrate that predictions of settlement scaling theory are in fact borne out in data from two village agricultural societies from native North America. Finally, armed with these results, we consider the implications of settlement scaling theory for our understanding of cities and for general understandings of human society.
Background
One of the exciting developments in complex systems research is the discovery of widespread scaling phenomena in contemporary urban systems. This discovery emanated from significant advances in data collection by a number of agencies and institutions, and by the ability to aggregate data collected at various scales into metropolitan statistical areas representing human settlements as functional units. Several key findings have emerged from these studies. First, there are systematic economies of scale with respect to infrastructure and the use of space, such that more populous metropolitan areas on average encompass less land area and get by with less infrastructure per capita (Bettencourt Reference Bettencourt2013; Bettencourt and Lobo Reference Bettencourt and Lobo2016) than less populous areas. Second, there are systematic returns to scale with respect to a wide range of socio-economic outputs, such that more populous metropolitan areas generally “produce” more per capita (GDP, patents, R&D employment, but also crime and infectious disease) in comparison with less populous areas (Bettencourt, Lobo, and Strumsky Reference Bettencourt, Lobo and Strumsky2007; Bettencourt et al. Reference Bettencourt, Lobo, Strumsky and West2010). Third, individuals in more populous cities tend to have more social connections than individuals in less populous cities (Schläpfer et al. Reference Schläpfer, Bettencourt, Grauwin, Raschke, Claxton, Smoreda, West and Ratti2014). Finally, more populous metropolitan areas possess a more extensive division of labor and greater degrees of productive specialization on average (Bettencourt Reference Bettencourt2014; Bettencourt et al. Reference Bettencourt, Samaniego and Youn2014).
Researchers have been aware of some of these allometries for decades (Batty Reference Batty2008; Glaeser and Gottlieb Reference Glaeser and Gottlieb2009; Glaeser and Sacerdote Reference Glaeser and Sacerdote1999; Nordbeck Reference Nordbeck1971; Samaniego and Moses Reference Samaniego and Moses2009), but only recently have they appreciated that these relationships have specific quantitative values. So if the functional form of these relationships is Y(N) = Y 0 N β, with Y 0 being a baseline value (a y-intercept) and N being a city population, the exponent β is typically about 5/6 when Y is a measure of infrastructure or the division of labor, and about 7/6 when Y is a measure of aggregate interaction or socioeconomic output (Bettencourt Reference Bettencourt2013; Bettencourt et al. Reference Bettencourt, Lobo, Strumsky and West2010).
In the past few years, researchers have developed mathematical models that derive these typical exponents from first principles (Bettencourt Reference Bettencourt2013, Reference Bettencourt2014; Ortman et al. Reference Ortman, Cabaniss, Sturm and Bettencourt2014). The basic ideas embedded in these models are as follows: (1) human settlements are first and foremost concentrations of human interaction; (2) given a set of energetic constraints imposed by technology and institutions, people arrange themselves in space and create infrastructural networks so as to balance the costs of moving around with the benefits of the resulting interactions; and (3) socio-economic rates are proportional to interaction rates. The parameters of these models—the cost of moving around, the average energetic benefit of social interaction, the typical distance traveled per person and per unit time, a number of people, and a settled area—are very general and are not tailored to the specific technologies and institutions of the modern world. Yet, as several studies show, they succeed remarkably well in predicting the aggregate properties of modern cities (Bettencourt Reference Bettencourt2013; Bettencourt, Lobo, Helbing et al. Reference Bettencourt, Lobo, Helbing, Kühnert and West2007; Bettencourt and Lobo Reference Bettencourt and Lobo2016).
These details lead to a surprising possibility: if, in fact, urban scaling models explain observed patterns in modern cities, and the parameters of these models are characteristics of any social network embedded in space, then it stands to reason that settlements of a wide range of societies should exhibit the same relative scaling properties. In other words, although urban scaling theory was initially developed to explain empirical regularities in modern cities, the framework itself may capture basic properties of human settlements at any scale, and of any time or place. Anthropologists have long been aware of cross-cultural relationships between community population size and social complexity (Carneiro Reference Carneiro1967, Reference Carneiro2000; Chick Reference Chick1997; Feinman Reference Feinman2011; Naroll Reference Naroll1956), so the idea of systematic relationships between population and other properties of human settlements is not surprising. What may be surprising, however, is the notion that these relationships might have specific, predictable values that are invariant across contexts.
Previous studies show that several predictions of settlement scaling theory are in fact borne out by archaeological data from the prehispanic Basin of Mexico (Ortman et al. Reference Ortman, Cabaniss, Sturm and Bettencourt2014; Ortman et al. Reference Ortman, Cabaniss, Sturm and Bettencourt2015) and historical data for Medieval Europe (Cesaretti et al. Reference Cesaretti, Lobo, Bettencourt, Ortman and Smith2016). These results provide an important proof of concept, but they are not ideal because these societies share a number of properties with modern systems, including cities, class stratification, markets, and productive specialization. Stronger evidence comes from the Central Andes, where prehispanic societies did not have cities or markets (Ortman et al. Reference Ortman, Davis, Lobo, Smith and Cabaniss2016); but the strongest possible test should involve data from middle-range societies, which, in addition to lacking cities and markets, had less pronounced social differentiation and only modest productive specialization. Here we show that settlements for two middle-range societies from native North America also exhibit properties predicted by settlement scaling theory.
Settlement Scaling Models
In the following paragraphs, we derive several simple models that describe how several aggregate properties of human settlements change as their populations grow (these models are also presented elsewhere; interested readers may wish to read these sources for additional background and details [Bettencourt Reference Bettencourt2013, Reference Bettencourt2014; Ortman et al. Reference Ortman, Cabaniss, Sturm and Bettencourt2014; Ortman et al. Reference Ortman, Cabaniss, Sturm and Bettencourt2015; Ortman et al. Reference Ortman, Davis, Lobo, Smith and Cabaniss2016]).
The models we discuss are mean-field models in that they hypothesize what the average relationship between settlement population and a variety of aggregate quantities should be across the settlements of a given social and cultural context. They are also reductionist in that they suggest that this average relationship derives from a small set of factors related to the properties of social networks embedded in space. There are obviously a wide range of social, cultural, and economic factors that contribute to the unique character of any specific settlement, and in presenting these models we do not mean to suggest that any of these factors is unimportant or uninteresting. What we do argue, however, is that scientific progress depends on the abstraction of general properties and relationships from the mass of details, and the most rigorous way of doing this is to (1) hypothesize what the most important factors are behind a given phenomenon, (2) turn these into equations specifying how these factors are related, and then (3) test the resulting predictions against new observations. We do not mean to suggest that this is easy. All attempts to formalize aspects of human behavior (neoclassical economics, dual inheritance theory, behavioral ecology, etc.) have their weaknesses, and there are many interesting and important aspects of human behavior that we cannot imagine how to formalize at present. But this does not mean that formalization should not be a desired goal, as the right equations provide a strong basis for prediction, and this is what archaeologists must do if we are to convince diverse and skeptical audiences that the things we learn through archaeology are relevant to today. To the extent that the models developed here successfully predict average properties of settlements across a wide range of societies, we believe they have significant promise for a policy-relevant archaeology.
The most fundamental assumption of our approach is that when people create settlements, they arrange themselves in space so as to balance the costs of moving around inside the settlement with the benefits that accrue from the resulting social interactions. When settlements are relatively small and unstructured spatially, the cost c of maintaining a mixing population for the average individual within the settlement is given simply by c = εL, where ε is the energetic cost of movement (the metabolic cost of walking and carrying things) and L is the diameter across the (roughly circular) area. Note that in this circumstance the diameter is proportional to the square root of the area, L ~ A
1/2. Also, the number of interactions the average resident will have with others, assuming people are distributed evenly across the settlement, is given by i = a
0
lN/A, where l is the average length of the path traveled by an individual per unit time (think of daily travel), a
0 is the distance at which interaction occurs (think of it as the width of a path of length l), and N/A is the population density of the settlement (the notion that people are distributed homogeneously within settlements is obviously not true in detail, but it is adequate for a mean field model of what goes on inside a settlement). These interactions can then be translated into benefits y, by considering that there is some average energetic benefit of an interaction, across all types of interactions that can occur, which we represent as $\hat{g}$
, such that
$\hat{g}$
, such that $y = \hat{g}{a_0}lN/A$
. Then, if one assumes that there is an equilibrium, on average, between the costs and benefits of interaction, one can set c = y:
$y = \hat{g}{a_0}lN/A$
. Then, if one assumes that there is an equilibrium, on average, between the costs and benefits of interaction, one can set c = y:
 $$\begin{equation*}
\varepsilon {A^{1/2}} = \hat{g}{a_0}lN/A.
\end{equation*}$$
$$\begin{equation*}
\varepsilon {A^{1/2}} = \hat{g}{a_0}lN/A.
\end{equation*}$$
One can simplify this equation by recognizing that in a given sociocultural milieu, $\hat{g}$
, a
0, and l are properties of the average individual and thus are effectively constant. As a result, the product of these three parameters will also be a constant, and this allows one to define
$\hat{g}$
, a
0, and l are properties of the average individual and thus are effectively constant. As a result, the product of these three parameters will also be a constant, and this allows one to define $G = \hat{g}{a_0}l$
. One can think of G as the attractive force the average individual exerts on others as a result of her daily movements. One can thus replace
$G = \hat{g}{a_0}l$
. One can think of G as the attractive force the average individual exerts on others as a result of her daily movements. One can thus replace $\hat{g}{a_0}l$
with G and rearrange the relation above, leading to:
$\hat{g}{a_0}l$
with G and rearrange the relation above, leading to:
 $$\begin{equation}
A\left(N\right) = {\left({G/\varepsilon } \right)^{2/3}}\ {N^{2/3}}\ .
\end{equation}$$
$$\begin{equation}
A\left(N\right) = {\left({G/\varepsilon } \right)^{2/3}}\ {N^{2/3}}\ .
\end{equation}$$
Equation 1 can be simplified further by defining a = (G/ε)2/3 and α = 2/3, yielding:
 $$\begin{equation}
A\left(N\right) = a{N^\alpha }.
\end{equation}$$
$$\begin{equation}
A\left(N\right) = a{N^\alpha }.
\end{equation}$$
What Equation 2 says is that, on average, the total area taken up by a relatively “amorphous” settlement of population N grows proportionately to the settlement population raised to the α = 2/3 power, such that more populous settlements become progressively denser in an open-ended way. Note also that the coefficient or prefactor of this relationship a = (G/ε)2/3 varies in accordance with social attraction and transportation costs, but is independent of population.
Equations 1 and 2 apply to small and spatially unstructured settlements, but as settlements grow, the inhabitants must begin to set aside a portion of the settlement area as an access network An of roads, paths, and other public spaces so that residents can continue to move around and mix socially. We assume that, on average, the area d set aside per person is done so in accordance with the current population density, such that d ~ (A/N)1/2. One can think of d as the area of the path in front of each person's residence in a settlement, which would necessarily get smaller on average as the population density increases. Under this model, the total area of the access network is:
 $$\begin{equation}
A_n \sim Nd = A^{1/2}N^{1/2}.
\end{equation}$$
$$\begin{equation}
A_n \sim Nd = A^{1/2}N^{1/2}.
\end{equation}$$
From here, one can substitute aN 2/3 for A in Eq. 3 and simplify, leading to:
 $$\begin{equation}
A_n\sim a^{1/2}N^{5/6}.
\end{equation}$$
$$\begin{equation}
A_n\sim a^{1/2}N^{5/6}.
\end{equation}$$
Equation 4 argues that, as settlements in a given context grow, movement and interaction become increasingly structured by the access network, and as a result the area taken up by “networked” settlements grows with population more rapidly than in an amorphous settlement, namely, in accordance with the settlement population to the α = 5/6 power. So, as settlements grow in size and formality, there is still an economy of scale, but the exponent of the growth rate of settled area with population increases slightly, from α = 2/3 → 5/6.
Finally, we propose that the socioeconomic outputs Y generated by a settlement are, on average, proportional to the total number of social interactions that occur among its inhabitants per unit time. This notion, that increasing productivity derives from the concentration and intensification of social interaction, is the basic idea behind economics models of agglomeration effects (Glaeser et al. Reference Glaeser, Kallal, Scheinkman and Shleifer1992; Glaeser et al. Reference Glaeser, Scheinkman and Shleifer1995; Hausmann and Hidalgo Reference Hausmann and Hidalgo2011; Jones and Romer Reference Jones and Romer2010). Given this, and the assumption that settlements support as much mixing as is possible given spatial constraints, we can write:
 $$\begin{equation}
Y\left(N\right) = GN\left({N - 1}\right)/A \approx G{N^2}/A,
\end{equation}$$
$$\begin{equation}
Y\left(N\right) = GN\left({N - 1}\right)/A \approx G{N^2}/A,
\end{equation}$$
where G once again represents the net social attraction of an individual's movements and interactions, and one can compute the expected scaling of outputs relative to population by substituting aN 2/3 for A in the case of amorphous settlements, and a 1/2 N 5/6 for A in the case of networked settlements. This leads to:
 $$\begin{equation}
Y\left(N\right) \propto {N^{2 - \alpha }},
\end{equation}$$
$$\begin{equation}
Y\left(N\right) \propto {N^{2 - \alpha }},
\end{equation}$$
with 2/3 ⩽ α ⩽ 5/6. This in turn implies an average per capita output of:
 $$\begin{equation}
y = Y/N = GN/A \propto {N^\delta },
\end{equation}$$
$$\begin{equation}
y = Y/N = GN/A \propto {N^\delta },
\end{equation}$$
with 1/6 ⩽ δ ⩽ 1/3. This means that, as human settlements increase in population, their average per capita socioeconomic outputs grow proportionately to population raised to the δ power, and their total aggregate outputs grow proportionately to population raised to the 1 + δ power. In other words, there are increasing returns to scale, such that more populous settlements are more productive per capita.
The models derived in this section are very simple, and their assumptions are realistic only at the level of the overall settlement. Yet the resulting equations represent testable hypotheses regarding the average relationship between population and a variety of other properties of human settlements and, as mentioned earlier, the relationships predicted by these models have been observed in a wide range of societies, past and present. Below, we show that settlement data from middle-range societies are also consistent with these models. But before doing so, we briefly discuss some of the empirical issues involved in testing settlement scaling models using archaeological data.
Testing Settlement Scaling Theory
Several previous archaeological studies examine allometric relationships between settlement population and area, and these reach varying conclusions regarding the degree to which the relationship is linear, sublinear, or superlinear (Naroll Reference Naroll1962; Schrieber and Kintigh Reference Schrieber and Kintigh1996; Whitelaw Reference Whitelaw, Parker Pearson and Richards1994; Wiessner Reference Wiessner1974). We cannot review these studies here, but we do point out that previous studies have often been hampered by shortcomings in the data used. Thus, it is important to discuss issues related to the data requirements for archaeological scaling analysis.
The first and most important requirement is a suitable proxy for settlement population that can be applied consistently across a range of settlement sizes. In addition, population must be estimated in such a way that the population densities of settlements can vary. Thus, a common method of estimating population, which involves multiplying site areas by a constant population density (Johnson Reference Johnson and Hole1987; Naroll Reference Naroll1962; Wright Reference Wright and Rothman2001), will not yield suitable data. Probably the most reliable population proxy is the number of houses in settlements, but the use of house counts is complicated when individual house occupations were much shorter than settlement occupation spans, or when it is difficult to identify individual houses from surface remains. For example, in many archaeological sites, habitation areas are definable but individual houses are not due to the sharing of walls, insubstantial construction, or poor preservation. An additional issue is the variable relationship between preserved archaeological remains and the actual population histories of settlements. In most cases, one has no choice but to assume that the actual population of a settlement at the time it reached its measured extent was on average proportional to the number of observable houses within this area; but this means the data being compared may not represent a momentary snapshot of a society. Fortunately, this is not an issue for scaling analysis because the theory addresses patterns in the properties of individual settlements, not the distribution of population across settlements (as in rank-size analysis).
A second requirement is that settlement areas should be estimated by one or a few investigators using consistent methods, or by a large enough number of investigators that interobserver variation is balanced out. A typical method of estimating the areas encompassed by small settlements is to measure the length and width of the archaeological remains and compute the area of an ellipse defined by these dimensions. This method is compatible with settlement scaling models, but the level of precision of the underlying measurements can become an issue. To some extent, this is a practical response to the variety of taphonomic processes that affect the archaeological record. But when archaeological data for a given society have accumulated through the collective efforts of many researchers, site area datasets are often a hodgepodge of data collected in a variety of ways. One needs to keep this reality in mind.
Third, the data need to encompass the entire range of settlement sizes. This is a problem more often than one might think. In studies of early civilizations, for example, methods are often tailored to practical problems related to recording the largest settlements, and, as a result, many smaller settlements are either overlooked or measured at the same level of precision as the largest settlements (Parsons Reference Parsons1971; Sanders et al. Reference Sanders, Parsons and Santley1979). The latter case can be problematic because the parameters of scaling relations are typically estimated through ordinary least-squares regression of log-transformed data. Since the raw measurements are converted to logarithms as part of the analysis, relatively imprecise data for the largest settlements make little difference in the results, but similarly imprecise data for the smallest settlements can make a big difference. Imprecise measurement of small settlements leads to blocky or “fat” lower tails of archaeological data distributions in log-log scatterplots (for an example, see Figure 3) and can potentially skew scaling parameter estimates. Precision is not critical when one is working with modern cities because aggregate measures for these settlements vary over many orders of magnitude and the minimal measurements are already quite large numbers. However, in middle-range societies, measures typically vary over only three orders of magnitude at best. As a result, scaling analysis is less robust with respect to errors or imprecision in measurement of the smallest sites. The best ways to counteract this problem are to record smaller sites more precisely or to work with large samples to cancel out errors and imprecision in measurement of small sites. The two case studies considered below exemplify these alternatives.
Due to these empirical issues, appropriate data for scaling analysis either do not exist or are not available for many past societies. And, in other cases, data may exist but proxy measures for population or socioeconomic outputs are calculated in such a way that they preclude the possibility of scaling relationships. Fortunately, the archaeological record of some past societies does preserve the raw material for appropriate measures, and some of these records have been investigated in such a way that it is possible to estimate population, settled area, and socio-economic output for the full range of settlement sizes at a reasonable level of precision. Here, we work with data from two such societies.
Materials and Methods
The analysis that follows uses archaeological settlement data from two native North American societies. Both were village-level societies with economies focused on maize agriculture, a modest division of labor beyond the household, and only informal political integration above the village level. Both created settlements that have clear boundaries, were inhabited for relatively short periods, and contain houses that are visible on the modern ground surface. In addition, both societies have been studied intensively over many decades, resulting in large amounts of relatively high-quality data.
The Central Mesa Verde Region
Our first case is the ancestral Pueblo society of the Central Mesa Verde region in southwest Colorado. The building blocks of settlements in this society were highly standardized household residences that leave robust archaeological expressions (Figure 1). These “unit pueblo” residences are defined by a central, circular pit structure, an associated, small surface room-block, and a trash midden located to the south or downslope of the pit structure. The households associated with these residences were the basal units of production and reproduction in this society (Bradley Reference Bradley1993; Cater and Chenault Reference Cater and Chenault1988; Kuckelman Reference Kuckelman and Kuckelman2000; Lightfoot Reference Lightfoot1994; Lipe Reference Lipe, Lipe and Hegmon1989; Ortman Reference Ortman and Spielmann1998; Varien Reference Varien1999). Most settlements were single-family farmsteads, but villages containing more than 100 houses also occur.
Sand Canyon Pueblo, a thirteenth-century Central Mesa Verde village, illustrating surface stone rubble areas, pit structure (kiva) depressions, and a sample of excavated houses. Map courtesy of Crow Canyon Archaeological Center.
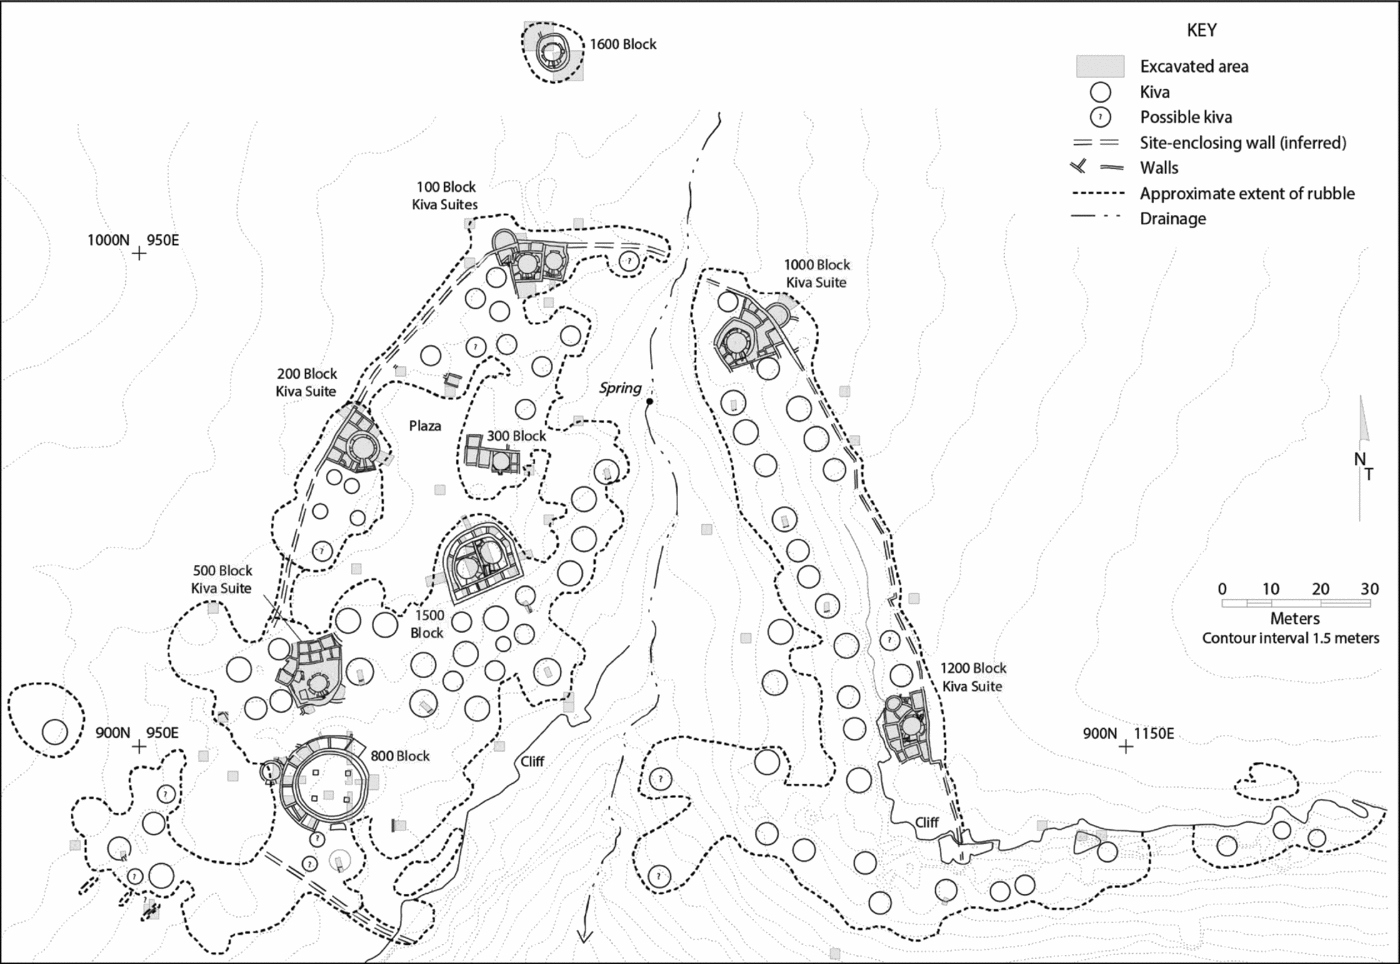
We focus on the period between AD 1060 and 1280 for several reasons. First, most settlements were constructed of sandstone masonry during this period. These stone masonry buildings were much more substantial than earlier constructions of earth and wood, were inhabited for longer periods, and were rarely razed and built over (Cameron Reference Cameron1990; Lightfoot Reference Lightfoot1994; Varien and Ortman Reference Varien and Ortman2005). Although the sizes of these settlements changed over time, in most cases, it is reasonable to assume that the entire architectural footprint of a village was inhabited at some point. Second, the stone-lined pit structures of this period are identifiable today as fairly deep and well-marked depressions, allowing archaeologists to make accurate house counts and house area measurements. Third, these stone settlements are typically surrounded by relatively dense artifact scatters that are easy to see and measure. So it is straightforward to measure the area encompassed by stone masonry and to obtain at least a minimal site area, although there is interobserver variation in the definition of site boundaries that is generally more pronounced for smaller settlements than for larger villages.
Finally, this period in Central Mesa Verde society has been studied intensively over many decades, most recently by the Village Ecodynamics Project (Kohler et al. Reference Kohler, Bocinsky, Cockburn, Crabtree, Varien, Kolm, Smith, Ortman and Kobti2012; Kohler et al. Reference Kohler, Johnson, Varien, Ortman, Reynolds, Kobti, Cowan, Kolm, Smith, Yap, Kohler and van der Leeuw2007; Kohler and Varien Reference Kohler and Varien2012). As a result, teams of researchers have put considerable effort into compiling data from cultural resource databases and the extensive local literature to reconstruct the population histories of individual settlements and the larger region (Ortman et al. Reference Ortman, Varien and Lee Gripp2007; Varien et al. Reference Varien, Ortman, Kohler, Glowacki and Johnson2007). Recently, we have augmented existing site area, pit structure count, and room-block area estimates for all recorded settlements in this area by digitizing the best available map of every settlement containing eight or more houses for which a map exists, including new maps from VEP field work (Glowacki Reference Glowacki2012; Glowacki and Ortman Reference Glowacki, Ortman, Kohler and Varien2012). The resulting measurements are incorporated into a settlement pattern reconstruction for the VEP II Colorado study area (Schwindt et al. Reference Schwindt, Bocinsky, Ortman, Glowacki, Varien and Kohler2016). We use the settlement database from this project, incorporating information from all settlements associated with three or more houses, settled area estimates, and total room-block area estimates. We chose a cutoff of three houses because this seemed to be the smallest possible settlement in which the spacing of houses might capture the balance of costs and benefits associated with interaction between houses. The data for settlements associated with three to seven houses represents a compilation of data from many sources in which significant interobserver variation exists. However, the data for all settlements associated with eight or more houses have been recorded consistently.
The Middle Missouri Region
The second society we consider is the ancestral Mandan and Hidatsa society of the Middle Missouri region, primarily in North Dakota. We focus on the period between AD 1200 and 1886, which corresponds to the agricultural village tradition of the northern Middle Missouri. The building blocks of villages in this society were earth lodges—partly subterranean timber-framed or post-and-beam structures with packed-earth walls (Figure 2). These lodges left clear rings and depressions on the modern ground surface, as well as subsurface traces that can be picked up through geophysical survey when surface preservation is poor (Kvamme and Ahler Reference Kvamme and Ahler2007; Mitchell Reference Mitchell2008). Continuity with ethnographic descriptions of Mandan and Hidatsa communities demonstrates that earth lodges were domestic residences (Bowers Reference Bowers1950, Reference Bowers1965). Thus, for many settlements, the total number of lodges, and therefore households, is known. Lodge sizes vary somewhat, and due to the long history of excavation and remote sensing, the floor areas of individual houses are available for many villages.
Larson Village, a Middle Missouri village, illustrating surface features. The houses within the innermost fortification date from the eighteenth century; the entire settlement was inhabited during the sixteenth century; portions have eroded into the Missouri River floodplain. Map courtesy of Mark Mitchell.
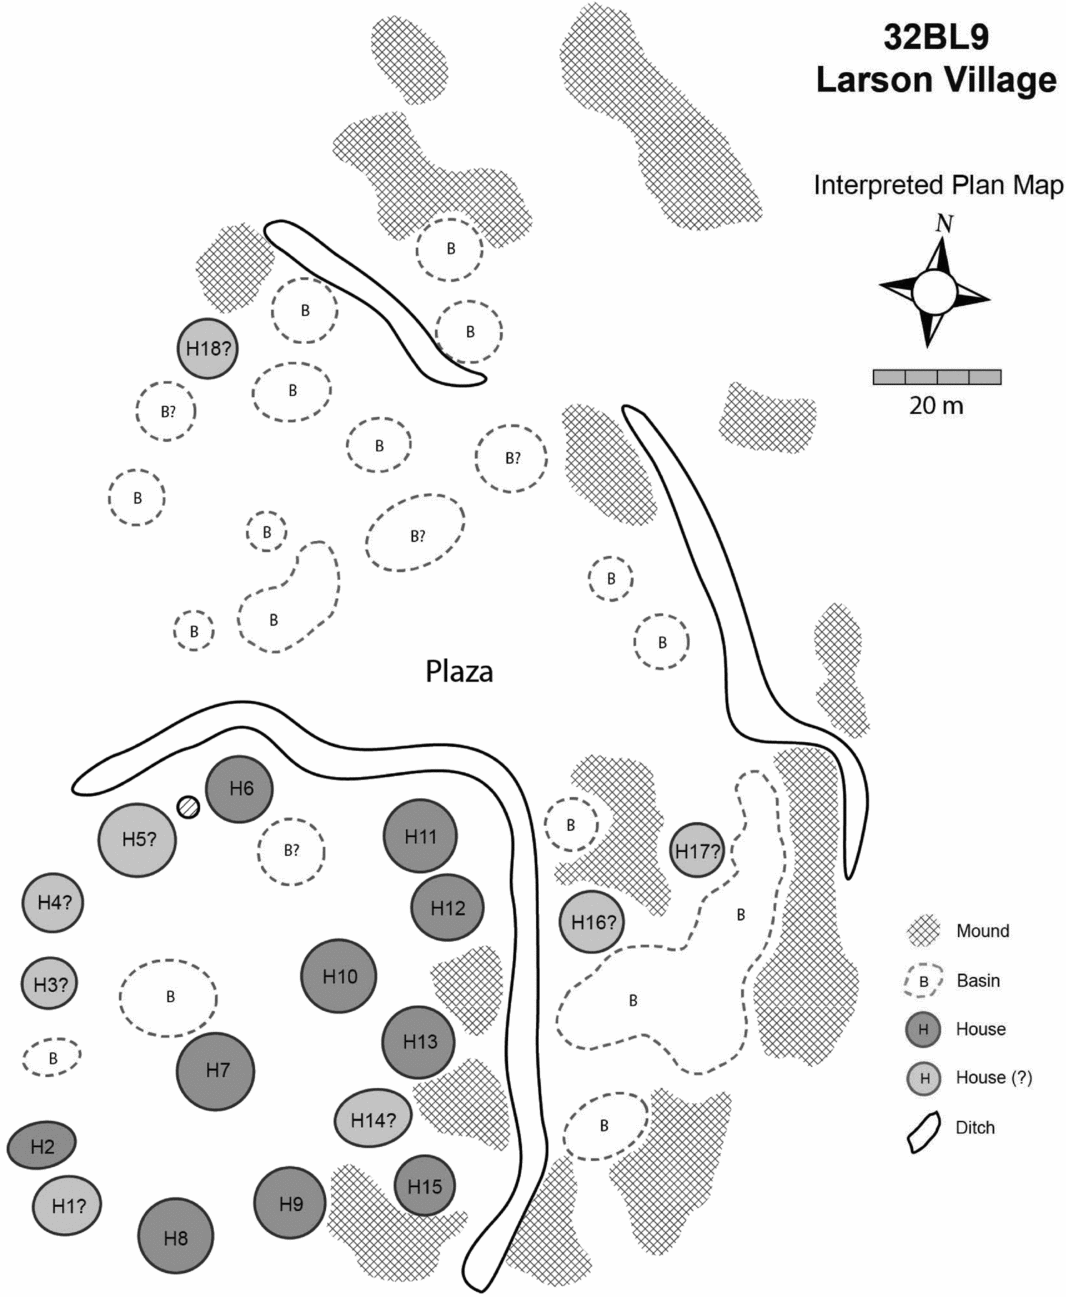
Settlements were constructed on terraces above and outside the Missouri River floodplain and were often defined by ditches or other fortifications. These are often visible on the modern ground surface or are identifiable through remote sensing (Kvamme and Ahler Reference Kvamme and Ahler2007). As a result, it is relatively straightforward to define village boundaries and to count the houses within them. Settlements range from a few to more than 100 earth lodges. The occupation spans of these villages vary, and some were rebuilt and reoccupied multiple times (Johnson Reference Johnson2007). Fortunately, when this occurred, houses were often rebuilt on the foundations of old ones (Fenn Reference Fenn2014), and it is often possible to distinguish distinct occupations (Kvamme and Ahler Reference Kvamme and Ahler2007). Recent studies of the economies of these communities show an emphasis on domestic production, with evidence of part-time community specialization and increasing household productivity during periods of larger community sizes (Mitchell Reference Mitchell2013).
The archaeology of the Middle Missouri region is not as well-known or as intensively studied as that of the Central Mesa Verde region, but due to long-term efforts by a group of dedicated researchers and a large volume of salvage archaeology related to reservoir construction, the local literature contains many useful data for these settlements. A recent synthesis and evaluation of the archaeological information by Mitchell (Reference Mitchell2013) provides a suitable dataset for this analysis. We have augmented Mitchell's dataset with additional estimates from archaeological and documentary evidence (Table 1). Although small, the dataset is of generally high quality and contains, for the most part, data that derive from consistent methods, often involving excavation and geophysical survey.
Middle Missouri Settlement Data.

Note: All data are from Mitchell (Reference Mitchell2013) unless otherwise noted.
a “N” indicates that an unknown portion of the village has eroded away. For these cases, we assume patterns in the preserved portions are representative of patterns in the whole.
b “Y” indicates the presence of fortification ditches and banks surrounding all or a portion of the settlement.
c “Y” indicates the presence of a plaza within the site area.
d Estimated from the enclosed area based on the mean house density of other large villages in the region (Mitchell Reference Mitchell2008:77).
e Estimated from the mean house density of other large villages in the region (Swenson Reference Swenson, Ahler and Kay2007).
f Features labeled “house” or “house?” in Figure 2 (Mitchell Reference Mitchell2008).
g Data derived from historic maps by Swenson (Reference Swenson, Ahler and Kay2007).
h The total site footprint is assumed to correspond to the sixteenth-century occupation, with contraction during historic times based on patterns observed at Double Ditch and Larson.
i Also known as Mih-tutta-hang-kusch.
j McChesney's 1872 tabulation of inhabited houses (Smith Reference Smith1972:25-30).
Expectations
The settlements of both societies we examined were relatively small, and only the very largest villages from the Central Mesa Verde contain evidence of formalized paths that facilitated within-settlement movement. In addition, the areas of most settlements in both regions are defined as elliptical circumscribing areas on the basis of artifact scatters or boundary features (walls, banks, ditches). Thus, one would expect the amorphous settlement model (Eq. 1–2) to apply to settlements from these societies. In addition, the best population proxy in both cases is the number of houses, and thus households, in a settlement. Although these settlements were inhabited for varying lengths of time, we think it reasonable to assume that the actual number of households living within measured settlement areas was, on average, proportional to the number of observable houses within these areas, such that errors in actual household estimates are effectively random. If these assumptions are reasonable, and if it is appropriate to measure population in terms of households, then one would expect the average relationship between house count N and settlement area A to be A = aN α, with α ≈ 2/3 and a reflecting the area taken up by an individual household in the smallest settlements.
In addition, settlement scaling theory hypothesizes that the productivity of an economic unit is proportional to the number of interactions that unit has with others per unit time. Thus, households in larger settlements should be more productive on average. Household productivity should in turn be reflected in the total roofed space under which household members lived and under which they stored and consumed their possessions. The basis for this conclusion is that, in past societies, most of a household's wealth was material—taking the form of food, manufactured goods, or valuables—and these took up space and thus needed to be stored in the house. This view is supported by studies of house area distributions from a variety of past societies (Abul-Megd Reference Abul-Megd2002; Blanton Reference Blanton1994; Bodley Reference Bodley2003; Hirth Reference Hirth, Santley and Hirth1993; Maschner and Bentley Reference Maschner, Bentley, Bentley and Maschner2003; Morris Reference Morris2004), and evidence from the Middle Missouri region also suggests that changes in house size over time reflect changes in productivity as opposed to household composition (Mitchell Reference Mitchell2013). Given this, one would expect average house area to increase with settlement house count according to y = y 0 N δ (Eq. 7), with 1/6 ⩽ δ ⩽ 1/3 and y 0 reflecting the average area of a house in the smallest settlements. In turn, one would expect the total productivity, as proxied by the total area encompassed by houses in a settlement, to vary with house count according to Y = Y 0 N 1 + δ, where Y 0 reflects the average house area in the smallest settlements (note that this is a somewhat different quantity than the area taken up by a household in the smallest settlements, a, as the latter includes extramural use areas as well).
Finally, given that per capita (household) productivity y = GN/A (also after Eq. 7), and $G = \hat{g}{a_0}l$
is a combination of several factors that are independent of population, estimates of social attraction, G, for individual settlements should vary independently of house count. G can be estimated for individual settlements as Gi
= yiAi
/Ni
, and although one would expect it to vary across settlements for a variety of reasons, theory suggests that this variation should be independent of N. Thus, the exponent γ of the scaling relation between G and N, G(N) = G
0
N
γ, should be approximately zero, and the correlation between these two variables should also be approximately zero.
$G = \hat{g}{a_0}l$
is a combination of several factors that are independent of population, estimates of social attraction, G, for individual settlements should vary independently of house count. G can be estimated for individual settlements as Gi
= yiAi
/Ni
, and although one would expect it to vary across settlements for a variety of reasons, theory suggests that this variation should be independent of N. Thus, the exponent γ of the scaling relation between G and N, G(N) = G
0
N
γ, should be approximately zero, and the correlation between these two variables should also be approximately zero.
The expected range of δ requires further comment. Under the amorphous settlement model, we assume that houses are sufficiently dispersed and unorganized that interaction between households is accomplished through travel along straight paths such that the distance L needed to traverse the settlement is simply its transverse dimension, L ~ A 1/2. These conditions lead to an expected exponent of α = 2/3 for the relationship between population and settled area, and thus a per-household productivity of y = GN/A = GN/aN 2/3∝N 1/3. However, even in amorphous villages, movement becomes constrained by the distribution of houses, and one would expect this constraint to increase as the size and density of the village increases. Under these conditions, paths across the settlement become progressively longer than the transverse dimension. Thus, in compact villages one might expect the morphology of typical paths to approach that found in “networked” cities organized around transportation infrastructure, in which α = 5/6 and thus y = GN/A = GN/aN 5/6∝N 1/6. As a result, one might expect the value of δ to range between 1/6 and 1/3, even if the value of α remains close to 2/3 in these data.
To evaluate these expectations, we estimate a, α, y 0, Y 0, and δ through ordinary least-squares regression of log-transformed data. This is feasible because y = bxm and log y = mlog x + log b are equivalent. We also provide a measure of Gi for individual settlements by multiplying the mean house area by the settled area, and then dividing by the house count.
Results
General Results
The results of our analyses, presented in Table 2, show that the expectations described above are met for the most part. First, in both societies, the 95% confidence intervals for α do not include 1, and the point estimates are very close to 2/3. Thus, the relationship between population (house count) and area is almost certainly sublinear and exhibits an economy of scale, with α ≈ 2/3, as predicted by the amorphous settlement model. Second, in both societies, the rate of increase in mean house area with population is δ ≈ 1/6, and the 95% confidence interval for δ excludes zero (or one in the case of 1 + δ). This means that the relationship between population and economic output is almost certainly superlinear and exhibits increasing returns to scale at a level consistent with theory. Note that, in the Central Mesa Verde case, we estimated 1 + δ, whereas in the Middle Missouri case we estimated δ directly, because in the former case we have only the total house area for each settlement, whereas in the latter we have only house areas for a subsample of excavated houses. We assume that the mean house area in the subsample is a reasonable approximation of the mean house area across all houses in each settlement. We do not know the degree to which this is true for any single site, but the results suggest that any errors in our estimates for mean house area across settlements are unstructured relative to the house count.
Scaling Results for the Central Mesa Verde and Middle Missouri Regions.

a Population ranges: Central Mesa Verde, 3–192 houses; Middle Missouri, 4–175 houses.
b In all cases, the independent variable is population (house count).
c Gi for each settlement is estimated by Gi = yiAi /Ni , where yi is the mean house area, Ai is the settled area, and Ni is the house count.
We also note that the exponent δ, which relates household productivity to settlement population, is much closer to 1/6 than to 1/3. This is not surprising given the density of houses in villages from both societies. This would have required people to take more circuitous paths to interact with village-mates, and thus a scaling of interaction with area that is closer to that observed in networked settlements.
Finally, our measure of social attraction, G, is clearly independent of N for the Middle Missouri data, and is most likely independent of N for the Central Mesa Verde data. In both cases, the R2 value of the relationship is practically zero, and the confidence interval for the exponent incorporates or very nearly incorporates zero. The p-value of the Central Mesa Verde relationship suggests that G may be slightly negatively correlated with N in this case, but in light of the low R2 and confidence interval, we interpret this result as due to overgenerous site area estimates for some small settlements deriving from use of a low artifact density threshold to define site boundaries. This would have resulted in inflated G values for those sites relative to larger ones and increased the negative slope of the relationship. So, overall, our results suggest that the “social attraction” exerted by individuals in both societies was independent of settlement population, as predicted.
These results indicate that both economies of scale with respect to settled area, and increasing returns to scale with respect to house area, are apparent in the settlement data from these two societies. Further, the magnitudes of these economies and returns are consistent with models that predict their observed values in modern urban systems. These results thus suggest that the allometric properties observed for these village-level societies derive from the same social networking processes that lead to scaling phenomena in modern cities.
It is also remarkable to note that the prefactors (coefficients) of the average scaling relations are quite similar for these two societies: the estimated average area taken up by a household (both the house itself and adjacent extramural areas) in the smallest settlements was 0.21 ha in the Central Mesa Verde and 0.27 ha in the Middle Missouri, and the average house area in single-household settlements is estimated at 56 m2 in the Central Mesa Verde and 63 m2 in the Middle Missouri (this is because the mean house area equals the total house area, y 0 = Y 0, when N = 1). These similar values are striking given the different data collection methods used to generate these data. In the Central Mesa Verde, for example, settled area is most often defined by the extent of the surrounding artifact scatter, whereas in the Middle Missouri, it is most often defined by fortifications or house distributions combined with terrace edges. Likewise, in the Central Mesa Verde, archaeologists recorded only the total house area across all households using surface evidence, whereas in the Middle Missouri, they estimated mean house areas from excavated houses in various sites. Yet Figure 3 shows that, if one multiplies these mean house areas by the number of houses for the Middle Missouri data and then plots the results on the same axes as the Central Mesa Verde data for total house area, the scaling relationship is nearly identical.
Relationship between settlement population (house count) and total productivity. For the Central Mesa Verde system, Y is the total roofed area; for the Middle Missouri system, Y = yN, where y is the mean area of excavated houses and N is total house count. The nearly identical relationship in the two datasets implies that changes in average household productivity through time were due to changes in community scale as opposed to agricultural production or technology.

The close similarity of the scaling parameters for these two societies may seem surprising in light of the many differences between them. For example, in the Central Mesa Verde, walking was the only means of traveling between settlements; however, Middle Missouri people used bull boats or canoes to transport goods and people along the river, dogs and travois to transport goods over land, and horses to move both goods and people after AD 1750. Also, the baseline productivity of agricultural land varied substantially in the two societies. Studies of agricultural yields suggest that traditional Mandan fields produced at least 1,200 kg/ha on average (Mitchell Reference Mitchell2013), whereas Central Mesa Verde fields produced only 250–400 kg/ha (Varien et al. Reference Varien, Ortman, Kohler, Glowacki and Johnson2007). One would expect these dramatic differences in between-settlement transport technologies and agricultural productivity to have enabled higher regional population densities in the Middle Missouri, but these differences appear to have had little effect on settlement densities or the baseline productivity of households. The insensitivity of our analyses to between-settlement transportation technology and agricultural productivity is consistent with our theory because these factors are not incorporated in the models that derive settlement scaling relationships. However, within-settlement transport costs are incorporated into these models, and in both societies the only way of moving people and goods within settlements was on foot. Given this, similarities in the observed results make more sense than they may appear to at first.
Context-Specific Results
An important aspect to consider with regard to the Middle Missouri data is the long period of time represented, as there is no a priori reason to presume that the relationships between population, settled area, and socioeconomic rates should have been stable over a period of more than six centuries. Indeed, recent studies suggest that mean house areas, storage pit count and density, internal settlement densities, and the intensity of craft production all increased through time (see Mitchell Reference Mitchell2013). To investigate this issue, Figure 4 illustrates the relationship between population (house count) and settlement area for the Middle Missouri data, with groups of sites labeled by time period. Each interval, of about 200 years, is roughly equivalent to the entire time span encompassed by the Central Mesa Verde data. There are visual suggestions in Figure 4 that the internal densities of Middle Missouri settlements changed through time, but the figure also suggests that the average population of settlements increased. This raises the question of whether changes in settlement density were due to increases in their baseline density or to increases in their average population. Based on the chronological analysis presented in Table 3, it appears that an increase in average settlement size is the more likely culprit because the differences in scaling exponents and prefactors calculated by chronological period are not statistically significant, whereas changes in average settlement population (house count) through time are. Also, note that settlement populations changed to a much greater extent than settlement areas over time, and this implies that the average population density of settlements changed as well. These results suggest that increases in the average density of northern Middle Missouri settlements through time were due primarily to increases in the scale of community organization as opposed to technological progress or increases in regional population density per se. This result mirrors that found in other studies of nonindustrial societies (Ortman et al. Reference Ortman, Cabaniss, Sturm and Bettencourt2015; Ortman et al. Reference Ortman, Davis, Lobo, Smith and Cabaniss2016) and it suggests that socioeconomic development prior to the Industrial Revolution was driven largely by factors that promote increases in the scale of strongly interacting social networks. This is a fascinating prospect for future research, and potentially for policy.
Relationship between settlement population (house count) and settled area, Middle Missouri region. Symbols reflect the time period of each settlement; the power-law fit is for all settlements. Although visual patterns suggest changes in the underlying relationship through time, this cannot be shown statistically (see Table 3).

Chronological Analysis of Northern Middle Missouri Settlements.

There is another area where scaling analysis reveals differences between the Middle Missouri and Central Mesa Verde systems. Although there is no clear relationship between G and N in either society, the value of G
0 is somewhat higher for the Middle Missouri system than it is for the Central Mesa Verde system. Since $G = \hat{g}{a_0}l$
, and both l and a
0 are defined by human biology and are thus effectively constant, the larger mean value of G for the Middle Missouri implies that the average energetic benefit of each social interaction,
$G = \hat{g}{a_0}l$
, and both l and a
0 are defined by human biology and are thus effectively constant, the larger mean value of G for the Middle Missouri implies that the average energetic benefit of each social interaction, $\hat{g}$
, was greater in that society. Why this should have been the case is an interesting question. One possibility is that the Middle Missouri floodplain was more productive than the Mesa Verde loess, so the higher value of G in the Middle Missouri may reflect the fact that there were more calories available for exchange in that society. Another possibility is that the social institutions of Middle Missouri society lubricated the flow of goods and services to a greater extent than those of Central Mesa Verde society. Ethnohistoric literature indicates that the Middle Missouri was a well-known trade center and that the Mandan and Hidatsa people inhabiting this region were skilled trade negotiators (Fenn Reference Fenn2014). In addition, native societies throughout the Great Plains used a set of ceremonies known as the calumet to forge trade partnerships that greatly facilitated intertribal exchange (Blakeslee Reference Blakeslee1975, Reference Blakeslee1981). In contrast, very little evidence of external trade or of inter-tribal ceremonies has been found in Central Mesa Verde sites (Lipe Reference Lipe and Lipe1992, Reference Lipe, Varien and Wilshusen2002). If these differences in between-group interaction were mirrored at the settlement level, social interaction may also have been more productive on an energetic level in the Middle Missouri than in the Central Mesa Verde.
$\hat{g}$
, was greater in that society. Why this should have been the case is an interesting question. One possibility is that the Middle Missouri floodplain was more productive than the Mesa Verde loess, so the higher value of G in the Middle Missouri may reflect the fact that there were more calories available for exchange in that society. Another possibility is that the social institutions of Middle Missouri society lubricated the flow of goods and services to a greater extent than those of Central Mesa Verde society. Ethnohistoric literature indicates that the Middle Missouri was a well-known trade center and that the Mandan and Hidatsa people inhabiting this region were skilled trade negotiators (Fenn Reference Fenn2014). In addition, native societies throughout the Great Plains used a set of ceremonies known as the calumet to forge trade partnerships that greatly facilitated intertribal exchange (Blakeslee Reference Blakeslee1975, Reference Blakeslee1981). In contrast, very little evidence of external trade or of inter-tribal ceremonies has been found in Central Mesa Verde sites (Lipe Reference Lipe and Lipe1992, Reference Lipe, Varien and Wilshusen2002). If these differences in between-group interaction were mirrored at the settlement level, social interaction may also have been more productive on an energetic level in the Middle Missouri than in the Central Mesa Verde.
Finally, it is important to emphasize that, although previous studies of settlement scaling in contemporary and archaeological contexts have used individuals as the units of population, this study obtains the same results when households are the population unit. This is good news for archaeologists because in many societies it is far easier to count houses than to determine the number of residents of each house. But this may also seem surprising given that household composition varies across households in individual settlements (Wilk Reference Wilk, Netting, Wilk and Arnould1984), within societies (Wilk and Netting Reference Wilk, Netting, Netting, Wilk and Arnould1984), and across societies (Blanton Reference Blanton1994). There must have been similar variation in the households considered here, but this seems to have had little effect on overall scaling relations. We can think of several factors that may underlie the insensitivity of scaling analysis to household composition. First, in middle-range societies, households are productive units and the division of labor is strong within households but replicated between them for the most part (Sahlins Reference Sahlins1972). Thus, even if each individual in a household has interactions with others in their community, these interactions are generally complementary rather than overlapping with regard to overall household needs. Second, social relations within households are typically characterized by generalized reciprocity, and economic decisions are generally made to benefit the household overall. Settlement scaling theory, in contrast, describes the dynamics of balanced reciprocity, and this realm is more characteristic of overall relations between households than to relations between each individual, even in modern societies. So it may be that households are the most appropriate unit of “mass” for scaling analysis, even in contemporary societies, and total population is merely a good proxy that is proportional to household count in most settings. Finally, in agricultural villages the primary impediment to movement and interaction is created by the distribution of houses and households, not people per se. Thus, one would expect the connectivity and intensity of interaction between people from different households to be influenced primarily by the physical arrangement of houses themselves.
Conclusions
The cities that most humans live in today are complex places with pronounced divisions of labor, intensive interaction across specializations, and massive flows of people and material throughout dense infrastructure networks. Agricultural villages, in contrast, appear to be much simpler places where the division of labor was limited above the household level, interaction was structured primarily by kinship, and the built environment was relatively unorganized. Such comparisons lead many researchers to view a city as a fundamentally different kind of thing than an agricultural village. From this perspective, the appearance of cities in history represents a watershed moment, and the remarkable economies and returns to scale noted in contemporary cities are seen as a product of urbanization—a process that did not occur in smaller-scale societies.
Our results cast doubt on this view and suggest that one should instead view contemporary cities as lying on a continuum with smaller forms of human settlement. Indeed, the results presented here are consistent with the idea that the productivity and division of labor that characterize present-day urban systems are actually properties of human social networks that expand exponentially and in an open-ended way with scale. This leads to the appearance of qualitatively different social processes in contemporary cities, when in fact these are just quantitative differences in expressions of the same processes. Since the properties of social networks are nonlinear, they lead to exponential changes in the use of space, productivity, knowledge, and the division of labor as the nodes in a social network grow—but the processes that generate these changes appear to have been part of human societies for as long as people have been creating permanent settlements that promote “organic solidarity” (Durkheim Reference Durkheim1984 [1893]) and expand the “extent of the market” (Smith Reference Smith2007 [1776]). Thus, from a scaling perspective, cities are simply bigger villages where the division of labor, levels of productivity, and rates of change are more pronounced due to the opportunities created by scale itself. For example, in Middle Missouri society, the archaeological record suggests a trend toward part-time specialization that correlates with agglomeration (Mitchell Reference Mitchell2013), but, given the small scale of these settlements, the effects were sufficiently modest that they affected household task mixes more than economic specialization of the kind we are familiar with from contemporary cities (also see Bettencourt Reference Bettencourt2014).
Our results, which demonstrate that scaling patterns observed in present-day urban systems are equally apparent in middle-range societies, suggest that settlement scaling theory captures basic and widespread aspects of human societies as social networks, at a level of abstraction where their effects are well-behaved and partly predictable, but not obvious or trivial. Social scientists make many generalizations about human social behavior, but few of these have been formalized in ways that yield specific, integrated, and novel predictions that are borne out by new data and that produce results that also make sense in light of contextual details. There are many important areas of human behavior that may never be amenable to this explicit, physical-science approach—but, given the accomplishments of the physical sciences in other fields, it seems important for archaeologists to take advantage of those domains where this type of reasoning is productive. Based on accumulating results like these, settlement scaling theory appears to be one such domain.
Finally, our results suggest something important about the potential of the archaeological record for expanding knowledge of human society. The archaeological record will always be partial, distorted, and contextually unique when viewed in detail. Nevertheless, this record captures information on the full sweep of human experience and can provide insights into the fundamental nature of human societies that cannot be gleaned from any other data source. One might question whether all of the assumptions embedded in our analysis are reasonable, but the very fact that they lead to results consistent with theory provides support for both our assumptions and the models we tested. In short, it is highly unlikely that the data could have been biased in unacknowledged ways and still yield results that are consistent with settlement scaling theory. Given that dominant signals overpower noisy data at large spatial and chronological scales, and that human behavior appears more regular at such scales, it seems to us that archaeological evidence has a significant role to play in building a general theory of human societies as complex systems. The archaeological record has undeniable power due to the fact that it preserves traces of social dynamics in utterly different kinds of societies than the ones most people live in today, and we can know that the people who created this record were not aware of the theories we bring to interpreting it, or that one day we would try to measure their behavior. Thus, finding that specific predictions of settlement scaling theory are borne out by data from societies organized at a variety of scales has theoretical significance far in excess of the data.
In addition, archaeological data do more than provide novel tests of an existing theory—they also expand it by clarifying the underlying concepts, as this study has done by noting the role of households, the effects of agglomeration for interaction intensity in the absence of infrastructure, and the identification of institutional factors that may have impacted the average productivity of social interaction. For these reasons, we suspect that continued use of archaeological data in scaling research will prove critical for a deeper understanding of human societies as complex systems, and that the overall endeavor should increase the practical relevance of archaeology.
Acknowledgments
Portions of this work were supported by the National Science Foundation (CNH-0816400), the John Templeton Foundation, the James S. McDonnell Foundation (#220020438), and the Santa Fe Institute Omidyar Fellowship program. We thank Luís Bettencourt, José Lobo, Robert Kelly, Michael Smith, Tim Kohler, Mark Varien and Mark Mitchell for discussions, and four anonymous reviewers for their many helpful comments and suggestions. We also thank Payson Sheets for translating the abstract into Spanish.
Data Availability Statement
All data analyzed in this paper are available through the Digital Archaeological Repository at www.tdar.org.


