


Introduction
Two evolving and complementary fields have made progress in explaining how local communities are assembled from the regional species pool: metacommunity ecology and community phylogenetics. Metacommunity ecology aims to predict species distribution, abundance, and interactions on a variety of spatial and temporal scales (Leibold et al. Reference Leibold, Holyoke, Monquet, Amarasekare, Chase and Hoopes2004; Gravel et al. Reference Gravel, Canham, Beaudet and Messier2006). Alternatively, community phylogenetics measures how species traits and relatedness explain patterns of community structure in an evolutionary framework (Webb Reference Webb2000; Cavender-Bares et al. Reference Cavender-Bares, Kozak, Fine and Kembel2009; Peres-Neto et al. Reference Peres-Neto, Leibold and Dray2012). Two theoretical approaches have primarily been used to explain the distribution of species in communities: niche (Diamond Reference Diamond, Cody and Diamond1975; Webb Reference Webb2000) and neutral (Bell Reference Bell2001; Hubbell Reference Hubbell2001) models. The evolution of species traits, environmental filtering, and competitive exclusions are processes that can structure a community in a phylogenetic context, with constituent species forming a phylogenetically clustered or overdispersed assemblage, supporting the niche model. In contrast, a random pattern of phylogenetic relationships in a community can indicate that these processes are not dominant in structuring the community and that stochastic processes such as chance colonisation, random extinction, and ecological drift (random changes in the relative abundance of species) are generating the patterns observed, thus supporting the neutral model (Hubbell Reference Hubbell2001; Hardy and Senterre Reference Hardy and Senterre2007). The distribution and abundance of organisms are influenced by different forces at different spatial and temporal scales (Graham and Fine Reference Graham and Fine2008; Kraft and Ackerly Reference Kraft and Ackerly2010). Taxonomic, functional, and phylogenetic diversity are complementary metrics that can be used to quantify different components of biodiversity (Petchey and Gaston Reference Petchey and Gaston2002; Magurran Reference Magurran2004; Cadotte et al. Reference Cadotte, Davies, Regetz, Kembel, Cleland and Oakley2010). Consequently, using a multimetric approach is essential to understand the basic principles of community ecology, diversity, and composition to predict new combinations of species and environments, functioning of ecosystems, and the benefits and problems of these changes to society (Jackson and Blois Reference Jackson and Blois2015).
Peatlands are an important habitat that fulfils important ecosystem functions, such as improving water quality, protecting shorelines, stabilising water supplies, moderating the effects of floods, and recharging groundwater aquifers (Keiper et al. Reference Keiper, Walton and Foote2002). They are ecosystems saturated in acidic water, nutrient-poor, low in calcium and magnesium, and covered with peat, which create anaerobic conditions and characteristic vegetation composition (Gorham and Janssens Reference Gorham and Janssens1992; National Wetlands Working Group Reference Warner and Rubec1997). Yet they are threatened systems due to anthropogenic activities, because in Canada more than 60% of wetlands have been transformed through agriculture, industrial/urban development and contamination, climate change, and non-native invasive species (Environment Canada 1993). Given the strong environmental constraints and specificity of the habitat, flora and fauna assemblages have been found to be characteristic (Batzer and Boix Reference Batzer, Boix, Batzer and Boix2016). Insect assemblages, flies in particular, although poorly known, are diverse in peatlands and are influenced by both small-scale resource specificity (such as soil acidity) and large-scale factors (such as anthropogenic disturbance of the surrounding matrix) (Beaulieu and Wheeler Reference Beaulieu and Wheeler2001; Savage et al. Reference Savage, Wheeler, Moores and Grégoire Taillefer2011; Grégoire Taillefer and Wheeler Reference Grégoire Taillefer and Wheeler2017). Because of this, peatlands and their related fly assemblages represent a good study system where an assemblage is physically constrained with strong environmental pressures.
Flies (Diptera) are an ideal taxon for studying taxonomic and phylogenetic community composition in peatlands at broad spatial scales. Diptera are abundant, species-rich, and ecologically and trophically diverse in peatlands (Blades and Marshall Reference Blades and Marshall1994; Pollet Reference Pollet2001; Keiper et al. Reference Keiper, Walton and Foote2002; Grégoire Taillefer and Wheeler Reference Grégoire Taillefer and Wheeler2012). Diptera are associated with a variety of terrestrial, semi-aquatic, or aquatic peatland habitats including mud shores, vascular plants, decaying organic matter, emergent vegetation, macrophytes, and algal mats (Ferrar Reference Ferrar1987; Keiper et al. Reference Keiper, Walton and Foote2002). Some Diptera species are peatland specialists, because their larval or adult food resource or breeding media is either restricted to or characteristic of peatlands (Teskey and Burger Reference Teskey and Burger1976; Farkas and Brust Reference Farkas and Brust1986; Marshall Reference Marshall1994).
In this study, we use a multimetric approach (taxonomic, phylogenetic, and functional) to assess the composition and diversity of Diptera communities in peatlands across multiple ecoregions in Québec, Canada. Our model group was 21 families within Schizophora that encompasses a large range of life history and biological traits, and which are abundant and species-rich in peatlands. Consequently, we examined the taxonomic, functional, and phylogenetic species composition and diversity patterns of peatland Diptera in three Québec ecoregions, arranged broadly from south to north, and within and between ecoregions.
We tested four hypotheses on Schizophora (Diptera) diversity patterns between the three ecoregions: (1) Species richness will increase from north to south and differences in traits and species composition will be mostly related to climate. (2) Smaller and more disturbed wetlands will be characterised by lower overall trait diversity and dominated by species possessing traits related to higher resilience (Townsend et al. Reference Townsend, Dolédec and Scarsbrook1997; Vieira et al. Reference Vieira, Clements, Guevera and Jacobs2004): smaller body size, shorter life cycles, and good dispersal ability. (3) More anthropogenically transformed landscape matrices will support increasing phylogenetic clustering. If traits susceptible to fragmentation are phylogenetically conserved, entire clades could be lost and remaining individuals would tend to co-occur with close relatives, reducing the phylogenetic distance between them (Webb et al. Reference Webb, Ackerly, McPeek and Donoghue2002; Cavender-Bares et al. Reference Cavender-Bares, Kozak, Fine and Kembel2009). (4) Species and phylogenetic beta diversity at the landscape scale will be related to local characteristics such as soil cover composition and surrounding characteristics such as community isolation, wetland size, and/or percentage of surrounding forest and wetlands (Patitucci et al. Reference Patitucci, Mulieri, Schnack and Mariluis2011; Savage et al. Reference Savage, Wheeler, Moores and Grégoire Taillefer2011). At the regional scale, climate will explain most of the variation in species and phylogenetic beta diversity (Økland et al. Reference Økland, Götmark, Nordén, Franc, Kurina and Polevoi2005).
Materials and methods
Study sites, sampling, and processing
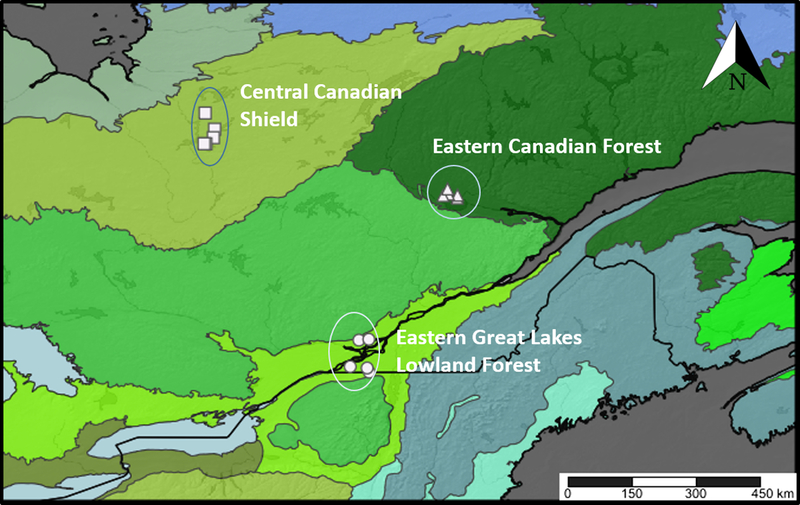
The three selected ecoregions (Ricketts and Imhoff Reference Ricketts and Imhoff2003) differed by both climatic conditions and human occupancy, which influence the distribution of vegetation and animals (Fig. 1): Eastern Canadian Forest (Montréal Metropolitan area and surroundings, 45.2°N, 73.9°W; region code: Montréal, MTL); Eastern Great Lakes Lowland Forest (Saguenay area, 48.8°N, 72.2°W; region code: Saguenay, SAG); and Central Canadian Shield (southern James Bay area, 49.83°N, 77.27°W; region code: James Bay, BJM). To standardise the peatland type across ecoregions, we selected five open-raised bogs per ecoregion with pH < 4.5 dominated by Sphagnum Linnaeus (Sphagnaceae) mosses, Ericaceae shrubs, a tree cover < 30%, and no open pools of water. Sites in the Eastern Canadian Forest ecoregion were chosen from high-resolution digital aerial photographs available from Ducks Unlimited Canada (Beaulieu et al. Reference Beaulieu, Daigle, Gervais, Murray and Villeneuve2010) and through communication with experts. Sites in the Eastern Great Lakes Lowland Forest ecoregion were chosen from peatlands inventoried by Calmé et al. (Reference Calmé, Desrochers and Savard2002). Sites in the Central Canadian Shield ecoregion were chosen in the field by driving along the James Bay Road (Route de la Baie-James).
Map of the 15 study peatland sites across Québec, Canada. Map is separated into ecoregions: Montréal – Eastern Great Lakes Lowland Forest; Saguenay – Eastern Canadian Forest; James Bay – Central Canadian Shield (Ricketts and Imhoff Reference Ricketts and Imhoff2003). Map created with SimpleMappr (www.simplemappr.net).
Sampling was conducted weekly for five weeks during the period of highest Diptera species richness and activity. Montréal sites were sampled from 28 June to 31 July 2013, Saguenay sites from 2 July to 8 August 2014, and James Bay sites from 29 June to 29 July 2015. In each site, samples were collected using yellow pan traps (4 cm deep and 12 cm of diameter) and sweeping in an area of 30 × 30 m, at least 30 m from the edge. Sweep samples were collected weekly on three random transects of 20 m with 20 sweeps on each transect in suitable weather conditions. Three transects of four pan traps each were placed 10 m apart in the 30 × 30 m plot. Pan traps were placed in the soil with their upper rim flush with the ground surface and filled with a 50% solution of propylene glycol and water, with a drop of liquid detergent as a wetting agent. Pan traps were serviced every 6–8 days.
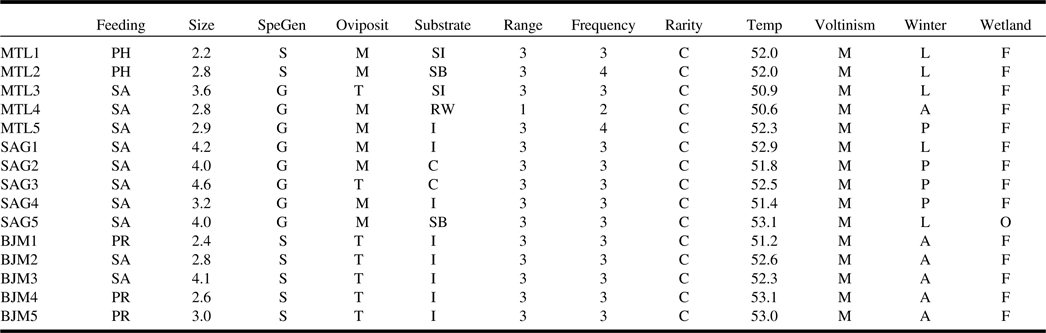
Insects were preserved in 95% ethanol for subsequent DNA extraction. Small flies were dried using hexamethyldisilazane and then mounted; larger flies were transferred into ethyl acetate, then pinned, and air-dried. Specimens were deposited in the Lyman Entomological Museum (McGill University, Ste-Anne-de-Bellevue, Québec). Taxa were identified by morphological characters to named species or morphospecies. Target Schizophora families were selected based on their abundance, diversity of functional traits, and availability of identification keys and expert taxonomists. Phoridae, Tachinidae, Muscidae, and Anthomyiidae were excluded as these families are complex to identify using morphology, or experts were not available for identification. Finally, each species in the 21 families selected was assigned to a category in each of eight biological traits: feeding habits, size, specialisation, habitat preference for oviposition, preferred substrate, voltinism, overwintering stage, temperature range, and wetland specialisation. Also, three indirect rarity measures were used: frequency of occurrence, range, rarity (Table 1). Frequency was the number of sites in which the species occurred, and rarity was the number of individuals in the total collection across the 15 bog sites. Trait values were determined from direct measurements/counts, published literature, and consultation with Diptera specialists.
Life history and ecological traits considered in this study including categories, abbreviations, and trait determination notes.
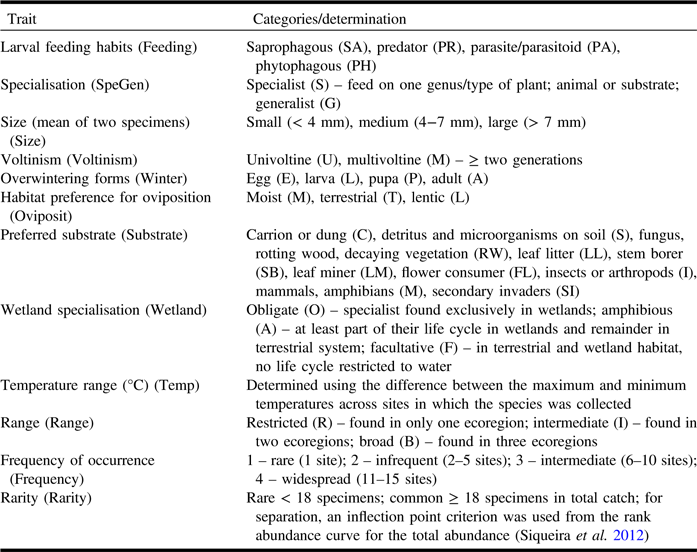
Traits were assigned at the species level and adult stage except for feeding habits and specialisation (larval stage).
Habitat and vegetation variables
At the local scale, the following ground cover attributes were surveyed at week three in five 1 × 1 m quadrats placed at each corner and in the middle of the 30 × 30 m area at each site: percent plant species cover, litter cover, canopy cover, open water cover, and bare soil cover. Fluctuation of water table depth (cm) was estimated with the polyvinyl chloride tape discoloration method (Belyea Reference Belyea1999). Polyvinyl chloride tape was mounted along 1-m-long bamboo sticks, one of which was inserted vertically in each site with 15 cm left above the surface and left for the five weeks of sampling. Chemical parameters of the substrate (pH, conductivity, and temperature) were measured with Hanna pocket combo pH / conductivity / TDS tester in the field at week three at two random locations within the 30 × 30 m area.
At the regional scale, wetland size and the nature of the surrounding matrix were quantified using QuantumGIS version 1.8.0 (Quantum GIS Development Team 2012) software with the Earth Observation for Sustainable Development of Forests land cover datasets of year 2000 representing 23 land cover classes at a spatial resolution of 25 m (Wulder et al. Reference Wulder, White, Cranny, Hall, Luther and Beaudoin2008). Land use (open water, exposed land, urban development, low vegetation, wetland, forest, and agriculture) surrounding each wetland was measured (m2) within a circle of 2 km radius. Diptera have been found to respond to the surrounding matrix at this scale (Meats and Smallridge Reference Meats and Smallridge2007; Savage et al. Reference Savage, Wheeler, Moores and Grégoire Taillefer2011). Climatic variables that are known to influence Arthropoda diversity (Bowden and Buddle Reference Bowden and Buddle2010) were also extracted from WorldClim version 1.4 (Hijmans et al. Reference Hijmans, Cameron, Parra, Jones and Jarvis2005) in 30-arcsecond resolution. Values at the site locations were extracted with raster, rgdal, and foreach packages in R version 3.2.2 (R Core Team 2015). The seven variables selected were annual mean temperature, maximum temperature of warmest month, minimum temperature of coldest month, mean temperature of warmest quarter, mean temperature of coldest quarter, temperature seasonality (standard deviation * 100), and annual precipitation.
Statistical analysis: taxonomic and functional composition
Diptera communities in each peatland (Supplementary Table 1) were characterised by different biodiversity metrics to account for the probable difference in sampling effort among sites; two common approaches for comparing diversity were used: rarefaction of the data to the lowest effort (Srare) and use of a non-parametric estimator (Chao1) that is robust to unequal sampling efforts and that can quantify sampling completeness. Diversity was assessed with rarefaction curves based on 1000 permutations. Extrapolated species richness was assessed using a bias-corrected Chao index (O’Hara Reference O’Hara2005). Observed abundance (Abun) and observed species richness (S) were also calculated to assess how common or rare a species is relative to other species in a community. All measures were calculated from samples pooled by sites throughout the season. Significance of differences in abundance and species richness indices among ecoregion was determined based on analysis of variance F tests. All analyses were performed using the R vegan package (Oksanen et al. Reference Oksanen, Blanchet, Kindt, Legendre, Minchin and O’Hara2012).
Functional diversity, which considers the distribution and range of functions of co-occurring species (Supplementary Table 2) in a community, was measured with three multidimensional indices (Villéger et al. Reference Villéger, Mason and Mouillot2008). Functional richness (FRic) was standardised by the total FRic to constrain the values between 0 and 1. Functional evenness (FEve) and functional divergence (FDiv) were weighted by the abundance of species. First, a Gower dissimilarity matrix was computed (Podani Reference Podani1999) because traits were quantitative and categorical, and lingoes corrections were applied to obtain Euclidean distance matrices. Dimensionality of the trait matrix was reduced to 40 out of 157 principal coordinate analysis (PCoA) axes due to computational power limitations. Significance of differences between sites and ecoregion was determined with analysis of variance F tests. Community-level weighted trait means (Lavorel et al. Reference Lavorel, Grigulis, McIntyre, Williams, Garden and Dorrough2008) were used to determine dominant functional composition at each site, where quantitative traits are weighted by abundance and categorical traits are returned as the dominant category. All analyses above were computed with the FD package (Laliberté et al. Reference Laliberté, Legendre and Shipley2014).
Redundancy analysis was used to test for the similarity in overall taxonomic and functional assemblages and for the relationships to environmental variables (Supplementary Table 3) using the vegan package. Prior to redundancy analysis, species abundances were Hellinger-transformed (Legendre and Gallagher Reference Legendre and Gallagher2001) as it gives low weights to low counts and many zeros. A PCoA of the dissimilarity matrix of community-level weighted trait means was computed; principal coordinate eigenvalues of community-level weighted trait means were used as response variables in the subsequent redundancy analysis. Principal component analysis was used to reduce the number of ground cover variables (Supplementary Table 3). Significant axes were identified with the Kaiser-Guttman criterion (Yeomans and Golder Reference Yeomans and Golder1982), and the first five significant principle component analysis axes retained 82% of the variation explained (Supplementary Table 4). To reduce the number of environmental variables in the subsequent analyses and to avoid autocorrelation between them, remaining environmental and climatic variables were observed with scatterplots. Only soil temperature was removed. Latitudes and longitudes were transformed into corresponding coordinates in X (east–west) and Y (north–south) distances in the package SoDA (Chambers Reference Chambers2008). The resultant environmental matrix included local variables (PC1–5, canopy cover, open water cover, fluctuation of water table, pH, conductivity) and all landscape variables (open water, exposed land, urban development, low vegetation, wetland, forest, agriculture, area). Forward selection of explanatory variables was applied with the packfor package and retained the variables with a P-value < 0.05. Spatial (X and Y) and climate variables were excluded from redundancy analyses and incorporated further in variation partitioning. A permutation test was used for the significance of the axes eigenvalues associated with significant environmental variables. A permutational multivariate analysis of variance based on a Bray–Curtis distance matrix was used to assess the significance of differences among ecoregions for overall species assemblages and environmental variables using the function Adonis of the vegan package.
A fourth-corner analysis (Dray and Legendre Reference Dray and Legendre2008) using the ade4 package (Dray and Dufour Reference Dray and Dufour2007) was used to assess the relationship simultaneously between separate traits, species abundance, and environmental/climatic variables. Missing entries (251) of the categorical traits were replaced by predicted values with the MissMDA package (Josse and Husson Reference Josse and Husson2016), which corresponded to 11% of all entries. Associations between categorical traits and quantitative environmental variables were measured with Pearson correlation coefficient. The significance was tested by a combination of the permutation model 2 and 4 with 999 permutations to obtain a correct level of Type I error.
Phylogeny reconstruction
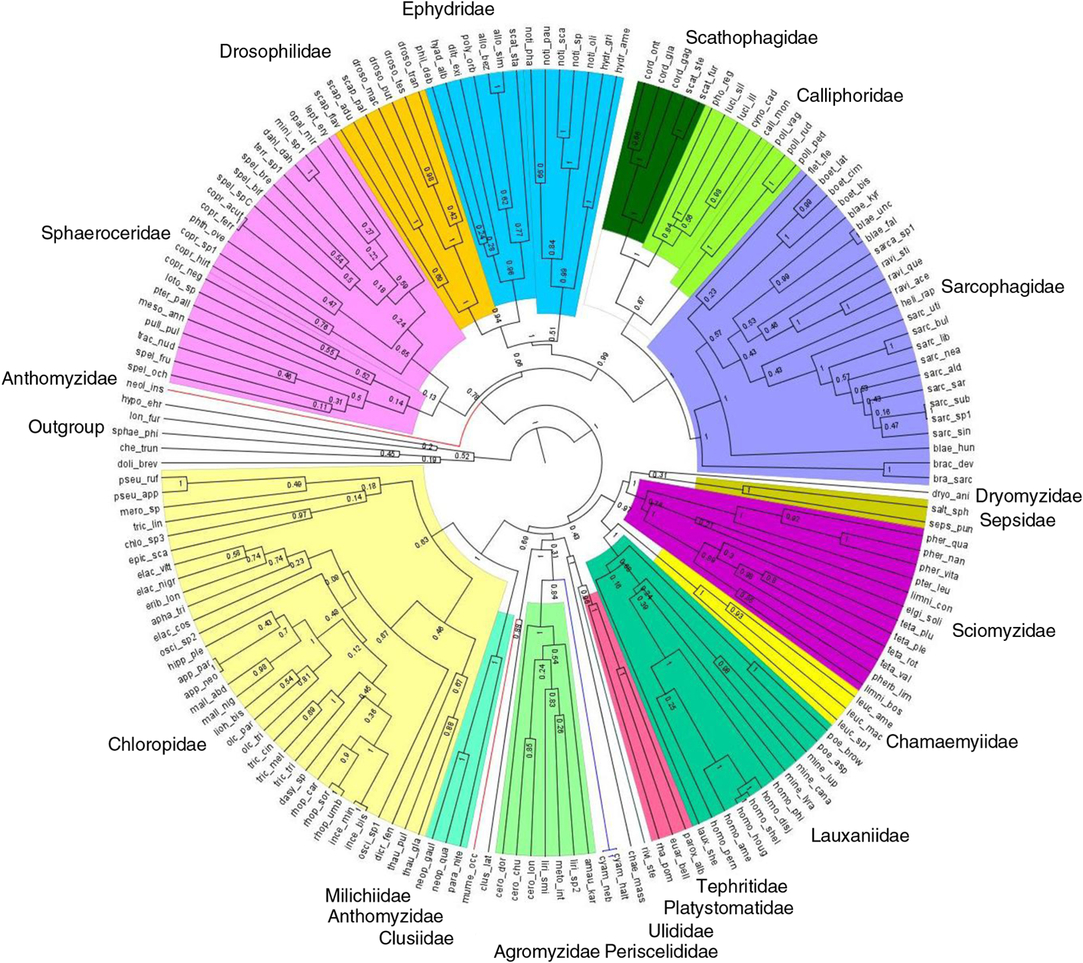
Hypothesised molecular phylogeny of Diptera species from peatland sites was generated with DNA barcode (658 base pairs of the mitochondrial CO1-5P gene) used as a proxy for species-level phylogenetic relationships (Joly et al. Reference Joly, Davies, Archambault, Bruneau, Derry and Kembel2014). Boyle and Adamowicz (Reference Boyle and Adamowicz2015) found that trees built using COI alone calculate the metrics of phylogenetic community structure as accurately as the trees obtained from a multi-gene tree. A compilation of published molecular sequences in the Barcode of Life Data Systems (Ratnasingham and Hebert Reference Ratnasingham and Hebert2007) and our own Diptera species representing 356 specimens and 139 species submitted to the Canadian Centre for DNA Barcoding for sequencing using C_LepFolF/C_LepFolR primers (Hernández-Triana et al. Reference Hernández-Triana, Prosser, Rodríguez-Perez, Chaverri, Hebert and Gregory2014) were used in a matrix of DNA sequences constructed with Mesquite 3.04 (Maddison and Maddison Reference Maddison and Maddison2015) and aligned with MUSCLE (Edgar Reference Edgar2004). A Bayesian approach was used for the phylogenetic analyses using BEAST version 1.7.5 (Drummond et al. Reference Drummond, Suchard, Xie and Rambaut2012), and the output was examined with Tracer version 1.6 (Rambaut et al. Reference Rambaut, Suchard, Xie and Drummond2014). To determine which model of nucleotide substitution best fit the alignment, jModelTest2 according to Akaike information criterion was applied. We constrained monophyly for families, subfamilies, genera, and groups for which there were recent and well-supported multi-gene or morphological phylogenies. These included Schizophora and some higher groups of acalyptrate Diptera (Yeates and Wiegmann Reference Yeates and Wiegmann2005); Calyptratae (Lambkin et al. Reference Lambkin, Sinclair, Pape, Courtney, Skevington and Meier2013); Sarcophagidae (Kutty et al. Reference Kutty, Pape, Wiegmann and Meier2010; Pape et al. Reference Pape, Blagoderov and Mostovski2011); Ravinia Robineau-Desvoidy (Sarcophagidae) (Giroux et al. Reference Giroux, Pape and Wheeler2010; Piwczynski et al. Reference Piwczynski, Szpila, Grzywacz and Pape2014); Boettcheria Parker (Sarcophagidae) (Piwczynski et al. Reference Piwczynski, Szpila, Grzywacz and Pape2014); Luciliinae and Polleniinae (Calliphoridae) (Kutty et al. Reference Kutty, Pape, Wiegmann and Meier2010); Phytomyzinae (Agromyzidae) (Scheffer et al. Reference Scheffer, Winkler and Wiegmann2007); Scathophagidae (Bernasconi et al. Reference Bernasconi, Pawlowski, Valsangiacomo, Piffaretti and Ward2000); Milichiidae (Brake Reference Brake2000); Sciomyzini and Tetanocerini (Sciomyzidae) (Tóthová et al. Reference Tóthová, Rozkošný, Knutson, Kutty, Wiegmann and Meier2013); Tephritidae (Han and Ro Reference Han and Ro2009); Drosophilidae (Yassin Reference Yassin2013); and Chloropinae (Chloropidae) (Brake Reference Brake2000). Sequences of Dolichopus brevipennis Meigen (Dolichopodidae), Sphaerophoria philanthus Meigen (Syrphidae), Chelipoda truncata MacDonald (Empididae), Hypocera ehrmanni Aldrich (Phoridae), and Lonchoptera furcata (Fallén) (Lonchopteridae) were used to root the tree (outgroup).
The general time-reversible model with a proportion of invariable sites (+I) and a rate of variation across sites (+G) was selected as the appropriate model with jModelTest2, and no partitioning by codon was used. In all analyses, strong priors were set on the age of two nodes corresponding to Schizophora (lognormal: mean = 3, SD = 0.78, offset = 70) and Chloropidae (lognormal: mean = 3, SD = 0.7, offset = 42) according to paleontological and molecular data (Nardi et al. Reference Nardi, Carapelli, Boore, Roderick, Dallai and Frati2010; Wiegmann et al. Reference Wiegmann, Trautwein, Winkler, Barr, Kim and Lambkin2011). A branching prior was set under a Yule process model, and a relaxed molecular clock was assumed using a lognormal distribution of rates (Drummond et al. Reference Drummond, Ho, Phillips and Rambaut2006). The analyses were performed twice using a random starting tree for a Markov chain Monte Carlo chain length of 40 million generations (10 000 echo states, 4000 log parameters, 20% burn-in) (Fig. 2).
Hypothesised phylogenetic relationships, based on CO1, among Schizophora (Diptera) species collected in the 15 bogs. Colours represent families; branch lengths represent divergence time estimates; and numbers on nodes represent posterior probabilities. Species codes can be found in Supplementary Table S1.
Phylogenetic community structure
The phylogenetic structure was first calculated for all Diptera pooled in each trap and repeated at each higher spatial scale: for each site and in each ecoregion. To determine if Diptera communities are more or less related than expected by chance, several indices were calculated: Faith’s phylogenetic diversity metric (PD) (Faith Reference Faith1992), mean pairwise distance (MPD), and the mean nearest taxon distance (MNTD) were calculated for each community (Webb Reference Webb2000; Webb et al. Reference Webb, Ackerly and Kembel2008). A null model shuffling taxa label to generate null communities randomised 999 times was used to determine if the phylogenetic composition of communities differed significantly from that expected by chance. These 999 null measurements were used to calculate two measures of standardised effect size multiplied by −1: net relatedness index (NRI) and nearest taxon index (NTI) (observed value minus the mean value of the 999 null values divided by the standard deviation of the 999 null values) and probabilities. To estimate whether net relatedness index and nearest taxon index values at the trap and site scales were significantly different from zero, t-tests were performed. Fisher’s combined probability tests were performed as meta-analyses of P-values using the metap package (Dewey Reference Dewey2016). Null models were used at the ecoregion scale to assess if communities were significantly different from random.
Phylogenetic signals in trait diversity
The phylogenetic signal is defined as the tendency for related species to resemble each other. Trait conservatism is related to a higher degree of phylogenetic signal, meaning that close relatives share similar traits, while trait convergence is the tendency for distantly related species to resemble each other more than expected (Blomberg et al. Reference Blomberg, Garland and Ives2003). Phylogenetic signals of continuous traits (size and temperature range) were tested with Blomberg’s K, which is rescaled by dividing by the Brownian motion expectation. This gives it the property of having an expected value of 1.0 under Brownian evolution. For significance we randomly arrayed the trait data on the community phylogeny 999 times to generate a null distribution from which a P-value could be calculated using the picante package (Kembel et al. Reference Kembel, Cowan, Helmus, Cornwell, Morlon and Ackerly2010). Phylogenetic signals of categorical traits were measured using Pagel’s lambda with the fitDiscrete function in the Geiger package (Harmon et al. Reference Harmon, Weir, Brock, Glor and Challenger2008). By comparing the likelihood ratio test of a model where the tree is transformed by lambda with one where the tree is transformed into a large polytomy (λ = 0), we could predict which one fits better by a chi-square distribution.
To evaluate the variation of alpha diversity along anthropogenically modified landscapes, a series of linear models was used to evaluate linear relationships among measures of Abun, S, Srare, Chao1, FRic, FDiv, FEve, NRI, and NTI to the proportion of anthropogenically modified land (urban development plus agriculture). Regression diagnostic plots were created in R to visually assess if linear regression assumptions are met. Dependant variables were log (x + 1)-transformed to meet the assumptions of the test.
To evaluate the phylogenetic turnover in Diptera communities within and between the three ecoregions, beta phylogenetic differences were tested using comdist (betaMPD: the average mean pairwise distance for each species in a sample to all species in another sample) and comdistnt functions (betaMNTD: the average mean nearest taxon distance for all species in a sample to the nearest neighbours in another sample) of the picante package. Then PCoA of the output dissimilarity matrix was computed, and principal coordinate eigenvalues were used as response variables in redundancy analysis to determine the effect of environment on beta phylogenetic structure. To determine if beta and phylogenetic beta diversity were positively spatially autocorrelated, the Mantel statistic was calculated with spatial distance. To assess correlations between species co-occurrence and phylogenetic distances, the Mantel statistic was also performed between Bray–Curtis dissimilarity matrices and beta phylogenetic dissimilarity matrices.
Variation partitioning was used to assess the proportion of variation in community data using adjusted R 2 in redundancy analysis ordination explained by environmental, spatial, and climatic variables at the taxonomic, functional, and phylogenetic levels. The variation was partitioned into several components depending on significance according to forward selection: pure environmental component (local and surrounding variables), pure climatic component, pure spatial component, spatially structured environmental and/or climatic components, and residual variation. Analysis of variance was used to calculate the significance levels of different components. These analyses were computed with the vegan package.
Results
Species and functional alpha and beta diversity
A total of 3302 specimens belonging to 202 species in 21 families were identified from the 15 bog sites in the three ecoregions (Supplementary Table 1). Neither abundance, observed species richness, rarefied species richness nor Chao1 indices were significantly different among and within the three ecoregions (P > 0.05), although there was a tendency for a decrease in diversity from south to north. FRic, FEve, and FDiv were not significantly different among sites and between the three ecoregions (P > 0.05). FRic, the amount of niche space occupied by the species within a community, was low across all sites; FEve was moderately high and FDiv was high (Table 2).
Abundance (Abun), observed species richness (S), Chao1 indices (Chao1), rarefied species richness (Srare), functional richness (FRic), functional evenness (FEve), and functional divergence (FDiv) for all sites and mean diversity for each ecoregion.

Site codes: MTL, Montréal (Eastern Canadian Forest); SAG, Saguenay (Eastern Great Lakes Lowland Forest), and BJM, James Bay (Central Canadian Shield).
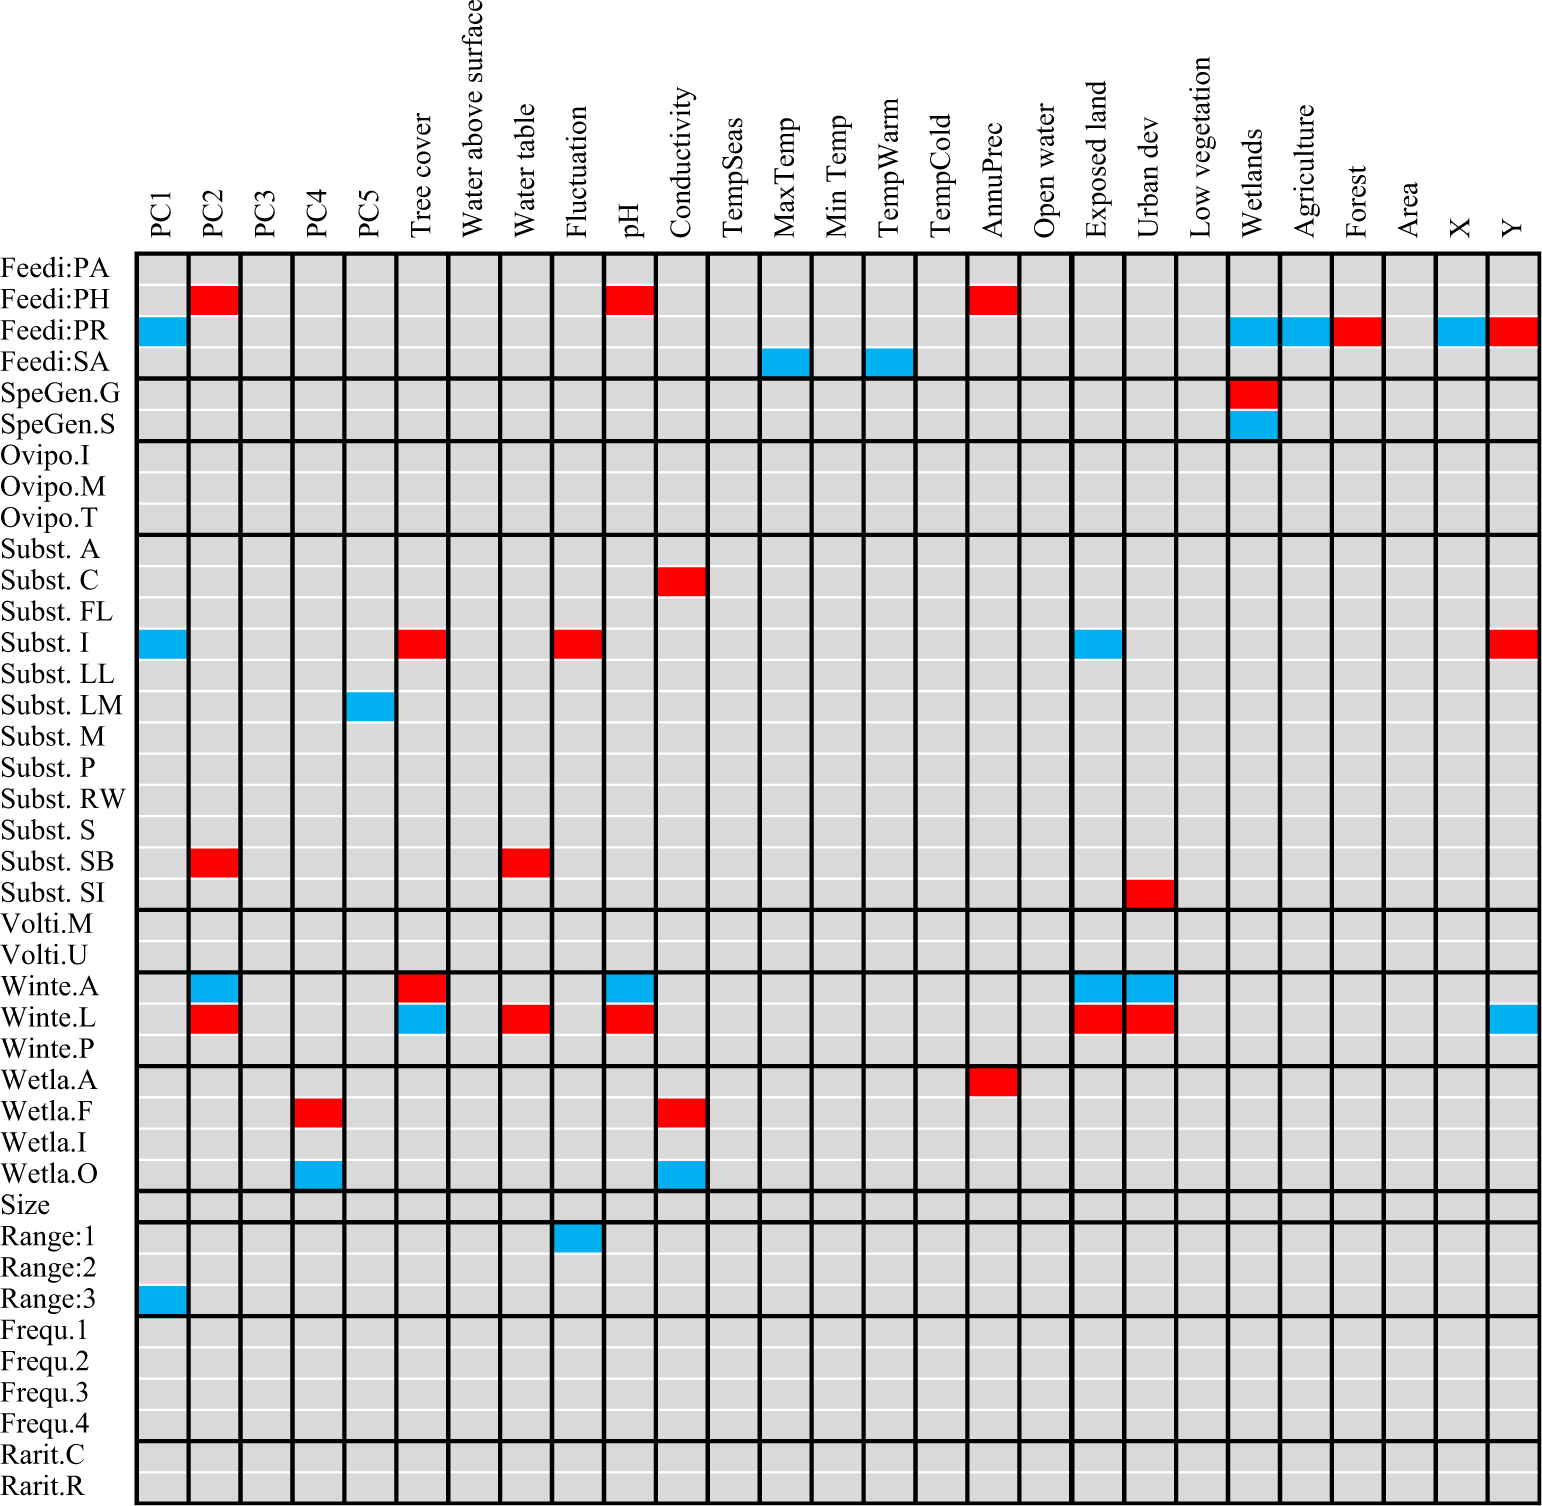
The community-weighted means showed that species inhabiting Montréal and Saguenay sites possessed similar traits, predominantly saprophagous generalist species preferring moist substrates for oviposition (Table 3). The functional composition of James Bay sites was clearly separated from the other two ecoregions as communities were dominated by saprophagous and predacious species specialised on insects or arthropods that use terrestrial conditions for oviposition. Nearly all communities were dominated by widespread wetland facultative species found in at least six sites and in the three ecoregions. Several significant relationships among species functional traits and environment and climate were found with fourth corner analysis (Fig. 3). The saprophagous generalist species inhabiting Montréal and Saguenay bogs were positively influenced by the coverage of wetlands surrounding the sites, although the warm temperature negatively impacted them. Insect predators in James Bay bogs were positively influenced by the fluctuation in the level of water, longitude, forests surrounding the sites, and tree cover within the sites. Habitat preference for oviposition, voltinism, size, frequency of occurrence, and rarity were not significantly correlated with any measured environmental parameters.
Dominant functional composition of each site, represented by community-level weighted means.
For continuous traits, the mean trait value is weighted by abundance, while for categorical traits, the dominant class is returned. For description of traits and associated codes, refer to Table 1.
Relationship between the functional traits and environmental/climatic variables of Diptera species revealed by fourth corner analysis. Blue cells correspond to significant negative relationships; red cells correspond to significant positive relationships. Refer to Table 1 for an explanation of each trait and code.
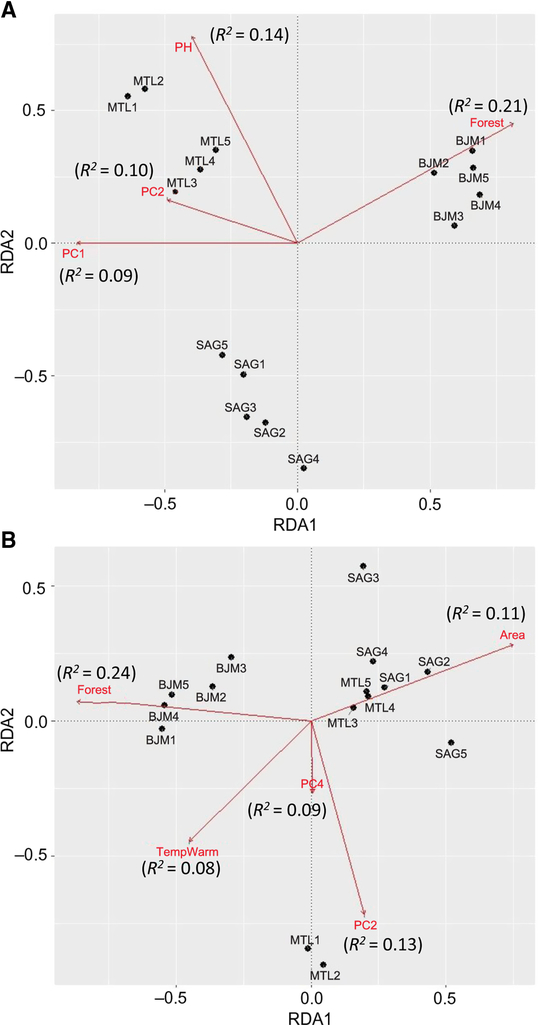
The three ecoregions were significantly different (Adonis R2 = 0.47, P = 0.001) in species assemblages. Climate was significantly different between the three ecoregions (Adonis R2 = 0.98, P = 0.001). Local and landscape variables were also significantly different between ecoregions (Adonis R2 = 0.77, P = 0.001). The total proportion of variance explained in species redundancy analysis by four explanatory variables (surrounding forests, pH, PC1, PC2) was 53% (adjusted R 2 = 0.34) (Fig. 4A) for all sites combined. Montréal species composition in redundancy analysis was mostly affected by higher pH, PC2, and PC1, while Saguenay species were not affected by precise environmental variables. James Bay species composition was primarily affected by surrounding forests and by higher coverage of bog specialist plant species Maianthemum trifolium (Linnaeus) (Asparagaceae) and Chamaedaphne calyculata Baillon (Ericaceae) (PC1). Montréal and Saguenay ecoregions were not significantly different in functional composition (Adonis R 2 = 0.98, P = 0.18). Four different environmental variables (surrounding forests, area, PC2, PC4) emerged in the redundancy analysis as having a significant effect on the functional composition for all sites combined explaining 51% (adjusted R 2 = 0.39) of variance (Fig. 4B). Large area predominantly affected the functional composition of Montréal (sites 3–4–5) and Saguenay bog sites, in being composed mainly of saprophagous generalist species preferring moist substrates for oviposition. Two Montréal sites that were dominated by specialist phytophagous species (community-level weighted trait means) were mostly affected by a high coverage of Carex oligosperma Michaux (Cyperaceae) and low litter cover (PC2), and high coverage of Polytrichum Hedwig (Polytrichaceae) species and low Eriophorum vaginatum Linnaeus (Cyperaceae) (PC4). James Bay communities were mostly affected by a high percentage of surrounding forest.
Redundancy analyses of species (A) and functional composition (B). Arrows represent vectors of significant variables (P < 005) explaining community structure, R 2 values in parentheses from the forward selected models examining the effect of environmental factors.
Phylogenetic alpha and beta composition
Montréal communities at the three scales were significantly different from random for net relatedness index and nearest taxon index, and Faith’s phylogenetic diversity metric was also significantly different at the site scale (Table 4). At the trap scale for Saguenay, the three indices were significantly different from random, while at the site scale Faith’s phylogenetic diversity metric and nearest taxon index were significant and at the ecoregion scale only Faith’s phylogenetic diversity metric was different from random. James Bay communities were not different from random at every scale. Mantel correlation between beta and phylogenetic beta diversity was significantly correlated with spatial distance for species (r = 0.68, P = 0.001), mean nearest taxon distance (r = 0.53, P = 0.002), and traits (r = 0.43, P = 0.003), although not mean pairwise distance (r = 0.001, P = 0.45). Species co-occurrence was significantly correlated (P < 0.05) with phylogenetic distances and functional distances.
Phylogenetic diversity (PD), net relatedness index (NRI), and nearest taxon index (NTI) for Diptera communities in 15 sites across three ecoregions at three spatial scales (trap, site, ecoregion).

Fisher’s combined probability tests were performed to assess if overall P-values were significant at the trap and site scales. Null models were used at the ecoregion scale to assess if communities were significantly different from random. Significant P-values are in bold font.
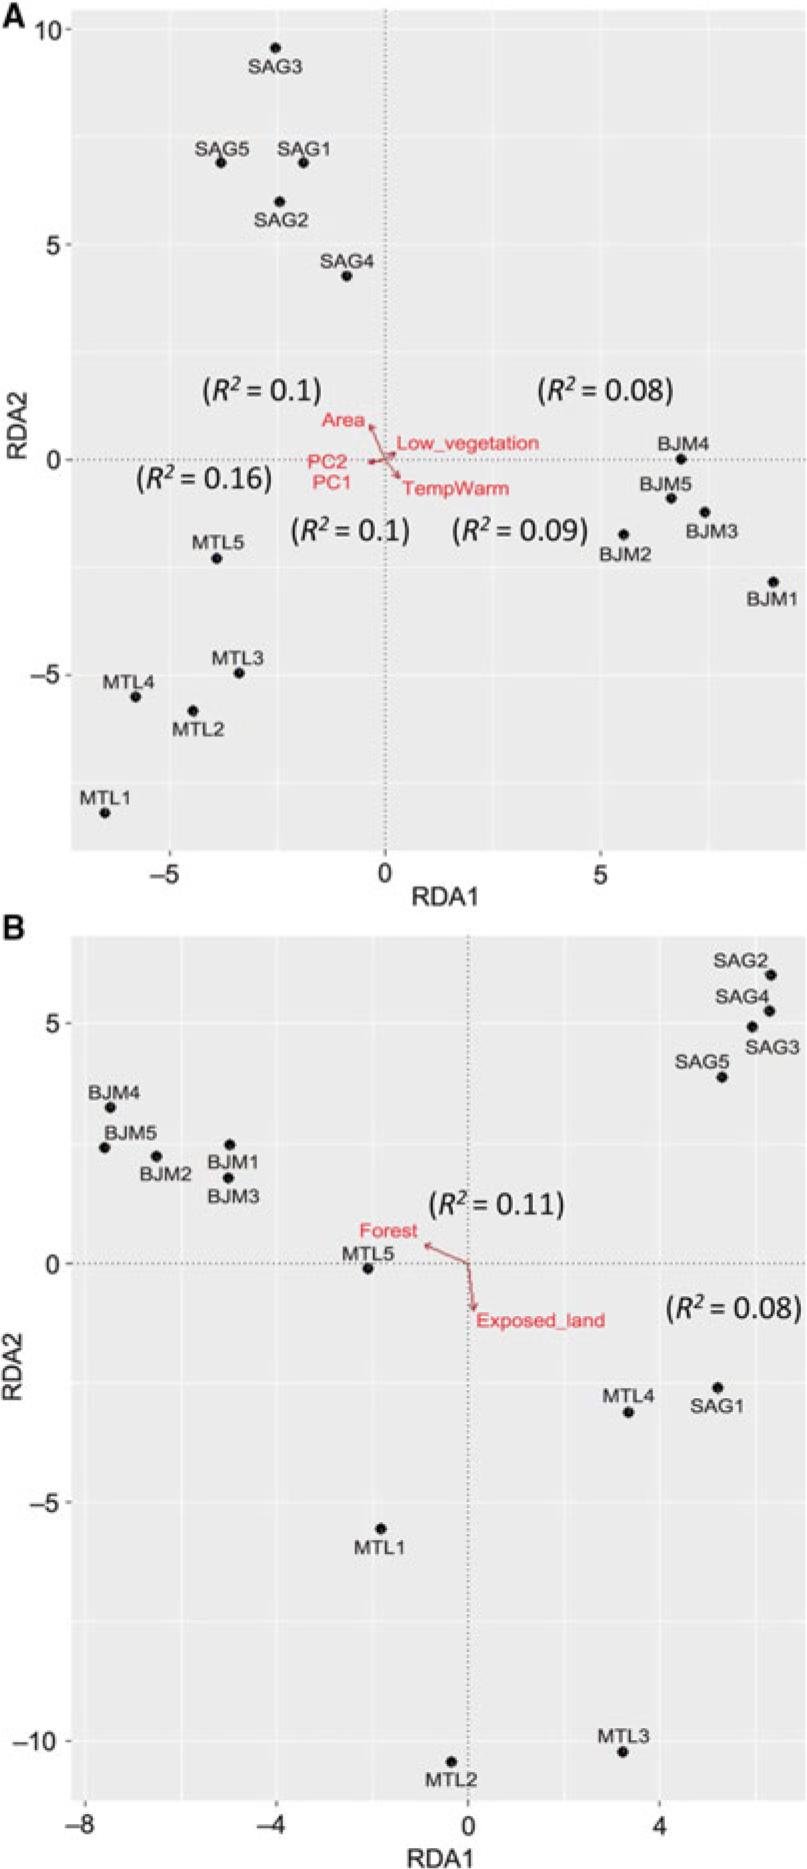
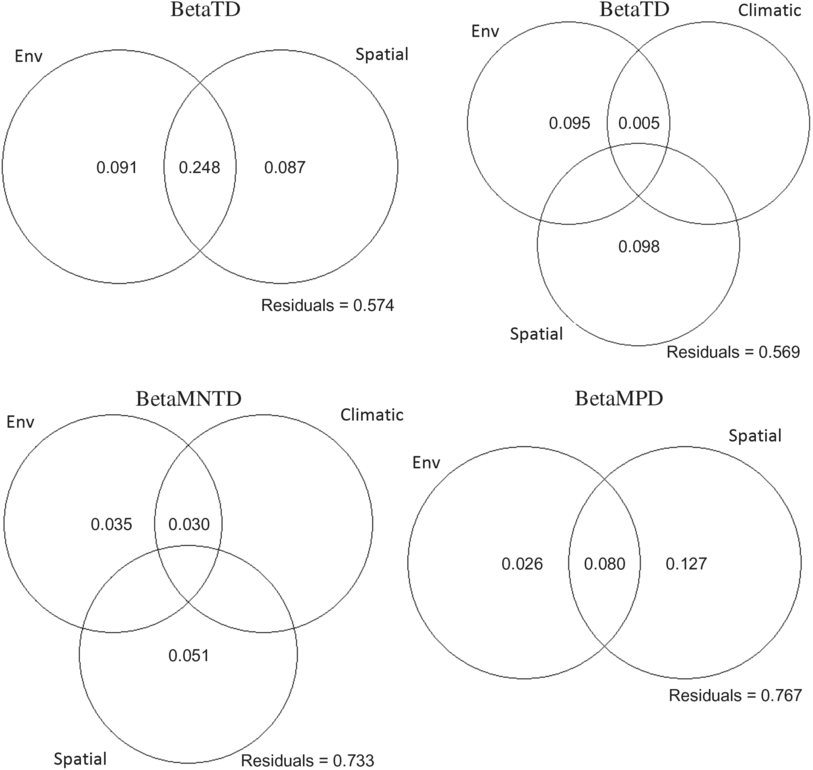
The three ecoregions were significantly different in phylogenetic beta diversity (betaMNTD Adonis R 2 = 0.68, P = 0.001; betaMPD Adonis R 2 = 0.38, P = 0.001). The total variance explained by the redundancy analysis in betaMNTD for all sites combined by four explanatory variables was 31% (adjusted R 2 = 0.22) (Fig. 5A). Phylogenetic structure at the Montréal sites at the tip of the tree was mostly influenced by substrate coverage (PC1), while Saguenay communities were mainly affected by the large bog areas and substrate coverage (PC2) in this ecoregion. James Bay communities were affected by low vegetation surrounding the sites. The total variance explained by the redundancy analysis in betaMPD for all sites combined by two explanatory variables was 19% (adjusted R 2 = 0.06) (Fig. 5b). Surrounding exposed lands were affecting the majority of Montréal communities, while surrounding forests were affecting James Bay communities. Phylogenetic turnover was higher deeper in the phylogeny (betaMPD) for Montréal communities than within the other two ecoregions (Fig. 5B), as sites were more spread apart. Forward selection analyses showed that overall betaTD, betaFD, and betaMNTD were significantly associated with geographical distances, while betaMPD was only significantly associated with east–west coordinates. Variation partitioning analyses (Fig. 6) explained 45% of the total variation of betaTD with the shared spatial, environmental, and climatic fraction explaining the highest proportion of variation (24%, P = 0.001). Pure environmental variables accounted for 8% (P = 0.001) of the variation, while climate accounted for 2% (mean temperature of warmest quarter (TempWarm), maximum temperature of warmest month (MaxTemp, P = 0.001). The shared component between environmental, spatial, and climatic variables accounted for 18% (P = 0.003), the pure environmental fraction accounted for 14% (P = 0.002), and climate accounted for 9% (TempWarm, MaxTemp; P = 0.001) of the total variation (50%) of betaFD. The shared fraction of spatial, environmental, and climatic (annual mean temperature (AnnuTemp, MaxTemp) variables explained 16% (P = 0.001) of the total variation (26%) of betaMNTD. The shared spatial, environmental, and climatic fraction explained the highest proportion of variation (4%, P = 0.001) of the total variation (11%, P = 0.01) in betaMPD. The pure climatic variables (TempWarm, MaxTemp) explained only 0.7% (P = 0.001) of the variation.
Redundancy analyses of beta phylogenetic composition for mean nearest taxon distance (A) and mean pair-wise distance (B). Arrows represent vectors of significant variables (P < 005) explaining community structure, R 2 values in parentheses from the forward selected models examining the effect of environmental factors.
Variation partitioning diagrams of taxonomic (betaTD), functional (betaFD), and phylogenetic (betaMNTD, betaMPD) composition. Circles represent variation explained by unique and shared fractions of significant (based on forward selection) environmental (Env), climatic, and spatial variables, while numbers correspond to the adjusted coefficient of determination (adjusted R 2) associated with each circle. Only significant and positive adjusted R 2 are shown.
Linear models indicated that species richness was significantly positively related to agriculture (df = 12, F = 3.29, adjusted R 2 = 0.25, P = 0.04). Urban development and agriculture had an additive effect on FDiv with a negative and positive association respectively (df = 12, F = 8.73, adjusted R 2 = 0.52, P = 0.005). Phylogenetic diversity had a similar association with agriculture as species richness (df = 12, F = 4.04, adjusted R 2 = 0.30, P = 0.03). Nearest taxon index was positively related to urban development (df = 12, F = 5.02, adjusted R 2 = 036, P = 0.012); therefore, with increasing urban coverage, clustering is increasing.
Tests of phylogenetic signal showed that traits showing a signal are phylogenetically labile, with close relatives less similar than expected under a Brownian model of evolution. The K statistic was significantly different than a signal expected by chance but less similar (K < 1) than expected under a Brownian model for size (K = 0.68, P = 0.001) and temperature range (K = 0.29, P = 0.01). The variance in size and temperature range found within clades could be caused by either departure from Brownian motion evolution, such as adaptive evolution that is uncorrelated with the phylogeny, or measurement error. Pagel’s lambda was not significantly different (P > 0.05) from a giant polytomy for all other categorical traits.
Discussion
Only a few studies have examined the diversity of wetland Diptera (e.g., Blades and Marshall Reference Blades and Marshall1994; Barták and Roháček Reference Barták and Roháček1999; Grégoire Taillefer and Wheeler Reference Grégoire Taillefer and Wheeler2010, Reference Grégoire Taillefer and Wheeler2012, Reference Grégoire Taillefer and Wheeler2013, Reference Grégoire Taillefer and Wheeler2017), and even fewer have looked at their phylogenetic community structure (Pfenninger et al. Reference Pfenninger, Nowak, Kley, Steinke and Streit2007; Espíndola et al. Reference Espíndola, Buerki and Alvarez2012; Silver et al. Reference Silver, Vamosi and Bayley2012). Phylogenetic relatedness and functional structure complemented the information provided by classical metrics. Different dimensions of Diptera diversity in bogs across different ecoregions are more evident with this multimetric approach and help to predict if communities are mainly maintained by competition-driven differentiation, environmentally filtered coexistence, or stochasticity. Bogs across the three ecoregions support similar abundance, species richness, and functional diversity. Our results suggest that major forces structuring Diptera assemblages in bogs across Québec are stochastic processes such as dispersal limitations. However, those random patterns change to clustering when anthropogenic disturbances modify the landscape. Assembly rules are mostly dictated by patch and landscape parameters specific to each ecoregion affecting dispersal and establishment between sites.
We did not find evidence of limiting similarity as a mechanism of Diptera community assembly in bogs at any spatial scale. A random pattern can result when opposing patterns of clustering and overdispersion are found within the same community (Hardy and Senterre Reference Hardy and Senterre2007; Mayfield and Levine Reference Mayfield and Levine2010; Pangjanda and Pramual Reference Pangjanda and Pramual2016). However, biotic interactions have rarely been considered important mechanisms to control invertebrate species biodiversity in wet environments (Batzer and Wissinger Reference Batzer and Wissinger1996; Vinson and Hawkins Reference Vinson and Hawkins1998), and this still holds with the advent of phylogenetic analyses (Ruhí et al. Reference Ruhí, Boix, Gascón, Sala and Batzer2013; Grégoire Taillefer and Wheeler Reference Grégoire Taillefer and Wheeler2017). Our results suggest that dispersal limitation of small-sized species, coupled with environmental filtering caused by the strength of the environmental gradients, is driving the spatial patterns observed in these bog Diptera communities. The most common species collected had small sizes, and many of these species may be dispersal-limited because several acalyptrates do not appear to fly readily or for long distances (T.A.W., personal observations). Therefore, they likely benefited from dispersal by wind (Kovats et al. Reference Kovats, Ciborowski and Corkum1996; Heino Reference Heino2013) over a long period of time, which explains their occurrence in the three ecoregions. A historical imprint caused by dispersal limitations over time likely created these phylogenetic random patterns (Hubbell Reference Hubbell2001). In two of our other studies on wetland Diptera communities in Québec, we found that inter-site distance mostly affected beta taxonomic and phylogenetic diversity of small and common species (Grégoire Taillefer and Wheeler Reference Grégoire Taillefer and Wheeler2017), and that bog disturbance had the greatest effect on the distribution of small Brachycera and Acalyptrate flies (Grégoire Taillefer and Wheeler Reference Grégoire Taillefer and Wheeler2012). Abundant, small-bodied, multivoltine insect species were affected by stochastic processes in tropical stream metacommunities (Saito et al. Reference Saito, Siqueira and Fonseca-Gessner2015a). These functional traits are similar to our dominant traits in every bog communities. As local variations in species diversity and composition are dependent on historical diversification and dispersion, a larger latitudinal gradient would have been necessary to detect a change in species diversity and an effect of species pools (Martin Reference Martin2016).
However, with recent drastic human modification of the landscape, less suitable patches and more barriers to dispersal are found neighbouring those bogs, so agriculture and urban development act as filters for the small proportion of species in the species pool that can disperse in these conditions. Contrary to our hypothesis, pure climatic variables were not the major determinants of community structure at the regional scale. In Montréal, assembly rules are mostly dictated by patch and landscape parameters affecting dispersal and establishment between sites in an urban matrix. The high turnover of species in Montréal sites is mostly affected by surrounding exposed lands (e.g., non-vegetated, non-developed, sediments, beaches, burnt area) where Diptera species probably have environmental requirements suitable for bog habitats and local conditions. As species emigrate from the surrounding habitats, they are filtered by anthropogenic barriers and the unique local vegetation. A selective filtering role of anthropogenic disturbances has been found for several other taxa (Brunbjerg et al. Reference Brunbjerg, Borchsenius, Eiserhardt, Ejrnæs and Svenning2012; Ding et al. Reference Ding, Zang, Letcher, Liu and He2012; Concepción et al. Reference Concepción, Götzenberger, Nobis, de Bello, Obrist and Moretti2016; Hausberger and Korb Reference Hausberger and Korb2016; Mykrä et al. Reference Mykrä, Tolkkinen, Markkola, Pirttilä and Muotka2016). Increase environmental stresses in aquatic Diptera wetland communities have also been found to increase phylogenetic clustering in Alberta, Canada (Silver et al. Reference Silver, Vamosi and Bayley2012).
Bog communities are distributed along broad environmental gradients in surrounding land use and anthropogenic disturbance. Montréal bogs can be seen as more isolated systems, where exchange with the anthropogenically disturbed surrounding environment is difficult. On average 28% of the proportion of the 2-km-radius area around each bog was anthropogenically modified. Isolation is also illustrated by the higher variation in betaMPD observed compared with the other two ecoregions, which means that species composing Montréal sites were found in different families. Our results are similar to Angold et al. (Reference Angold, Sadler, Hill, Pullin, Rushton and Austin2006) who found that anthropogenic activities and urban environmental conditions influence ground beetle (Coleoptera: Carabidae) species diversity and composition. Vegetation structure, level of disturbance affecting the dominance of generalists, and woodland ground beetle specialists are the most significant influence on assemblages in urban habitat patches. Saguenay bogs are more intermediate in surrounding land use to Montréal and James Bay. They have less anthropogenic disturbances than Montréal and more wetland coverage than James Bay (approximately 5% of anthropogenic land use, 36% forest, 43% wetlands). James Bay bogs are more open systems, where exchange can happen with the surrounding undisturbed environment (approximately 0.03% of anthropogenic modification). Predacious insect species in James Bay immigrate from the surrounding forests as the bogs in this region are connected to a complex of forests (approximately 80% land cover) and wetlands (approximately 9% land cover). Consequently, community assembly within regions with high fragmentation of habitat, characteristic local conditions, and low dispersal rates usually converge in phylogenetic clustering of assemblages; whereas in regions where dispersal is prevalent, assembly patterns should be largely stochastic and dominated by species dispersal capacity (Emerson and Gillespie Reference Emerson and Gillespie2008; Weiher et al. Reference Weiher, Freund, Bunton, Stefanski, Lee and Bentivenga2011).
High levels of functional divergences are associated with a high degree of niche differentiation among species within communities: the most abundant species are very dissimilar and likely compete weakly. As shown in the community-level weighted trait means analysis, common species were facultative wetland inhabitants, and FDiv was increasing with the coverage of agricultural land but decreasing with urban development. Consequently, the recent species turnover in Montréal must originate from species inhabiting surrounding agricultural land that possess very dissimilar traits to peatland inhabiting species. And as these peatlands possess unique features in an urban matrix, clustering at the tip of the phylogeny (NTI) is probably due to in situ environmental filtering (PC1 and PC2) and low dispersal rates of generalist saprophagous species from surrounding wetlands and exposed lands. Another of our study encompassing more environmental heterogeneity in Montréal region (Grégoire Taillefer and Wheeler Reference Grégoire Taillefer and Wheeler2017) showed that bogs have harsher environmental conditions compared with other wetland types, which also act as selective pressure. Therefore, heterogenisation of communities, FRic, and redundancy levels in bogs are systematically limited despite differences in species assemblages.
The large proportion of unexplained variation in beta diversity for each facet of biodiversity considered suggests that other factors are determining community patterns. These factors are probably spatially structured environmental factors, such as a combination of local and surrounding conditions with dispersal limitations. Moreover, taxonomic turnover was high among ecoregions, which increased phylogenetic turnover; and beta diversity was correlated with spatial distance except betaMPD, which was only affected by longitude. Soininen et al. (Reference Soininen, McDonald and Hillebrand2007) found in a meta-analysis that shifts in community composition were happening at the scale of 1000 km in line with large-scale variability in environmental conditions and that passive versus active dispersal did not have an effect on species turnover with increasing spatial scale. Here, betaMPD might be correlated more to Pleistocene glaciations and Holocene post-glacial dispersal, as these had a profound impact on Nearctic biotas in a diversity of habitats (Lafontaine and Wood Reference Lafontaine and Wood1988; Harris and Taylor Reference Harris and Taylor2010; Solecki et al. Reference Solecki, Buddle and Wheeler2016). Long-term dispersal limitation in an east–west direction, from coastal to more continental conditions, seems to shape the original beta diversity, as explained variation in betaMPD was mostly driven by pure spatial factors. Arnan et al. (Reference Arnan, Cerdá and Retana2015) found similar results to ours for the three diversity measures calculated in ant assemblages. Spatial factors thus dispersal limitation played a major role in shaping ant communities in different climatic and human disturbed environments across Europe.
Conclusions
The major forces shown to structure Diptera assemblages in this study in bogs across Québec are stochastic processes such as dispersal limitations of abundant, small, multivoltine species. The random patterns observed change to environmental filtering with increased anthropogenic disturbances modifying the landscape. The massive Diptera radiation that began in the early Cenozoic and the different historical disturbances are probably at the origin of the functional and phylogenetic structure observed for peatland Diptera. Using only traditional metrics, it would not have been apparent that Montréal bog communities are impacted by land use changes and that these impacts change the species pool capable of inhabiting these isolated unique habitats (Saito et al. Reference Saito, Soininen, Fonseca-Gessner and Siqueira2015b). This suggests that the three levels of diversity studied are complementary and give a different picture of macroecological patterns in those threatened habitats. Our results show that conservation of mobile organisms in bogs will depend on conservation plans focussing on both patch quality and surrounding landscape. Different conservation strategies need to be applied in different ecoregions. Montréal should be prioritised for biodiversity conservation through the re-establishment of habitat connectivity (Tewksbury et al. Reference Tewksbury, Levey, Haddad, Sargent, Orrock and Weldon2002; Staddon et al. Reference Staddon, Lindo, Crittenden, Gilbert and Gonzalez2010), and unique roles of wetlands should be key factors to maintain high species richness. In Saguenay, the large bog areas should be maintained as this diminishes the surrounding landscape pressure; and with the continuing increase of human-induced changes, this will become more important. Finally, protecting clusters of forest and wetlands in James Bay is a more effective conservation strategy than preserving islands of peatlands, as mobile organisms may see clusters of habitat as continuous potential niches instead of unreachable islands (Hatfield and LeBuhn Reference Hatfield and LeBuhn2007). Developing a standard approach and efficient techniques for large-scale biodiversity monitoring, such as high-throughput DNA sequencing (Gibson et al. Reference Gibson, Shokralla, Curry, King, Baird and Hajibabaei2015) to assess the efficacy of mitigation measures, would be highly valuable.
Supplementary material
To view supplementary material for this article, please visit https://doi.org/10.4039/tce.2019.5.
Acknowledgements
We are grateful to Dr. Stéphanie Pellerin and Dr. Jeffrey Cardille for discussion, comments, and help in designing the study. We thank Dr. Marjolaine Giroux, Robert Loiselle, and Entomofaune du Québec for support in grant applications. Joanie Tremblay collected samples in 2014. Kamil Chatila-Amos assisted with fieldwork and sample sorting in 2015. Site access and/or permits were provided by: Société des établissements de plein air du Québec; Regional County Municipality Maria-Chapdelaine; Nature Conservancy; Ministère du Développement durable de l’Environnement, de la Faune et des Parcs; Transport Canada; and the city of Blainville. Many thanks to Dr. Marjolaine Giroux and Stéphanie Boucher for identification of Sarcophagidae and Agromyzidae, respectively. This study was funded by a Natural Sciences and Engineering Research Council of Canada Discovery Grant to Terry Wheeler, and a Natural Sciences and Engineering Research Council of Canada Alexander Graham Bell Graduate Scholarship-Doctoral Programme to Amélie Grégoire Taillefer.
Conflict of interest
The authors declare that they have no conflict of interest.
Contribution of authors
Amélie Grégoire Taillefer conceived and designed the experiments, analysed the data, wrote the paper, prepared figures and/or tables, and reviewed drafts of the paper. Terry Wheeler designed the experiments and reviewed drafts of the paper. Dr. Terry Wheeler is deceased as of July 2017. This manuscript describes original work, is not under consideration by any other journal, and has not previously been submitted to The Canadian Entomologist in any form. This paper (or closely related research) has not been published or accepted for publication. No other paper using the same data set has been published. Data collected from four sites in Montréal have been used to describe community patterns in another research involving 12 wetland sites that was published in Insect Diversity and Conservation in 2017. All contributing authors agree with the presented findings and submission in this journal. All sources of funding are acknowledged in the manuscript, and no direct financial benefits are resulting from this publication. Consent for research involving human or animal is not applicable. Wetland owners issued permits for the fieldwork.


