


Introduction
Ti alloys have received considerable attention from the biomedical industry over the last few decades due to their outstanding properties [Reference Geetha, Singh, Asokamani and Gogia1], which has been confirmed by their massive use in orthopedic prostheses. To illustrate the importance of these applications, the global market for joint arthroplasty implants was valued at over $15.4 billion in 2015 [2]. In 2017, a total estimated 630,000 hip replacement procedures and 911,000 knee procedures were performed in the United States [Reference Abdelaal, Retrepo and Sharkey3]. Despite those significant numbers, patients have experienced setbacks in the medium and long term, such as implant migration, aseptic loosening, and osteolysis [Reference Iwana, Nishii, Miki, Sugano, Sakai, Ohzono and Yoshikawa4], increasing the need for revision surgeries. The phenomenon of stress shielding is a primary cause of these setbacks. After a surgical intervention such as hip arthroplasty, stress shielding consists of reducing the stress state to a bone relative to the level of stress to which the bone would be exposed if it were healthy [Reference Katti5]. This is a direct consequence of the difference between the modulus of elasticity of the prosthesis material and that of the bone.
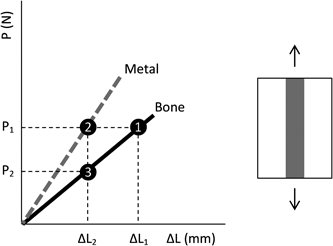
Figure 1 helps to understand the phenomenon of stress shielding. The load imposed on the bone depends on each person and is defined as P 1 on the curve. According to Hooke's law, this load level corresponds to the displacement of the bone ΔL 1 (point 1). When metal is implanted into the bone, the bone-implant system is loaded according to the drawing next to the curve. This situation, which is referred to as the deformation-controlled system, states the displacement at the interface between the different materials must be the same. Thus, for the same load P 1, due to the greater modulus of elasticity of a metal in relation to the bone, the displacement of the metal corresponds to ΔL 2 (point 2), reducing the displacement of the bone to this same value (point 3). Therefore, the load on the bone becomes P 2, a value lower than the bone without the implant. According to the Wolff's law [Reference Ahn and Grodzinsky6], the smallest solicitation of the bone results in a loss of bone mass, causing the implant to loosen.
Schematic drawing of the phenomenon of stress shielding.
The Co–Cr alloy and stainless steel have a modulus of elasticity, respectively, close to 240 and 210 GPa, whereas the modulus of the Ti–6Al–4V alloy is around 110 GPa [Reference Niinomi7]. Therefore, the implantation of a prosthesis manufactured in either Co–Cr alloy or stainless steel is less appropriate than an implant of the Ti–6Al–4V alloy. These three materials are most commonly used in the orthopedic field because they are highly resistant to corrosion due to the passive layer of the respective oxides formed on their surface. However, the Ti–6Al–4V alloy became most desirable due to its lower modulus of elasticity, which consequently presents fewer problems associated with implant loosening. It is an α+β type alloy and comprises the most widespread Ti alloy used in the manufacture of implants [Reference Leyens and Peters8]. The α and β are the equilibrium phases: α has a hexagonal closed packed (HCP) structure, whereas β has a body-centered cubic (BCC) one. In the α+β alloys, no amount of fast cooling would generate a microstructure with only β phase, but non-equilibrium martensites would be willing to form along retained β. In fact, non-equilibrium phases, such as martensitic α′ and α″ or submicroscopic ω, have been combined with the equilibrium phases due to their expected positive influence on the tensile mechanical properties [Reference Liu, Niinomi, Nakai, Cho, Narita, Sen, Shiku and Matsue9, Reference Ehtemam Haghighi, Lu, Jian, Cao, Habibi and Zhang10].
Mechanical properties may be defined as the utmost important criterion for the development of alloys for medical applications, especially when considering load-bearing parts. In fact, metal fatigue failures are known to account for approximately 90% of all mechanical service failures [Reference Campbell11]. From a fracture mechanics point of view, the fatigue life of a component corresponds to the sum of the time required for the nucleation of a crack with the time required for its growth to failure. What is very important is that fatigue damage is, by its very nature, a localized phenomenon rather than a bulk property, so that either surface or microstructural details should be carefully considered. Any discontinuity in the material becomes a potential problem under fatigue loading. The microstructural complexity of Ti alloys due to the combination of equilibrium and non-equilibrium phases to improve their tensile mechanical properties is already a significant issue. The problem is expanded when the biomedical Ti alloys are considered since their bioinert characteristic requires a surface conditioning that necessarily brings discontinuities. In addition, additive manufactured parts present several intrinsic discontinuities, such as lack of fusion and gas porosities.
Some articles have been published regarding the fatigue performance of Ti alloys. In the case of the widespread Ti–6Al–4V alloy, the microstructure required for implant applications is well established in the ASTM F136 standard, and hence recent works are mostly focused on the effect of different surface modification processes and of the structure obtained by different additive manufacturing processes. For any particular composition, it is normal that different structures and/or microstructures give rise to different fatigue behaviors, which may result from the presence of defects, phase distribution, interstitial content, etc. This is also evident for the metastable β type alloys due to the importance of the non-equilibrium phases on their behavior. In this scenario, an opportunity to gather recent advances on the fatigue performance of commercial Ti alloys for orthopedic applications was found to be interesting. This article demonstrates the relationship between the surface condition of Ti–6Al–4V and the fatigue response, including a modeling developed to predict a possible notch effect on the alloy. It also presents how the microstructure can be delicate especially in the metastable β alloys.
The Ti–6Al–4V Alloy and Traditional Materials
Microstructure and requirements
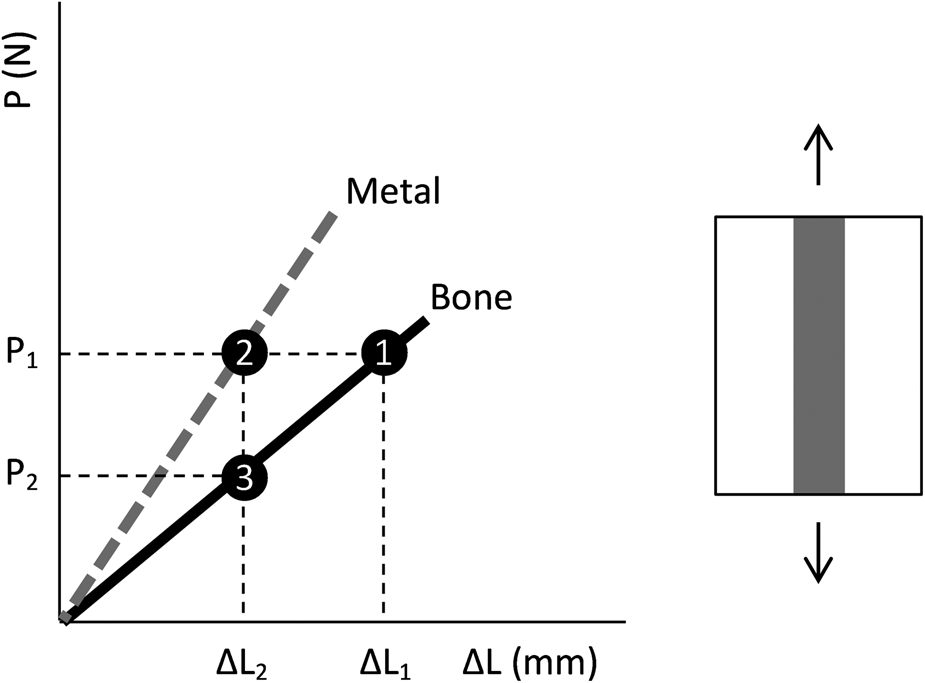
A systematic evaluation of the high cycle fatigue strength of the Ti–6Al–4V alloy as a function of its typical microstructure was performed by Wu et al. [Reference Wu, Shi, Sha, Sha and Jiang12]. A significant influence of the microstructure was observed, but the scattering of the fatigue results was high enough to overlap the data of the different microstructures, as shown in Fig. 2. Despite the scattering, the authors concluded that a trend could be observed and the fatigue strength decreased in the following order of microstructure: bimodal, lamellar, and equiaxed. Both the size and volume fraction of primary α determined the fatigue performance. For a fatigue life of 106 cycles, the strength in terms of maximum stress of the bimodal microstructure varied in the range of 400–1100 MPa when the primary α volume fraction was between 20 and 60%. It varied in the range of 400–1000 MPa when the primary α grain size was between 5 and 20 μm. For the same fatigue life, the strength of the equiaxed microstructure varied between 400 and 750 MPa when the primary α grain size varied from 2 to 12 μm. Although the authors found evidence that improved fatigue strength was possible with a bimodal microstructure, they recognized the need for further studies for a final conclusion.
High cycle fatigue results of Ti–6Al–4V with three different microstructural conditions. Reprinted with permission from Elsevier [Reference Wu, Shi, Sha, Sha and Jiang12].
It is a fact, however, that the ASTM specification for Ti–6Al–4V used in the manufacture of surgical implants (ASTM F136 standard) requires a fine dispersion of the α and β phases with no coarse or elongated α platelets. This means, along with other compositional requirements (extra-low content of interstitials, for example), the tensile and fatigue strengths are not expected to change significantly with the microstructure. However, the Ti alloys are biologically inert materials, meaning that living tissue is able to recognize them as foreign and thus tries to isolate them by encasing them in fibrous tissue, instead of promoting a favorable biological interaction [Reference Oldani, Dominguez and Fokter13]. This poor biological compatibility changes everything when considering the application on a fatigue perspective because a surface modification is necessary to obtain a bioactive material. Typically, this may be accomplished by introducing either roughness and porosity to the surface through physical methods, or by applying a bioactive coating through chemical methods [Reference Wang, Poh and Sieniawski14]. Because it is highly sensitive to the surface finish, the fatigue performance becomes critical due to a potential notch effect, or even a residual stress field, rather than microstructural features.
Growing a porous TiO2 oxide layer
Apachitei et al. [Reference Apachitei, Lonyuk, Fratila-Apachitei, Zhou and Duszczyk15] produced porous TiO2 coatings on the Ti–6Al–4V surface by plasma electrolytic oxidation (PEO). The coating thicknesses, which ranged from 8–12 and 18–22 μm depending on the oxidation time, were, respectively, named thin and thick coatings. XRD revealed a mixed crystalline structure of the TiO2 coatings with rutile prevailing over anatase. A decrease in fatigue resistance was observed in both coatings when the axial fatigue tests were performed and the thicker coatings were responsible for the higher reduction in the fatigue strength. At 6 × 10⁶ cycles, the fatigue strength in terms of stress amplitude was determined to be 270 MPa for the thinner coating and 220 MPa for the thicker coating, against the 580 MPa at 1 × 10⁶ cycles for the uncoated material. An identical trend was verified for Ti–6Al–7Nb, except for a slight decrease in the fatigue strength. The reasons for the deleterious behavior were not immediately conclusive, but a few observations could be made, such as the brittleness of the ceramic TiO2 film that could generate a crack under loading. In fact, surface cracks were observed on the surface of the coatings.
This hypothesis could be compared to the calculation reported by Campanelli et al. [Reference Campanelli, Bortolan, da Silva, Bolfarini and Oliveira16]. Independent of the surface modification used, an estimation of the size of a surface discontinuity that would cause a crack propagation at a stress level of 846 MPa was made. This stress value corresponded to the fatigue limit at 5 × 10⁶ cycles of the Ti–6Al–4V ELI alloy in terms of maximum stress. The estimation used the equations for the KBSCL solution established on the Fitness-for-Service section (FFS-1) of the American Society of Mechanical Engineers (ASME) code. The KBSCL solution describes the calculation of the mode I stress-intensity factor (K I) for a surface circumferential crack in a round bar under tension and/or bending, as shown in the following equation:
 $$K_{\rm I} = \lpar {M_{\rm m}{\rm \sigma }_{\rm m} + M_{\rm b}{\rm \sigma }_{\rm b}} \rpar \sqrt {{\rm \pi }a}, $$
where σm is the membrane stress component (the maximum fatigue stress of 846 MPa) and σb is the bending stress component (0 in this case). The corresponding geometric parameters M m and M b are calculated through the following equations:
 $$M_{\rm m} = \lpar {0.5{\rm /}{\rm \zeta }^{1.5}} \rpar \lpar {1 + 0.5{\rm \zeta } + 0.375{\rm \zeta }^2-0.363{\rm \zeta }^3 + 0.731{\rm \zeta }^4} \rpar, $$
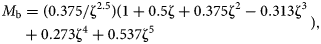 $$ \eqalign{M_{\rm b} &= \lpar {0.375{\rm /}{\rm \zeta }^{2.5}} \rpar \lpar {1 + 0.5{\rm \zeta } + 0.375{\rm \zeta }^2-0.313{\rm \zeta }^3 }\cr& + 0.273{\rm \zeta }^4 + 0.537{\rm \zeta }^5} \rpar, $$
where ζ is simply a function of the crack size a and the bar radius R 0 as described in the following equation:
 $${\rm \zeta } = \displaystyle{{1-a} \over {R_0}}.$$
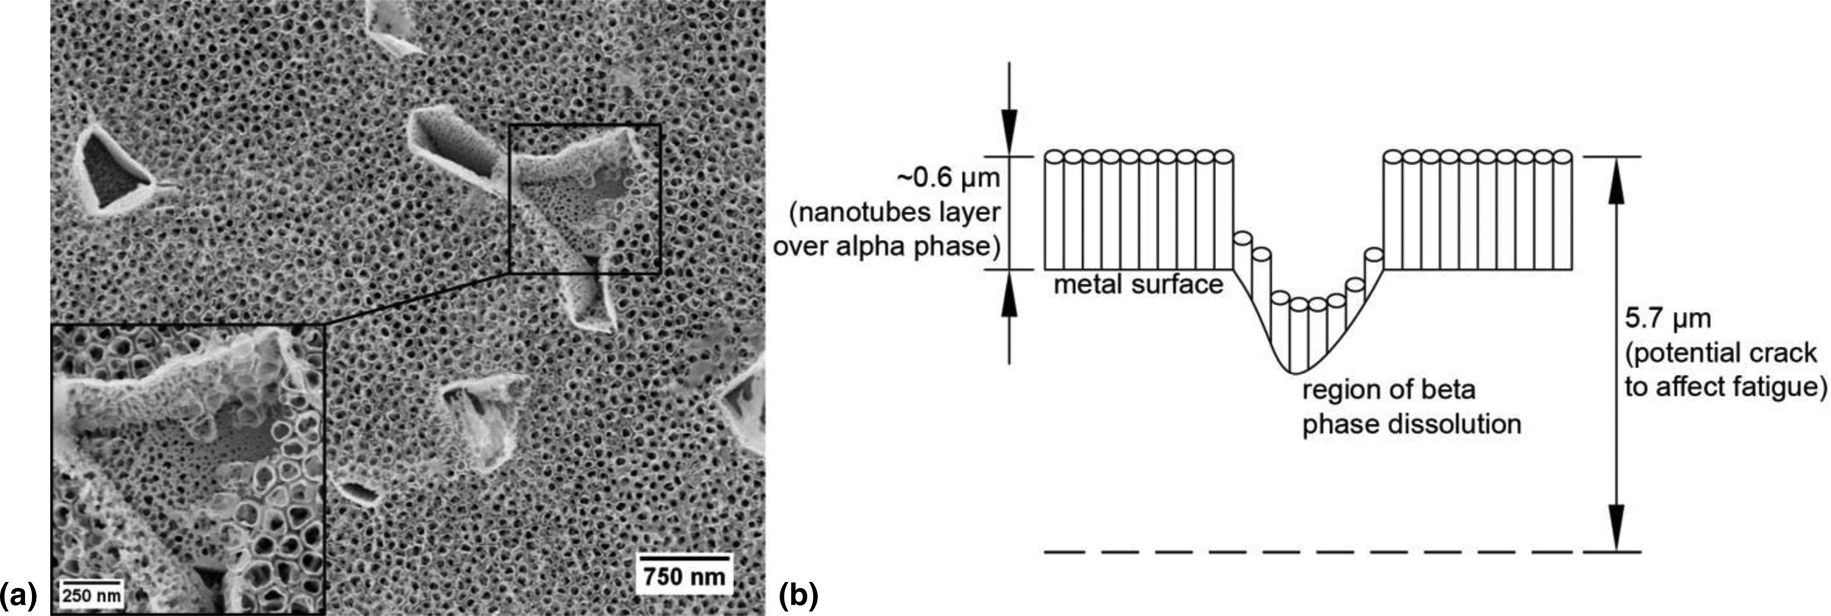
The KBSCL solution was chosen under the hypothesis that the oxide coating cracked during the initial fatigue cycles, resulting in a surface crack. The K I of Eq. (1) was assumed to be the threshold stress-intensity range (ΔKth) of 4 MPa√m reported by Boyce and Ritchie [Reference Boyce and Ritchie17]. Therefore, a minimum depth of 5.7 μm for a circumferential surface crack was determined to be the necessary value of an existing crack to propagate into the Ti–6Al–4V ELI substrate under a membrane stress of 846 MPa. Both PEO coatings presented in the article by Apachitei et al. [Reference Apachitei, Lonyuk, Fratila-Apachitei, Zhou and Duszczyk15] were thicker than 5.7 μm, which means that their first hypothesis of fatigue reduction would be reasonable.
The calculation made by Campanelli et al. [Reference Campanelli, Bortolan, da Silva, Bolfarini and Oliveira16] was also in a context of a TiO2 coating produced by anodic oxidation on the Ti–6Al–4V ELI surface but in the nanometer scale. An ordered array of self-organized nanotubes with an amorphous structure was grown to form a 600 nm thick layer. However, the layer had a non-homogeneous aspect that resulted from a differential etching of the α and β phases of the microstructure [Reference Macak, Tsuchiya, Taveira, Ghicov and Schmuki18]. Since the alloying element V is a β-stabilizer, the β phase regions were enriched with this element, which caused the dissolution of β until the underlying α was reached when the nanotubes started to grow. At the same time, the nanotubes were growing normally on the α phase regions, and the result was a layer with several discontinuities. Figure 3 shows an overview of the nanotubes layer (the insert would be a previous β phase region) and a drawing of the expected cross section. Even with this non-homogeneity of the TiO2 coating, the axial fatigue performance was not changed. Being in a nanometer scale, both the thickness of the coating and the valleys generated with the dissolution of β were considerably smaller than the size of a potential circumferential surface crack. If a crack would somehow be generated during the fatigue loading, it would not propagate through the substrate, thus justifying the unaffected fatigue performance.
(a) SEM micrograph of the nanotubes layer on the Ti–6Al–4V surface. (b) A schematic drawing of the expected cross section (values not in scale). Reprinted with permission from Elsevier [Reference Campanelli, Bortolan, da Silva, Bolfarini and Oliveira16].
Another surface modification that confirms the size calculated for a potential circumferential surface crack is described in the work of Potomati et al. [Reference Potomati, Giordani, Duarte, de Alcântara and Bolfarini19]. The Ti–6Al–4V ELI alloy went through a micro-arc oxidation (MAO) process. The oxide was formed by many micro-protrusions containing uniformly distributed pores due to the dielectric breakdown of the anodic film that happened when the TiO2 layer was growing. The diameter of the pores varied in a range of a few microns. The thickness of the ceramic oxide layer was about 570 nm when measured by SEM in fatigue fractured specimens. This thickness value is only 10% of the minimum depth required for a potential crack. Therefore, the fatigue performance of the alloy with an MAO coating was identical to the one of the uncoated Ti–6Al–4V ELI alloys. Similar results were obtained by Campanelli et al. [Reference Campanelli, Duarte, da Silva and Bolfarini20] when the MAO process was applied over the surfaces of commercially pure Ti (CP-Ti) and Ti–6Al–7Nb alloy. The theoretical thicknesses of the oxide coatings were in the ranges of 400–600 nm for CP-Ti and 280–420 nm for Ti–6Al–7Nb. Once again, the fatigue behavior of both the coated materials was not altered.
Returning to the work of Apachitei et al. [Reference Apachitei, Lonyuk, Fratila-Apachitei, Zhou and Duszczyk15], the second hypothesis for the deleterious effect of the PEO coatings on the fatigue strength was the accumulation of residual stresses. In PEO coatings on CP-Ti, the anatase phase was found to induce compressive residual stresses, while tensile stresses were generated by the rutile phase [Reference Khan, Yerokhin and Matthews21]. According to the authors, this would mostly result from thermal stresses, since the Ti substrate and the anatase and rutile phases have different thermal expansion coefficients (rutile having the lowest value). In addition to the formation of surface cracks, the deleterious effect of the surface modification on the fatigue performance was attributed to the tensile residual stresses that emerged from the rutile phase formation. In fact, when the oxide layer thickness increased, the anatase phase could no longer be detected by XRD. This suggests that the rutile phase dominated the oxide layer and therefore the tensile stresses were intensified, reducing even more the fatigue performance of the alloy. For the thinner coating, the presence of some anatase induced compressive stresses that balanced the tensile stresses due to the rutile. So, the reduction of the fatigue performance was less pronounced.
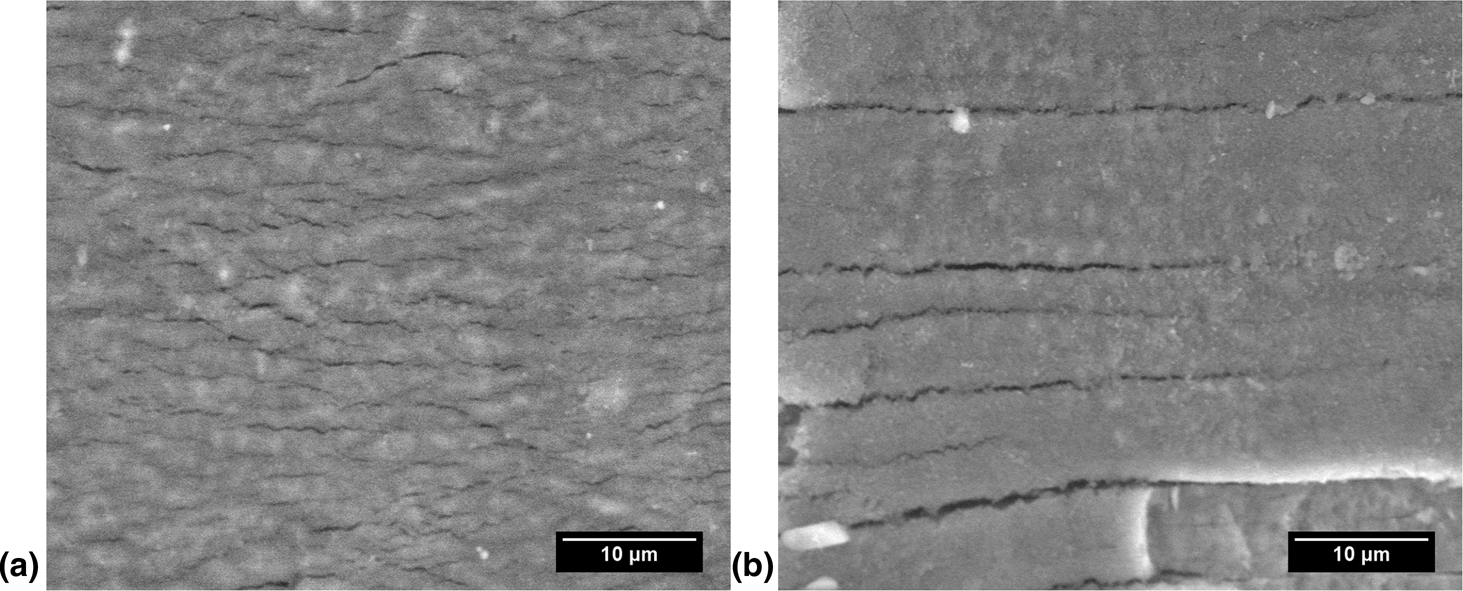
A comparable behavior was verified by Campanelli et al. [Reference Campanelli, da Silva, Oliveira and Bolfarini22] with CP-Ti. A well-organized array of nanotubes was grown by anodic oxidation. A completely homogeneous arrangement was produced due to the sole presence of α phase in the underlying microstructure of the CP-Ti. The average length of the nanotubes layer was 1 μm, meaning the thickness was not supposed to influence the fatigue behavior. Since the anodic oxidation typically results in an amorphous oxide structure over Ti and its alloys, different heat treatments were performed to change the structure of the oxide layer to a crystalline one. The axial fatigue behavior was not changed for the specimens annealed at 450 °C, where the XRD results proved the formation of the anatase phase. On the other hand, the fatigue performance was adversely affected when the rutile phase prevailed in the oxide layer for the specimens annealed at 650 °C. It is important to note that no microstructural alterations of the CP-Ti substrate were verified after the heat treatments. When tested fatigue specimens were analyzed by SEM, several cracks were observed on both coatings, but with a fundamental difference. As shown in Fig. 4, fewer and larger cracks were detected in the oxide dominated by the rutile phase, whereas smaller cracks were seen in the layer with anatase. The likely tensile residual stresses associated with the rutile phase may have increased the size of the cracks. The cracks reached a critical size earlier than the cracks formed in the oxide with anatase, explaining the lower fatigue strength.
SEM micrographs of the oxide layer on the CP-Ti surface. (a) Sample annealed at 450 °C (anatase structure). (b) Annealed at 650 °C (rutile structure). Reprinted with permission from Materials Research [Reference Campanelli, da Silva, Oliveira and Bolfarini22].
Changing the surface roughness
Leinenbach and Eifler [Reference Leinenbach and Eifler23] assessed the fatigue-induced damage of traditional Ti alloys with different surface modifications. In regard to the Ti–6Al–4V alloy, grit-blasted surfaces were produced through air shot-peening and Al2O3 (corundum) shot. A coarse surface structure was obtained, and some corundum particles were partly embedded in the surface. Surface roughness in terms of the R a parameter, which corresponds to the average absolute deviation of the roughness irregularities from the mean line (gray painted area in Fig. 5) [Reference Gadelmawla, Koura, Maksoud, Elewa and Soliman24], was in the range of 4–6 μm. The compressive residual stresses previously created by the grinding and polishing processes were reduced by the grit-blasting process. Therefore, the fatigue behavior was believed to be essentially determined by the surface topography. The fatigue endurance limit for axial loading was estimated as 475 MPa in terms of stress amplitude, a value around 25% lower than of the polished material. The corundum particles may have worked as a strong stress concentrator, since the fatigue crack initiated mainly in the vicinity of these particles.
Schematic roughness profile and definition of the dimensions required in the calculation of both the R a and R z roughness parameters.
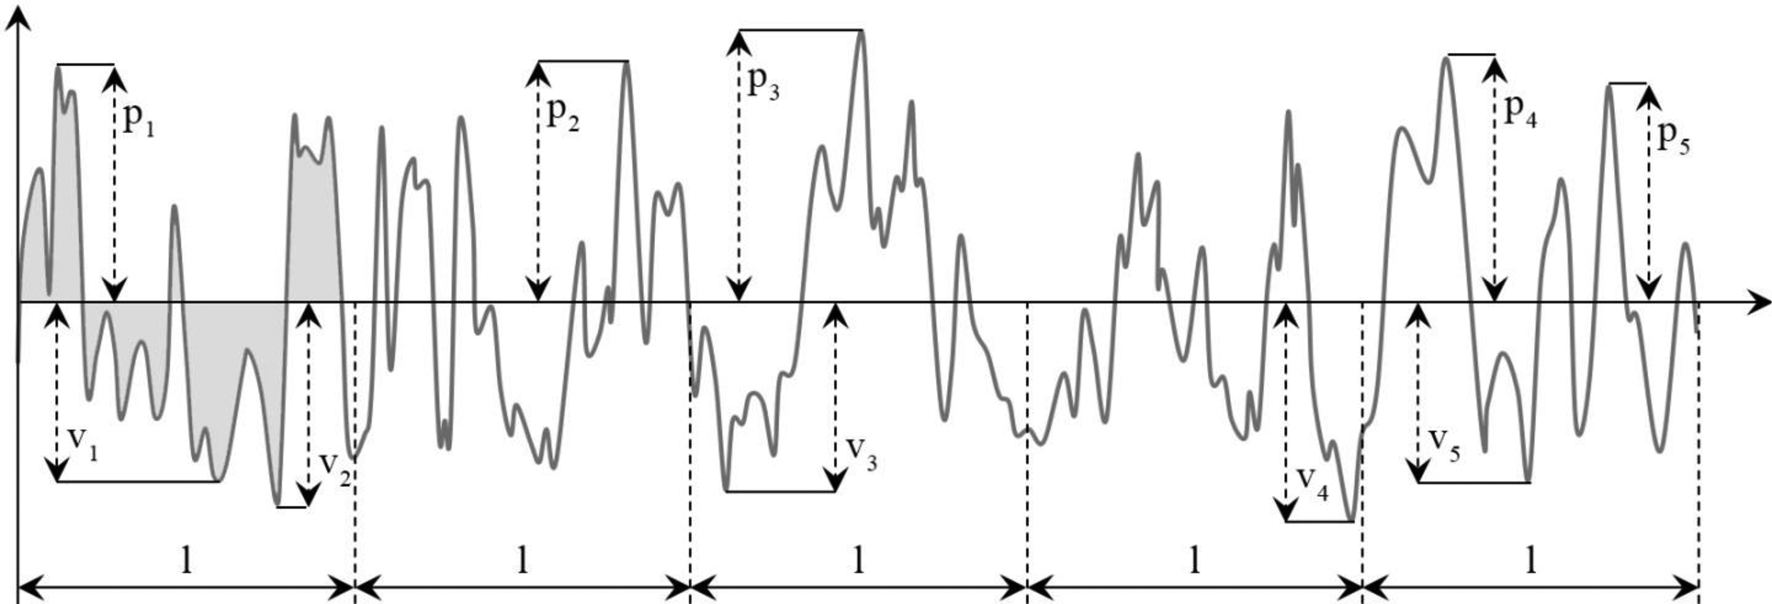
Escobar Claros et al. [Reference Escobar Claros, Oliveira, Campanelli, da Silva and Bolfarini25] modified the surface of the Ti–6Al–4V ELI alloy using a protocol of acid etching combined with alkaline treatment. A previous work had demonstrated that such protocol was effective for developing a surface texture in the micrometer scale containing nanometric features that increased the expression of some bone-related genes and promoted the osseointegration phenomenon [Reference Oliveira, Palmieri, Carinci and Bolfarini26]. An estimation of the surface modification depth was performed based on the R z roughness parameter. It is defined by the international ISO system as the difference in height between the average of the five highest peaks and the five lowest valleys, and also by the German DIN system as the average of the summation of the five highest peaks and the five lowest valleys [Reference Gadelmawla, Koura, Maksoud, Elewa and Soliman24]. With the help of Fig. 5, Eqs. (5) and (6) might be applied in the calculation of R z:
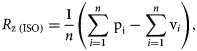 $$R_{{\rm z}\;\lpar {{\rm ISO}} \rpar } = \displaystyle{1 \over n}\left({\mathop \sum \limits_{{\it i} = 1}^n \hbox{\,p}_{\rm i}-\mathop \sum \limits_{{\it i} = 1}^n \hbox{v}_{\it i}} \right),$$
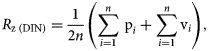 $$R_{{\rm z}\;\lpar {{\rm DIN}} \rpar } = \displaystyle{1 \over {2n}}\left({\mathop \sum \limits_{{\it i} = 1}^n \hbox{\,p}_{\it i} + \mathop \sum \limits_{{\it i} = 1}^n \hbox{v}_{\it i}} \right),$$
where n is the number of samples along the assessment length. Considering the R z roughness parameter, the surface roughness was in the range of 1.84–2.24 μm. For the axial tests, the fatigue limit in terms of maximum stress at 5 × 10⁶ cycles was 842 MPa for the polished surface and 850 MPa for the etched surface. Both presented a standard deviation value of 27 MPa. Hence, no statistical differences were discovered between the fatigue responses of the two surface conditions of the Ti–6Al–4V ELI alloy.
When a longer exposure time in the acid solution was employed by da Silva et al. [Reference da Silva, Campanelli, Escobar Claros, Ferreira, Oliveira and Bolfarini27] (2 h against 0.5 h), the R z roughness increased to a range of 8.40–11.50 μm. The fatigue limit in terms of maximum stress was 594 MPa at 5 × 10⁶ cycles, that is, around 30% lower than the values aforementioned. This reduction was attributed to the increase in roughness. To prove this hypothesis, the authors developed a mathematical model to predict the fatigue limit of Ti–6Al–4V ELI when it was correlated to a theoretical semi-circular notch described by the R z roughness parameter. The effect of the roughness was evaluated by the fatigue notch factor (K f). The difference for the monotonic concentration factor (K t) lies in the fact that K f depends on the material. Below a certain tip radius of the notch, its effect decreases and becomes negligible. In fact, in the case of the fatigue resistance, the maximum stress value at the notch tip, which increases as the radius of curvature decreases, must be balanced by the volume of material affected by the stress concentration [Reference Milella28]. The calculation of K f was based on the Siebel and Stieler approach [Reference Siebler and Stieler29] described by the following equation:
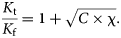 $$\displaystyle{{K_{\rm t}} \over {K_{\rm f}}} = 1 + \sqrt {C \times {\rm \chi }}. $$
The parameter χ was simply related to the radius of curvature, but C is a material constant and needed to be determined for the Ti–6Al–4V ELI alloy. For this, the fatigue life was obtained experimentally with specimens containing a machined circumferential and semi-circular mechanical notch of around 90 μm radius. The calculation of K t was based on the classical theory of elasticity for linear elastic materials with the following equation [Reference Young and Budynas30]:
 $$K_{\rm t} = 3.04-5.42\left({\displaystyle{{2r} \over D}} \right) + 6.27\left({\displaystyle{{2r} \over D}} \right)^2-2.89\left({\displaystyle{{2r} \over D}} \right)^3,$$
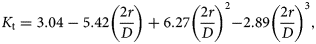
where r is the notch radius (approximately R z) and D is the specimen diameter. For the determination of K f at the notch tip, the total strain was calculated from the theory of strain partitioning described in Eq. (9) [Reference Landgraf31], and the total stress was calculated with Eq. (10) of the hysteresis loop:
 $$\displaystyle{{{\rm \Delta }{\rm \varepsilon }} \over 2} = \displaystyle{{{\rm \sigma }_{\rm f}^{\prime} + {\rm \sigma }_{\rm m}} \over E}\lpar {2N} \rpar ^{\rm b} + \varepsilon _{\rm f}^{\prime} \lpar {2N} \rpar ^c,$$
 $${\rm \Delta }{\rm \varepsilon } = \displaystyle{{{\rm \Delta }{\rm \sigma }} \over E} + 2\left({\displaystyle{{{\rm \Delta }{\rm \sigma }} \over {2{K}^{\prime}}}} \right)^{{1 \over {{n}^{\prime}}}}.$$
The constants σf′, εf′, b, c, K′, and n′ were taken from the work of Ploeg et al. [Reference Ploeg, Burgi and Wyss32] and σm was zero due to the stress shake-down effect in the plastic regime. K f was calculated through the Neuber's rule for the plastic regime described in the following equations:
 $$K_{\rm f} = \sqrt {K_{\rm \sigma } \times K_{\rm \varepsilon }}, $$
 $$K_{\rm \sigma } = \displaystyle{{{\rm \Delta \sigma }} \over {{\rm \Delta }S}},$$
 $$K_{\rm \varepsilon } = \displaystyle{{{\rm \Delta }{\rm \varepsilon }} \over {{\rm \Delta }e}}.$$
Therefore, it was found that C was equal to 5.8 μm and a radius of curvature of 120 μm would render the maximum value of K f. By approximating the radius of curvature to the R z roughness, the curve shown in Fig. 6 was obtained, indicating the theoretical fatigue limit as a function of a semi-circular notch. The peak stress at the notch tip increases with the decrease of the notch radius; at the same time, the volume of material where the stresses are larger than a critical value decreases. This critical value corresponds to K f = 1 and was calculated for semi-circular notches of 2.8 μm, below which the volume of material affected by the local peak stress is not significant to affect the fatigue performance.
Curve of the fatigue limit (in terms of maximum stress) of the Ti–6Al–4V ELI alloy as function of the surface roughness. Reprinted with permission from Elsevier [Reference da Silva, Campanelli, Escobar Claros, Ferreira, Oliveira and Bolfarini27].
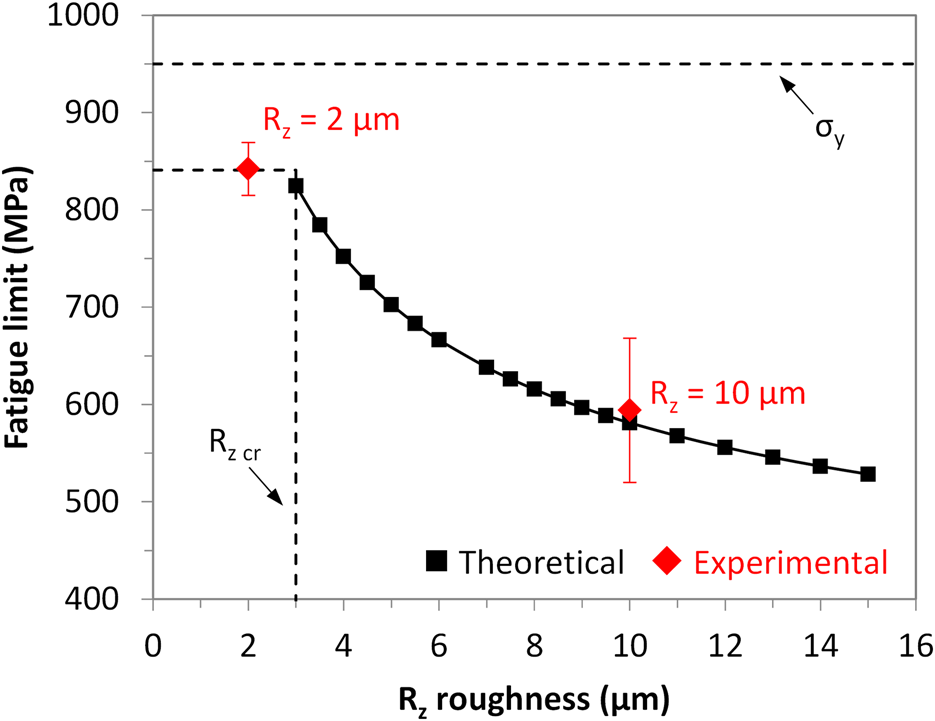
To confirm the model, the experimental values of the fatigue limit previously calculated for the chemically treated materials were plotted in the prediction curve of Fig. 6. After 0.5 h of acid etching, an average R z of 2 μm was below the critical notch and therefore led to 842 MPa of fatigue limit, a value similar to the one for the untreated material. On the other hand, after 2 h of acid etching, an average R z of 10 μm was larger than the critical notch, leading to a higher K f value. Since a greater volume of material was subjected to the maximum stress level, there was an increased probability of finding a poor metallurgical condition or a defect ahead of the notch tip that would cause a failure at a lower stress level. Indeed this did result in a drop of the fatigue limit to 594 MPa, against a predicted value of 582 MPa, a reasonably good agreement with the experimental results. This prediction method may be useful to understand the behavior of the Ti–6Al–4V alloy with the surface roughness modified in scales on the order of a few microns, allowing the abbreviation of the development stage of orthopedic implants made of the alloy. It is worth noting, however, that a possible residual stress would have a negligible influence since the method appropriately explained the fatigue response based on the roughness effect.
This prediction method was employed to assess the fatigue response of the Ti–6Al–4V alloy with a surface modification with a femtosecond laser by dos Santos et al. [Reference dos Santos, Campanelli, da Silva, Vilar, de Almeida, Kuznetsov, Achete and Bolfarini33], and residual stresses were measured in their work. By performing bending fatigue tests, a fatigue strength value of 725 MPa was obtained at 5 × 10⁶ cycles for the untreated material. A reduction to 650 MPa was observed for the laser-treated material. A confidence band of 95% computed according to the ASTM E739 standard showed that the difference in the S-N curves of both the surface conditions was statistically significant. One hypothesis investigated was the presence of residual stresses. However, it was easily rejected since the values of residual stresses at the surface were very small and even lower in the modified material when compared to the unmodified one. Another hypothesis was a possible microstructural alteration due to the heat input during the laser processing. No microstructural changes were identified by SEM near the surface, including the absence of a critical layer of α-case, which was calculated as being 9 nm thick only. A third hypothesis was initially based on the observation that the fatigue initiation site changed. In the untreated material, a crack nucleated in the edge of the rectangular section specimens, while the modified specimens presented crack initiation around the center of the laser-treated surface.
The measurement of the surface roughness through different techniques revealed R z values of around 3 μm for the untreated material and 7 μm for the laser-treated material. Concerning the prediction curve of Fig. 6, a fatigue limit value of 824 MPa would be expected for 3 μm of roughness and 640 MPa would be expected for 7 μm of roughness. In the former, the experimental fatigue strength was actually 725 MPa. The difference was attributed to the effect of the corner on the specimens with a rectangular cross section, since the prediction method was developed with cylindrical specimens. In the latter, the experimental fatigue strength was 650 MPa, a value in agreement with the predicted value. This means that the effect of the surface roughness introduced by the laser surpassed the effect of the sharp corner. Therefore, the fatigue decrease was rigorously due to the notch effect.
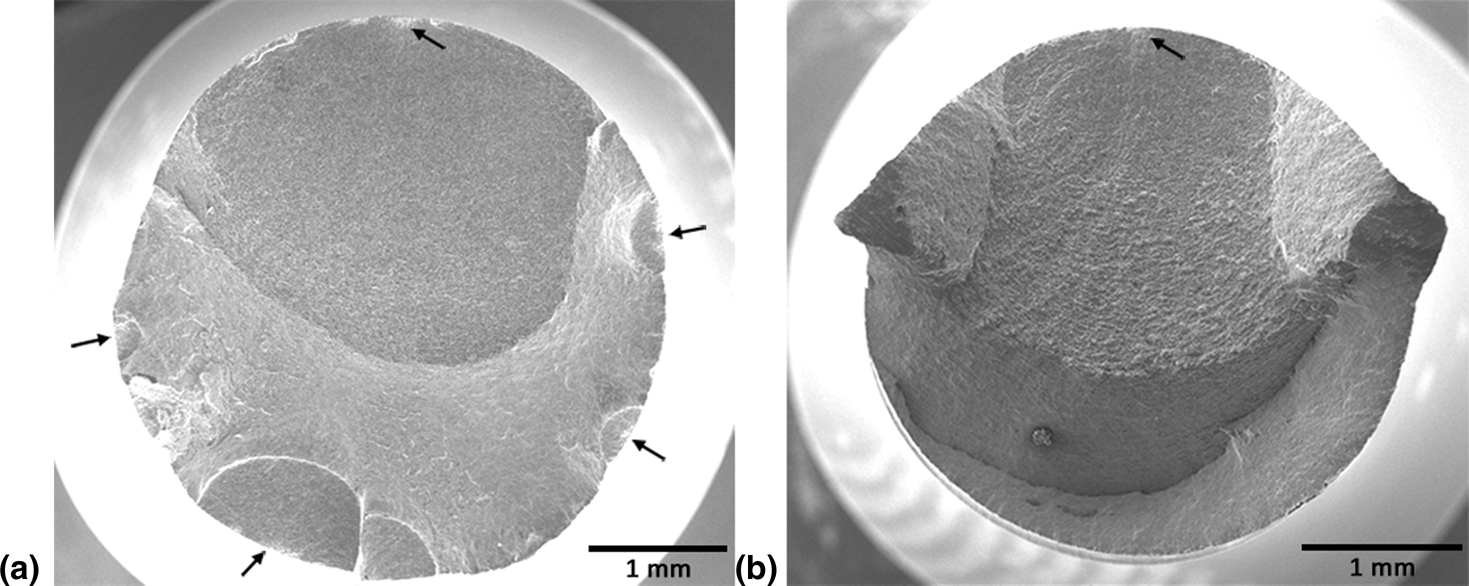
Potomati et al. [Reference Potomati, Campanelli, da Silva, Simões, de Lima, Damião and Bolfarini34] also reported a deleterious effect of a Nd:YAG laser irradiation (power of 22.5 W and intensity of 3.44 × 10⁹ W/cm2) in the fatigue behavior of the Ti–6Al–4V ELI alloy. The axial fatigue tests revealed a fatigue strength value of 840 MPa for the untreated material, against 550 MPa of the laser-treated alloy. Confidence bands were calculated according to the ASTM E739 standard to show that the difference in the fatigue behaviors of both the conditions was statistically significant. Strong evidence of the effect of the surface modification was obtained in the fatigue fracture surfaces, such as the multiple crack initiation sites in the treated specimens. As illustrated in Fig. 7, several initiation sites are observed in the irradiated Ti–6Al–4V ELI alloy (black arrows), in contrast to the typical fracture resulting from crack propagation from a single initiation site in the untreated alloy. This change in behavior was attributed to the increase in roughness caused by the laser processing to an average value of 12.9 μm for the R z parameter. For such notch dimension, the prediction curve of Fig. 6 provides a theoretical fatigue limit of 545 MPa, which is once again in perfect agreement with the measured value. The authors therefore concluded that the fatigue reduction resulted from the increase in roughness, rather than other possible effects.
SEM micrographs of the fatigue fractures. (a) A specimen with surface modified by Nd:YAG laser irradiation. (b) A specimen with an untreated surface. The black arrows indicate the sites of crack initiation. Reprinted with permission from Materials Research [Reference Potomati, Campanelli, da Silva, Simões, de Lima, Damião and Bolfarini34].
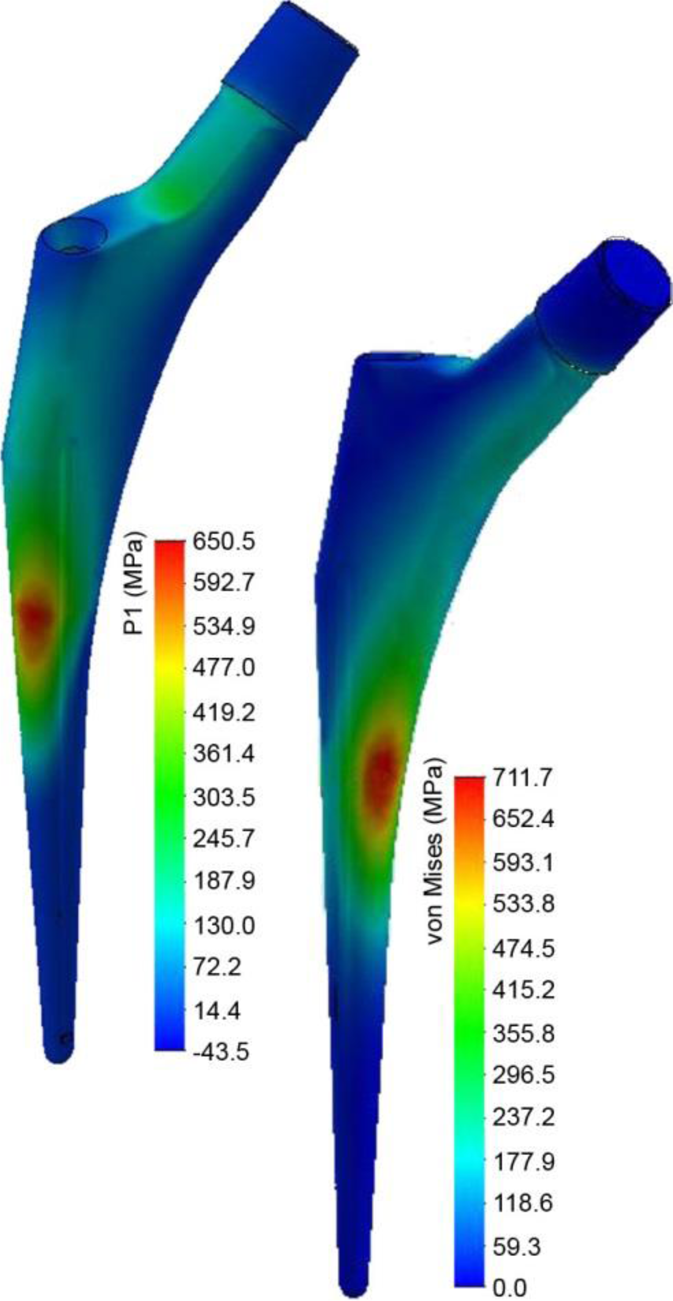
In this paper [Reference Potomati, Campanelli, da Silva, Simões, de Lima, Damião and Bolfarini34], an interesting analysis was performed when the experimental fatigue limit was confronted with the requirements of real hip stems. A large concern with hip stems was formerly reported by Ploeg et al. [Reference Ploeg, Burgi and Wyss32] when the accuracy of fatigue test prediction methods was evaluated through an extensive research on the deformation partitioning method. In the case of the previous article [Reference Potomati, Campanelli, da Silva, Simões, de Lima, Damião and Bolfarini34], a simpler but very appropriate assessment drew the attention to the cautions that are necessary when dealing with a surface modification process that aims to increase the roughness for osseointegration improvement. The authors mentioned that principal stresses above 500 MPa were typically reported in the literature at critical points of such hip stems. The simulation of the stress distribution in a commercial stem for revision surgery through finite element analysis (FEA) was reported and is reproduced in Fig. 8. Although the boundary conditions were not detailed, the simulation showed that principal stresses in the range of 400–650 MPa occurred in critical regions of the stem. If the Nd:YAG laser irradiation developed (meaning with the processing parameters studied) were applied over the stem's surface, a premature fatigue fracture of the stem would occur. In this case, the application of the laser processing would require a redesign of the hip stem. Otherwise, other processing parameters should be assessed to avoid the notch effect.
Simulation by FEA of the first principal and the von Mises stress distributions in a commercial hip stem. Reprinted with permission from Materials Research [Reference Potomati, Campanelli, da Silva, Simões, de Lima, Damião and Bolfarini34, Reference Bolfarini, Campanelli and Guerra35].
At this point, a question may arise about the acceptable limit of the maximum fatigue stress level. In the work by Semlitsch et al. [Reference Semlitsch, Panic, Weber and Schoen36] published in the ASTM STP796, a rotating bending fatigue strength of 400 MPa was reported to be the minimum requirement of hot-forged Ti–6Al–4V for hip implants. Tarr et al. [Reference Tarr, Clarke, Gruen and Sarmiento37] reported in the same ASTM publication the fatigue stress value of 550 MPa as a failure criterion for a Ti–6Al–4V alloy to be employed in femoral stems. These values are nearly within the same range pointed out by Potomati et al. [Reference Potomati, Campanelli, da Silva, Simões, de Lima, Damião and Bolfarini34] when Fig. 8 is considered. Taking the value of 550 MPa in the prediction curve in Fig. 6, R z is 11 μm. This means that surface modifications producing roughness values above 11 μm may result in a fatigue fracture.
The Metastable β Alloys
The development of several metastable β-type compositions has been primarily motivated to further reduce the modulus of elasticity to minimize the stress shielding. Additionally, the systems of this new generation of Ti alloys are composed of non-toxic alloying elements because long-term diseases have been associated with the presence of Al and V in the Ti–6Al–4V alloy [Reference Niinomi, Nakai and Hieda38, Reference Li, Yang, Zhao, Qu, Li and Li39]. Tomljenovic [Reference Tomljenovic40] affirmed that solid experimental evidence has proved the contribution of Al to Alzheimer's disease, and therefore, immediate efforts are required to reduce the exposure to this element. In the case of V, Wilk et al. [Reference Wilk, Szypulska-Koziarska and Wiszniewska41] alerted for the toxic effects of this metal on many organs, including the stomach, intestines, liver, kidneys, and male and female reproductive systems. Engelhart and Segal [Reference Engelhart and Segal42] strongly recommended to implant manufactures to consider using V-free alloys after a diagnosis of V allergy.
In regard to the metastable β-type alloys, the lowest desirable values of the modulus of elasticity are achieved when the alloys are solution treated in the β phase field, since the microstructure is not supposed to have secondary phase precipitates. However, the tensile and fatigue strengths of the β alloys in such condition are rather poor when compared with those of Ti–6Al–4V ELI [Reference Niinomi, Nakai and Hieda38]. Typically, better tensile and fatigue strengths are obtained through aging the alloy to form secondary phases, such as the equilibrium α and the non-equilibrium ω phases. The problem is that precipitation hardening also increases the modulus of elasticity. An adequate design of the microstructure is therefore required to obtain a proper balance of mechanical properties, without neglecting the fact that the fatigue behavior is sensitive to either surface or microstructural discontinuities.
Some results on the fatigue performance of different metastable β alloys have been recently presented. Nakai et al. [Reference Nakai, Niinomi and Oneda43] showed that an improvement of the fatigue performance of the Ti–29Nb–13Ta–4.6Zr alloy could be achieved when subjecting this alloy to a severe cold rolling combined with a short aging treatment to precipitate the ω phase. The texture generated by the rolling made the ω phase to be preferentially oriented in a direction that was effective in inhibiting the increase of the modulus of elasticity. The axial fatigue strength of the alloy after solution treating was 320 MPa in terms of maximum stress at 1 × 10⁷ cycles. An increase to 580 MPa was found when the ω phase was conveniently precipitated, maintaining the modulus of elasticity at a value below 80 GPa. A good balance of modulus of elasticity, tensile, and fatigue properties was successfully obtained due to a slight amount of crystallographically oriented ω phase.
Working with the same alloy, Song et al. [Reference Song, Wang, Niinomi, Nakai and Liu44] introduced TiB reinforcements to improve its fatigue performance. The axial fatigue strength increased for all B additions in the following order of B concentration: 0.05, 0.20, and 0.10% (weight). A fatigue strength value of around 550 MPa in terms of maximum stress at 1 × 10⁷ cycles was the best one achieved for the alloy with 0.1% of B, which was 67% greater than the fatigue strength of the Ti–29Nb–13Ta–4.6Zr alloy itself. The authors had reported in a previous article that the modulus of elasticity was kept below 70 GPa with B additions up to 0.50% [Reference Song, Niinomi, Tsutsumi, Nakai and Wang45]. The favorable effect of the TiB particles on the fatigue behavior was related to their size and distribution. Briefly, the particles acted as a barrier for the dislocation movement, which resulted in the delay of the fatigue crack nucleation that happened on the surface. The change in the direction of the fatigue striations by the nearby TiB particles revealed a crack deflection, suggesting that the crack growth rate also decreased. However, when the particles were large enough, especially for B concentration above 0.20%, crack initiated internally with the debonding of those particles from the matrix. In this case, the voids that resulted from the interfacial decohesion provided a path for the easy crack propagation, leading to a lower fatigue resistance.
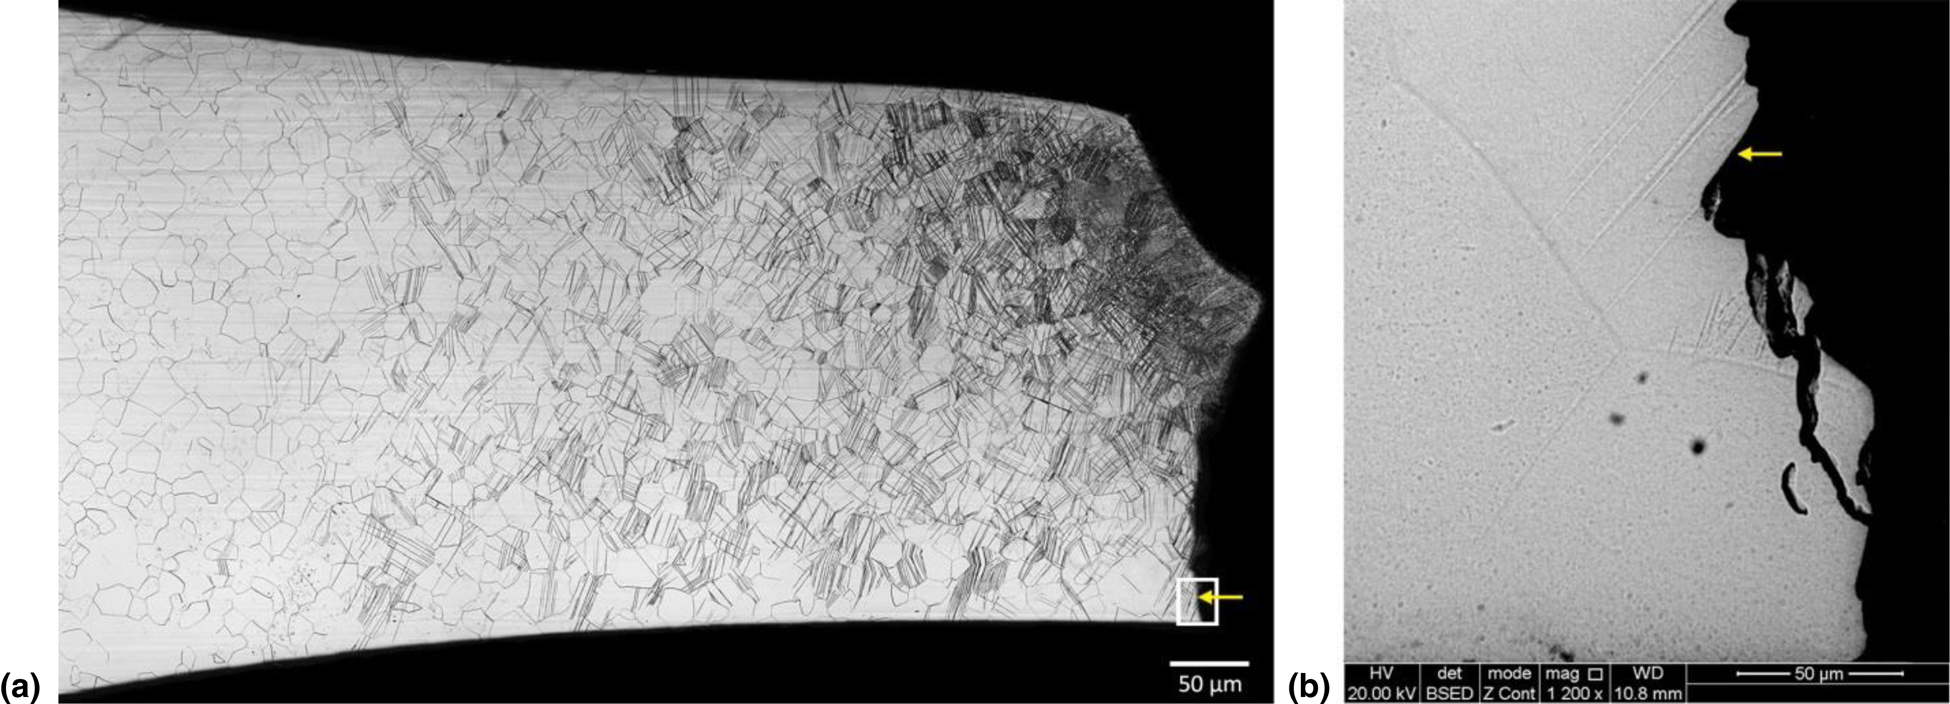
Campanelli et al. [Reference Campanelli, Coury, Guo, da Silva, Kaufman and Bolfarini46] assessed the fatigue behavior of the commercial Ti–15Mo alloy. The as-received material presented a surprising amount of {332}〈113〉 twins that were formed during the mechanical processing of the material. A solution treatment in the β phase field and subsequent water quenching were sufficient to completely remove the twins. This treatment decreased the tensile strength and increased the ductility, but maintained the modulus of elasticity at around 80 GPa. Nanocrystalline particles of ω phase were found in both the microstructures, suggesting they precipitated irrespective of the presence of twins. The axial fatigue tests showed a similar behavior of the microstructures, with a fatigue limit value in the range of 500–560 MPa despite the different tensile properties. As presented in Fig. 9, in all the samples that were treated, the twinned structure reappeared during the fatigue tests in the region close to the fracture surface. This phenomenon led the solution heat-treated alloy to a microstructural condition similar to the untreated alloy, explaining the similar fatigue performance. The right micrograph, in Fig. 9, highlights the fatigue crack initiation region. Subsurface nucleation in a twin plane occurred in all the tested samples. Pile-ups of screw dislocations were observed at both sides of the twins that were oriented at approximately 45° to the main stress axis, that is, in the 〈111〉 direction of the BCC structure. Since the slip direction was not parallel to the twin, the stress concentration in the twin resulted in a fracture in the twin plane. In summary, the reason for the appearance of the twins that dictated the fatigue crack initiation was the non-equilibrium ω phase, which was responsible for hindering the localized plastic deformation. In fact, the ω phase is intrinsic to the 15% of Mo [Reference Ho47]. With such a mechanism operating, the tensile and fatigue properties reached promising levels for a metastable β-type alloy.
Microstructure of the Ti–15Mo alloy in the solution treated and quenched condition after the fatigue test. (a) The longitudinal cross section of a fractured specimen. (b) The amplification of the crack initiation region. The arrow indicates the initiation site. Reprinted with permission from Elsevier [Reference Engelhart and Segal42].
The same alloy was mechanically tested after being subjected to anodic oxidation by Campanelli et al. [Reference Campanelli, Oliveira, da Silva, Bolfarini, Palmieri, Cura, Carinci and Motheo48] to improve the surface bioactivity. In fact, a previous study on the development of nanostructured anodized surfaces on the Ti–15Mo alloy had been performed by Oliveira et al. [Reference Oliveira, Verdério and Bolfarini49]. This alloy required more stringent experimental conditions to grow an organized layer of nanotubes when compared with the Ti–6Al–4V alloy. A strong reduction in the fatigue performance was observed when the alloy with a perfect arrangement of nanotubes was submitted to the fatigue testing. Corrosion pits, with up to 50 μm in size, were later detected below the modified surface, which were responsible for the premature fatigue crack nucleation. The effect of the pits exceeded the influence of both the ω phase and the deformation twins. The experimental parameters of the anodic oxidation had to be redeveloped to avoid the formation of corrosion pits. A partially formed layer of nanotubes was only possible to maintain the fatigue resistance at the same level of the material without a surface modification. An oxide layer of 700 nm length resembling a nanoporous structure, rather than nanotubular, was therefore the best choice for the modification of the Ti–15Mo alloy.
Based on the work of Campanelli et al. [Reference Campanelli, da Silva, Jorge and Bolfarini50] with the Ti–5Al–5Mo–5V–3Cr alloy, a final consideration concerning a metastable β alloy may be made, although this alloy is used in the aeronautical industry rather than the biomedical field. The axial fatigue tests were performed in a microstructure containing a large volume fraction of fine secondary α needles and large α laths throughout the β matrix. A significant difference in the fatigue performance was observed when the H content varied within a commercially acceptable limit. When the H content, that is, the quantity of hydrogen dissolved in the Ti matrix was around 30 ppm (weight), the fatigue limit in terms of maximum stress was 758 MPa at 5 × 10⁶ cycles. It decreased to 658 MPa when the H content was 100 ppm. In the alloy with the higher H content, subsurface crack initiation occurred and a higher predominance of quasi-cleavage facets in the stable crack propagation zone suggested a less ductile behavior. The reason for these features was the presence of brittle TiH2 particles. The formation of the hydrides was attributed to the segregation of H to the neighboring α/β interface when α phase particles precipitated due to the low solubility of H in this phase. The alloy with the higher H content is clearly more susceptible to the hydride precipitation. Under the fatigue loading, a hydride particle possibly broke at a low stress level and induced the cleavage of the surrounding α region, and consequently, the subsurface nucleation of a crack. In fact, the role of H in controlling the fatigue performance had been assessed in depth by Pilchak and Williams [Reference Pilchak and Williams51] in the near-α Ti–8Al–1Mo–1V alloy, where multiple mechanisms such as the formation of the hydrides and the H enhanced localized plasticity contributed to the fatigue crack development. Therefore, the effect of H seems to be as important as the effect of the equilibrium and non-equilibrium phases in the metastable β alloys, especially because several surface modification processes may work as a source of this interstitial element leading to the formation of hydrides.
Processing by Additive Manufacturing
The aforementioned concerns on the effects of surface roughness, alloy composition, and microstructure are additionally useful for additive manufactured parts. Although additive manufacturing of Ti–6Al–4V is known for the near-net-shape production of components, post-processing is commonly required to minimize the effects of roughness [Reference Kahlin, Ansell, Basu, Kerwin, Newton, Smith and Moverare52]. However, while these components are intended to be near-net-shaped, the complex geometry that is produced is expected to be used in the as-built form, rather than after post-processing [Reference Zhang and Fatemi53], leading to a strong concern of a fatigue response. Pegues et al. [Reference Pegues, Shamsaei, Roach and Williamson54] mentioned a lack of consensus of the best way to incorporate surface texture into estimations of the fatigue life for additive manufactured parts. Masuo et al. [Reference Masuo, Tanaka, Morokoshi, Yagura, Uchida, Yamamoto and Mukarami55] concluded that the surface roughness is even more detrimental to the fatigue response of the Ti–6Al–4V alloy than the defects commonly produced by lack of fusion. The R z roughness parameter was found to be 212–254 μm for the parts produced by Electron Beam Melting (EBM) and Hot Isostatic Pressing (HIP), leading to a fatigue strength in terms of stress amplitude of 195 MPa for 1 × 10⁷ cycles, against 240–260 MPa for the same material, except with a polished surface. HIP eliminated most defects. Similarly, for the parts produced by Direct Metal Laser Sintering (DMLS), also referred to as Selective Laser Melting (SLM), followed by HIP, R z was 86–96 μm, leading to 195–220 MPa of fatigue strength, against 610 MPa for the polished material. These results were obtained by rotating bending fatigue tests (R = −1): the stress amplitude is thus equal to the maximum stress. From the base data of Fig. 6, R z values of 100–200 μm provide fatigue limits of around 400 MPa (at 5 × 10⁶ cycles), which is much higher than the values by Masuo et al. [Reference Masuo, Tanaka, Morokoshi, Yagura, Uchida, Yamamoto and Mukarami55]. Indeed there is a combined effect of bulk and surface defects on the fatigue response.
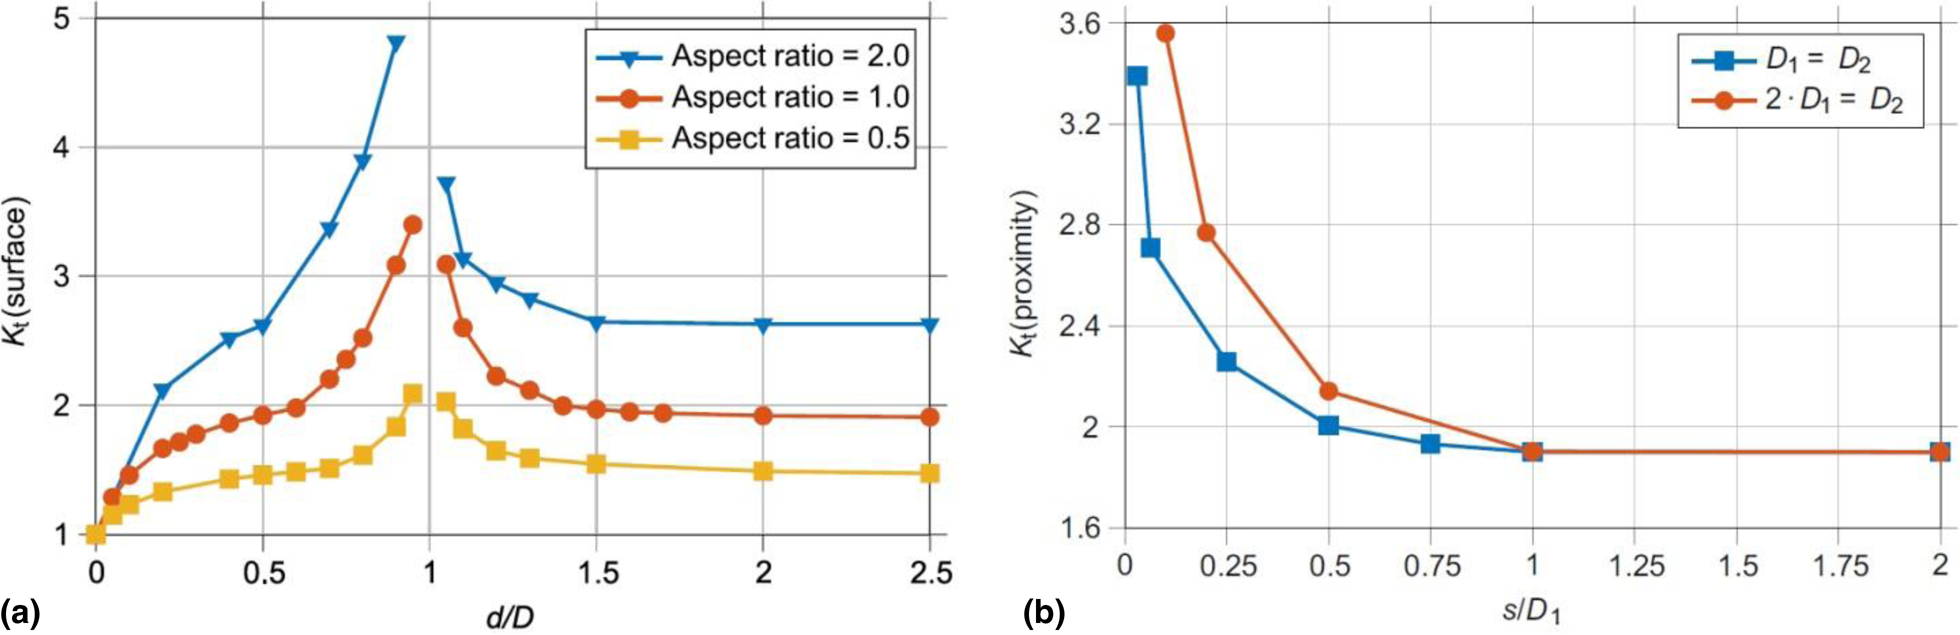
Tammas-Williams et al. [Reference Tammas-Williams, Withers, Todd and Prangnell56] focused their efforts on the influence of the porosity on the fatigue behavior of Ti–6Al–4V produced by EBM without HIP. The authors stressed a key advantage of the EBM process as being the reduction of the residual stresses to near zero, since the entire processing cycle happens at a high temperature. On the other hand, the retained porosity is high and its strong influence on the fatigue behavior was confirmed. Most of the samples tested in the build direction presented fatigue crack initiation from pores very close to the surface, and few samples showed nucleation in smooth facets and secondary cracks initiation from a surface pore. Although larger pores were associated with the worst fatigue performances, a deviation of the initiating defect to the conventional fracture mechanics was seen because the largest defect (the largest stress concentrator) was not necessarily responsible for initiating the fatigue crack. Crack nucleation at the largest defect took place when the shape factor was similar for all the pores. The actual crack nucleating defect was among the top 3% defects classified as the most harmful when the proximity feature and the aspect ratio were also considered. Figure 10(a) shows the extensive increase in Kt when the pore is close to touching the surface, with a higher stress concentration for an increased pore aspect ratio; Fig. 10(b) shows that an increase in Kt takes place when the separation between the pores is smaller than one diameter and becomes significant below half a diameter. This means that the fatigue performance is related to the shear stress zone not only due to the distribution but also to the shape and vicinity of the pores.
Finite element modeling of: (a) K t versus the distance d between the pore and the surface normalized by the pore diameter D normal to the loading vector, for three aspect ratios; (b) K t versus the separation s (sold material) between pore edges normalized by the pore diameter of one of the pores D 1, for equal spherical pores and for one pore with twice the diameter of another pore. Reprinted with permission from Springer Nature [Reference Tammas-Williams, Withers, Todd and Prangnell56].
Laser Engineered Net Shaping (LEMS™) is a Directed Energy Deposition (DED) additive manufacturing process which uses Nd:YAG laser to cast metallic powder and create a melt pool on the substrate. Bandyopadhyay et al. [Reference Bandyopadhyay, Upadhyayula, Traxel and Onuike57] studied the fatigue performance of Ti–6Al–4V with different LEMS™ processing strategies that comprised the effect of testing-orientation. The fatigue strength varied significantly with orientation: 45–47% smaller for the vertically tested samples (parallel to the build direction) when compared to the horizontally tested ones (perpendicular to the build direction). This anisotropic fatigue response was attributed to the higher level of porosity in the vertical direction. Moreover, high inter-layer loads on porosities were likely to happen upon testing in the vertical direction, which are not seen in the other orientation since the load transmission takes place through the layers themselves. What stands out the most in this work is the fatigue strength value of almost 900 MPa in terms of stress amplitude at 1 × 10⁶ cycles for the horizontally tested material. This value may be compared to machined components of Ti–6Al–4V. Regardless, the printing strategy seems to influence the distribution of the pores and consequently results in a directional fatigue performance of the printed components. Zhai et al. [Reference Zhai, Lados, Brown and Vigilante58] had previously reported the application of LENS™ to the Ti–6Al–4V alloy and showed the importance of the microstructure on the fatigue crack growth behavior, in particular, the morphology of the α phase. If low power is used in the fabrication process, fast cooling rates lead to acicular α′ martensite, whereas a coarser α+β lamellae microstructure is produced with a high power level. Even with annealing the former microstructure to transform α′ into α+β, the size and morphology of α are not altered. This finer microstructure results in a lower fatigue crack growth threshold when compared to the coarser microstructure produced with high power.
Some works have been dealing with post-processing to improve the fatigue performance. Denti et al. [Reference Denti, Bassoli, Gatto, Santecchia and Mengucci59] reported that surface finishing techniques, such as prolonged tumbling and shot-peening, may decrease the number of surface defects. Additionally, the amorphization produced in the surface inhibited crack propagation and thus improved the fatigue life. Kahlin et al. [Reference Kahlin, Ansell, Basu, Kerwin, Newton, Smith and Moverare52] also obtained promising results with shot-peening, as well as with centrifugal finishing. In general, the fatigue behavior of additive manufactured parts of Ti–6Al–4V is dictated by the presence of bulk and surface defects, microstructural aspects, and residual stresses. Differences are found among different techniques. The tensile residuals stresses typically present at the surface and near-surface of laser-based techniques, such as DED and SLM, are not created in EBM samples due to the high build temperature in the latter. On the other hand, the EBM samples frequently present higher fatigue strength and lower fracture toughness than the DED and SLM ones because fine α′ martensite form due to the higher cooling rates [Reference Liu and Shin60]. In regard to the alloy composition, the additive manufacturing of metastable β alloys is still incipient in the technical literature. Bermingham et al. [Reference Bermingham, Kent, Pace, Cairney and Dargusch61] produced Ti–3Al–8V–6Cr–4Mo–4Zr through Wire Arc Additive Manufacturing (WAAM), a type of DED. In these alloys, α′ martensite are not expected and a coarser microstructure with lower strength and high ductility is likely to form. A key advantage of the metastable β alloys pointed out by the authors was previously shown in the present review and refers to the greater capacity of these alloys to have the microstructure designed by post-build heat treatments, which may allow the optimization of properties of additive manufactured components. An assessment of the fatigue behavior of additive manufactured β alloys has not been reported in the literature so far.
Final Considerations
The understanding of the fatigue behavior of Ti alloys is necessary for their safe application in medical components. In the case of the traditional Ti–6Al–4V alloy, the compositional and microstructural conditions are standardized for biomedical use. An extra-low interstitial alloy was established to provide a good balance of static and dynamic mechanical properties. However, a surface modification is required to meet the clinical demands. The mostly used techniques are the development of a porous oxide layer or the creation of a rough topography to allow the cellular ingrowth. The introduction of surface discontinuities is dangerous because the fatigue property involves local phenomena, and therefore, is sensitive to any lack of continuity. This review showed that, in the presence of a brittle oxide coating, a minimum depth of 5.7 μm for a circumferential surface crack formed during the initial fatigue cycling would be necessary to drop the fatigue performance. When the alloy surface has its roughness changed, a theoretical model based on the notch sensitivity was successfully employed to predict the fatigue limit of different surface modifications. Considerations regarding possible residual stresses were also made and are particularly important for additive manufacturing through laser-based processes. Surface roughness and porosity are essential factors for the fatigue performance.
The case of the recently developed metastable β alloys is different because the microstructure is still an issue. The reason for their spread in the biomedical field is known: as the modulus of elasticity decreases, the lower will be the clinical problems associated with the stress shielding phenomenon. Attempts have been made to tailor the microstructure of several metastable β alloys to improve the mechanical properties, including the fatigue performance. The review showed the non-equilibrium ω phase plays a fundamental role in the increase of the fatigue strength, as well as the use of intermetallic reinforcements for fatigue improvement without increasing the modulus of elasticity. In the case of the commercial Ti–15Mo alloy, the ω phase was responsible for hindering the plastic deformation by the glide of dislocations and by the twinning development, which controlled the fatigue crack initiation stage. The mechanism of crack nucleation induced by the deformation twins, while keeping the tensile and fatigue strengths at satisfactory levels, opened new perspectives for the alloy and even for similar systems. It is worth pointing out how H may affect the fatigue performance of the metastable β alloys. The protocols of surface modification must take into account the risk of H pick-up, since the fatigue properties of this class of Ti alloys might be severely reduced, causing unexpected failures during the clinical use. This issue must be addressed in a deeper way by the scientific community for a better understanding of the reasons for this undesired behavior of the β alloys, which is not the case of the well-established Ti–6Al–4V alloy.
Acknowledgments
The author is grateful for the financial support of the Brazilian National Council for Scientific and Technological Development (CNPq – grant n° 150782/2019-5) and of the São Paulo Research Foundation (FAPESP – grants n° 2016/12995-5 and 2013/04423-3). A special acknowledgment goes to Prof. Dr. Claudemiro Bolfarini and to Prof. Dr. Paulo Sergio Carvalho Pereira da Silva from Federal University of São Carlos (UFSCar) for the highly productive scientific collaboration over the past few years. The author also thanks Mr. Joseph Brewer for his valuable suggestions in English writing.


 Open access