

Portion size measurement aids, including standard units, household measures, photographs of simple foods or complex dishes, portion size models or any combination of the above, are used in dietary surveys to assist respondents in quantifying their dietary intake( Reference Zimmerman, Hull and McNutt 1 , 2 ). Currently, nutritional assessment emphasizes the use of approaches that are simple, of low respondent burden and do not require literacy, such as food photographs( 3 ).
The use of food photographs has generally been acknowledged as reliable and easy, thus enhancing the accuracy of measurements particularly in large-scale studies addressing the general population( Reference Merten, Ferrari and Bakker 4 – Reference Foster, Matthews and Lloyd 6 ). Food photographs are taken to present various portions representative of the range of portion sizes usually consumed by the surveyed population. During data collection, participants are asked to report the food quantity consumed by selecting one particular picture or a fraction/multiple of one picture or a combination of different pictures. Food photographs are generally evaluated in terms of respondent’s perception, conceptualization and memory( Reference Nelson, Atkinson and Darbyshire 7 , Reference Nelson, Atkinson and Darbyshire 8 ). Perception refers to a person’s ability to relate a particular photograph to a food quantity that is actually presented( Reference Nelson, Atkinson and Darbyshire 7 ). Conceptualization has been defined as the ability to develop a mental picture of an amount of food and to relate that to a photograph, and memory is the ability to accurately recall an amount of food consumed( Reference Nelson, Atkinson and Darbyshire 8 ).
These elements (perception, conceptualization and memory) are expected to be affected by characteristics of the photographs (e.g. number of different portions displayed; size of each picture; the food’s placement in the dish; the camera angle by which each picture was taken; lighting and colours) as well as characteristics of the study participants, particularly in relation to their ability to recall and conceive the amount of foods or beverages consumed( Reference Ovaskainen, Pautri and Reinivuo 9 ).
The Hellenic Health Foundation (HHF), coordinator of the Greek national health and nutrition survey (HYDRIA; http://www.hydria-nhns.gr/index_eng.html), developed a web-based, automated, interviewer-administered application (the HHF Nutrition Tool) in order to collect dietary intake data through food records or recalls among children (up to 10 years old), adolescents (10–17 years old) and adults (18 years and over) in Greece. Making use of the US Department of Agriculture’s Automated Multiple Pass Method( Reference Conway, Ingwersen and Vinyard 10 , Reference Raper, Perloff and Ingwersen 11 ), the HHF Nutrition Tool guides the respondent through a 24 h reference period, providing multiple different opportunities to recall and describe details of food and beverage intakes, since each eating event is discussed on more than one occasion during the interview. The HHF Nutrition Tool’s food list, facets and descriptors’ system have been developed to accommodate the LanguaL™ Food Description Thesaurus (http://www.langual.org/) and the FoodEx2 classification system of the European Food Safety Authority (http://www.efsa.europa.eu/en/datex/datexfoodclass.htm). The HHF team further developed the tool’s portion probes, including standard or household units, as well as series of digital pictures presenting simple foods, national and international dishes. All probes are integrated in the tool and available online.
The present paper aims to describe the evaluation of the digital food atlas in terms of how respondents perceived the amount of food displayed in the picture and to understand the net error introduced by differences in the individuals’ perceptions when photographs are used for dietary assessment purposes. All photographs were taken and developed under well-defined, standardized and controlled conditions.
Methods
The digital photo atlas
The photo atlas includes colour photographs of series of about 170 simple foods (presenting portions of cucumber or tomato slices, for instance) and recipes (picture series presenting portions of complex dishes with several different ingredients) and twenty pictures of household measures in various sizes. All items displayed in the atlas are commonly consumed in Greece. Most photo series (93 %) include six portions per food or dish, adding to a total of about 1050 photos of foods, dishes and tableware included in the atlas. The selection of foods, dishes and their related quantities was based on usual dietary intakes of a sample of 28 572 Greek residents collected between 1992 and 1999 all around the country in the context of the Greek-EPIC (European Prospective Investigation into Cancer and Nutrition) study( Reference Trichopoulou, Costacou and Bamia 12 ). The information on intakes was collected through a validated, semi-quantitative FFQ including approximately 150 foods and beverages( Reference Gnardellis, Trichopoulou and Katsouyanni 13 , Reference Katsouyanni, Rimm and Gnardellis 14 ). The questionnaire was administered in person by specially trained interviewers and for each item respondents were asked to report their usual portion size, the latter judged with the help of household units and seventy-six food photographs. The 5th and 95th centiles of the reported intakes were selected to correspond to the quantities presented in the first and last picture in each photo series of the atlas and equal increments on a log scale were used to estimate the quantities presented in the intermediate pictures. The selection of standard log-difference is based on the Weber–Fechner general psychophysical law that the relationship between physical stimulus intensity and sensory intensity (assessed as ‘just noticeable difference’) approximates a log function( Reference Lawless and Heymann 15 ). Furthermore, the adequacy of the selected foods and dishes was evaluated through a feasibility study among 225 adolescents and adults undertaken in 2012 in preparation for the large-scale national data collection( Reference Ambrus, Horváth and Farkas 16 ).
Food was displayed on three different types of plate (flat, soup plates and bowls) of common white colour and no pattern. Photographs were taken by a professional photographer at a viewing angle of 47° and a diagonal distance of 147 cm from the plate in order to eliminate the lens distortion effect. The focus distance was 70 mm and the lens used was a Sigma 70–300 mm. Shutter speed was 0·5 s and aperture was set at f/22. The lighting set-up was a rig of two Dr Fishcer 400 W lamps with diffusers for soft shadows. In order to achieve a better contrast, plates were placed on a grey surface. At the left and right of plates, a spoon, fork and knife were placed to serve as size reference. The images were colour digital with the size of 75 mm×60 mm, allowing six photos to be displayed in two rows on a computer screen of 1366 pixels×768 pixels. Portions appeared in a sequence of smallest to largest, the name (in Greek) was shown on the top of each series and there was no indication of the weight displayed in each photo.
We have additionally assessed the density (weight over volume) of each food and dish in the digital photo atlas. Since it is practically impossible to include pictures for all the foods in the list of the HHF Nutrition Tool, the application of density factors allows the use of pictures of similar items for quantification purposes (for instance, the consumption of cauliflower can be quantified through the broccoli photo series using the respective density factor). For the density assessments, food volumes were measured by the displacement method, after storing the item in a special bag, removing all air, immersing it in water in a graduated cylinder and noting the difference in the water level( Reference Ambrus, Horváth and Farkas 16 ).
The study participants
Study participants were selected on the basis of the target population of the national nutrition and health survey (HYDRIA) using convenience sampling and aiming to include about 100 individuals aged 12 years and over( Reference Ovaskainen, Pautri and Reinivuo 9 , Reference Trolle, Vandevijvere and Ruprich 17 , Reference Hernandez, Wilder and Kuehn 18 ). Invitations were disseminated in the campus of the University of Athens Medical School, which is located next to a large general hospital. The study sample consisted of 103 individuals, including university employees, students, hospital visitors and their relatives. Participants did not have previous training on how to use portion size measurement aids and were recruited to represent a range of sociodemographic characteristics, including sex, age and educational attainment, with an attempt to oversample older participants and to avoid individuals exercising nutrition-related professions.
Study design
The study aimed to evaluate eighty-six series of food photographs commonly consumed by the population in Greece, representing the variability of local diets and avoiding items that are similar in shape or size. Each photo series was evaluated through pre-weighed portions of food actually shown to study participants. In particular, per each picture in a series three different quantities were defined: one somewhat smaller than the one in the corresponding image (Q1); one quantity equal to the one in the image (Q2); and a third quantity somewhat larger than the one in the corresponding image (Q3). Q1 was calculated as Q2 minus one-third of the gram difference between the quantity in the image to be evaluated and its preceding one; and, proportionally, Q3 was defined as Q2 plus one-third of the gram difference between the quantity in the corresponding image and its following one. In general, each of the pictures included in the series was evaluated twice. In total, 2218 pre-weighed, actual portions were shown to the study participants who were asked to link each portion to a picture on the computer screen.
The sessions started by informing individuals about the objectives of the study and obtaining their consent to participate. Participants were subsequently escorted to the experimental kitchen, responded to a brief questionnaire on their personal characteristics and sat in front of a computer screen. Research staff displayed the pre-weighed, actual portions of various different solid, amorphous or liquid foods in random order together with the corresponding picture series on the computer screen. The staff were instructed not to include more than two portions of the same food in one individual session so that the different portions of each picture series would be evaluated by at least eighteen individuals. All pictures in a series were presented simultaneously on the screen and were indicated by a number from 1 to 6, corresponding to increasing food quantity. Participants were subsequently asked to observe the food actually presented as well as the pictures on the screen and to indicate on a paper form the number of the picture on the screen that best corresponded to the amount of food shown on the plate. In order to avoid the introduction of a fatigue effect, participants took part in more than one session each including the testing of ten to twelve portions. On average twenty-one portions were shown to each participant.
Statistical analysis
The images in each photo series were numbered from 1 (smallest amount) to 6 (largest amount) and were evaluated through calculating mean differences (along with standard deviations) between the picture number which the respondents indicated and the picture number corresponding to the portion which was actually shown. Differences were compared using the Wilcoxon paired signed-rank test. In the instance of pictures No1 and No6 in each photo series, participants were by default restricted in their selections as it was not possible to select a precedent to picture No1 or a subsequent to picture No6 image. It is for this reason that the performance of pictures No1 and No6 was evaluated through estimating the distribution of correct, adjacent (selection of picture No2, when the quantity in picture No1 was shown; or picture No5, when the quantity in picture No6 was shown) or distal selections, considering a random error of ±1 photo selection as acceptable( Reference Trolle, Vandevijvere and Ruprich 17 ). For the presentation of results the eighty-six photo series were organized in eleven food groups (Table 1). The effect of personal characteristics on the participants’ selections was evaluated through unpaired t tests (sex and school years) or through Tukey–Kramer pairwise comparisons (age and food groups). All analyses were performed using the statistical software package Stata release 11.
Classification of the foods and dishes included in the study

Results
The distribution of study participants by sex, age and school years is presented in Table 2. The study sample was adequately balanced with respect to sex and included adolescents (12–17 years old), adults and elderly up to 88 years old with an intentional oversampling of older participants. About 30 % of the adult study participants had not pursued higher education.
Characteristics of the study participants (n 103) selected on the basis of the target population of the Greek national nutrition and health survey (HYDRIA) using convenience sampling
Tables 3 and 4 present the results of the evaluation of pictures No2 to No5 (Table 3) and pictures No1 and No6 in all photo series (Table 4). Table 3 in particular presents the number of assessments performed and the mean differences (together with their standard deviations) between picture numbers per food group. Providing that the food portion served in the plate represents the ‘true quantity’, negative differences point to images that led individuals to perceive the food quantity in the picture as larger than it actually was. Consequently, positive differences indicate the opposite. Mean differences were more frequently negative than positive and rarely exceeded ±1, suggesting that participants generally tended to select the correct or its adjacent portion. Overall, in 53 % of the assessments participants pointed to the correct image and in 90 % of the assessments they selected either the correct or its adjacent portion. Differences were significant for some images of soups and sauces and the potatoes series (potato chips in particular), as well as in the traditional pies and pastries photo series. Overall, although most differences were not significant, participants matched small portions on the plates with pictures presenting larger amounts of food. In particular, according to results presented in Table 3, there was a trend for an overestimation of the ‘true quantity’ when this referred to a small portion (the mean difference of picture No2 is positive (0·023), based on 357 observations). On the contrary, participants pointed to pictures of smaller amounts when large portions were displayed on the plate, leading to an underestimation of the ‘true quantity’ when this was large (mean difference of No5 is negative (−0·308), based on 380 observations). Hence, the use of the food photo atlas to assess intakes may introduce an overestimation of small and an underestimation of large portions.
Number of assessments (n) and mean differences (diff.) and standard deviationsFootnote † between the picture number indicated by each participant and the picture number corresponding to the actually displayed portion (pictures No2–No5 in all photo series)Footnote ‡; study participants (n 103) selected on the basis of the target population of the Greek national nutrition and health survey (HYDRIA) using convenience sampling

*Significant differences at 5 % level of significance.
**Significant differences at 1 % level of significance.
***Significant differences at 0·1 % level of significance.
† Differences estimated as (picture number selected) – (picture number of the displayed, actual portion).
‡ Level of significance of estimated differences evaluated through the Wilcoxon paired signed-rank test.
Number and percentage of selections of correct, adjacent or distalFootnote † food pictures (picture No1 and picture No6 in all photo series); study participants (n 103) selected on the basis of the target population of the Greek national nutrition and health survey (HYDRIA) using convenience sampling
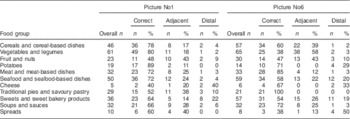
† ‘Correct’ corresponds to selections of pictures of the displayed portions; ‘adjacent’ corresponds to selections of picture No2, when the quantity in picture No1 was displayed, or selections of picture No5, when the quantity in picture No6 was displayed; and ‘distal’ refers to any other selection.
Table 4 presents the frequency with which participants pointed to the correct, adjacent or distal pictures when they were presented with actual quantities corresponding to photos No1 and No6. In general, borderline pictures performed well as participants more frequently pointed to the correct image. In all food groups participants pointed to either the correct or the adjacent picture in more than 70 % of the assessments. An exception, however, held for cheese and spreads, although the assessments performed for these photo series were substantially fewer than in all other food groups. Picture No1 generally performed better than picture No6, except for the groups of meat and dishes, traditional pies and pastries, soups and sauces where the image of the largest portion performed better than the one of the smallest portion.
Table 5 describes mean differences between picture numbers by participants’ characteristics and food groups. In almost all cases, mean differences were negative and higher in absolute terms among females and highly educated participants. Furthermore, adolescents tended to indicate a smaller picture number than the one anticipated (negative differences). Considering that the food quantity present in reality (‘true quantity’) is less prone to errors of perception, adolescents tended to underestimate the ‘true quantity’ through the use of pictures. However, the differences in the way adolescents perceived the food pictures reached significance only when adolescents were compared with young adults (25–34 years of age) and older elderly (more than 75 years old). Our initial assumption that older individuals may encounter difficulties in perceiving the food quantities displayed in the pictures was not confirmed by our results. When the performance of food groups was compared, there was no strong evidence that the picture series of some food groups performed differently from others. The only exception was for the pictures of traditional pies and pastries, which performed significantly differently from all the other food groups. The pictures of traditional pies and pastries significantly failed to allow a valid impression of the presented quantity and led participants to perceive the amounts in the photos as larger than they actually were. Hence, when participants used the pictures to quantify pastries and pies, they overestimated the ‘true quantity’. This group consists of photo series including cheese-, vegetable- and meat-based pies and pastry dishes, lasagne and pizza. The pictures presenting portions of pizza, however, performed substantially better than the other series in this group, since participants selected the correct portion in 82 % of the assessments.
Mean differences and standard deviationsFootnote † between the picture number indicated by each participant and the picture number corresponding to the actually displayed portion, by participants’ characteristics and food groups; study participants (n 103) selected on the basis of the target population of the Greek national nutrition and health survey (HYDRIA) using convenience sampling
*Statistically significant differences between the ‘12–17 years’ and the ‘25–34 years’ groups and between the ‘12–17 years’ and the ‘75+ years’ groups.
**Statistically significant differences between selections of ‘cereals and cereal-based dishes’ and ‘seafood and seafood-based dishes’.
***Statistically significant differences between selections of ‘traditional pies and savoury pastries’ and any other food group, except for ‘cheese’.
† Differences estimated as (picture number selected) – (picture number of the displayed, actual portion).
‡ Significant differences between categories defined at P<0·05, using the unpaired t test (sex and school years) or the Tukey–Kramer pairwise comparisons test (age groups and food groups).
Discussion
We undertook a study to evaluate how well adolescents, adults and elderly perceive digital images of portions of simple foods and complex dishes commonly consumed by the population in Greece. Our aim was to understand some components of variance that these pictures bring when they are used to quantify consumption and to observe how the estimation of the population’s average intakes would be affected. Eighty-six digital photo series were evaluated through 2218 assessments performed by 103 individuals (61 % females) of different educational backgrounds. The study aimed to assess how accurately individuals linked an amount of food presented on a plate to the corresponding picture on the computer screen. In more than half of the tested portions individuals selected the correct image and in about 90 % of the assessments they selected either the correct or adjacent (somewhat smaller or somewhat larger) portion. The tendency to point to the adjacent picture was more evident when small (pictures No2) or large (pictures No5) quantities were displayed and the digital photo atlas would lead participants to overestimate small quantities and underestimate the large ones. In most instances, however, selections were symmetrically distributed around the correct portion, possibly indicating a non-differential misclassification of reported quantities. The present study also showed that digital pictures of pies (i.e. dishes of pastry layers with fillings) did not perform well. The use of photographs of the Greek traditional pies, meat-based pastry dishes, lasagne and similar dishes in a dietary survey may lead to an overestimation of the consumed quantities. Given the frequent consumption of these dishes in Southern Europe and their increasing popularity among other European populations, our finding that study participants may encounter difficulties in quantifying their consumption using food pictures needs to be considered in future research and alternative measurement aids may have to be used. Furthermore, sex and educational attainment were not found to be associated with how participants perceived the portion sizes, but the use of the food atlas among adolescents may lead to an underestimation of the quantity consumed. Notwithstanding the limited number of adolescents taking part in our study, this finding needs to be borne in mind when computer-based photo series are used for data collection in this population subgroup and when intakes among adolescents are particularly compared with those of young adults (25–34 years of age) and older elderly (more than 75 years old).
The present study is the first to evaluate computer-based photographs of foods and dishes commonly consumed by the population in Greece and developed on the basis of previous knowledge of the dietary intakes of the population. Our study design elucidated errors introduced by characteristics of the pictures when individuals were asked to relate an amount of food displayed in reality to an amount depicted in a photograph (perception). This design, however, did not address conceptualization or memory, additional elements in the pictures’ relative validity. The degree to which an individual conceptualizes a food quantity through pictures is affected by the pictures’ qualitative characteristics as well as the person’s ability to recall and describe the amount of food. Our study aimed to segregate the different sources of errors and addressed only those introduced by caveats of the photographs. Results of studies addressing all sources of errors indicated that conceptualization appeared to accentuate the ‘regression to the mean effect’ and the errors in the estimates relating to small and large portions tended to cancel out( Reference Nelson, Atkinson and Darbyshire 8 ). With the present study’s design, sources of errors primarily included differences in the visualization of the quantity on the plate v. the visualization of the quantity on the screen and, possibly, mechanical errors of the weighing scales in use.
The study sample was selected with an intentional over-representation of elderly participants since children below 12 years of age and older individuals are less able to create the necessary mental constructs and are therefore more prone to errors. On the contrary, the number of adolescents in our study sample was small. Indeed a larger study among adolescents may have provided more statistical power to particularly address some of the issues raised. Our study design describes elements of the pictures’ characteristics that might impair participants’ perception of the displayed quantities. The assessment of usual portion sizes through FFQ or other recall methods, however, utilizes functions of perception as well as of conceptualization and memory, the latter not being assessed in our study.
There is generally a lack of consensus on how to assess precision in portion size estimations and on how errors should be expressed so as to allow objective interpretations of the findings( Reference Hernandez, Wilder and Kuehn 18 ). The design of the present study allowed understanding of the direction and the magnitude of the error introduced because of differences in how individuals perceive food quantities presented through pictures, but it cannot allow expressing this error in terms of difference in weight (or volume). Each image was tested through three different amounts of food shown on the plate and only one among these three was equal to the one of the image. Thus if weight differences were calculated, in two-thirds of the assessments differences would be noted even if the respondent had pointed to the correct picture. In study conditions, it is highly improbable that participants will be presented with images showing the exact amount of foods they consumed. Furthermore, they were asked to select one picture and were not given the option to indicate fractions of images or quantities between adjacent images, although these options are offered in the digital atlas in survey conditions.
Studies in which participants were asked to correspond food photographs to pre-defined portions generally concluded that about 50 % of participants selected the correct image and about 70 % selected the correct or adjacent picture( Reference Ovaskainen, Pautri and Reinivuo 9 , Reference Trolle, Vandevijvere and Ruprich 17 , Reference Lillegaard, Øverby and Andersen 19 , Reference Vereecken, Dohogne and Covents 20 ). It is, however, difficult to collectively interpret these findings as studies make use of various methodologies in performing the assessment and analysing the results and, importantly, they often test different numbers of images per photo series. In our study we have not observed any particular pattern, apart from the respondents’ difficulty in assessing the filling of pies and pastry dishes. Furthermore, similarly to previous studies we have also observed a flat-slope phenomenon( Reference Subar, Crafts and Zimmerman 21 ), in which large portions tend to be underestimated and small ones overestimated, as well as that the smallest portions were more often correctly perceived than the largest ones( Reference Lillegaard, Øverby and Andersen 19 , Reference Vereecken, Dohogne and Covents 20 ). Part of the flat-slope phenomenon observed could be attributed to the study design, since small quantities have narrower limits for underestimation and broader for overestimation. Picture No2, for instance, could be underestimated only up to −1 (since participants can only select picture No1) but could be overestimated up to +4 (since participants can select any picture between No3 and No6). Correspondingly, the opposite could hold true for large quantities. We have also noted that the selection of portion sizes was independent of sex, age and participants’ educational attainment( Reference Turconi, Guarcello and Gigli Berzolari 5 ).
Conclusion
In conclusion, the errors in the perception of portion sizes using these photographs were generally small and in both directions (under- and overestimations). In general the series of photographs included in the computer-based food atlas integrated in the HHF Nutrition Tool adequately assisted participants in perceiving the presented quantities. Improved series should, however, be developed for the presentation of pastry dishes with an amorphous filling such as Greek traditional pies, meat-based pastry dishes and lasagne, or other quantification means need to be sought in order to estimate the portion sizes of these products. Furthermore, individuals who consistently consume only small or only large portions of all food groups may have biased perceptions of food portion size in relation to others. This may lead to a misclassification of certain study participants and needs to be accounted for when the food atlas is used to assess the nutritional status of the population or to evaluate diet–disease associations.
Acknowledgements
Acknowledgements: The authors would like to thank P. Karathanassis, K. Tsiotas, M. Saradopoulou and M. Tzivoglou for their contribution in the realization of the photo atlas and the operationalization of the evaluation study. Thanks also go to G. Siganos for his assistance in preparing the data set and his input in the statistical analysis. Financial support: This research received no specific grant from any funding agency in the public or commercial sector. It was supported by the not-for-profit Hellenic Health Foundation. Conflict of interest: None. Authorship: A.N., E.V. and A.T. were responsible for the formulation of the research question and designing the study; E.V., E.P. and A.B. were responsible for carrying it out; A.N., M.K. and E.V. were responsible for the analysis and interpretation of the data; A.N. drafted the manuscript. All authors revised the manuscript critically for important intellectual content and gave final approval of the version to be published. Ethics of human subject participation: The study does not include experiments involving human subjects. However, verbal consent to participate was obtained and formally witnessed.


