1. Introduction
Learning the sounds of a new language in adulthood is often very difficult. The sound system of the first language (L1) we learn influences the acquisition of subsequent languages (Flege, Reference Flege and Strange1995; Best, Reference Best, Goodman and Nusbaum1994). This is the case even in bilingual contexts, where individuals have early exposure to their second language (L2; e.g., from early childhood) and listen to it on an everyday basis. Such bilinguals, dominant in one language, often find it very difficult to acquire phonetic categories that do not exist in their second, non-dominant language (Pallier, Bosch & Sebastián-Gallés, Reference Pallier, Bosch and Sebastián-Gallés1997; Sebastián-Gallés & Soto-Faraco, Reference Sebastián-Gallés and Soto-Faraco1999). Some have accounted for this difficulty by arguing for a lack of behavioural plasticity (e.g., Pallier et al., Reference Pallier, Bosch and Sebastián-Gallés1997). However, others have argued that difficulties in acquiring new phonetic categories in an L2 result not from a loss of plasticity but from a lack of use of the L2. For example, Flege and Mackay (Reference Flege and MacKay2004) investigated the perception of English vowels by native speakers of Italian. They found that early learners who reported using their L1 (i.e., Italian) seldom resembled native English speakers in terms of their vowel discrimination, whilst those who often used their L1 did not, suggesting that continued usage of the L1 affected acquisition of the L2. Indeed, theories of L2 perception, such as the Perceptual Assimilation Model (PAM: Best, Reference Best, Goodman and Nusbaum1994, Reference Best and Strange1995; PAM-L2: Best & Tyler, Reference Best, Tyler, Munro and Bohn2007) and the Speech Learning Model (SLM; Flege, Reference Flege and Strange1995), have proposed that L2 sounds are filtered through L1 phonetic categories. According to these theories, failing to create new phonetic categories is not a consequence of a reduction in neural plasticity. Rather, the mechanisms used for learning remain intact throughout the lifespan (Flege, Reference Flege and Strange1995) and perceptual learning continues into adulthood (Best, Reference Best and Strange1995), but continued use of the L1 means that changes in perceptual processing due to language experience are reinforced, making it harder to acquire the L2 (Iverson, Kuhl, Akahane-Yamada, Diesch, Tohkura, Kettermann & Siebert, Reference Iverson, Kuhl, Akahane-Yamada, Diesch, Tohkura, Kettermann and Siebert2003).
The current study aims to further investigate whether speech production and perception remain flexible across the lifespan by focussing on a different bilingual population. Similar to the participants in Pallier et al. (Reference Pallier, Bosch and Sebastián-Gallés1997), this group grew up in a bilingual environment, where they were exposed to both Galician and Spanish from an early age on a daily basis, but were dominant in one language, Spanish. In adolescence, though, they decided to switch to using their non-dominant language, Galician, predominantly or exclusively, for ideological reasons. This group are known as neofalantes (new speakers). Neofalantes, who have early and extensive exposure to the non-dominant language, almost exclusively use their new language post-switch and are highly motivated, constitute an ideal population to examine whether experience with the L2, together with early and extensive exposure, leads to the formation of new, native-like phonetic categories.
1.1. Neofalantes as unbalanced bilinguals
Previous research has shown that even simultaneous bilinguals who were exposed to both languages before the age of 1 year, and pass as native speakers of both languages do not perceive speech like monolingual speakers in one of their languages (Cutler, Mehler, Norris & Segui, Reference Cutler, Mehler, Norris and Segui1989; Sebastián-Gallés, Echeverría & Bosch, Reference Sebastián-Gallés, Echeverría and Bosch2005; Dupoux, Peperkamp & Sebastián-Gallés, Reference Dupoux, Peperkamp and Sebastián-Gallés2010), suggesting that there is always a dominant language for optimal processing. Likewise, early bilinguals may also be dominant in one of their languages. Performance with the non-dominant language is task-dependent: early and late bilinguals tend to perform like native listeners on tasks that involve pre-lexical processing (e.g., categorisation or phoneme identification), but not in tasks that tap into lexical processing (Sebastián-Gallés & Díaz, Reference Sebastián-Gallés and Díaz2012). This preference for the dominant language has been shown for different aspects of language processing, e.g., cue sensitivity (Hazan & Boulakia, Reference Hazan and Boulakia1993) and speech segmentation (Cutler et al., Reference Cutler, Mehler, Norris and Segui1989).
This is the case even when bilinguals live in a context where they have continuous exposure to both languages, e.g., Catalonia. For example, Pallier et al. (Reference Pallier, Bosch and Sebastián-Gallés1997) tested highly proficient early bilinguals who had learned either Spanish or Catalan from birth. Catalan has a phonemic contrast between the mid-vowels /ɛ/-/e/, while Spanish has only one front mid-vowel /e/. Results from identification and discrimination tasks showed that participants who had learnt Catalan from birth had two distinct phonemic categories. Additionally, when participants were asked to rate the typicality of different vowels in two Catalan and one Spanish word, Catalan-dominant participants produced the expected responses for the Catalan vowels but conflated Spanish and Catalan /e/ for the Spanish word. However, Spanish-dominant listeners behaved differently; though they had some awareness of the existence of the two different Catalan vowels, they gave different typicality judgements from Catalan-dominant bilinguals. Further research (e.g., Sebastián-Gallés & Soto-Faraco, Reference Sebastián-Gallés and Soto-Faraco1999; Bosch, Costa & Sebastián-Gallés, Reference Bosch, Costa and Sebastián-Gallés2000) has shown that Spanish-dominant bilinguals perform more poorly than Catalan-dominants in perception tasks with contrasts that only exist in Catalan and not in Spanish (e.g., front and back mid-vowels /ɛ/-/e/, /ɔ/-/o/ and fricative contrasts /s/-/z/, /ʃ/-/ʒ/), and that lack of sensitivity to the non-dominant language contrast extends to lexical representations; in a lexical decision task Spanish-dominants performed as well as Catalan-dominants but they processed some Catalan minimal pairs as homophones (Pallier, Colomé & Sebastián-Gallés, Reference Pallier, Colomé and Sebastián-Gallés2001). These differences become evident in childhood (Ramon-Casas, Swingley, Sebastián-Gallés & Bosch, Reference Ramon-Casas, Swingley, Sebastián-Gallés and Bosch2010), such that acquiring phonetic contrasts in the non-dominant language appears extremely difficult, and the malleability of L1 phonetic categories severely limited, even with early and extensive exposure to the language (Sebastián-Gallés & Soto-Faraco, Reference Sebastián-Gallés and Soto-Faraco1999).
Work by Flege and colleagues on sequential bilinguals who moved countries and became dominant in their L2 challenged this view. Flege, MacKay and Meador (Reference Flege, MacKay and Meador1999) compared different groups of Italian learners of English and found that early learners who moved to Canada around 7 years old did not differ significantly from English native monolinguals in their discrimination of English vowels. They interpreted this as indicating that early bilinguals were able to create new phonetic categories in their L2 (see also Flege & Mackay, Reference Flege and MacKay2004 for Italian learners of English, and Mora, Keidel & Flege, Reference Mora, Keidel, Flege, Wrembel, Kul and Dziubalska-Kołaczyk2011; Reference Mora, Keidel, Flege, Romero and Riero2015 for Catalan–Spanish bilinguals). This indicates that attunement to the L1 does not prevent early bilinguals from performing like native monolinguals in terms of perception of their L2, and instead suggests that variation in accuracy in perception may be largely determined by patterns of L2 language use.
Research on speech production has likewise shown conflicting results. Some studies support the idea that dominant bilinguals have language-specific phonetic categories in production; however, they may not have monolingual-like realisations in their non-dominant language (e.g., Hazan & Boulakia, Reference Hazan and Boulakia1993). For example, Amengual (Reference Amengual2014, Reference Amengual2016) showed that Spanish-dominant bilinguals in Majorca were able to maintain a contrast between the Catalan front /ɛ/-/e/ and back /ɔ/-/o/ mid-vowels, although the contrasts were smaller than those of Catalan-dominant bilinguals. Similarly, in production of the alveolar lateral approximant /l/, which differs in the degree of velarisation in Spanish and Catalan, both Spanish- and Catalan-dominant bilinguals had language-specific realisations, which were different from those used by the dominant group who had learned the language from birth (Simonet, Reference Simonet2010). That is, production of the Catalan and Spanish variants differed according to the language being tested (i.e., Catalan, Spanish), and whether this was the speaker's dominant language. However, Simonet (Reference Simonet2011) found that Spanish-dominant speakers in Majorca (i.e., Spanish–Catalan bilinguals) had a merged contrast for /ɔ/-/o/. Similarly, for Galician, Spanish-dominant speakers have difficulty maintaining a phonetic contrast between the front and back mid-vowels (Amengual & Chamorro, Reference Amengual and Chamorro2015). Like Catalan, Galician contrasts open-mid and close-mid front /ɛ/-/e/ and back /ɔ/-/o/ vowels in stressed position. Amengual and Chamorro (Reference Amengual and Chamorro2015) tested Galician-dominant and Spanish-dominant speakers in their perception and production of the front and back mid-vowels. The results showed that Spanish-dominant listeners had greater difficulty identifying and discriminating the mid-vowels, while Galician-dominants had robust categorical perception of the contrasts, as expected. In production, Spanish-dominants also had difficulty maintaining this contrast and had a merged category for front vowels, though they appeared to have a small contrast for back vowels. Conversely, Galician-dominant speakers had a distinct contrast for both front and back vowel pairs.
1.2. Language learning in its social context
One factor that has not received much attention in speech learning research is the role of social factors. Language use in minority language communities, such as Galicia, is likely further complicated by the influence of the speaker's attitudes towards the languages they choose to use. Neofalantes often switch dominance to the minority language for ideological reasons; thus, it is possible that their speech production might not only be accounted for in terms of language learning constraints, but may also be influenced by social factors, e.g., identity. Research in sociophonetics has shown that these social factors affect the use of phonetic variables within one language (Eckert, Reference Eckert2000; Reference Eckert2008; Foulkes & Docherty, Reference Foulkes and Docherty2006) and that speakers may alter the phonetic features they use to show belonging or identification with a particular group (Evans & Iverson, Reference Evans and Iverson2004; Reference Evans and Iverson2007). For example, Iverson and Evans (Reference Iverson and Evans2007) examined speech perception and production in a group of students who moved from a small community in the Midlands (in the centre of England) to study at university, where they encountered speakers of different accents, in particular the standard variety. Although these students retained certain phonetic variants, e.g., to show belonging to their home community, they changed their production of others to better fit their new multidialectal community. Some, but not all, changed their production of the STRUT vowel /ʌ/ (which in their native accent is merged with the FOOT vowel /ʊ/) to make it more centralised. However, their realisation of this phoneme was not the same as that of native speakers of the standard accent, nor were these shifts accompanied by changes in perception. This suggests that whilst speakers might be able to change certain aspects of their speech production at a relatively late stage in their language development, late adolescence, there are limits to this flexibility.
Less is known about how bilinguals encode identity through the use of their languages. Recent work with L2 learners has highlighted the importance of identity in acquiring regional features in an L2; Polish migrants in Manchester were less likely to produce the local variant of (ing) if they were planning on returning to Poland, and more likely to adopt the local variant if they were planning on remaining in Manchester (Drummond, Reference Drummond2012a). Likewise, the more positive the speaker's attitude towards Manchester, the more likely they were to merge the STRUT and FOOT vowels, producing both with /ʊ/ (i.e., the local variant) rather than with the standard Southern British English /ʌ/-/ʊ/ split that they had typically been taught in school (Drummond, Reference Drummond2012b). Given that those who planned to stay in Manchester were more likely to identify positively with the city, one possibility is that they used these variables to signal belonging to their host community.
For neofalantes, the switch in language dominance is not a result of external factors, e.g., moving countries, and as such, cannot be disentangled from or understood without reference to the community to which they belong. New speakers have been documented in other minority language communities in Europe (cf. O'Rourke, Pujolar & Ramallo, Reference O'Rourke, Pujolar and Ramallo2015), though the definition of new speaker covers very different types of individuals; new speakers range from low or high proficiency L2 adult learners (Nance, McLeod, O'Rourke & Dunmore, Reference Nance, McLeod, O'Rourke and Dunmore2016) to bilinguals in immersion schooling (Nance, Reference Nance2015). Most Galician new speakers are bilinguals who learn Spanish as their home language and Galician outside the home. This is possible because most of the Galician population is bilingual and has a high competence in both languages. Note that high competence in Galician does not necessarily come from schooling; it may also come from acquiring the language from the environment (Ramallo & O'Rourke, Reference Ramallo and O'Rourke2014), e.g., through grandparents, friends or the wider community. O'Rourke and Ramallo (Reference O'Rourke and Ramallo2015, p. 148) define neofalantes as “individuals for whom Spanish was their language of primary socialisation, but who at some stage in their lives (usually early to late-adolescence) have adopted Galician language practices and on occasions displaced Spanish all together”. Additionally, this language displacement is often motivated by ideological, political or socio-cultural factors. Indeed, Ramallo (Reference Ramallo, Gugenberger, Monteagudo and Rei-Doval2013) situates the origin of this group of speakers in the 1980s, after Spain's transition to democracy. This transition had far-reaching implications for the sociolinguistic situation in Galicia, including the Galician language gaining co-official status, its recognition as a symbol of Galician identity, and the start of the standardisation process, through which a standard Galician language variety was developed (Ramallo, Reference Ramallo, Gugenberger, Monteagudo and Rei-Doval2013). This standard variety was then incorporated into spaces that were exclusive to Spanish, e.g., education, the media and public administration, which facilitated access to Galician for non-traditional speakers (i.e., those who had not learned Galician from birth). Nevertheless, although neofalantes are often characterised as being urban middle class speakers (O'Rourke & Ramallo, Reference O'Rourke and Ramallo2013b), they are also found in rural environments and across different social classes. Investigating the effect of origin, i.e., urban or rural, is not a central aim of this study. However, this factor might influence the accent of Galician acquired; bilinguals growing up in urban areas, characterised by a higher usage of Spanish (IGE, 2008, 2013), are likely to be exposed more often to Spanish and Spanish-accented varieties of Galician than those in rural areas.
Although several classifications for neofalantes have been proposed, in this article we define a neofalante according to the following three characteristics:
1) Early experience with the minority language: although speakers only used Spanish with their parent(s) and vice versa, they learned Galician as children, either through school, friends, the extended family or the wider community.
2) There is a long-term switch in language dominance: speakers changed from being dominant in Spanish to displace this language either predominantly or totally to speak Galician (almost) exclusively.
3) Motivations for language switch: this switch takes place due to ideological, political or socio-cultural motivations. These speakers are normally committed to the revitalisation of the Galician language.
This definition is more restrictive than those used for new speakers in other European minority communities (e.g., Scotland: Nance, Reference Nance2015, Nance et al., Reference Nance, McLeod, O'Rourke and Dunmore2016; Corsica: Jaffe, Reference Jaffe2015; Catalonia: Pujolar & Puigdevall, Reference Pujolar and Puigdevall2015), but matches the majority use of this label in the Galician case (Ramallo, Reference Ramallo, Gugenberger, Monteagudo and Rei-Doval2013; Ramallo & O'Rourke, Reference Ramallo and O'Rourke2014). Although neofalantes thus represent a small proportion of the total populationFootnote 1, O'Rourke and Ramallo (Reference O'Rourke and Ramallo2015) have argued for “neofalantismo” as a social movement, with neofalantes an active minority. An active minority is one in which “individuals or groups [. . .] through their behaviour attempt to influence both the attitudes and practices of the majority and in doing so, bring about social change” (p. 151). Consequently, these authors suggest that becoming a new speaker “requires innovative action through an appropriation of a new linguistic space as well as commitment to the transformation of society from below” (p. 153).
1.3. The current study
The current study investigates the consequences of a long-term language switch for speech production and perception in neofalantes, Spanish-dominant bilinguals in Galicia who consciously switch in adolescence from using Spanish to Galician, predominantly or exclusively, for ideological reasons. We investigate neofalantes' production and perception of two mid-vowel contrasts in stressed position /ɛ/-/e/ and /ɔ/-/o/ and a sibilant consonant contrast /s/-/ʃ/, all of which do not exist in Spanish, as compared to Spanish-dominant and Galician-dominant bilinguals. We also test the production of reduced word-final vowels, which have a distinctive phonetic realisation in Galician and have been reported to contribute to the perception of the Galician accent (Regueira, Reference Regueira2012).
As previously mentioned, Galician has a phonemic contrast between mid-front and back vowels which does not exist in Spanish, and so based on previous research, we predict these pairs of vowels will be difficult for neofalantes to perceive and produce. The fricatives /s/-/ʃ/ are different phonemes in Galician, but only /s/ exists in Spanish. There are no descriptions of the production and perception of this contrast by either Spanish-dominant bilinguals or neofalantes, but descriptions of urban varieties often associated with these groups of speakers report apical realisations of /ʃ/ (Regueira, Reference Regueira, Álvarez and Vilavedra1999; González González, Reference González González, Brea, Fernández Rei and Regueira2008), suggesting that for these two groups /ʃ/ may be more similar to /s/. Based on such impressionistic accounts, the fricative contrast may be difficult for neofalantes to perceive and produce. Finally, unstressed word-final vowels are raised and centralised in Galician (Molinos Castro Reference Molinos Castro2002; Regueira, Reference Regueira2007), but not in standard Spanish. It has been reported that word-final vowels are also reduced in the variety of Spanish spoken in Galicia (Rojo, Reference Rojo and Cano2004), but others have claimed that Spanish-dominant speakers do not produce reduced vowels. For example, the accent used in the media, associated with the variety spoken by Spanish-dominant speakers, has been claimed to have unreduced word-final vowels, with a similar intensity and duration to that of stressed vowels (Regueira, Reference Regueira1994). Assuming that Galician-dominant and Spanish-dominant speakers behave differently from each other in their production of this feature, we investigate where neofalantes lie on this continuum.
2. Experiment 1: Measurement of Production
2.1. Method
Participants
Sixty-eight participants were tested. Participants were recruited from the University of Santiago de Compostela, which has the largest and most heterogeneous student population in Galicia. This facilitated recruitment of participants from different backgrounds, i.e., neofalantes, Galician-dominant, Spanish-dominant. Three participants were excluded because they did not meet the criteria for the experiment. The remaining 65 participants grew up in Galicia, had not lived anywhere else for more than a year and were bilingual in Galician and Spanish.
Participants were all students and at the time of recruitment were 18–30 years old (median 20 years). After the experiment, they completed a detailed language background questionnaire which included questions about language background and exposure, language use, and social variables (see Appendix A). This was used to classify participants into three groups, resulting in 14 neofalantes (7 female), 22 Galician-dominant (12 female), 20 Spanish-dominant (12 female) and 6 simultaneous bilinguals (3 female). The data from the simultaneous bilinguals, who were raised in a one-parent one-language setting, will not be presented here. The criteria used to assign participants to the different groups was as follows:
• Neofalantes: raised predominantly in Spanish (i.e., their parent(s) used to speak to them in Spanish), but decided to adopt Galician as their dominant language in adolescence (13-20 years old, median 17) for ideological or cultural reasons. Since this switch, they have mainly spoken Galician (mean reported Galician use = 4.65/5)Footnote 2.
• Galician-dominant bilinguals: raised predominantly in Galician (i.e., their parent(s) spoke Galician to them) and have always spoken mainly Galician (mean reported Galician use = 4.64/5).
• Spanish-dominant bilinguals: raised predominantly in Spanish (i.e., their parent(s) spoke Spanish to them) and have always spoken mainly Spanish (mean reported Galician use = 2.36/5).
A further 3 participants who did not meet any of these criteria were also excluded, giving a final total of 56. Note that all participants were raised in a bilingual community and, thus, would have been exposed to both languages from an early age. For 51 participants, both parents had been born and raised in Galicia and in 5 cases one of the parents had been born in Spain (1 neofalante, 2 Galician-dominants, 2 Spanish-dominants), but all participants had at least one parent who had been born in Galicia. Therefore, the only difference between Spanish-dominants and neofalantes in terms of language background was that neofalantes made a conscious decision in adolescence to always speak Galician. The smaller sample size in the neofalantes group is due to various constraints related to recruitment. First, as mentioned in the Introduction, neofalantes constitute a small proportion of the Galician population: less than 2%. Additionally, the label ‘neofalante’, also a folk term used in the community, may have negative connotations in certain contexts and neofalantes themselves may or may not identify with it (see O'Rourke & Ramallo, Reference O'Rourke and Ramallo2011, Reference O'Rourke and Ramallo2013a, Reference O'Rourke and Ramallo2015, for a detailed description of neofalantes’ sociolinguistic profile), making its use inappropriate for recruiting purposes. Finally, recruiting participants by enquiring about their language background would direct their attention to the Galician language, and might have made neofalantes feel they were being assessed. Therefore, participants were only asked general questions before the experiment, and neofalantes were recruited by sampling the population or targeting certain groups.
Participants came from both urban and rural backgrounds (neofalantes: 8 urban, 6 rural; Galician-dominant: 5 urban, 17 rural; Spanish-dominant: 11 urban, 9 rural). The imbalance in the Galician-dominant group does not permit a reliable interpretation of the effect of origin, but the results could form the basis of future research. None of the subjects reported any speech, hearing or language disorders at the time of testing.
Materials
The stimuli consisted of a wordlist and a text that contained all three variables of interest; mid-vowels, sibilant fricatives and word-final vowels. The subset of Galician words used for the mid-vowel analysis was pazo [ˈpaθo̝] ‘pazoFootnote 3’, peza [ˈpɛθa̝] ‘piece’, peto [ˈpeto̝] ‘pocket’, pita [ˈpita̝] ‘hen’, pote [ˈpɔte̝] ‘pot’, pozo [ˈpoθo̝] ‘well’, pucho [ˈpu͡tʃo̝] ‘calf’, seca [ˈseka̝] ‘dry’, sota [ˈsɔta̝] ‘knave’, sopa [ˈsopa̝] ‘soup’. The target was the first, stressed vowel. For the fricative analysis, the words were pase [ˈpase̝] ‘pass’ and paxe [ˈpaʃe̝] ‘page’. In this case, the target sound was the fricative. The analysis for the unstressed word-final vowels included all the words for the two previous analyses, as well as pata [ˈpata̝] ‘paw’, sapo [ˈsapo̝] ‘toad’, saco [ˈsako̝] ‘sack bag’, sito [ˈsito̝] ‘situated’, suco [ˈsuko̝] ‘furrow’ and pare [ˈpaɾe̝] ‘stop’. The target was the final, unstressed vowel. Each of these words was recorded in phrase-final position in the carrier sentence digo a palabra ____ (I say the word ____) and in phrase-medial position in the carrier sentence digo a palabra ____ con coidado (I say the word ____ carefully). As Galician is closely related to Spanish, most of the stimuli used are cognates. The text was a modified version of “The North Wind and the Sun” (O vento do norte e o sol). The original text contained only a small number of key variables, and so a sentence was added to increase the number of instances of these, giving 3–6 repetitions of each target variable (see Appendix B). All recordings were made in Praat (Boersma & Weenink, Reference Boersma and Weenink2014), in a quiet room using a Samson C01U microphone connected to a laptop, and with a sampling rate of 44.1kHz, 16-bit resolution.
Procedure
Participants recorded one repetition of the wordlist and the text. To equalize any accommodation effects across participants, all testing was carried out by the first author, who was also a bilingual speaker from Galicia, and the session was conducted in Galician. None of the participants had a close relationship with the experimenter, though they knew that she was from Galicia; all were university students or friends of friends who were innocent of the goal of the experiments.
Recordings from both the wordlist and the text were segmented using a forced aligner for Galician (García-Mateo, Cardenal, Regueira Fernández, Fernández Rei, Martínez, Seara, Varela & Basanta Llanes, Reference García-Mateo, Cardenal, Regueira Fernández, Fernández Rei, Martínez, Seara, Varela and Basanta Llanes2014) and any errors hand-corrected.
Three different sets of measurements were made for each of the three variables; mid-vowels, fricatives and word-final vowels. For the mid-vowel analysis, the mean F1 and F2 values were extracted using Praat scripts (Boersma & Weenink, Reference Boersma and Weenink2014) from each target word. Measurements were taken from the 50% middle portion of the stressed vowel where formant values are most stable (average duration 85ms). Praat's default formant tracking settings were used. Only the mid-vowels /e ɛ o ɔ/ were included in the statistical analysis. The vowels /a i u/ were used in the normalisation procedure and are included in plots for reference. This gave 2–4 measurements per mid-vowel (i.e., /e ɛ o ɔ/) for the wordlist and 3–6 measurements per mid-vowel for the text. Formant measures that were 2 standard deviations outside the F1 or F2 mean per vowel were checked and hand-corrected if necessary. To be able to compare data from male and female talkers, measurements were normalised using the Lobanov method which has been shown to reduce the effects of anatomical and physiological variation, whilst retaining phonemic variation (Adank, Smits & van Hout, Reference Adank, Smits and van Hout2004).
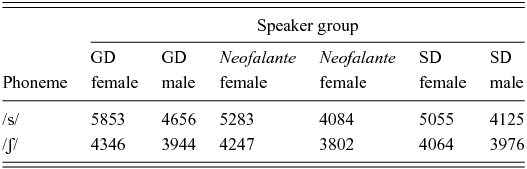
For the sibilant fricative analysis, the centre of gravity (CoG) was calculated in the middle portion (40ms around the midpoint) of the fricative (average duration 98ms) in each target word, using Praat (Boersma & Weenink, Reference Boersma and Weenink2014). This gave 2 measurements per consonant (i.e., /s ʃ/) for the wordlist and 5–9 measurements per consonant for the text. Although other acoustic variables, such as skew and kurtosis, could contribute to differences in fricative production, CoG was chosen because it has been shown to differentiate place of articulation in fricatives, in particular for Galician (Regueira & Ginzo, in press); alveolar sibilants have been shown to have a higher spectral mean than post-alveolar sibilants (Jongman, Wayland & Wong, Reference Jongman, Wayland and Wong2000; Regueira & Ginzo, in press). Fricatives produced by women have been shown to have higher spectral means than those produced by men (Jongman et al., Reference Jongman, Wayland and Wong2000), perhaps due to biological differences. Galician sibilants are prototypically voiceless; however, given that the voiced counterparts do not occur in the language contrastively, some speakers may produce voiced sounds in certain contexts. Given that voicing may affect spectral moments (Jongman et al., Reference Jongman, Wayland and Wong2000), segments which had a voiced portion longer than 20% of the total length of the sound were manually checked, and fricatives that were mostly or fully voiced were excluded from further analysis (16 tokens). Fricatives shorter than 40ms were also excluded (21 tokens). CoG measures that were 2 standard deviations outside the mean for each phoneme were checked and hand corrected if necessary (N = 944; 485 alveolar, 459 post-alveolar phonemes).
Finally, word-final vowels were analysed in a similar way to mid-vowels. The mean F1 and F2 values were extracted using Praat scripts (Boersma & Weenink, Reference Boersma and Weenink2014) from the 50% middle portion of the unstressed word-final vowel in each target word (average duration 65ms). The same formant tracking settings were used. Only the mid unstressed vowels were included in the analysis; [a̝] was included for reference. This gave 8–16 measurements per vowel [e̝ o̝] for the wordlist and 10 measurements per vowel for the text. Formant measures that were 2 standard deviations outside the F1 or F2 mean per vowel were checked and hand corrected if necessary (N = 1741). As before, data was then normalised using the Lobanov method (Adank et al., Reference Adank, Smits and van Hout2004).
2.2. Results
Mid-vowels in stressed position
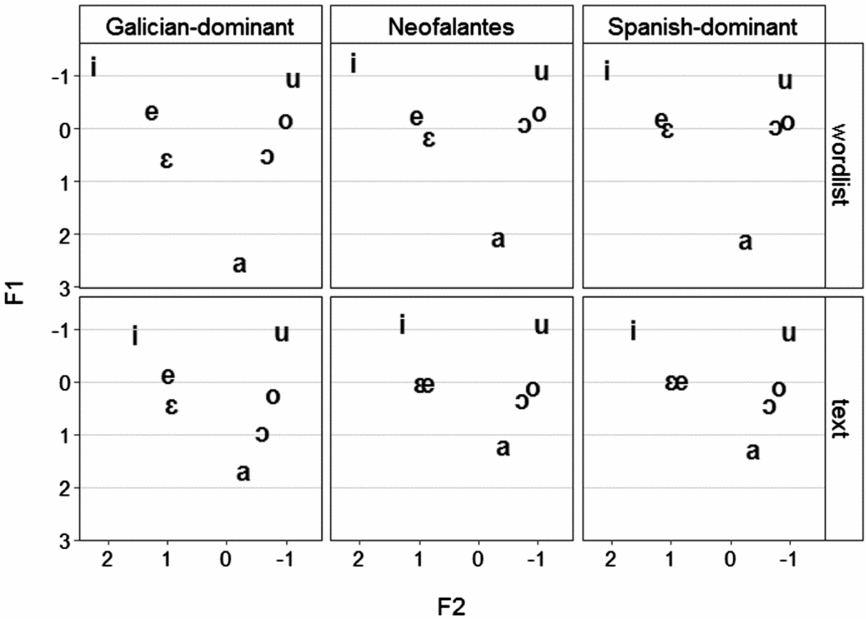
Figure 1 displays the mean normalised formant values (F1, F2) of test words in the wordlist and text as produced by the three groups, Galician-dominant, Spanish-dominant and neofalantes. To investigate whether the groups had a split category, the Euclidean distance was calculated separately for front and back vowels for each speaker for each speech style (wordlist, text; N = 224). These values were used in all further mid-vowel analyses. Given that the Euclidean distance yields a skewed distribution, a rank-transformation to normality was applied to fit a linear mixed-effects regression model. The variables of group (neofalantes, Galician-dominant, Spanish-dominant speakers), style (wordlist, text), origin (rural, urban), vowel (front, back) and sex (female, male) were included as fixed factors in the model up to three-level interactions. All possible by-participant random slopes were included in the model, following Barr, Levy, Scheepers and Tily (Reference Barr, Levy, Scheepers and Tily2013). A simple coding scheme was used for this model and all others in this article, in which each level is compared to the reference level (similar to the treatment coding scheme), but the intercept represents the grand mean rather than the cell mean of the reference level. “Neofalantes” was selected as the reference level in the group factor to investigate whether this group behaved differently from the Galician-dominant and Spanish-dominant bilinguals. The p-values and degrees of freedom for this model and all the models in this article were estimated using the Satterthwaite approximation from the lmerTest package (Kuznetsova, Bruun Brockhoff & Haubo Bojesen Christensen, Reference Kuznetsova, Bruun Brockhoff and Haubo Bojesen Christensen2016) in R (R Core Team, 2016).
Average F1 and F2 formant frequencies by group (Galician-dominant, neofalantes, Spanish-dominant) and speech style (wordlist, text). Plots display normalised values.
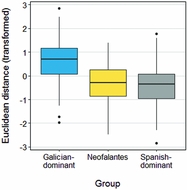
The regression model (Table 1) demonstrated that there was a significant contrast between the neofalantes (M(raw) = 0.414) and Galician-dominant (M(raw) = 0.866) groups, but no significant contrast between neofalantes and Spanish-dominants (M(raw) = 0.377). Figure 2 shows the Euclidean distance by group. Additionally, there was a main effect of speech style; overall, the Euclidean distance was significantly higher in the text (M(raw) = 0.611) than in the wordlist (M(raw) = 0.546).
Summary of the results of the regression models for Experiment 1. GD = Galician-dominant; SD = Spanish-dominant. Baselines for predictor variables: neofalante (group), text (style), rural (origin), front vowel or alveolar fricative /s/ (phoneme), female (sex). Numbers represent t-statistic and degrees of freedom (in brackets). *** p < 0.001 ** p < 0.01 * p < 0.05. p < 0.10. Group effects in bold.

Boxplot showing the average Euclidean distance for the front and back mid-vowel contrasts by group (Galician-dominant, neofalantes, Spanish-dominant), averaged over vowel and speech style. Measurements were transformed using a rank-transformation to normality to correct for a skewed distribution.
The contrast between neofalantes and Galician-dominants was modulated by a significant interaction with origin, and so was the contrast between neofalantes and Spanish-dominants. The difference between Galician-dominants and neofalantes was bigger for those participants from rural settings, and much smaller for those from urban settings, such that urban Galician-dominant and neofalantes were very similar. For the comparison between neofalantes and Spanish-dominants, the pattern was reversed: urban neofalantes had a higher Euclidean distance than the Spanish-dominant counterparts, but rural neofalantes had a lower Euclidean distance. Urban Galician-dominant speakers in this sample do not appear to produce a robust contrast between mid-vowels. However, given the limited sample size for the urban Galician-dominant group (N = 5), this effect is difficult to interpret and needs replication with a larger sample.
The vowel-style interaction was significant, suggesting that the difference was larger for back vowels in the text (M(raw) = 0.646) compared to the wordlist (M(raw) = 0.472). This could be related to the fact that the vowels in the wordlist and text were not embedded in the same phonetic context. Finally, there was a three-way interaction, between group, style and origin for Galician-dominant vs neofalantes.
Voiceless sibilant fricatives
To investigate whether the three groups could produce the /s/-/ʃ/ contrast, CoG was used as the dependent variable in the model. Given that this measurement yields a skewed distribution, a rank-transformation to normality was applied to fit a linear mixed-effects regression model. The variables group, phoneme (alveolar /s/, post-alveolar /ʃ/), style, origin and sex were included as fixed factors in the model up to three-level interactions. All possible by-participant and by- word random slopes were included in the model (Barr et al., Reference Barr, Levy, Scheepers and Tily2013).
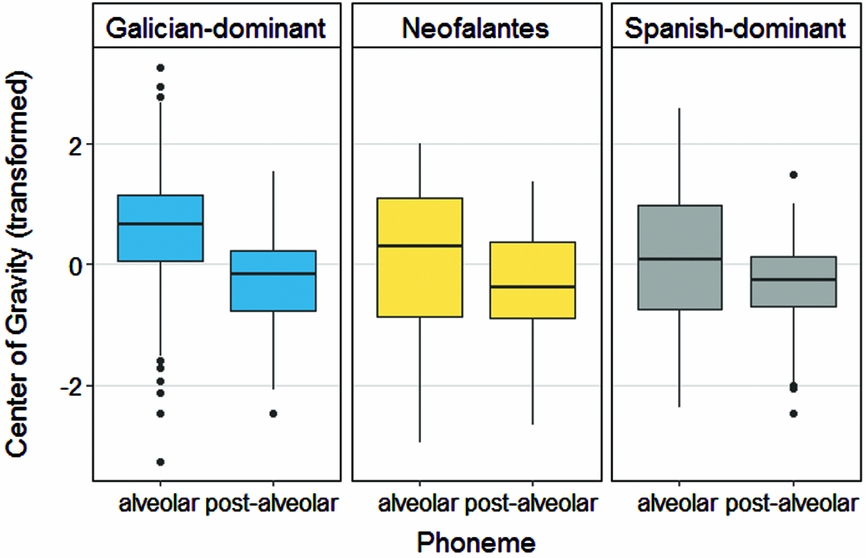
As Table 1 shows, the regression model revealed a significant main effect of sex, as expected, suggesting that female speakers had a higher CoG overall when compared to male speakers. Although the effect of phoneme on its own was not significant, it was modulated by a significant interaction with the contrast between Galician-dominant speakers and neofalantes, indicating that neofalantes behaved significantly differently from Galician-dominant but not Spanish-dominant speakers when producing /s/ and /ʃ/. Figure 3 shows CoG by phoneme by group. Given that /ʃ/ does not exist in Spanish and is not mentioned as present in impressionistic descriptions of Spanish-dominant accents of Galician (e.g., Regueira, Reference Regueira, Álvarez and Vilavedra1999; González González, Reference González González, Brea, Fernández Rei and Regueira2008), we had hypothesised that Spanish-dominants and potentially neofalantes might be unable to produce /ʃ/. However, there seem to be no clear differences in production between the three groups (Table 2). That said, there is more variation in /s/; Galician-dominant speakers seem to have a higher CoG, when compared to neofalantes and Spanish-dominants who do not differ from each other.
Boxplots showing transformed centre of gravity values for each phoneme (alveolar, post-alveolar) for the three groups (Galician-dominant, neofalantes, Spanish-dominant) averaged over speech style. Measurements were transformed using a rank-transformation to normality to correct for a skewed distribution.
Mean centre of gravity (CoG) values in Hertz for each phoneme (alveolar /s/, postalveolar /ʃ/) for the three speaker groups, Galician-dominant (GD), Neofalantes and Spanish-dominant (SD), split by sex (female, male)
To quantify the overlap between the two categories (i.e., /s/-/ʃ/) for each group, a logistic regression model was used as a classifier to predict the phoneme label from the transformed CoG. CoG was the only predictor included in the model. Higher prediction accuracy corresponds to less overlap in the distributions of CoG for the two fricatives. The model was scored as accurate if the probability of the true label for a given observation was above 50%. For Galician-dominants, the prediction accuracy was 71.3%, while for Spanish-dominants the accuracy was 56.2% and for neofalantes 58.4%. This indicates that the fricative categories were much more distinct for Galician-dominant speakers than for neofalantes and Spanish-dominants.
Unstressed word-final vowels
Only the mid unstressed vowels /e o/ were included in the analysis. Visual inspection of the data showed that for these vowels, reduction took place mainly along the F1 dimension, which is inversely correlated with vowel height (the higher F1, the lower the vowel) and so this measurement was used as the dependent variable. To compensate for the non-normality of the distribution a rank inverse normal transform was applied.
Preliminary observation of the data suggested that all groups had vowel reduction, but that although the differences were small, some had more reduction than others. A Welch two sample t-test showed that Galician-dominants' vowels were different from those of Spanish-dominants (t = −2.4049(1263.8), p = .0163), confirming that the latter show less vowel reduction. To investigate whether neofalantes behaved like Galician-dominant or Spanish-dominant speakers, a linear mixed-effects regression model was fitted on the transformed F1 values. The variables of group, style, origin, vowel (front, back) and sex were included as fixed factors in the model up to three-level interactions. All possible by-participant and by-word random slopes were included in the model (Barr et al., Reference Barr, Levy, Scheepers and Tily2013).
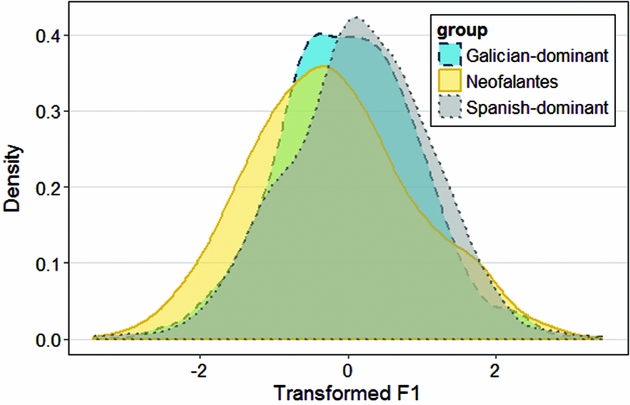
Table 1 summarises the output of the regression model. There was a significant contrast between the neofalantes and Spanish-dominant groups, but no significant contrast between the neofalantes and Galician-dominant groups. As displayed in Figure 4, Galician-dominants and neofalantes showed lower F1 values than Spanish-dominants, with neofalantes patterning more closely with Galician-dominants. The effect of style was significant, suggesting that vowels in the text had a lower F1 overall: that is, speakers tended to use more raised vowels overall. There was a highly significant effect of sex, due to male speakers having a lower F1, and therefore higher vowels. There was also a significant interaction between vowel and sex, indicating that the difference between male and female speakers was more pronounced for front vowels.
Density plot showing the transformed F1 distribution for the front and back unstressed word-final vowels, split by group (Galician-dominant, dashed line; neofalantes, solid line; Spanish-dominant, dotted line), averaged over vowel and speech style. Normalised F1 measurements were transformed using a rank-transformation to normality to correct for a skewed distribution.
2.3. Discussion
There was little evidence to suggest that neofalantes had acquired the mid-vowel contrasts, patterning with Spanish-dominant speakers. However, neofalantes were able to acquire the fricative contrast, but so were Spanish-dominants, such that all speakers produced a /s/-/ʃ/ contrast. Surprisingly, all three groups were able to produce /ʃ/, which only exists in Galician, and there were no differences between groups for this phoneme. Nevertheless, there were differences in the magnitude of the contrast. Galician-dominants had a more distinct /s/-/ʃ/ contrast, while neofalantes and Spanish-dominants produced these phonemes with greater overlap. This difference was driven by differences in the production of /s/. Although there are no direct comparisons in the literature, standard Castilian Spanish /s/ is often described as having an apical realisation and relatively low frequency values (cf. Martínez Celdrán & Fernández Planas, Reference Martínez Celdrán and Fernández Planas2007). It is likely that the Galician realisation has a higher CoG, although different realisations have been found within Galician (cf. Labraña Barrero, Reference Labraña Barrero2009; Reference Labraña Barrero2014; Regueira & Ginzo, in press). It is therefore not surprising that in the current study Galician-dominants produce this phoneme differently from Spanish-dominant speakers. Overall then, the results indicate that although neofalantes are able to produce the fricative contrast, they do not change the way in which they do this after a switch in language dominance. Finally, although all groups used reduced vowels, the word-final vowel analysis suggested that neofalantes produced these more like Galician-dominant speakers.
In sum, there seem to be limits to what neofalantes can learn in terms of production. They are unable to acquire the mid-vowel contrasts, and do not change production of /s/ to match Galician-dominants. However, their accent is not exactly like that of Spanish-dominant bilinguals either; they produce unstressed word-final vowels more like Galician-dominant than Spanish-dominant speakers.
3. Experiment 2: Measurement of perception
Participants completed a vowel and a fricative identification task. Of interest, was whether a change in language dominance would affect perception of the mid-vowel and sibilant fricative contrasts.
3.1. Method
Participants
Same as Experiment 1.
Materials
Participants completed two identification tasks. They identified naturally-produced words containing mid-vowels in stressed position (vowel identification task), and fricatives embedded in non-words on a synthetic continuum that ranged from /s/ to /ʃ/ (fricative identification task).
Vowel identification task
The stimuli consisted of the Galician minimal pairs óso [ˈɔso̝] ‘bone’, oso [ˈoso̝] ‘bear’, pé [ˈpɛ] ‘foot’, pe [ˈpe] ‘p’, só [ˈsɔ] ‘alone’, so [ˈso] ‘under’, té [ˈtɛ] ‘tea’, te [ˈte] ‘t’, embedded in the carrier sentence Digo a palabra ____ (I say the word ____). The carrier sentences were produced in two accents; (1) standard-accented Galician and (2) regionally-accented Galician. The latter included gheada, a very salient regional variant, which occurs in the Western half of Galicia, but is well-known in the whole territory and is often associated with ‘traditional’ Galician spoken in rural areas. By this process, [g] and [![]() ] are produced as [ħ], [h], [x], [ɦ] or [ʕ], here giving [ˈdiho̝apaˈlaβɾa̝] instead of [ˈdi
] are produced as [ħ], [h], [x], [ɦ] or [ʕ], here giving [ˈdiho̝apaˈlaβɾa̝] instead of [ˈdi![]() o̝apaˈlaβɾa̝]. This feature was included because it was hypothesised that it could act as a cue for the Galician-dominant accent. This manipulation only affected the carrier phrase. The same token of each target word was then spliced into the two carrier sentences, and thus the pronunciation of the target word did not vary between conditions. All stimuli were produced by the same male Galician-dominant speaker who was selected because he was able to produce both accents. Recordings were made in a sound attenuated room using a RODE NT1-A microphone directly connected to a PC via an Edirol processor with a sampling rate of 44.1kHz, 16-bit resolution. The speaker recorded two repetitions and then the best was selected for use in the experiment. Stimuli were band-pass filtered at 60-20,000Hz with a smoothing factor of 10. Finally, intensity was scaled to 70dB SPL and the files downsampled to 22,050Hz. All processing was carried out in Praat (Boersma & Weenink, Reference Boersma and Weenink2014). Stimuli were played over a laptop (ASUS A55V) via a Realtek HD Audio sound card, and were presented over headphones (Sennheiser HD 25-C II).
o̝apaˈlaβɾa̝]. This feature was included because it was hypothesised that it could act as a cue for the Galician-dominant accent. This manipulation only affected the carrier phrase. The same token of each target word was then spliced into the two carrier sentences, and thus the pronunciation of the target word did not vary between conditions. All stimuli were produced by the same male Galician-dominant speaker who was selected because he was able to produce both accents. Recordings were made in a sound attenuated room using a RODE NT1-A microphone directly connected to a PC via an Edirol processor with a sampling rate of 44.1kHz, 16-bit resolution. The speaker recorded two repetitions and then the best was selected for use in the experiment. Stimuli were band-pass filtered at 60-20,000Hz with a smoothing factor of 10. Finally, intensity was scaled to 70dB SPL and the files downsampled to 22,050Hz. All processing was carried out in Praat (Boersma & Weenink, Reference Boersma and Weenink2014). Stimuli were played over a laptop (ASUS A55V) via a Realtek HD Audio sound card, and were presented over headphones (Sennheiser HD 25-C II).
Fricative identification task
The stimuli were two-segment CV sequences that consisted of a fricative that varied in the place of articulation along a 22-step continuum from /s/ to /ʃ/ followed by the vowel /u/, giving the non-words “su” [ˈsu] or “xu” [ˈʃu] at the endpoints. These endpoints were based on natural tokens of /s/ and /ʃ/ recorded by the same Galician-dominant speaker as for the vowel identification task, with the recording procedure and processing also the same. The intermediate steps of the continuum were then created following the procedure described in Repp (Reference Repp1981) and McQueen (Reference McQueen1991).
Briefly, the /s/ and /ʃ/ were excised from the natural recording from their onset to the zero crossing before the start of the vowel, and saved to individual wav files. The duration of each fricative was measured (/s/: 216.24ms; /ʃ/: 207.35ms) and the average duration calculated. The fricatives were then equalised for length in Praat (Boersma & Weenink, Reference Boersma and Weenink2014) using PSOLA such that both were equal to the average duration, 211.91ms. These were used as the endpoints of the fricative continuum. The fricative portion of the intermediate stimuli was constructed by adding the amplitudes of the two waveforms in different proportions, giving 22 tokens each with a duration of 212ms. These were then spliced onto a natural token of /u/, excised from the recording of “su”, creating 22 CV tokens where the fricative varied in equal steps from /s/ to /ʃ/. Lastly, intensity was scaled to 70dB and the files downsampled to 22,050Hz.
Four pilot participants, all Spanish–Galician bilinguals, completed the experiment to check the validity of the continuum.
Procedure
Participants completed the tasks in the same session as the production tasks (Experiment 1). Participants always completed the vowel identification task first. The vowel identification task consisted of 2 blocks (standard Galician, regional Galician) with the order of presentation counterbalanced across participants. In each block, participants identified the word they heard by clicking on the corresponding picture. In written Galician, open vowels can be signalled by an accent i.e., óso [ˈɔso̝] (bone), oso [ˈoso̝] (bear), and so pictures were used to prevent orthographic cues influencing the results. Participants identified 4 repetitions of the 8 stimuli, giving a total of 32 trials per block. They heard each trial only once, with the order of presentation randomised across participants and the same stimulus never played twice in succession.
In the fricative identification task, participants identified whether they heard the non-word “su” [su] or “xu” [ʃu]. Before completing the task, participants completed a short practice session to familiarise them with the task. The practice included 10 different stimuli from the 22-step continuum presented in a randomised order. In the test block, participants identified 4 repetitions of the 22 stimuli, giving a total of 88 trials. They heard each trial only once, with the order of presentation randomised across participants and the same stimulus never played twice in a row.
3.2. Results
Mid vowels in stressed position
To investigate the effect of group on vowel identification, a mixed-effects logistic regression model was built with the binomial response (correct/incorrect) as the dependent variable, group (neofalantes, Galician-dominant, Spanish-dominant listeners), accent (standard, regional) and origin (urban, rural) as fixed factors and participant and word as crossed random effects. Since word was included in the model as a random factor to account for the variance introduced by the different stimuli and there were two words per vowel, vowel was not included in the model as a fixed factor. Table 3 summarises the results of the model.
Summary of the results of the regression models for Experiment 2. GD = Galician-dominant; SD = Spanish-dominant; c = centred; N/A: condition not included in the task. Baselines for categorical predictor variables: neofalante (group), rural (origin), standard (accent). Numbers represent Wald statistics (z-values). *** p < 0.001 ** p < 0.01 * p < 0.05 . p < 0.10. Group effects in bold.

The model revealed a significant contrast between neofalantes (M = 0.79) and Galician-dominant listeners, who performed at ceiling (M = 0.92), but no significant contrast between neofalantes and Spanish-dominants (M = 0.76). To test whether neofalantes and Spanish-dominants could identify the vowels above chance level, the dataset was compared to a random baseline. Two separate logistic regression analyses for neofalantes and Spanish-dominants indicated that both groups performed significantly above chance.
In the main regression model, the contrast between neofalantes and Galician-dominants was modulated by a significant interaction with accent. This indicates that the difference between these two groups was smaller in the standard accent (M(GD) = 0.90, M(NE) = 0.82) than the regional accent condition (M(GD) = 0.93, M(NE) = 0.76). As displayed in Figure 5, neofalantes performed more poorly than the Galician-dominants overall, but did slightly better in the standard accent condition. The contrast between neofalantes and Spanish-dominants was also modulated by a significant interaction with accent. Although there was no overall difference in performance between these two groups, the difference in performance between neofalantes and Spanish-dominants was greater in the standard condition (M(SD) = 0.75, M(NE) = 0.82) than the regional condition (M(SD) = 0.76, M(NE) = 0.76).
Boxplot showing vowel identification scores (proportion correct) by listener group (Galician-dominant, neofalantes, Spanish-dominant) and accent (standard Galician, regional Galician). The dashed line represents chance level performance.

The main effect of origin approached significance and was modulated by a significant interaction with the contrast between Galician-dominants and neofalantes. This indicated that the difference between these groups was smaller for urban (M(GD) = 0.79, M(NE) = 0.81) than rural listeners (M(GD) = 0.95, M(NE) = 0.77), with urban Galician-dominant listeners performing more poorly than their rural counterparts, mirroring the production results.
Voiceless sibilant fricatives
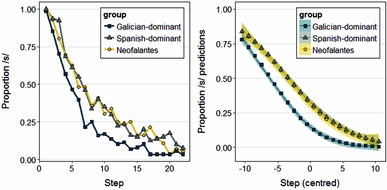
To investigate the effect of group on the sibilant fricative continuum categorisation, a mixed-effects logistic regression model was fitted with the binomial response /s/-/ʃ/ as the dependent variable. The fixed factors included in the model were group (neofalantes, Galician-dominants, Spanish-dominants), stimulus (/s/-/ʃ/ continuum; centred) and origin (urban, rural), with participant as a crossed random effect.
Table 3 summarises the results of the model, which revealed a significant main effect of stimulus and a significant contrast between neofalantes and Galician-dominant listeners, but no significant contrast between neofalantes and Spanish-dominants. Moreover, the effect of origin was not significant. As expected, as the stimulus continuum increased from /s/ to /ʃ/, the less likely it was for listeners to choose /s/. In terms of group, Galician-dominants chose /s/ less than neofalantes overall. The contrast between the neofalantes and Galician-dominant groups was modulated by a significant interaction with phoneme, suggesting that neofalantes’ categorisation of the phonemes was different from that of Galician-dominant listeners, but not from that of Spanish-dominants. Figure 6 shows the identification scores and the model predictions for the three groups and suggests that, although all three groups have categorical perception of this contrast, Galician-dominant listeners start categorising the stimuli as /ʃ/ earlier than the two other groups.
Raw proportion of /s/ response according to stimulus step (1-22) by group (Galician-dominant, squares; Spanish-dominant, triangles; neofalantes, circles; left panel) and model predictions according to centred stimulus step by group (right panel).
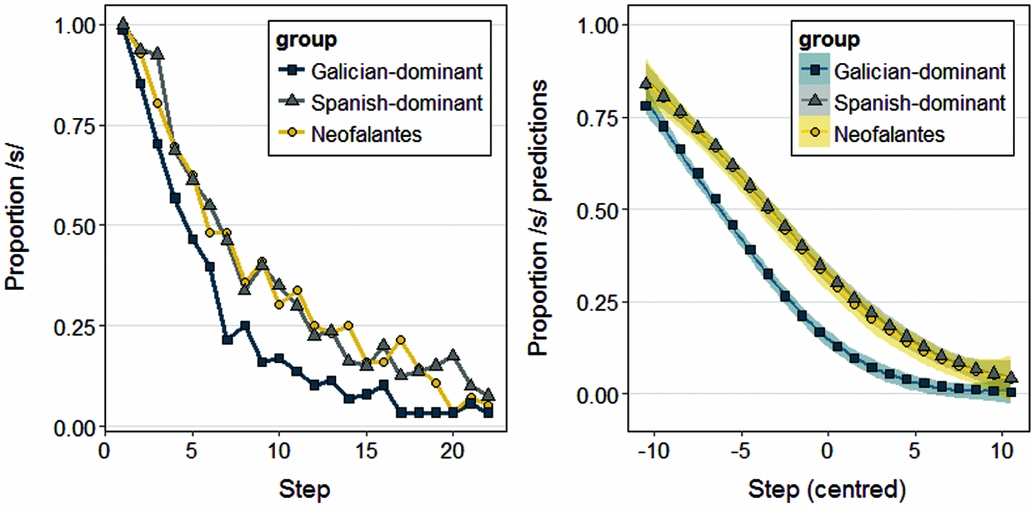
Additionally, the contrast between neofalantes and Spanish-dominant listeners was modulated by a significant interaction with origin; the frequency of choosing /s/ was different for urban and rural participants in these two groups. This effect was further modulated by a significant three-way interaction with stimulus, which also indicated that there were differences between these two groups when taking stimulus into account; urban neofalantes had an earlier categorisation boundary than rural neofalantes, whereas Spanish-dominants showed the opposite pattern.
3.3. Discussion
Overall, neofalantes did not differ in their perception from Spanish-dominants, indicating that they had not changed to behave more like Galician-dominants. Although both neofalantes and Spanish-dominants performed relatively well with the mid-vowel contrasts, they performed more poorly than Galician-dominants. In addition, neofalantes behaved differently from both groups in the different accent conditions; their perception of the mid-vowels when listening to the standard accented stimuli was slightly closer to that of Galician-dominants and better than that of Spanish-dominants. For fricatives, neofalantes likewise patterned with Spanish-dominant listeners. Both groups could perceive the /s/-/ʃ/ contrast, but they had a later phoneme categorisation boundary when compared to Galician-dominants, i.e., they still heard /s/ for tokens where Galician-dominants already heard /ʃ/. This mirrors the production results that showed that neofalantes and Spanish-dominants have a lower CoG for /s/ than Galician-dominants.
4. General discussion
This study investigated whether neofalantes changed aspects of their speech production and perception after switching language dominance to Galician. Change was inferred by comparing this group to two control groups, Galician-dominant and Spanish-dominant bilinguals. If they patterned with Spanish-dominants when producing and perceiving variables that are specific to Galician, it was assumed that there was no change, while if they patterned with Galician-dominants it was assumed that there was a change. In production, there was little evidence to suggest that neofalantes were able to produce the two mid-vowel contrasts that do not exist in Spanish, behaving like Spanish-dominant speakers. They were able to produce a sibilant consonant contrast that does not exist in Spanish, but so were Spanish-dominants. However, both neofalantes and Spanish-dominants produced this contrast differently from Galician-dominants, who had a more distinct contrast. Word-final vowels, on the other hand, which are a highly salient feature of Galician, were produced by neofalantes with a more Galician-like realisation, different from Spanish-dominants. In perception, neofalantes behaved like Spanish-dominants for both mid-vowel and the fricative contrasts. Both groups were able to identify the mid-vowel contrast, but their performance was poorer than that of Galician-dominants. Likewise, both groups were able to identify the fricative contrast, but had a different category boundary from Galician-dominants.
Previous research with Spanish–Catalan bilinguals has shown that early exposure is not enough for dominant bilinguals to acquire native-like categories in their non-dominant language, and this has been attributed to a lack of plasticity (Pallier et al., Reference Pallier, Bosch and Sebastián-Gallés1997; Sebastián-Gallés & Soto-Faraco, Reference Sebastián-Gallés and Soto-Faraco1999; Pallier et al., Reference Pallier, Dehaene, Poline, Argenti, Dupoux and Mehler2003). Likewise, neofalantes had limited success in acquiring the front and back mid-vowel contrast in production and did not perform like Galician-dominants in perception. However, it has also been argued that difficulties in L2 perception are due to continued use of the L1 (Flege & Mackay, Reference Flege and MacKay2004; Mora et al., Reference Mora, Keidel, Flege, Wrembel, Kul and Dziubalska-Kołaczyk2011, Reference Mora, Keidel, Flege, Romero and Riero2015). Given that the bilinguals in the Catalan studies continued to use their dominant language (in this case, Spanish), one could hypothesise instead that the failure to establish native-like phonetic categories was because the L1 continued to exert a strong influence on perception and, therefore, the L2. Nevertheless, our results show that even with extensive use of the L2 and a high motivation to learn, dominant bilinguals are unable to form new, native-like phonetic categories in production or perception when they switch late in life. It seems more likely then that neofalantes process their new, dominant language through their former dominant language categories.
Theories of cross language speech perception – such as PAM/PAM-L2 (Best, Reference Best, Goodman and Nusbaum1994, Reference Best and Strange1995; Best & Tyler, Reference Best, Tyler, Munro and Bohn2007) and the SLM (Flege, Reference Flege and Strange1995) – have proposed that certain phonetic contrasts are more difficult to perceive than others and that this leads to difficulties in production. According to these models, the difficulty can be predicted by the phonetic similarities of the first and second languages. The contrast between open and close mid-vowels is a difficult one for neofalantes (and Spanish-dominants), because the Galician contrasts are both a good match to the single Spanish categories. However, although their category boundary was different from Galician-dominant listeners, both neofalantes and Spanish-dominants were able to perceive and produce the fricative contrast that does not exist in Spanish. Flege (Reference Flege and Strange1995) postulates that bilinguals are able to establish a new phonetic category for an L2 sound that differs phonetically from the closest L1 sound if they are able to discern at least some of the phonetic differences between the L1 and L2 sounds. One possibility is that this contrast is more acoustically distinct than the mid-vowel contrasts, such that both Spanish-dominants and neofalantes are able to establish a category even though this does not match that of native speakers.
In contrast, word-final vowels seem to be more mutable. Although neofalantes behaved like Spanish-dominants in their production of mid-vowels and fricatives, they produced word-final vowels like Galician-dominants; all speakers used reduced vowels, but neofalantes patterned with Galician-dominants in having a greater amount of reduction than Spanish-dominants. Although it is possible that word-final reduction may be a more predictable pattern and that this facilitates acquisition, word-final vowels are a highly salient characteristic of the Galician accent. It is thus possible that social factors also played a role in production of this variable. Neofalantes switch language dominance for ideological reasons, and, when they do, they are often very aware that they do not speak like Galician-dominants. They are very motivated to “learn” the language and most of our participants reported having made a conscious effort to improve their pronunciation, i.e., to speak with a more native-like accent. One interpretation is that neofalantes use this feature, whether consciously or subconsciously, to fit in with their new group of Galician-dominant speakers. This is similar to findings from studies of accent change within the same language; Evans and Iverson (Reference Evans and Iverson2007) showed that speakers who changed their accent late in life (young adulthood) acquire some, but not all, the phonetic features that characterise their new accent. However, their realisation was not like that of native speakers, and not all the speakers showed the same changes in production. These individual differences were interpreted as reflecting the way speakers chose to present themselves to the world. In a bilingual context, Amengual (Reference Amengual2015) found that Spanish-dominant bilinguals did not differ from Catalan-dominant bilinguals in their production of some reduced vowels in Majorcan Catalan; both groups produced /a/ as a reduced centralised [ə] in unstressed position. This was interpreted as being a result of the “construction of socio-indexical phonological categories based on a stronger identification with the prestigious Standard Catalan variety” (Reference Amengual2015, p. 4). In the Galician community, although the reduced vowels might not be associated with the prestigious variety, they are indeed associated with a Galician-like accent, thus meaning that they could be used to signal Galician identity.
Studies in the lab have also shown that there is flexibility in production and perception in adulthood. For example, high variability phonetic laboratory training studies have shown that L2 listeners can improve in their identification of phonetic contrasts that do not exist in their L1 (Logan, Lively & Pisoni, Reference Logan, Lively and Pisoni1991; Lively, Logan & Pisoni, Reference Lively, Logan and Pisoni1993; Iverson & Evans, Reference Iverson and Evans2009), that this knowledge can be transferred to production (Bradlow, Pisoni, Akahane-Yamada & Tohkura, Reference Bradlow, Pisoni, Akahane-Yamada and Tohkura1997) and that it is retained after a few months (Bradlow, Akahane-Yamada, Pisoni & Tohkura, Reference Bradlow, Akahane-Yamada, Pisoni and Tohkura1999). However, there appear to be limits to this such that even early exposure to an L2 in a bilingual environment is not enough to acquire native-like categories in the non-dominant language (Pallier et al., Reference Pallier, Bosch and Sebastián-Gallés1997). The current study is in line with these findings and provides further evidence that “real life training” or, in this case, extensive naturalistic exposure to, and use of, the L2 is not enough for dominant bilinguals to acquire native-like categories in their non-dominant language. Even with what could be seen as ideal circumstances for learning - early and extensive exposure, almost exclusive use of the L2 and very high motivation - L2 production and perception still seem to be filtered by L1 categories. One possibility is that underlying categories are very difficult to change, and that although, with experience, individuals can improve at mapping new categories onto native ones, they do not create new categories (Iverson & Evans, Reference Iverson and Evans2009). The focus of this study is group differences, and it is relevant to highlight that individual differences (e.g., learning ability or other cognitive skills) might play a role in the acquisition of such phonetic contrasts. That is, it is perhaps not the case that no neofalante can ever learn Galician-like contrasts, but this at least seems very difficult.
These results thus argue for a central role of early exposure in phonetic processing. Although studies of Korean adoptees adopted by French families and exposed exclusively to French from between the ages of 2 and 9 years old (Pallier, Dehaene, Poline, LeBihan, Argenti, Dupoux & Melher, Reference Pallier, Dehaene, Poline, Argenti, Dupoux and Mehler2003; Ventureyra, Pallier & Yoo, Reference Ventureyra, Pallier and Yoo2004), have indicated that all traces of attunement to the L1 sound system are lost by adulthood, new research with Chinese adoptees in Canada, also exposed exclusively to French since adoption, has shown that early experience can have lasting effects (Pierce, Chen, Delcenserie, Genesee & Klein, Reference Pierce, Chen, Delcenserie, Genesee and Klein2015). Although their performance on behavioural tasks did not differ from that of French monolinguals, Chinese adoptees’ brain activation patterns were more similar to those of Chinese–French bilinguals. This suggests that early exposure to a language continues to influence the neural processing of subsequently learned language sounds years later, even in highly proficient early-exposed users.
In conclusion, these findings suggest that native-like production and perception of new phonetic contrasts is difficult to attain. Despite early exposure, extensive use and high motivation, there was little evidence to indicate that neofalantes acquired the Galician mid-vowel contrasts in production and perception, and they behaved more similarly to Spanish-dominants in their production and perception of the fricative contrast. However, they produced unstressed word-final vowels in the same way as Galician-dominants. Together, this results in a hybrid variety different from that used by Galician- and Spanish-dominants, and characterised by the effects of a long-term switch in language dominance. Although underlying category representations thus appear hard to change, with modifications to production and perception constrained by early experience with a particular language, the resulting hybrid categories may function as opportunities to mark identity within a particular community.
Supplementary Material
For supplementary material accompanying this paper, visit https://.doi.org/10.1017/S1366728918000603