
The authors acknowledge that their article (Montgomery et al., Reference Montgomery, Hamel and Mercier2019) contained six conversion errors (out of the 161 records); two duplicate records were removed, and references were also updated in the supplementary file (S1).
The main findings of our original paper remain unchanged with these corrections and adjusted statistics (Figures 1–4).
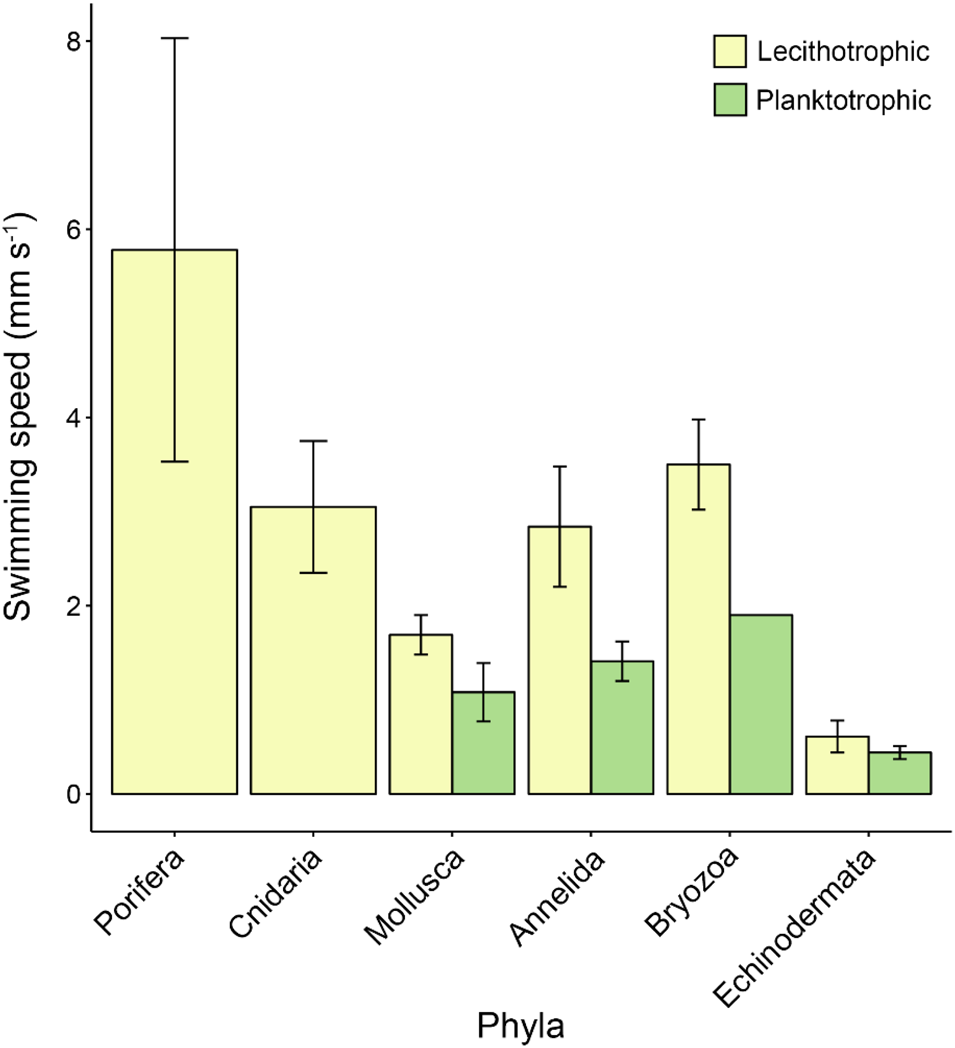
Mean propagule swimming speed (mm s−1 ±SE) varies among phyla and larval nutritional modes. Phylum Cnidaria and Porifera only have one bar as these taxa only have one larval nutritional mode. Error bars are present where more than one record per phylum and category were available. See Table S1 for raw data.
Mean propagule swimming speed (mm s−1 ± SE) of specific life stages varies with nutritional mode. Taxa and life stages presented here had both planktotrophic and lecithotrophic representatives in the dataset. Error bars are present where more than one record per phylum and category were available. See Table S1 for raw data.

Mean propagule swimming speed (mm s−1 ± SE) varies with taxa and level of adult mobility. Sessile adults are incapable of movement, sedentary adults have the capacity to move but do so rarely and motile adults move readily and often. Error bars are present where more than one record per category were available. See Table S1 for raw data.

Larval swimming speed (mm s−1) vs propagule body size (μm) in lecithotrophic and planktotrophic larvae of various phyla (Porifera, Cnidaria, Mollusca, Annelida, Echinodermata, Bryozoa) on log10 scales. Log scales were used to examine scaling relationships across a wide range of propagule sizes and speeds. Points represent mean values for individual species. Symbols depicting the various phyla are either solid/open to indicate the lecithotrophic/planktotrophic larval feeding mode (except for Porifera, which is fully lecithotrophic and identified with +). N = 125 total records. The solid lines show regression results. Planktotrophs: y=−0.33x + 0.54, R2 =0.04; Lecithotrophs: y= −0.03x + 0.31, R2 =<0.01.

The authors thank Lanna and Riesgo (Reference Lanna and Riesgo2019) both for identifying these errors and the new records they have provided, and apologise to the Journal's readers.
Updated mean length and swimming speed summarized across the two larval nutritional modes and six phyla featured in the dataset (Supplementary material S1).


