

Coeliac disease is an autoimmune response to the major wheat protein, gluten and affects approximately one in a hundred individuals. However, general practitioners and gastroenterologists are encountering patients claiming gluten-related symptoms without a definitive diagnosis of coeliac disease. These individuals have been defined as suffering from gluten sensitivity( Reference Sapone, Bai and Ciacci 1 ). The diagnosis of non-coeliac gluten-sensitive (NCGS) patients is difficult, as is the management, because there are no known biomarkers. It has been reported that gluten-free diet (GFD) alleviates symptoms in subjects with the condition( Reference Sapone, Bai and Ciacci 1 ). However, NCGS is not well characterised at present and there is only a limited consensus on its presence and diagnosis( Reference di Sabatino and Corazza 2 ). It is also not clear what exactly are the dietary requirements for this population and whether the affected individuals can tolerate low doses of gluten as opposed to following a strict GFD. As the majority of the gluten-sensitive (GS) subjects are self-diagnosed, information is scarce on whether their gluten intake is any different from that of the general or coeliac population. Therefore, further characterisation of subjects claiming sensitivity to gluten is important to better understand the aetiology of the syndrome and to ensure that the dietary needs of people with the condition are adequately met.
Gluten is a generic term for a family of proteins which include polymeric (larger molecular weight) glutenins and monomeric (lower molecular weight) gliadins. There is evidence that the ingestion of gluten plays a part in the aetiology of coeliac disease, inducing cell-mediated immunological responses in the small intestine and flattening of the mucosa( Reference Marsh 3 ). NCGS lacks the characteristic serological and histological markers of coeliac disease( Reference Biesiekierski, Newnham and Irving 4 , Reference Carroccio, Mansueto and Iacono 5 ), suggesting different patho-physiological mechanisms. In addition, the diet component(s) involved in the pathogenesis of NCGS have not as yet been identified. However, it is suspected that gluten is a candidate, although there are some studies showing that Fermentable, Oligo-, Di-, Mono-saccharides and Polyols (FODMAP) might be the triggering factors( Reference Biesiekierski, Peters and Newnham 6 ). Other studies however report gluten being the culprit in NCGS individuals, in whom FODMAP intolerances have been ruled out( Reference Di Sabatino 7 ). More resent evidence also suggests that members of the nongluten α-amylase/trypsin inhibitor (ATI) family contained in wheat( Reference Junker, Zeissig and Kim 8 ) may play a role.
As the products for customers with gluten-related disorders are often reported to be unsatisfactory in terms of palatability, the manufacturers are seeking to develop new gluten-free or gluten-detoxified alternatives. One approach, which has received consideration, is the use of enzymes directed against the immunogenic proline rich residues in gluten peptides( Reference Shan, Molberg and Parrot 9 ). Gluten is especially rich in proline, which renders the immunogenic epitopes resistant to gastrointestinal (GI) digestion( Reference Wieser 10 , Reference Hausch, Shan and Santiago 11 ). It has been reported that in vitro the enzyme Aspergillus niger prolyl endoprotease (ANPEP), produced from the fungus Aspergillus niger, is capable of degrading intact gluten molecules and T cell stimulatory epitopes from gluten into non-immunogenic, harmless fragments( Reference Stepniak, Spaenij-Dekking and Mitea 12 ). ANPEP is also highly efficient in accelerating the degradation of both gliadin and glutenin molecules in a GI model system and in the stomach of healthy volunteers( Reference Mitea, Havenaar and Wouter Drijfhout 13 , Reference Salden, Monserrat and Troost 14 ). However, one problem in the use of enzymes such as ANPEP in baking is that they target the digestion of gluten, which confers the unique visco-elastic properties of the dough that allows it to be processed into bread. Thus, we needed to determine if ANPEP could be used at levels, which rendered the gluten harmless, but could be used in the production of wheat products, comparable with standard gluten content products in terms of taste, texture and appearance.
In this study we have investigated if ANPEP-treated bread is suitable for consumption by subjects self-reporting benefits of adopting a low-gluten or GFD. In addition, we have characterised this group of subjects by comparing them with a non-GS control group.
Methods
Experimental bread
Four types of white bread were produced (Warburton Ltd.), broadly following the Chorleywood bread process( Reference Chamberlain, Collins and Elton 15 ). The four variants were as follows: a reference/control bread (the flour used was a bread-making grist of 11·9 % protein at 14 % moisture); a protease-treated bread (treated with 0·8 % ANPEP); a second protease-treated bread (treated with 1 % ANPEP); and a lower-protein bread made from biscuit flour (9·2 % protein at 14 % moisture). These four treatments allowed us to investigate the responses of self-defined GS individuals to breads with decreasing gluten content. The protease ANPEP was provided by DSM Food Specialities B.V. at an activity of 43 propyl peptidase units/g (WO2005/027953). Other additions, such as salt, yeast and minor processing additives were constant throughout and in accordance with standard commercial practice however, certain minor adjustments were made to the addition of water in the dough to allow the breads to be processed correctly.
The experimental bread was delivered sliced (35 g/slice), with the crusts removed from each loaf. It was packed in transparent bags, labelled as bread A, B, C or D. The code was held by an independent observer. In a preliminary test, ten healthy individuals were unable to detect any differences in the taste, smell and appearance of the four breads. The bread was kept frozen until required.
The proteins of the bread were measured by the Dumas combustion method, using Leco FP528 protein analyser (LECO) according to accepted standards and by Gluten-Tec® ELISA (EuroProxima) for quantitative detection of α-20 gliadin and gliadin fragments in food and competitive RIDASCREEN® Gliadin ELISA (R-Biopharm AG) for analysis of R5 epitope. In the case of the R5 ELISA (lower limit of quantification 10 mg gluten/kg and reproducibility around 37 %), gliadin was extracted by the universal prolamin and glutelin extractant solution procedure of Mena et al.( Reference Mena, Lombardía and Hernando 16 ), whereas in the case of the α-20 ELISA (lower limit of quantification 153 µg peptide/kg and reproducibility for incurred baked matrices of around 45 %), gluten extraction used 60 %-ethanol-dithiothreitol according to the manufacturers’ instructions.
Subjects
This study was conducted according to the guidelines laid down in the Declaration of Helsinki and all procedures involving human subjects were approved by the Rowett Institute Ethics Committee in April 2014. Recruitment was through a variety of sources including press releases, radio adverts, newspaper adverts, posters, flyers and presentations to the public. Written informed consent was obtained from all subjects. The study took place between June 2014 and June 2015. Adults from two groups were invited to participate – those who believed they experience sensitivity to gluten, but were willing to consume breads made of wheat flour (including normal gluten containing bread) and healthy volunteers, who acted as a control group.
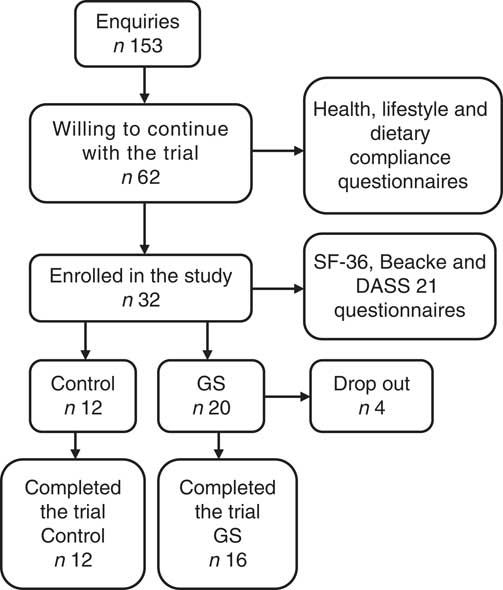
A total of 153 subjects expressed interest in the study however, many of these declined to participate in the trial as they were following a strict GFD and were not prepared to undergo gluten rechallenge. The recruitment process is illustrated in Fig. 1. Those subjects, who were willing to continue with the trial (n 62), were invited to complete a health and lifestyle questionnaire (screening visit) to assess their general health and their sensitivity to gluten/wheat. For the evaluation of dietary compliance with the GFD, a verified flow chart( Reference Biagi, Andrealli and Bianchi 17 , Reference Biagi, Bianchi and Marchese 18 ) was used. This numerical five-level score system is based on strategies that subjects use to avoid eating gluten( Reference Biagi, Andrealli and Bianchi 17 ). Initial investigation for coeliac disease was through a questionnaire incorporating the following questions: ‘Have you ever been tested for coeliac disease? If yes, how long ago was the test done?’; ‘Did you have a blood test for coeliac disease? Was the blood test: positive; negative; I do not know’; ‘Did you have a duodenal biopsy? Was the biopsy: positive; negative; I do not know’. All volunteers who reported a diagnosis of coeliac disease (CD) were excluded. Those volunteers who completed tests for CD (duodenal biopsy or immunological tests) but the CD diagnosis was not confirmed were invited to participate in the study. These volunteers believed that avoiding gluten helped to reduce their discomfort. Volunteers were also excluded if they had been previously diagnosed with dermatitis herpetiformis, wheat allergy or GI disorders; were unable to give written informed consent; were on medications for treatment of GI symptoms or were taking digestive enzymes; were pregnant/breast-feeding; had poorly controlled psychiatric disease or had any other significant health issue. A total of thirty-two subjects were enrolled in the study and were randomly allocated by an independent statistician in a double-blind, cross-over fashion to the treatments (breads). The volunteers were invited to complete the Quality of Life (36-Item Short Form Health Survey (SF-36))( Reference Ware, Snow and Kosinski 19 ), Physical Activity (Beacke)( Reference Baecke, Burema and Frijters 20 ) and Depression, Anxiety and Stress (DASS 21)( Reference Lovibond and Lovibond 21 ) questionnaires, whereas on their habitual diet and before the interventions began. In all, twenty-eight subjects (twenty female and eight male) completed the trial (sixteen self-reported sensitive to gluten subjects and twelve healthy volunteers). The reasons for drop-outs were as follows: reappearance of severe GI symptoms (scoring above 80 on a 100 mm visual analogue scale (VAS)) while on trial breads (two GS volunteers); non-compliance with study diaries (one GS volunteer); and noncompliance with bread consumption (one GS volunteer).
Study recruitment. SF-36, 36-Item Short Form Health Survey, DASS 21, Depression, Anxiety and Stress Scale; GS, gluten sensitive.
Study design
Blood samples from both, control and GS groups, were collected between 07.00 and 10.00 hours after 10 plus hours of fasting before the interventions began, using serum-, EDTA- or heparinised- evacuated tubes (BD Vacutainer® tubes; Becton Dickinson UK Ltd). Serum and plasma were stored at −70°C until they were analysed.
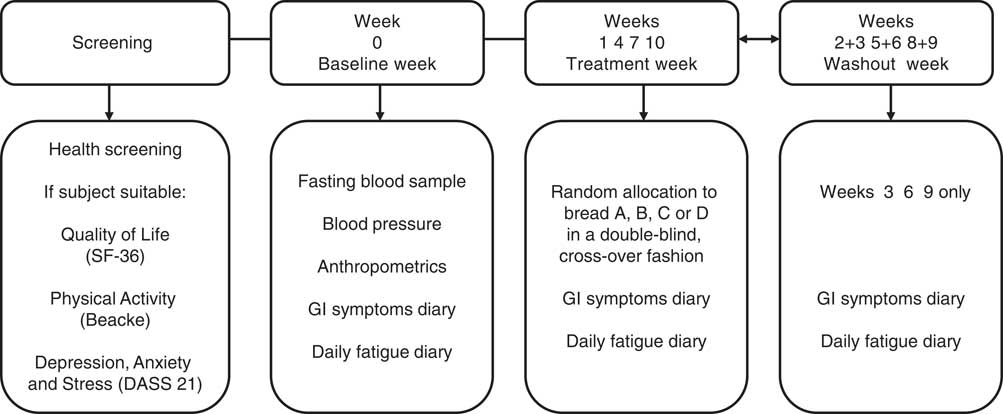
After 1 week on their habitual diet (week 0), subjects were randomly allocated in a double-blind, cross-over fashion to one of the four breads (Fig. 2). The trial participants were instructed to consume each treatment bread for 1 week (3 slices/d – 105 g), replacing the bread they normally ate with the experimental bread. For the duration of the study, the volunteers were asked to continue to eat their habitual diet, but to refrain from eating gluten containing foods (as well as other foods), which they considered to cause GI discomfort. The experimental period was followed by a 14-d wash-out period before crossing over to the next bread. Subjects experiencing reappearance of intolerable symptoms on a treatment bread were asked to cease the study bread of that particular intervention but to continue to fill in the GI symptoms and daily fatigue diaries. Subjects were allowed to continue with the trial if they wished. Compliance was assessed verbally at regular reviews and counting the slices of bread left at the end of the treatment week.
Study design. After 1 week of a baseline period consuming their habitual diet (week 0), subjects were randomly allocated in a double-blind, cross-over fashion to the four breads, labelled as bread A, B, C or D. Each experimental period was followed by a 14-d wash-out period before crossing over to the next bread. SF-36, 36-Item Short Form Health Survey, DASS 21, Depression, Anxiety and Stress Scale; GI, gastrointestinal.
Gastrointestinal symptoms and fatigue
GI symptoms were assessed using 100 mm VAS( Reference Biesiekierski, Newnham and Irving 4 ). Perception of fatigue was evaluated by the Daily Fatigue Impact Scale (D-FIS)( Reference Fisk and Doble 22 ) − an eight-item self-report questionnaire, with five options of response per item (from 0=no problem, to 4=extreme problem). The D-FIS score is derived from the sum of the ordinal scores obtained for each item with possible score range of 0–32. For comparison, VAS ranging from 0 to 100 mm and with higher values indicating more tiredness was also used( Reference Biesiekierski, Newnham and Irving 4 ). Visual analogue scales for GI symptoms and fatigue and D-FIS questionnaire were completed daily during baseline (week 0) while on their habitual diet; during treatment weeks (weeks 1, 4, 7, 10) and during the second wash out week between each treatment (weeks 3, 6, 9) when the volunteers were following their habitual diet (see Fig. 2).
Serum analysis
IgA levels in serum were measured using the Konelab analyser. IgA was purchased from Thermo Fisher Scientific. The detection limit was 0·2 g/l. The concentrations of anti-human-tissue-transglutaminase IgA (anti-htTG IgA) (Immundiagnostik AG), gliadin IgA and IgG (Genesis Diagnostics Ltd) and zonulin (Immundiagnostik AG) in the serum were measured using specific ELISA. Samples classed as negative were as follows:<22 AU/ml (htTG IgA); <4U/ml (gliadin IgA); <10 U/ml (gliadin IgG); normal reference range for zonulin was 34 ng/ml (±14 ng/ml) (data supplied by the manufacturer of the kit).
Whole blood analysis
The full blood count was determined with a SYSMEX (Eightcheck-3WP Assay Sysmex Europe GmbH) on EDTA treated blood. Measurements were performed within 30 min of collection, according to the manufacturer’s instructions.
Lipid and blood glucose analyses were determined using an Alere Cholestech LDX (LDX Lipid Profile+Glucose cassette supplied by Alere Ltd) on heparin treated blood. Measurements were performed within 30 min of collection, according to the manufacturer’s instructions.
The determination of basophil activation upon wheat allergen stimulation (Flow2 CAST test) was carried out using whole EDTA anti-coagulated blood. Flow2 CAST and wheat allergen were purchased from BÜHLMANN Laboratories AG. Analysis were performed according to the manufacturer’s instructions on the day of blood collection, using a Becton-Dickinson FACSCalibur flow cytometer.
Statistical analysis
Power calculations
The study aimed to detect a minimum shift of 10 VAS units (out of a total of 100 units) in GI scores due to the consumption of the treatment breads, within each of the control and GS groups. Assuming a within volunteer spread of 10 VAS units, a power of 90 % and 5 % significance, this required twelve volunteers (per group). To allow for dropout and non-compliance this was raised to sixteen volunteers for each group.
Assessment of differences in baseline characteristics between control and gluten-sensitive groups
Baseline measurements of the control and GS groups were compared by independent-samples t test. In addition, differences in baseline blood measurements between the two groups were also compared by analysis of variance with covariate adjustment for age and BMI.
Assessment of suitability of Aspergillus niger prolyl endoprotease treated bread for consumption by gluten-sensitive volunteers, based on gastrointestinal and daily fatigue scores
First, the scores from the habitual diet (obtained during week 0 and the 2nd week of each washout period, weeks 3, 6 and 9) were analysed to investigate trends over time, based on analysis of variance with volunteer as random effect and week, group and their interaction as fixed effects, followed by post hoc t test comparisons. This indicated that for several GI symptoms the scores were significantly (P<0·05) higher at week 0 and declined over time. This is a well-known psychological effect when participants are entering into a trial( Reference Spiller 23 ). Second, the GI and daily fatigue scores obtained during the treatment weeks (weeks 1, 4, 7 and 10) were analysed by ANOVA with volunteer as random effect and with treatment, group and their interaction as fixed effects, and with the corresponding habitual diet score from the preceding washout week as covariate. Third, as comparison of the treatment diets against the habitual diet was of specific interest, an alternative analysis was also performed, where the scores of the habitual diet (weeks 0, 3, 6 and 9) were averaged and, together with the four treatments, analysed as ANOVA with volunteer as random effect and with treatment (including the habitual diet), group and their interaction as fixed effects. The overall findings of this third analysis were similar to those from the covariate analysis (second analysis), and therefore findings from the latter are presented. This was followed by post hoc t tests to compare the scores obtained from the four treatment breads against those of the habitual diet for both control and GS groups.
For all statistical analyses, visual inspection of the residual plots indicated that assumptions of normality and constant variance had been met and therefore no transformations were needed. A P value<0·05 indicated statistical significance. Data are presented as means with their standard errors. All statistical analyses were conducted in Genstat 17th Edition (Release 17.1; VSN International Ltd).
Results
Subjects
The baseline characteristics of the subjects in both treatment groups are shown in Table 1. Data are only reported for those subjects who completed the study. There were no significant differences in the baseline characteristics between the two groups with respect to age, BMI, systolic and diastolic blood pressure and pulse.
Baseline characteristics of the control (CON) and gluten-sensitive (GS) treatment groups (Mean values with their standard errors)
* Two-sample t test.
Analytical results of the breads
Typically 80 % of the protein in bread is gluten( Reference Kasarda, Nimho and Kohler 24 ). In our study, the control bread contained 7·88 % protein, whereas the bread prepared with biscuit flour was approximately 16 % lower in protein than the control bread. As a consequence of the addition of the enzyme, both ANPEP treated breads contained more protein in relation to the control bread (Table 2).
Analysis of the experimental breads (Mean values with their standard errors; n 2)
dmb, DM base; ANPEP, Aspergillus niger prolyl endoprotease; PPU, propyl peptidase units.
The level of gluten degradation was evaluated by two different ELISA assays, one sensitive to the α-20 gliadin, the other to the R5 epitope. Both assays showed that ANPEP treated breads contained approximately 40 % less immunoreactive gluten than the control bread. However, increasing the concentrations of ANPEP from 0·8 % w/w to 1·0 % w/w did not increase the degradation of the gluten. The gluten content of bread prepared with biscuit flour was approximately 16 % lower than that of the control bread and consistent with its lower protein content (Table 3).
Gluten content of the breadFootnote * (Mean values with their standard errors; n 3)
ANPEP, Aspergillus niger prolyl endoprotease.
a,b,c Mean values in the same column with unlike superscript letters are significantly different – post hoc comparisons (P<0·001).
* Data are normalised to the control bread (100 %). Data were analysed by one-way ANOVA.
Lifestyles in relation to gluten consumption
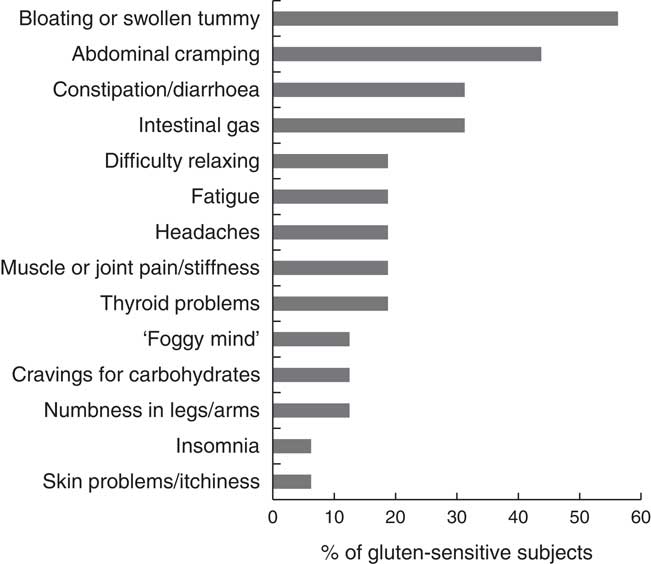
During the process of recruitment the subjects’ experiences, personal histories and understanding of gluten were assessed using questionnaires and an interview (sixty-two subjects were interviewed, twelve of these were healthy controls). Of the fifty GS volunteers with no diagnosis of coeliac disease, that completed the questionnaires, eleven (22 %) followed a strict GFD with the remaining thirty-nine subjects (78 %) following a low-gluten lifestyle by mainly substituting wheat bread and pasta with GF options or removing those items from their diet altogether. With the exception of two subjects, those who were following a strict GFD declined to participate. Those individuals, who consented to take part, were mostly GS subjects with a low-gluten lifestyle, whose habitual diet still contained variable quantities of gluten. Fig. 3 shows the range and frequency of GI and extra-intestinal manifestations (self-perceived as gluten-related), reported by the GS study group before adopting a low-gluten lifestyle.
Frequency of gastrointestinal and extra-intestinal symptoms reported by the subjects in the gluten-sensitive group before adopting a low-gluten lifestyle.
Biomarkers for coeliac disease and wheat allergy
The total IgA levels were within the normal range in all participants, between 0·7 to 3·6 g/l. For all the GS participants the IgA anti-tTG values for CD-associated antibodies were lower than the accepted levels for diagnosis of CD (<22 AU/ml). Gliadin IgA was weakly positive (value 5 U/ml IgA) for one participant in the GS group (cut-off values indicated by the manufacturer>4 U/ml IgA), the levels for all other samples in the GS and control groups were negative. A positive result for Gliadin IgG was observed in 18 % of the GS participants who had values >10 U/ml IgG. There was also one positive sample in the control group. Serum zonulin levels were in the (34 (sem 14) ng/ml) range (as per manufacturer’s data sheet) for all participants in both groups, with the exception of one control sample. No GS subjects with a wheat allergy were identified upon basophil activation with a wheat allergen (data not shown).
Whole blood results
The GS subjects had 9 % lower erythrocyte concentration (P=0·02), 6 % higher mean corpuscular volume (MCV) (P=0·002), 4 % higher mean corpuscular Hb (P=0·03), 13 % higher platelet distribution width (PDW) (P=0·01) and 10·5 % higher mean platelet volume (MPV) (P=0·005) in comparison with the control group (independent-samples t tests). The values remained significantly different after adjusting for age and BMI as covariates (Table 4).
Comparison of full blood count (FBC), lipid profile and blood glucose measurements between control (CON) and gluten-sensitive (GS) group at baseline (Mean values with their standard errors)
* From ANOVA with age and BMI as covariates. Control group (n 12), GS group (n 16).
The GS group had 18 % lower total cholesterol levels than the control group (independent-samples t test; P=0·018). However, this was not significant after adjustment for age and BMI (P=0·082). Subjects in the GS group had significantly higher HDL values in comparison with the control group (independent-samples t test; 1·4 (sem 0·1) v. 1·7 (sem 0·1); P=0·021). After adjustment for age and BMI, differences in HDL were no longer significant. GS subjects had 30 % lower LDL levels (P=0·005) and the LDL:HDL ratio was 3·2 (sem 0·4) in the control v. 1·8 (sem 0·2) in the GS group (P=0·003). These remained significant after adjustment for age and BMI (for LDL P=0·008; for LDL:HDL ratio P=0·005) (Table 4). There were no differences in the blood glucose concentrations between the two groups (Table 4).
Gastrointestinal symptoms
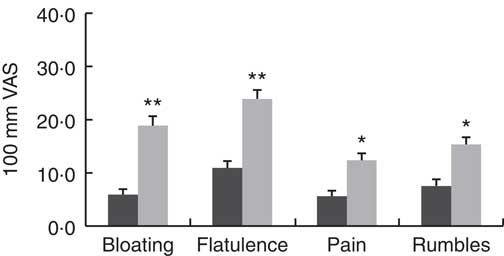
There were no differences in the severity of the GI symptoms measured (P>0·095) between the control and GS group while on their habitual diet (Table 5). There were no significant effects of dietary treatment, and there were no significant interactions with participant group. There were however differences between the two groups after consumption of the experimental breads. The scores for bloating (15 VAS units; P=0·008), flatulence (13 VAS units; P=0·003), pain (8 VAS units; P=0·045) and rumbles (8 VAS units; P=0·04) were higher in the GS group when compared with the control (Fig. 4).
Gastrointestinal symptoms experience in the control and gluten-sensitive groups. Values are means, with their standard errors over all five treatments combined (habitual diet and four treatment breads). Control group (n 12, ![]() ), gluten-sensitive (GS,
), gluten-sensitive (GS, ![]() ) group (n 16). Data were analysed by ANOVA with random effect for participants and fixed effects for group, treatment and their interaction. Significant effects for group: * P<0·05, ** P<0·01. There were no significant effects for treatment and its interaction with group. VAS, visual analogue scale.
) group (n 16). Data were analysed by ANOVA with random effect for participants and fixed effects for group, treatment and their interaction. Significant effects for group: * P<0·05, ** P<0·01. There were no significant effects for treatment and its interaction with group. VAS, visual analogue scale.
Gastrointestinal (GI) symptoms experience in control (CON) and gluten-sensitive (GS) groups before and after consumption of different treatment breadsFootnote † (Mean values with their standard errors)
ANPEP, Aspergillus niger prolyl endoprotease.
Significance of comparison against the habitual diet within group: * P<0·05, ** P<0·01.
† Control group (n 12), GS group (n 16). Data were analysed by ANOVA with random effect for volunteer and fixed effects for diet, group and its interaction. The effect of group was significant for bloating, flatulence, pain and rumbles. There were no significant effects of diet or its interaction with group. Comparison symptom scores of the various test breads against those observed during the habitual diet was of specific interest and therefore post hoc t test was performed to compare, within each group, GI symptoms during the treatment breads against symptoms when following the habitual diet.
Of specific interest was the comparison of GI symptoms while on the experimental breads against the symptoms observed when following the habitual diet. So although there was no overall significant effect of treatment, post hoc testing was performed to compare, within each group, the experimental bread against the habitual diet. When comparing the breads against habitual diet within the control group, none of the experimental breads had any significant effects on the GI symptoms measured. For the GS group however, consumption of all experimental breads numerically increased GI symptoms severity in comparison with the normal habitual diet (Table 5). These increases reached statistical significance for some GI symptoms only with control bread (pain, 10 VAS units; P=0·007; rumbles, 11 VAS units; P=0·040) and bread made with biscuit flour (flatulence, 21 VAS units; P=0·006), with rumbles showing a tendency to increase (rumbles, 9 VAS units; P=0·052) (Table 5).
Extra-intestinal symptoms
The comparison of the fatigue scores (using D-FIS) in the group of healthy individuals v. the GS group, showed numerically better scores in the healthy controls (e.g. lower level of fatigue) compared with the GS group, but this did not reach statistical significance (P>0·05) (Table 6). The same pattern was observed with the scoring on the fatigue VAS scale.
Comparison of fatigue experience between control (CON) and gluten-sensitive (GS) groups before and after consumption of different treatment breads (Mean values with their standard errors)
ANPEP, Aspergillus niger prolyl endoprotease; grp, group; treat, treatment; D-FIS, Daily Fatigue Impact Scale; VAS, visual analogue scale.
* n 12 for control group; n 16 for GS group.
† Data were analysed by ANOVA with random effect for participants and fixed effects for grp, treat and their interaction.
The Baecke questionnaire was used for the evaluation of habitual physical activity. It consists of sixteen questions and separates the person’s physical activity into three categories: physical activity during work, sports and leisure time. The GS group had a statistically significant higher leisure index compared with the control group (2·6 v. 3·3; P=0·006) (Table 7).
Comparison of the indices of physical activity, 36-Item Short Form Health Survey (SF-36) scale and Depression, Anxiety and Stress Scale (DASS-21) subscales between control (CON, n 12) and gluten-sensitive (GS, n 16) group at baseline (Mean values with their standard errors)
* One-way ANOVA adjusted for age and BMI.
SF-36 survey for measurement of health status yields an eight-subscale profile of functional health and well-being. Comparison of the SF-36 scores did not reveal any statistically significant differences between the control and GS group with respect to any of the SF-36 subscales (Table 7).
The Depression, Anxiety and Stress Scale is a twenty-one-item self-report scale designed to measure the emotional states of depression, anxiety and stress. There were no statistically significant differences between the control and GS groups with respect to the three DASS-21 subscales (Table 7).
Discussion
This study shows that individuals who are self-defined as being sensitive to gluten differ from healthy controls in several measurable ways and show an increase in the severity of GI symptoms when challenged with normal bread.
Two distinct groups of GS subjects were identified: those who follow a strict GFD (22 % of those who responded) and those who follow a low-gluten lifestyle by removing ‘normal’ bread and pasta (and occasionally other gluten containing items) from their diets or substituting them with GF options as a relatively easy way of avoiding excess gluten. The attitude to a strict GFD depends on personal experience; individuals with severe symptoms are committed to a GFD because of the impact it has on their health, whereas those with mild discomfort focus on following a low-gluten lifestyle. The qualitative data from both, the questionnaire and from interviews with the volunteers, suggest that whilst this latter group self-define themselves as being sensitive to gluten, they still have a variable but reduced gluten intake and are not gluten-free.
Bread-making wheat typically contains ca 11 % protein, 80 % of which is gluten. This equates to an intake of approximately 9 g of gluten/100 g of bread( Reference Kasarda, Nimho and Kohler 24 ). Consumption of bread in the UK is estimated to be approximately 90 g/d( 25 , 26 ), thus average adult consumption of gluten in bread is approximately 8 g/d. Three slices of the control bread provided the volunteers with 6·6 g of gluten/d. The biscuit flour bread provided the volunteers with around 5·6 g gluten/d. Treatment of the flour with ANPEP reduced the amount of gluten by approximately 40 % and provided the volunteers with 2·6 g of gluten/d. It is unclear why there was no additional reduction of the gluten content in bread treated with 1 % ANPEP (as was anticipated) when compared with 0·8 % ANPEP.
There were no differences in the severity of the GI symptoms measured between the control and GS groups while on their habitual diet, suggesting that following a low-gluten lifestyle reduces the symptoms to tolerable levels in those GS sufferers with mild complaints.
The absence of GI symptoms in the control group suggest that the proline-specific ANPEP is well tolerated and can be used in the production of bread which retains taste, texture and appearance despite the 40 % reduction of immunoreactive gluten. In contrast, the individuals in the GS group experienced more noticeable GI symptoms while consuming the experimental breads. When the data were combined (Fig. 4), the measured GI symptoms in the control group were within the physiological range (<10 mm VAS), effectively no symptoms, whereas the GS group reported mild GI discomfort (up to 30 mm VAS). Indeed, the majority of GS subjects, who agreed to participate in the trial, reported during the screening process that they experienced mild symptoms. Furthermore, two of the participants who reported more severe symptoms (and were on a strict GFD) dropped out during the 1st treatment week when consuming either control bread or bread made with biscuit flour. Therefore, it is possible that an unintended sample bias has been introduced as the true effect is underestimated by excluding volunteers in the higher scoring range. This may be an important weakness in this and similar studies and should be considered in future designs.
All of the experimental breads numerically increased the severity of the GI symptoms experienced by the GS group in comparison with their habitual diet (Table 5). These increases reached significance for some GI symptoms only with the control and biscuit flour bread. Although the ANPEP bread failed to reach statistical difference for increasing symptoms in comparison with the subjects’ habitual diet, the overall magnitude of the effects were similar for all four treatments. This may be due to levels of gluten in the ANPEP bread being insufficiently reduced. Also, the absence of a treatment effect needs to be considered in the light of the difficulties encountered working with this group of subjects. A nocebo effect, a strong anticipatory symptomatic response, is often reported in NCGS populations( Reference Junker, Zeissig and Kim 8 , Reference Zanini, Baschè and Ferraresi 27 ) and there is a possibility that the positive symptomatic responses observed across all treatment arms are a result of a nocebo effect. A placebo, gluten-free treatment, was not included in this trial as it is virtually impossible to produce gluten-free bread, with similar qualities of taste and texture to bread prepared with wheat flour. As volunteers would have been readily able to distinguish the gluten-free product, a placebo would have been rendered useless.
The investigation into the exclusion of coeliac disease and wheat allergy was initially through health screening and gluten sensitivity questionnaires and an interview. There was considerable variation in the pathway and time of the diagnostic tests for the previous exclusion of coeliac disease and wheat allergy. Most of the participants had not had a duodenal biopsy as their GP ruled out the diagnosis based on negative serology tests. These tests took place between 5 months and 18 years before the start of the study.
The National Institute for Health and Care Excellence guideline published in September 2015 states that any test for CD is accurate only if a gluten-containing diet is eaten during the diagnostic process and that some gluten has to be eaten in more than one meal every day for at least 6 weeks before testing( 28 ). IgA tissue transglutaminase (IgA tTG) is most commonly used as the first test to detect the presence of coeliac disease antibodies. This test should be done after testing for IgA deficiency. IgA deficiency is defined as total IgA <0·07 g/l and will result in a false negative result when tested for IgA antibody( 28 ). As the participants in this study were following a low-gluten diet as opposed to a GFD and considering the variations in their previous experience in testing for CD we performed in-house CD diagnosis tests as described above. However, although all GS participants had negative IgA tTG serology, there is still the possibility that the levels of gluten intake in their diet were not sufficient to trigger a high enough titre for detection of tTG antibodies.
Besides the use of the ‘anti-self’ tTG antibodies, we also performed measurements for ‘anti-gluten’ antibodies – anti-gliadin IgG and IgA. These have been previously reported to have high titres in subjects with gluten sensitivity( Reference Volta, Tovoli and Cicola 29 ) and anti-gliadin IgG test was positive in 57 % of the cases in subjects consuming normal gluten-containing diet( Reference Volta, Tovoli and Cicola 29 ). In our study the anti-gliadin IgG test was positive in only 18 % of the GS participants and there was one positive sample in the control group. One possible explanation for the differences in our results is that the low-gluten diet did not sufficiently challenge the production of anti-gliadin IgG in some of the participants. Indeed, it is a widely held view that IgG testing can be used to monitor exposure to gluten, but a positive test does not confirm the presence of food intolerance( Reference Stapel, Asero and Ballmer-Weber 30 ).
Zonulin is a type of protein involved in the regulation of intercellular tight junctions of the intestinal cells( Reference Wang, Uzzau and Goldblum 31 ). Gluten is one of the most powerful triggers for the production and release of zonulin( Reference Fasano 32 ) and a link between zonulin and diseases such as coeliac disease and dermatitis herpetiformis has already been established( Reference Fasano 32 , Reference Smecuol, Sugai and Niveloni 33 ). For this reasons we investigated zonulin levels in self-defined GS subjects on a low-gluten diet and compared the results to the healthy controls. In this study we find no elevated levels of serum zonulin the GS participants.
Our results show a trend for lower total cholesterol level and significantly lower LDL levels (P=0·008) and LDL:HDL ratio in the GS group, when compared with the non-GS group (Table 4). Coeliac disease is associated with low cholesterol levels, which is thought to contribute to a favourable cardiovascular risk profile( Reference West, Logan and Hill 34 , Reference Lewis, Sanders and Logan 35 ). Our findings confirm similarities in the lipid profile of gluten-related disorders, suggesting that the possible mechanisms involved in altering this profile may be linked to the ingestion of gluten.
Anaemia can be the only finding in some patients with coeliac disease( Reference Baydoun, Maakaron and Halawi 36 ) and is the most frequent extra-intestinal symptom related to the condition( Reference Bottaro, Cataldo and Rotolo 37 ). However, evidence for diagnosis of CD can be found in cases without anaemia, but with an unexplained abnormality on a full blood count, such as erythrocyte macrocytosis( Reference Swinson and Levi 38 , Reference Logan, Tucker and Rifkind 39 ). Our results show that although there were no significant differences between the Hb levels in the two groups, subjects with self-defined sensitivity to gluten had significantly higher MCV and MCH when compared with the control group (Table 4). MCV (erythrocyte size) together with erythrocyte distribution width (variability in size of the erythrocytes) were used by Bessman et al.( Reference Bessman, Gilmer and Gardner 40 ) to construct an improved classification of anaemias.
Systemic inflammation is found to be behind the micronutrient deficiencies in patients with CD even in absence of macroscopic damage to the proximal small bowel( Reference Rostami, al Dulaimisss and Nejad 41 ). Our study also demonstrates higher values for MPV and platelet distribution (or size deviation) width (PDW) in GS subjects compared with healthy controls. This might be indicative of platelet destruction, leading to more freshly formed or younger platelets, which are larger in size, circulating in the bloodstream. A possible association between MPV and different inflammatory conditions has been reported in the literature( Reference Yüksel, Helvac and Basar 42 , Reference Endler, Klimesch and Sunder-Plassmann 43 ) and the results in the present study may reflect an on-going intestinal inflammation.
Fatigue is a manifestation reported by subjects experiencing gluten sensitivity( Reference Biesiekierski, Newnham and Irving 4 , Reference Zanini, Baschè and Ferraresi 27 ). Information on the impact of fatigue on quality of life and mental status (depression, anxiety and stress) in the GS population is limited. In addition, to the best of our knowledge, no comparisons have previously been made with results obtained in a healthy control group. In our study, the fatigue index for the GS group, although numerically higher, was comparable with that of the control group, for example no clinical implication was confirmed. Moreover, comparisons within the GS group did not reveal increased levels of tiredness during the treatment periods when compared with the normal habitual diet periods. These outcomes are not in line with the results of the study conducted by Biesiekierski et al.( Reference Biesiekierski, Newnham and Irving 4 ) which reported prominent effects on tiredness in this population, whereas on a gluten-containing diet. Our study has the advantage of determining the degree of the perception of fatigue in healthy people as a physiological benchmark for comparison and also taking into account other factors such as physical activity.
Compared with the control group, the GS group scored higher on the physical activity for leisure index. This suggests that the GS group makes more health oriented choices for keeping active during their leisure time and this may be partly the reason for the lack of fatigue in the GS group, as it has been shown that physical activity is one of the best ways to handle fatigue( Reference Berthouze, Dumoulin and Reynes 44 ).
Previous studies have shown that short-term exposure to gluten may have a negative effect on the mental state of people who believe that they are sensitive to gluten( Reference Di Sabatino, Volta and Salvatore 45 , Reference Peters, Biesiekierski and Yelland 46 ). In this study, both the control and the GS group were within the normal range for all three subscales for depression, anxiety and stress and no differences between the two groups were identified. Our results confirm the findings of Brottveit et al.( Reference Brottveit, Vandvik and Wojniusz 47 ) who report no elevated scores for anxiety and depression.
The SF-36 survey is useful in the assessment of the quality of life in relation to health. In this study comparison of the SF-36 scores did not reveal any differences between the control and GS group with respect to any of the SF-36 subscales.
Our study has some important limitations. The small number of participants did not allow us to perform GS subgroups analyses of discrete GI symptoms, extra-intestinal manifestations and other related factors, which may play a role in the perception of gluten sensitivity. Preferably a gluten-free control would have been included, but this choice was not made because of the inability to blind gluten-free bread against wheat-based breads.
It is possible that other factors in bread such as FODMAP or the nongluten ATI, which were not targeted by the enzyme, are responsible for the observed effects. In support of FODMAP as the causative agent, a recently published study investigating the effects of gluten (without fructan) and fructan (without gluten) on GI symptoms in individuals intolerant to wheat, rye or barley reported that fructan caused an increase in GI symptoms compared with the placebo control( Reference Skodje, Sarna and Minelle 48 ). It would have been beneficial to control for FODMAP intolerances. However, because these resilient carbohydrates occur not just in wheat but in all kind of foods, such interventions involve individual consultation with a specialist dietitian, who advises on 4–8-week exclusion of foods high in FODMAP, followed by graded reintroduction. Such an approach was beyond the scope of this study and therefore a role for FODMAP in the bread cannot be ruled out.
The lack of unambiguous biomarkers also makes it difficult to confirm the true clinical status of the GS group with respect to NCGS.
In conclusion, the proline-specific ANPEP enzyme lowers the immunogenic content of gluten by approximately 40 % and can be used in the production of wheat products comparable to standard gluten content products in terms of taste, texture and appearance. Only consumption of reference and biscuit flour bread increased GI symptoms in the GS subjects, compared with their habitual diet. However, the 40 % gluten reduction in the ANPEP treated bread showed no treatment effect compared with the other test breads. This may be due to levels of gluten in ANPEP bread being insufficiently reduced to keep the GI symptoms to pre-treatment levels.
Another explanation might be that gluten is not the main driver of the symptoms in this population – a gluten-free or wheat-free diet will not solve the GI symptoms if FODMAP, ATI or other (presently unknown) factors are the main causes of symptoms. This will clearly need to be considered in future studies.
The increase in GI symptoms after consumption of the test breads may also be a consequence of a nocebo effect in the GS population. Self-defined sensitive to gluten individuals who experience mild discomfort when consuming gluten, adopt a low-gluten lifestyle as opposed to following a strict GFD. This approach helps to reduce the GI symptoms severity to tolerable levels. Consumption of wheat bread increases symptoms in the GS subjects in comparison with their habitual diet. In comparison with healthy controls, the GS subjects have a favourable CVD lipid profile and modified haematological profile. Finally, a low-gluten lifestyle was shown to have no effect on the quality of life, fatigue or mental state of the GS population.
Acknowledgements
The authors are grateful for the support of the staff from the Rowett Institute Human Nutrition Unit.
The present study was supported by a grant (Bakery Products for Non-Coeliac Gluten sensitive Consumers) from Innovate UK (101740). The funder Innovate UK had no role in the design, analysis or writing of this article. Warburton Ltd. provided the experimental bread. DSM Food Specialities B.V. provided the protease ANPEP. The study is registered under the Clinical Trials Identifier: NCT02308397.
N. H. proposed the study concept. N. H. and D. R. designed research. D. R. recruited the subjects and carried out the intervention, laboratory analysis, data collection, collation and prepared the manuscript. M. C. and K. M. M. helped with recruitment. G. C. performed the analysis of the breads. G. H. and D. R. analysed the data. N. H. had primary responsibility for final content. All authors read and approved the final manuscript.
The authors declare that there are no conflicts of interest.


