





Introduction
Pesticide applications are important for sustaining the production of major agronomic crops including corn (Zea mays L.), cotton (Gossypium hirsutum L.), soybean [Glycine max (L.) Merr.], and peanut (Arachis hypogaea L.) in the United States. According to recent chemical use surveys in the United States, pesticides were applied to more than 94% of the total number of acres planted with peanut in 2018 (USDA-NASS 2019), 93% of acres planted with cotton in 2019 (USDA-NASS 2020), and 96% of acres planted with corn in 2021 (USDA-NASS 2021c). Among all these row-crops, herbicides were the most extensively used pesticides (applied to more than 90% of the planted acres) followed by fungicides and insecticides. Pesticide applications also represent a major portion of farm production costs where agricultural chemicals account for 4.5% (US$16.5 billion) of the total farm production expenditures in the United States (USDA-NASS 2021b).
Safe application of pesticides is critically important due to the potential adverse human and environmental effects associated with extensive use of pesticides. Increased concerns with off-target movement of pesticides (EPA 2017) have also prompted efforts to re-evaluate application practices (Foster et al. Reference Foster, Sperry, Reynolds, Kruger and Claussen2018) and techniques to improve application accuracy and efficiency (Alves et al. Reference Alves, Kruger, da Cunha, de Santana, Pinto, Guimaraes and Zaric2017; Kudsk Reference Kudsk2017). Application errors when applying pesticides are common (Grisso et al. Reference Grisso, Dickey and Schulze1989; Luck et al. Reference Luck, Pitla, Zandonadi, Sama and Shearer2011) and several factors, including selection of nozzle size or type, spray volume, spray pressure, ground speed, and boom height (Balsari et al. Reference Balsari, Gil, Marucco, van de Zande, Nuyttens, Herbst and Gallart2017; Knoche Reference Knoche1994; Meyer et al. Reference Meyer, Norsworthy, Kruger and Barber2016; Nuyttens et al. Reference Nuyttens, Baetens, De Schampheleire and Sonck2007) can influence application accuracy and efficiency. Furthermore, misapplication can occur in different forms such as incorrect tank mix (inappropriate selection of tank mix partners or off-label applications), insufficient or higher than target spray volume, reduced or inadequate coverage and canopy penetration, physical movement of spray particles due to excessive wind or temperature inversions, application in undesired or no spray areas, and improper sprayer cleanout. Whether pesticide misapplication is unintentional or not, the consequences are detrimental to both crops and environment. Therefore, it is important to focus efforts on using best management practices to minimize sources of errors and to maximize application accuracy while maintaining environmental sustainability (Mathews et al. Reference Matthews, Bateman and Miller2014).
To improve pesticide application accuracy and efficiency, adoption and use of different precision technologies on spray application equipment has also increased considerably over the last decade. Research has shown that when used correctly, common spray technologies, including global positioning system (GPS), rate controller, and section control, can significantly reduce the over-application of pesticides (Luck et al. Reference Luck, Zandonadi, Luck and Shearer2010; Sharda et al. Reference Sharda, Fulton, McDonald and Brodbeck2011, Reference Sharda, Luck, Fulton, McDonald and Shearer2013). The benefits from these technologies are further maximized in large and uneven-shaped fields (Edge et al. Reference Edge, Velandia, Boyer, Larson, Lambert, Roberts and Falconer2018). Today, new application technologies such as pulse-width modulation (PWM) and auto-boom height systems have also been developed and are now available for spray equipment to further improve field and application efficiency. PWM-equipped sprayers help maintain a constant pressure and droplet size across a range of ground speeds (Butts and Kruger Reference Butts and Kruger2018). Auto-boom height technology provides a better spray uniformity and coverage by maintaining a consistent boom height from crop/soil across a field (Sharda et al. Reference Sharda, Griffin, Haag and Slocombe2016). Direct injection systems for precise metering of pesticides (Lammers and Vondricka Reference Lammers and Vondricka2010) and automated weed sensing and spray technologies for selective pesticide applications (Anonymous 2020, 2021) are also becoming more commercially available to use on modern pesticide application equipment.
Common pesticide application practices and technology adoption by growers can vary widely from one state to another because of many factors, including type and age of farm equipment, technology competency and support, demographics, and agronomic crops grown in each state. Recently, several consultant and pesticide applicator surveys were conducted in Missouri (Bish and Bradley Reference Bish and Bradley2017) and Arkansas (Butts et al. Reference Butts, Barber, Norsworthy and Davis2021). These surveys highlight a need for more research on pesticide application practices and techniques, and a better understanding of local and regional needs to develop and implement appropriate educational programs. Georgia is a top producer of many crops including peanuts, pecans (Carya illinoinensis), cotton, tobacco (Nicotiana tabacum), blueberries (Vaccinium sect. Cyanococcus), and peaches (Prunus persica); see USDA-NASS (2021a). Peanut, cotton and field corn are the major agronomic crops grown in Georgia and collectively account for 10% of the total agricultural production in the state (USDA-NASS 2021b). Currently, the knowledge on prevalent pesticide application practices and technology adoption among the growers in the state is limited. Therefore, the objective of this survey was to learn about the common pesticide application practices and technologies used by growers of agronomic crops in Georgia. A thorough understanding of common practices, application equipment, and technologies used by growers will help provide recommendations specific to pesticide application practices, guide research to address grower needs, and tailor efforts to educate growers on management practices and technologies for more efficient pesticide applications.
Materials and Methods
A survey to assess the common pesticide application practices and technologies was created in spring 2021. Both a printed and an online version of the survey were created using Microsoft Word (Office 2019; Microsoft, Redmond, WA) and Qualtrics survey platforms (Qualtrics, Provo, UT). In Georgia, most pesticide applications are performed by growers/farm owners or their family members. Custom pesticide applications using ground spray equipment are not very common, therefore the targeted audience for this survey were the growers who perform their own pesticide applications. The survey included 22 questions and was divided into five different sections with each section consisting of several single- and multiple-choice questions according to the information requested. The first section included demographic and other basic information such as county location, farm size, and the preferred way to receive information about pesticide application equipment and/or technology. The second section posed questions about the prevalent (regular or specialty) spray equipment such as number of sprayers on the farm, use of separate sprayer for any restrictive pesticide applications, sprayer size/boom length, number of nozzles used in a season, and nozzle manufacturer. The third section was aimed at gathering information on common application parameters used by growers for applying herbicides, fungicides, and insecticides such as average ground speed, boom height, spray volume, nozzle size, spray pressure, and droplet size. The fourth section was aimed at determining the prevalence of use by growers of spray technology such as GPS and rate controller, PWM, direct injection, auto-boom height, and the preferred method for logging pesticide records. The final section included several open-ended questions to identify the respondent views on the benefits of application technologies, pesticide application challenges, and research needs in pesticide applications in the future. Some questions included in this survey were adapted from the herbicide application practices survey conducted by Butts et al. (Reference Butts, Barber, Norsworthy and Davis2021) in Arkansas.
In spring 2021, a link to the online survey and a.pdf survey copy were shared via email with county agricultural extension agents in all 159 counties in Georgia. Furthermore, surveys were distributed by county agents among the growers in two different ways: 1) by sending a direct survey link to the growers via email and text message, and 2) printing hard copies of the survey and asking growers to fill the survey information at various face-to-face grower meetings in their respective counties. Besides the methods mentioned above, the survey was also made available online by the Georgia cotton and peanut commodity commissions either on their websites or publicized in their regular newsletters to growers. All printed surveys were either scanned and sent by email or mailed to the survey coordinators via the postal service. Both online and printed survey copies were received from March until August 2021. For ease of data summary and analysis, information from all printed survey copies was entered into the online Qualtrics platform. All survey data collected in the online Qualtrics platform were exported as an excel file (*.xlsx) format and was imported into Microsoft Excel (Microsoft Office 2019) for analysis. For open-ended questions, common keywords such as spray drift, coverage, and so on were identified from the responses, and a frequency analysis was performed to determine the number of respondents who mentioned those keywords in their responses. Not all respondents answered every survey question and because the survey also contained a few multiple-choice questions, the total number of observations (n) varied between the questions and are listed separately for each survey question in the Results and Discussion. The authors also understand and acknowledge the potential bias in the responses because the surveys were distributed by Extension agents and the responses from the growers who do not use or rely on university Extension services for information may not have been accounted and could have differing opinion from the growers who filled out the surveys.
Results and Discussion
Demographic and Other General Information
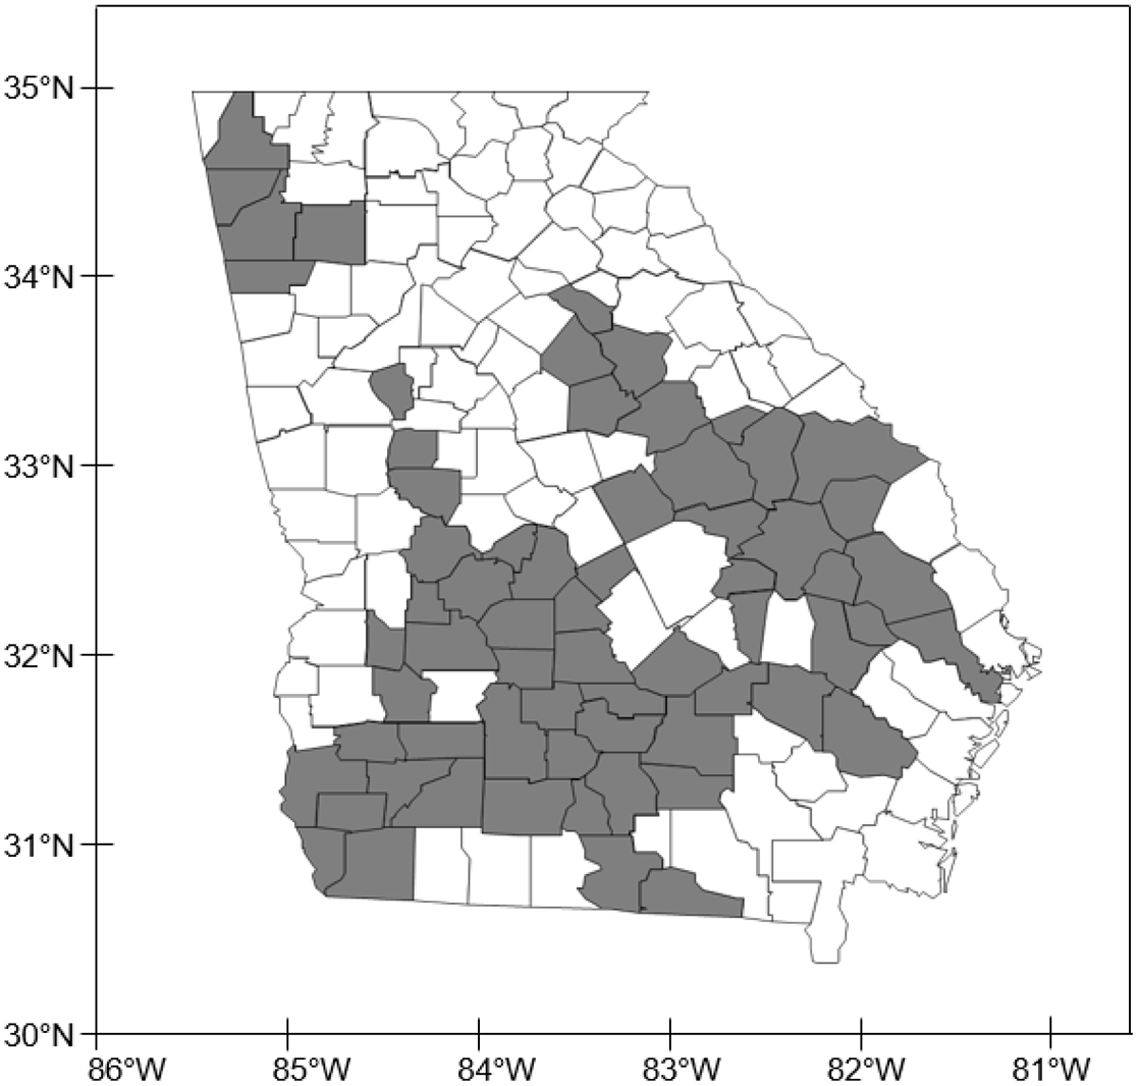
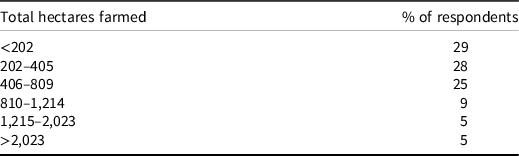
A total of 186 survey responses were recorded. Approximately half of the surveys were completed directly in the online Qualtrics platform by the respondents and the other half represented the printed surveys filled out by the growers at various face-to-face county meetings. Due to the distribution methods employed for this survey, including sharing the online survey through newsletters or online media, an overall response rate for this survey could not be determined. The survey responses were recorded from 65 counties in Georgia (Figure 1), representing nearly all major agricultural regions (southeast, south-central, and southwest regions) in the state, where most of the primary agronomic crops including corn, cotton, peanut, and soybean are grown (USDA-NASS 2021a). On average, the reported hectares accounted for approximately 27% of Georgia’s planted hectares in agronomic crops. More than 50% of survey respondents indicated they farmed 405 hectares or fewer (Table 1). Approximately 9% of the survey respondents indicated a farm size between 810 and 1,214 ha, whereas only 10% of respondents had a farm operation greater than 1,214 ha. Out of the total 186 respondents, approximately 30% farm in more than one county. whereas some growers (mostly those who farm more than 1,214 ha) reported farming in two or more neighboring counties.
Counties (shaded dark grey) in Georgia represented by the survey respondents.
Total farmed hectares as reported by survey respondents (n = 186). Percentages may not total 100% due to rounding.
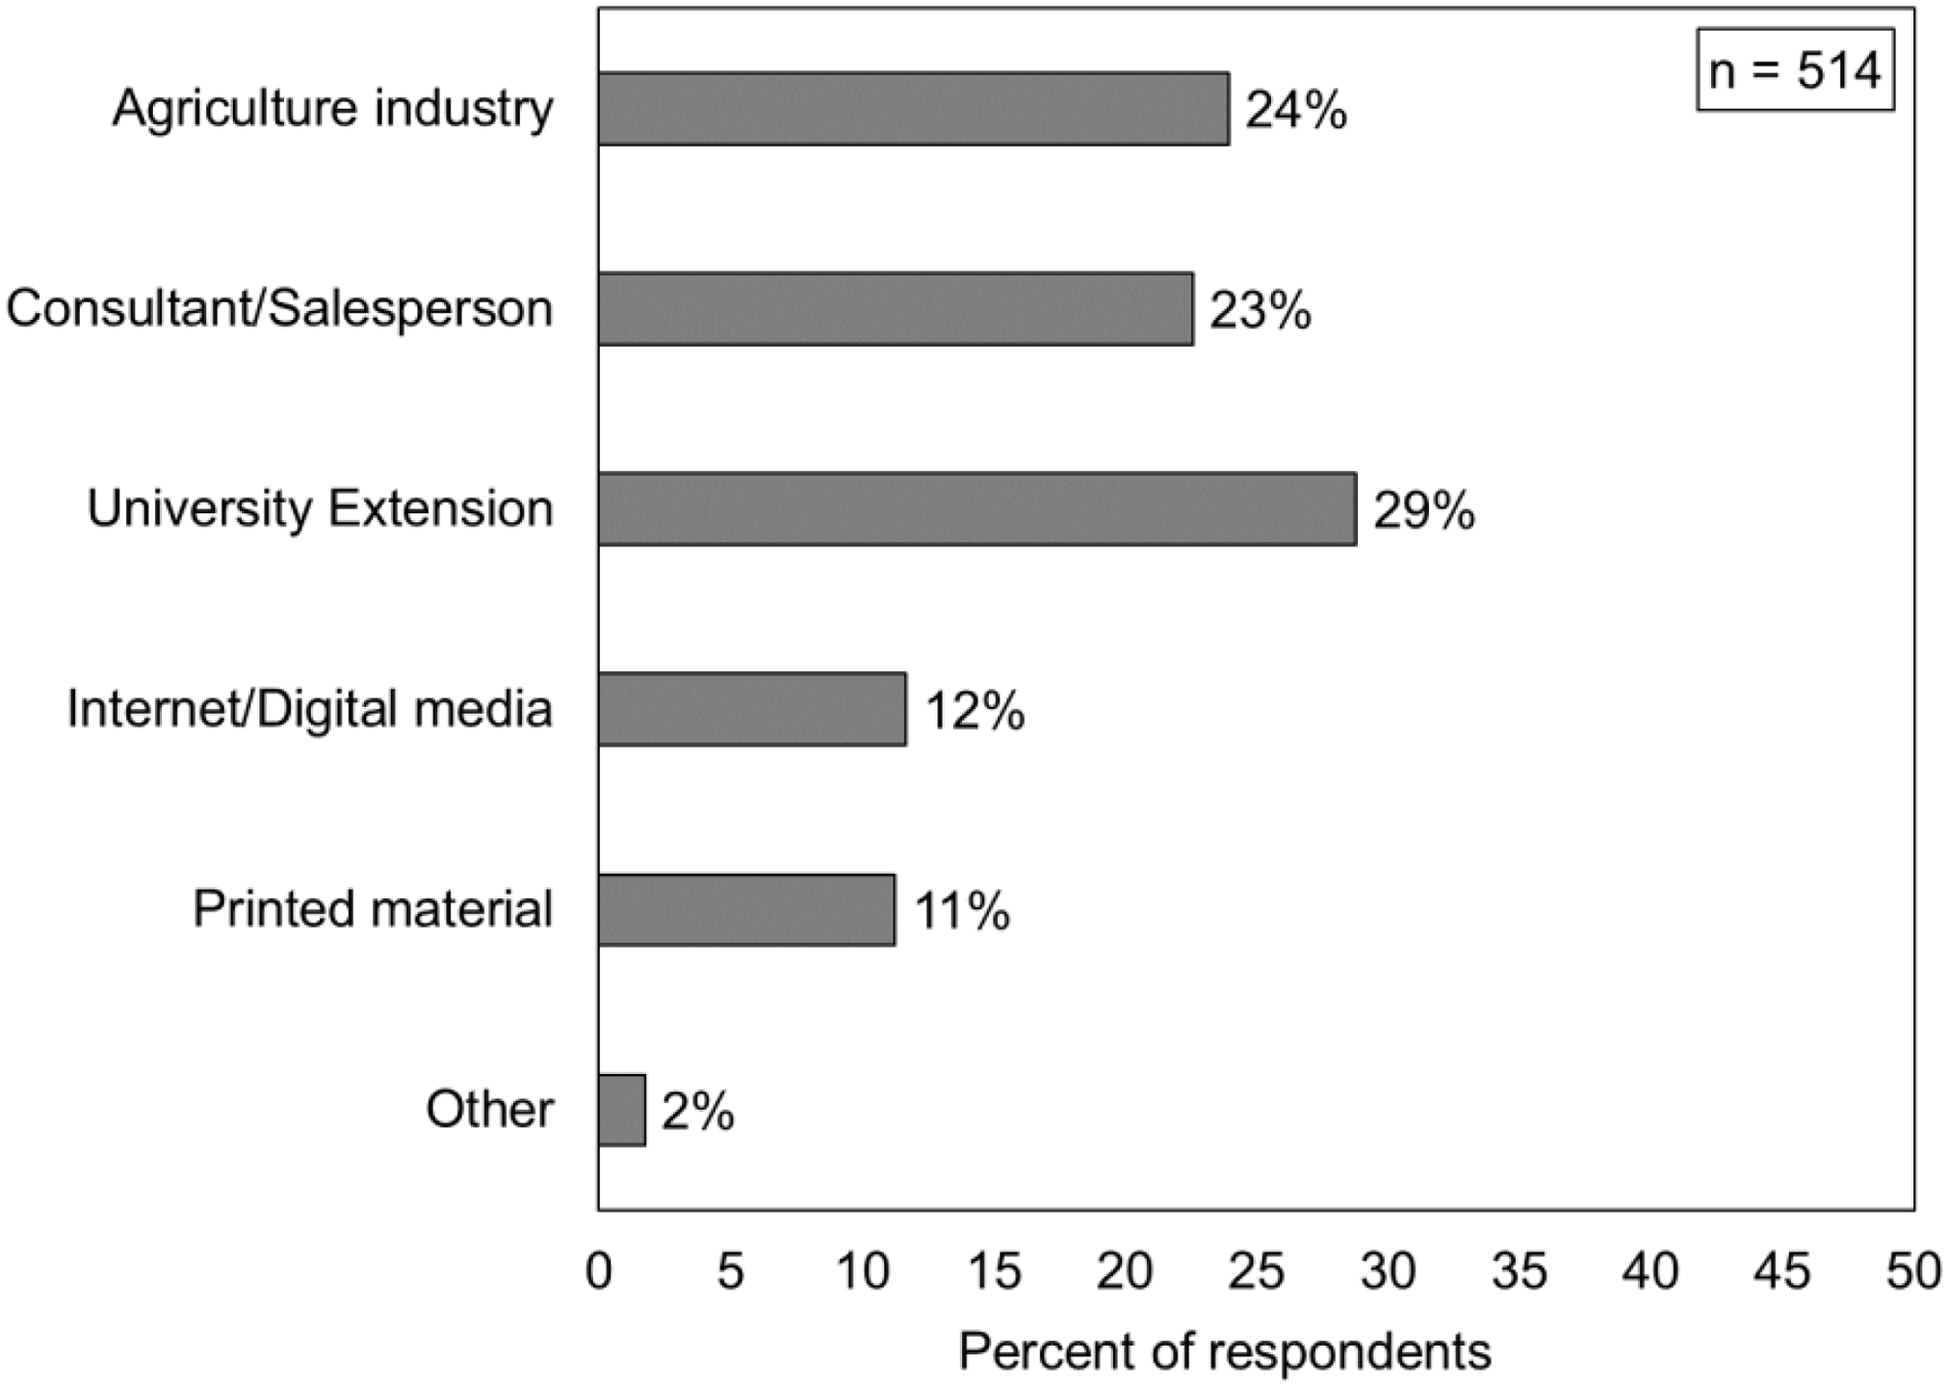
Besides location and size of the farm, one of the survey questions asked about the preferred means to receive the latest information on pesticide application practices and technologies. Respondents were allowed to select all applicable choices out of the options provided (Figure 2) and a total of 514 observations were recorded for this question. Results indicated that a university Extension service was the most preferred way (29%) of receiving new information related to pesticide application and technology by survey respondents followed by an agriculture industry or consultant/salesperson (24% and 23%, respectively). The University of Georgia Cooperative Extension system has Agriculture and Natural Resources agents located in all 159 counties who deliver county-specific information. Extension specialists in each county regularly share the latest research data and information on new pesticide application practices and technologies with agents and growers through multiple meetings and trainings throughout the year. These results re-affirm the need and success of county-based information delivery systems in providing timely and new information to Georgia growers. There could, however, be some potential bias in the responses to this question because these surveys were distributed by county Extension agents to growers who use university Extension services as a source of information. Respondents also indicated using internet/digital platforms such as websites or blogs and printed media such as magazines (11% and 12%, respectively) as a means of obtaining the latest information about new pesticide application and technology. The responses provided under “other” by few respondents indicated that they also receive pesticide related information from their friends and neighbor farmers.
Preferred method of receiving pesticide application and technology information as reported by growers in Georgia. This was a multiple-choice question and percentages may not total 100% due to rounding.
Application Equipment and Practices
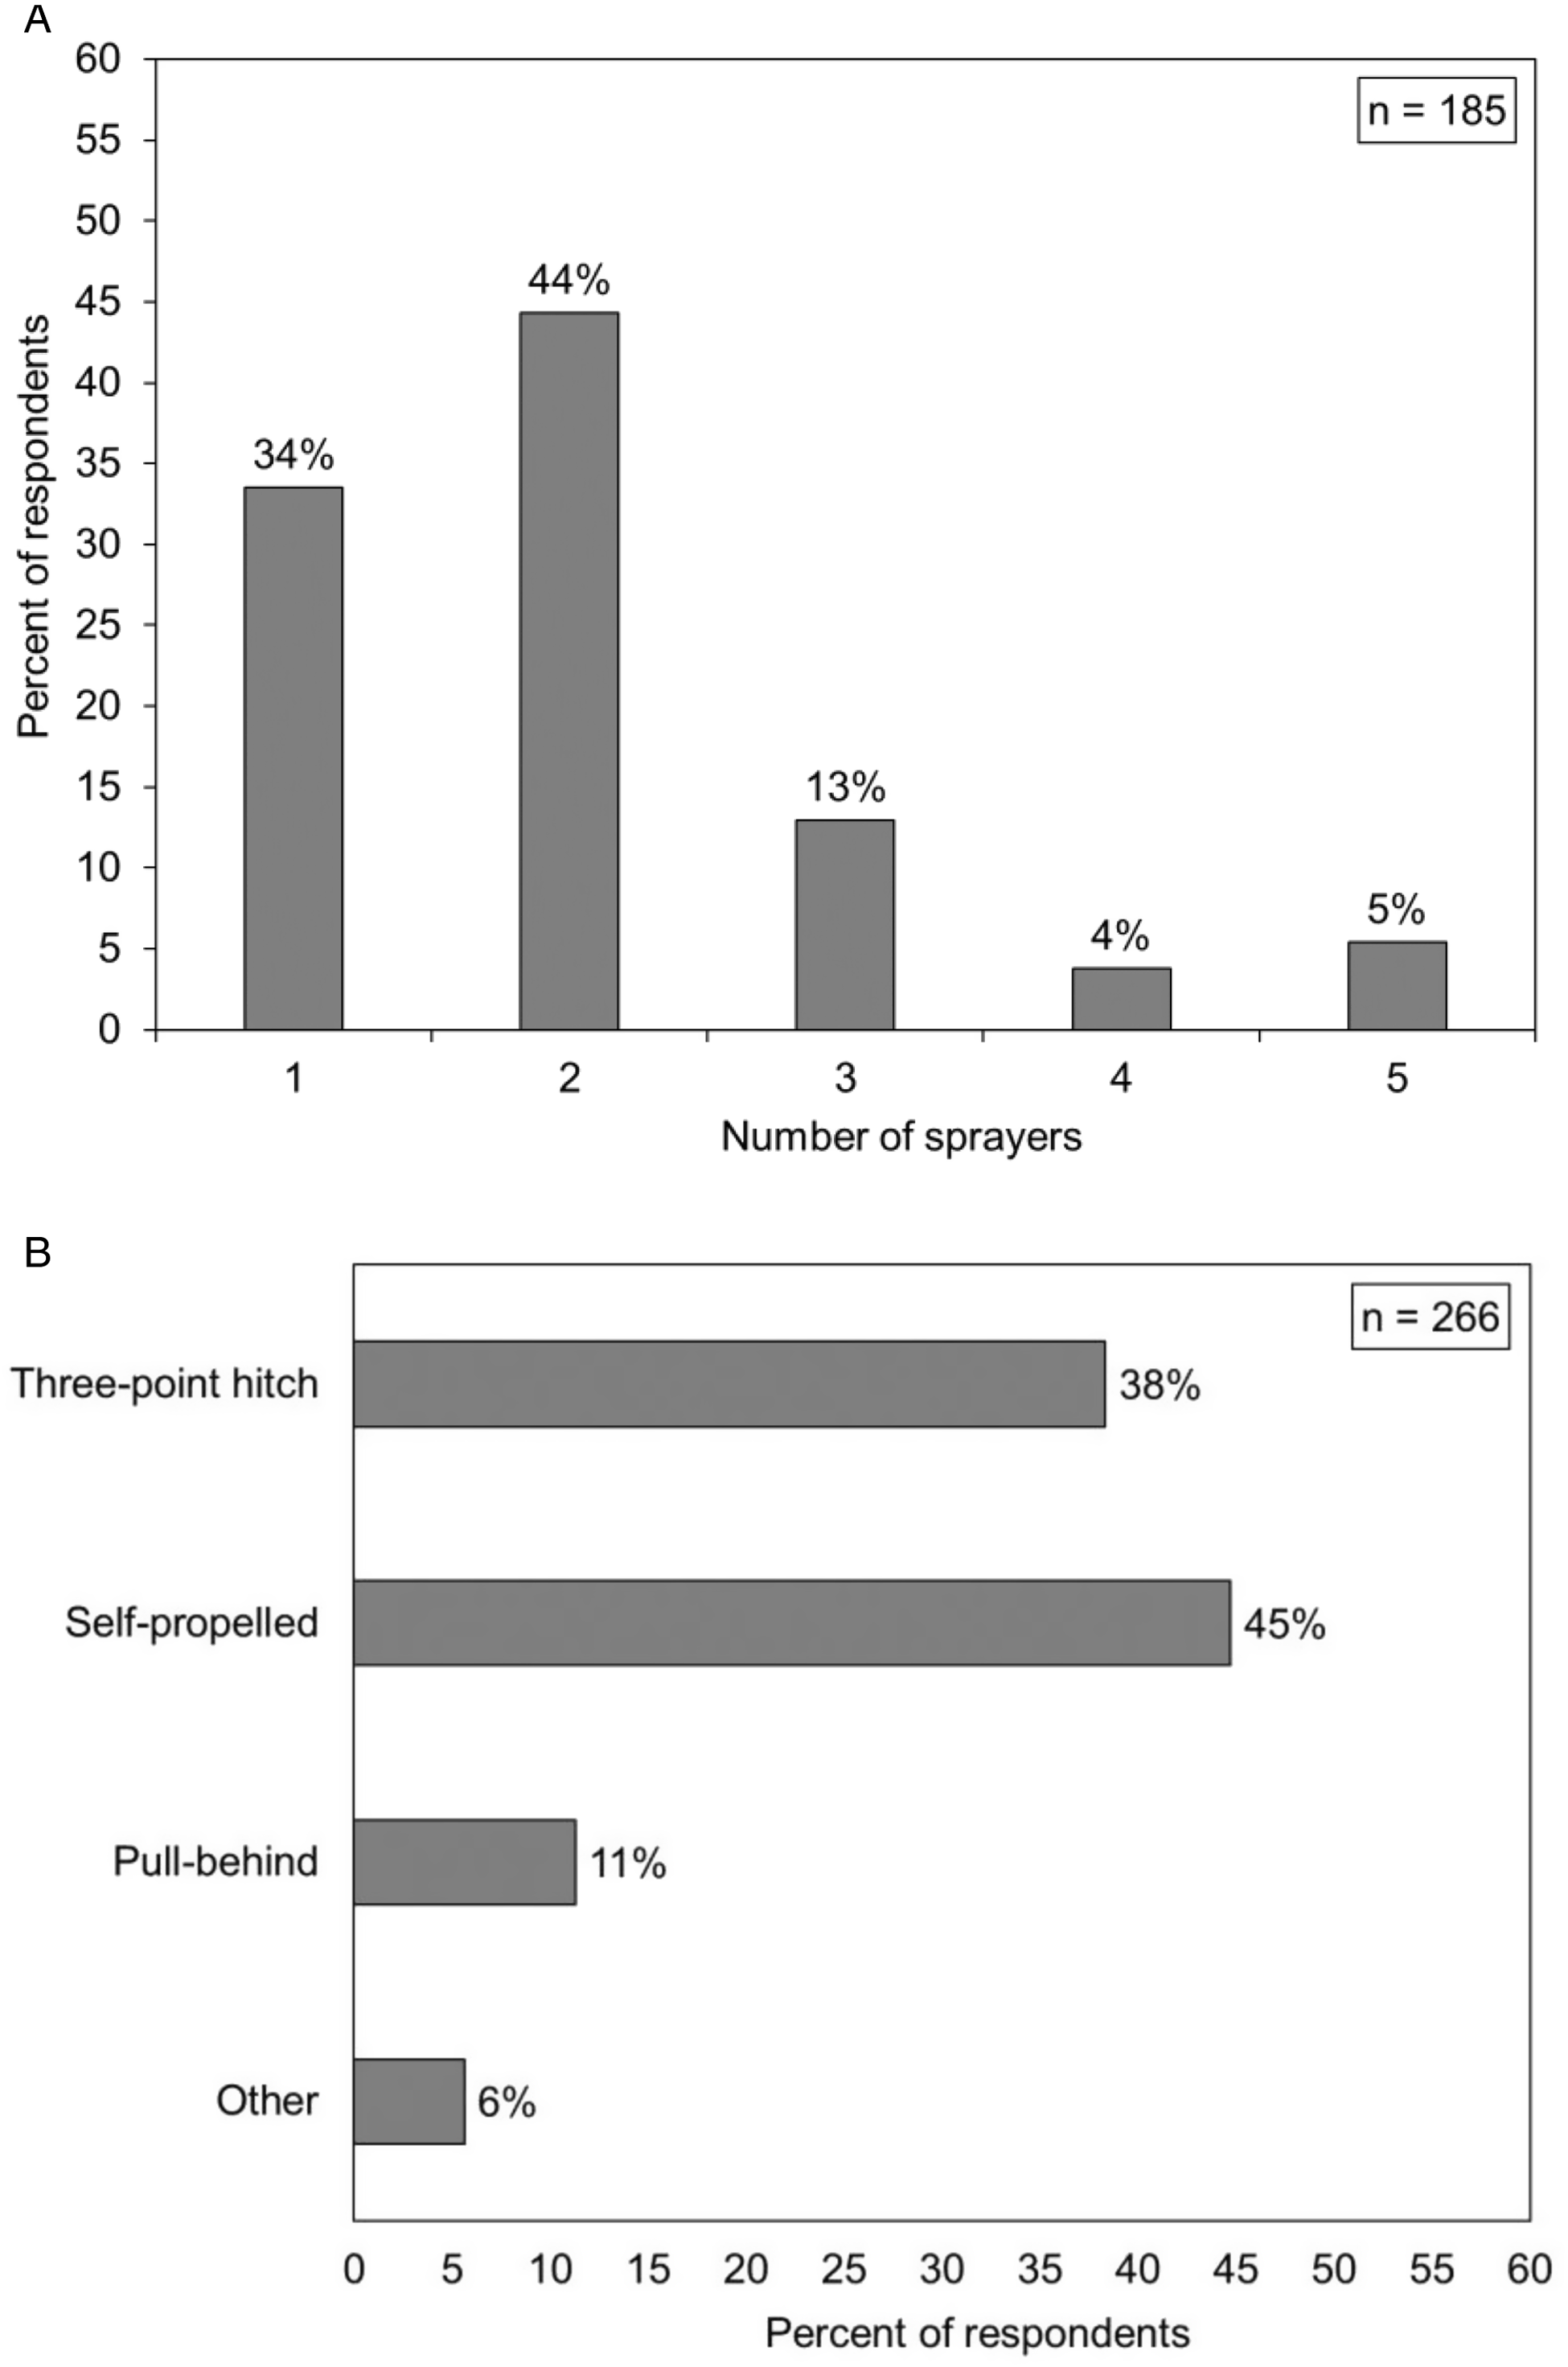
Due to the variety of agricultural crops grown in Georgia, many different types of spray equipment for applying pesticides are used in the state. Growers were asked about the number and type of sprayers they used for pesticide application purposes. Of the 185 responses received for this question, approximately 44% indicated they used two sprayers to apply pesticides on the farm, and 22% indicated they used three or more sprayers (Figure 3A). Respondents selected self-propelled and three-point hitch sprayers as the most commonly used sprayer types, at 45% and 38%, respectively (Figure 3B). These results were somewhat expected because they are the two most common sprayer types used for pesticide applications in row-crops. Pull-behind and specialty sprayers such as air blast and spot sprayers, commonly used for pesticide applications in orchard and hay production, were also among the other sprayer types listed by survey respondents.
(A) Number of sprayers and (B) sprayer type used on the farm by survey respondents in Georgia. Multiple responses were allowed for the information presented in Figure 3B.
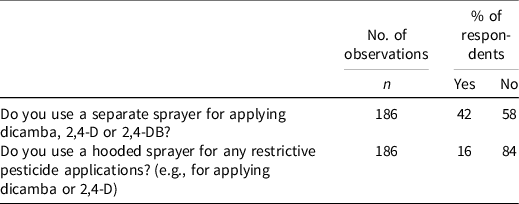
Georgia is the second largest producer of cotton in the United States, and thus Georgia growers rely extensively on use of auxin herbicides for weed control in cotton production systems. Both dicamba (3,6-dichloro-2-methoxybenzoic acid) and 2,4-D (2,4-dichlorophenoxyacetic acid) are postemergence herbicides that are used to selectively control broadleaf weeds in many row crops including cotton. In 2020, dicamba and 2,4-D were used on 98% of the total planted cotton acres by Georgia growers (USDA-AMS 2020). The increased use of auxin herbicides throughout the season also increases the occurrence of accidental injury to sensitive crops such as peanuts (Grey and Prostko Reference Grey and Prostko2010). This injury can result from the off-target movement of pesticide particles from an application area onto a sensitive species nearby (Auch and Arnold Reference Auch and Arnold1978) and from improper sprayer cleanout before the next pesticide application (Grey and Prostko Reference Grey and Prostko2010). In Georgia, peanut is grown as an important rotational crop with cotton. To avoid any potential tank contamination issues, some growers prefer to use a separate sprayer—one for cotton and another for peanut—for all pesticide applications throughout the season. In response to a question about using a separate sprayer, 42% of the survey respondents said they use a separate sprayer for applying dicamba, 2,4-D, or 2,4-DB on their farm (Table 2). To mitigate spray drift concerns from auxin herbicides, use of in-row or broadcast hooded sprayers during pesticide applications is recommended as a practice that can considerably reduce the drift of spray particles to short distances downwind (Foster et al. Reference Foster, Sperry, Reynolds, Kruger and Claussen2018). Only 16% of survey respondents said they use a hooded sprayer for applying pesticides such as dicamba or 2,4-D when spray drift is a concern. The primary reason behind the low use of hood sprayers is probably associated with the challenges of operating them. Compared with open-boom sprayers, hooded sprayers must operate at a slower speed, and because a hood is attached to the boom it is difficult to change nozzles and repair possible plumbing issues during the pesticide application process.
Use of a separate or hooded sprayer for restrictive pesticide applications as reported by survey respondents.
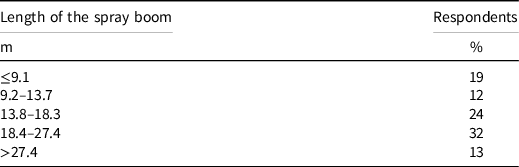
Currently, there is a general trend toward the use of larger application equipment equipped with wider spray booms to cover more hectares and improve field efficiency. New sprayers with wider boom lengths of 27.4 and 36.6 m are currently being offered as standard options by equipment manufacturers and are also becoming more common on farms. Due to greater speeds of larger spray machinery (19.3 to 25.7 kph) and excessive swing/bounce associated with wider booms during application, there is higher potential for off-target applications. Knowledge of sprayer boom length helps in development and inclusion of appropriate information in educational trainings for growers or Extension agents. To assess the application equipment size in Georgia, survey respondents were asked about the length of the spray boom on their pesticide application equipment and multiple choices were allowed. Based on the 221 responses to the question, sprayers with boom lengths in the ranges of 13.8 to 18.3 m and 18.4 to 27.4 m were most common on the farms (Table 3). Approximately 31% of survey respondents reported using sprayers with boom length of ≤13.7 m, whereas larger sprayers with boom lengths >27.4 m were less common and used by only 13% of respondents.
Length of the sprayer boom as reported by survey respondents (n = 221). Multiple choices were allowed.
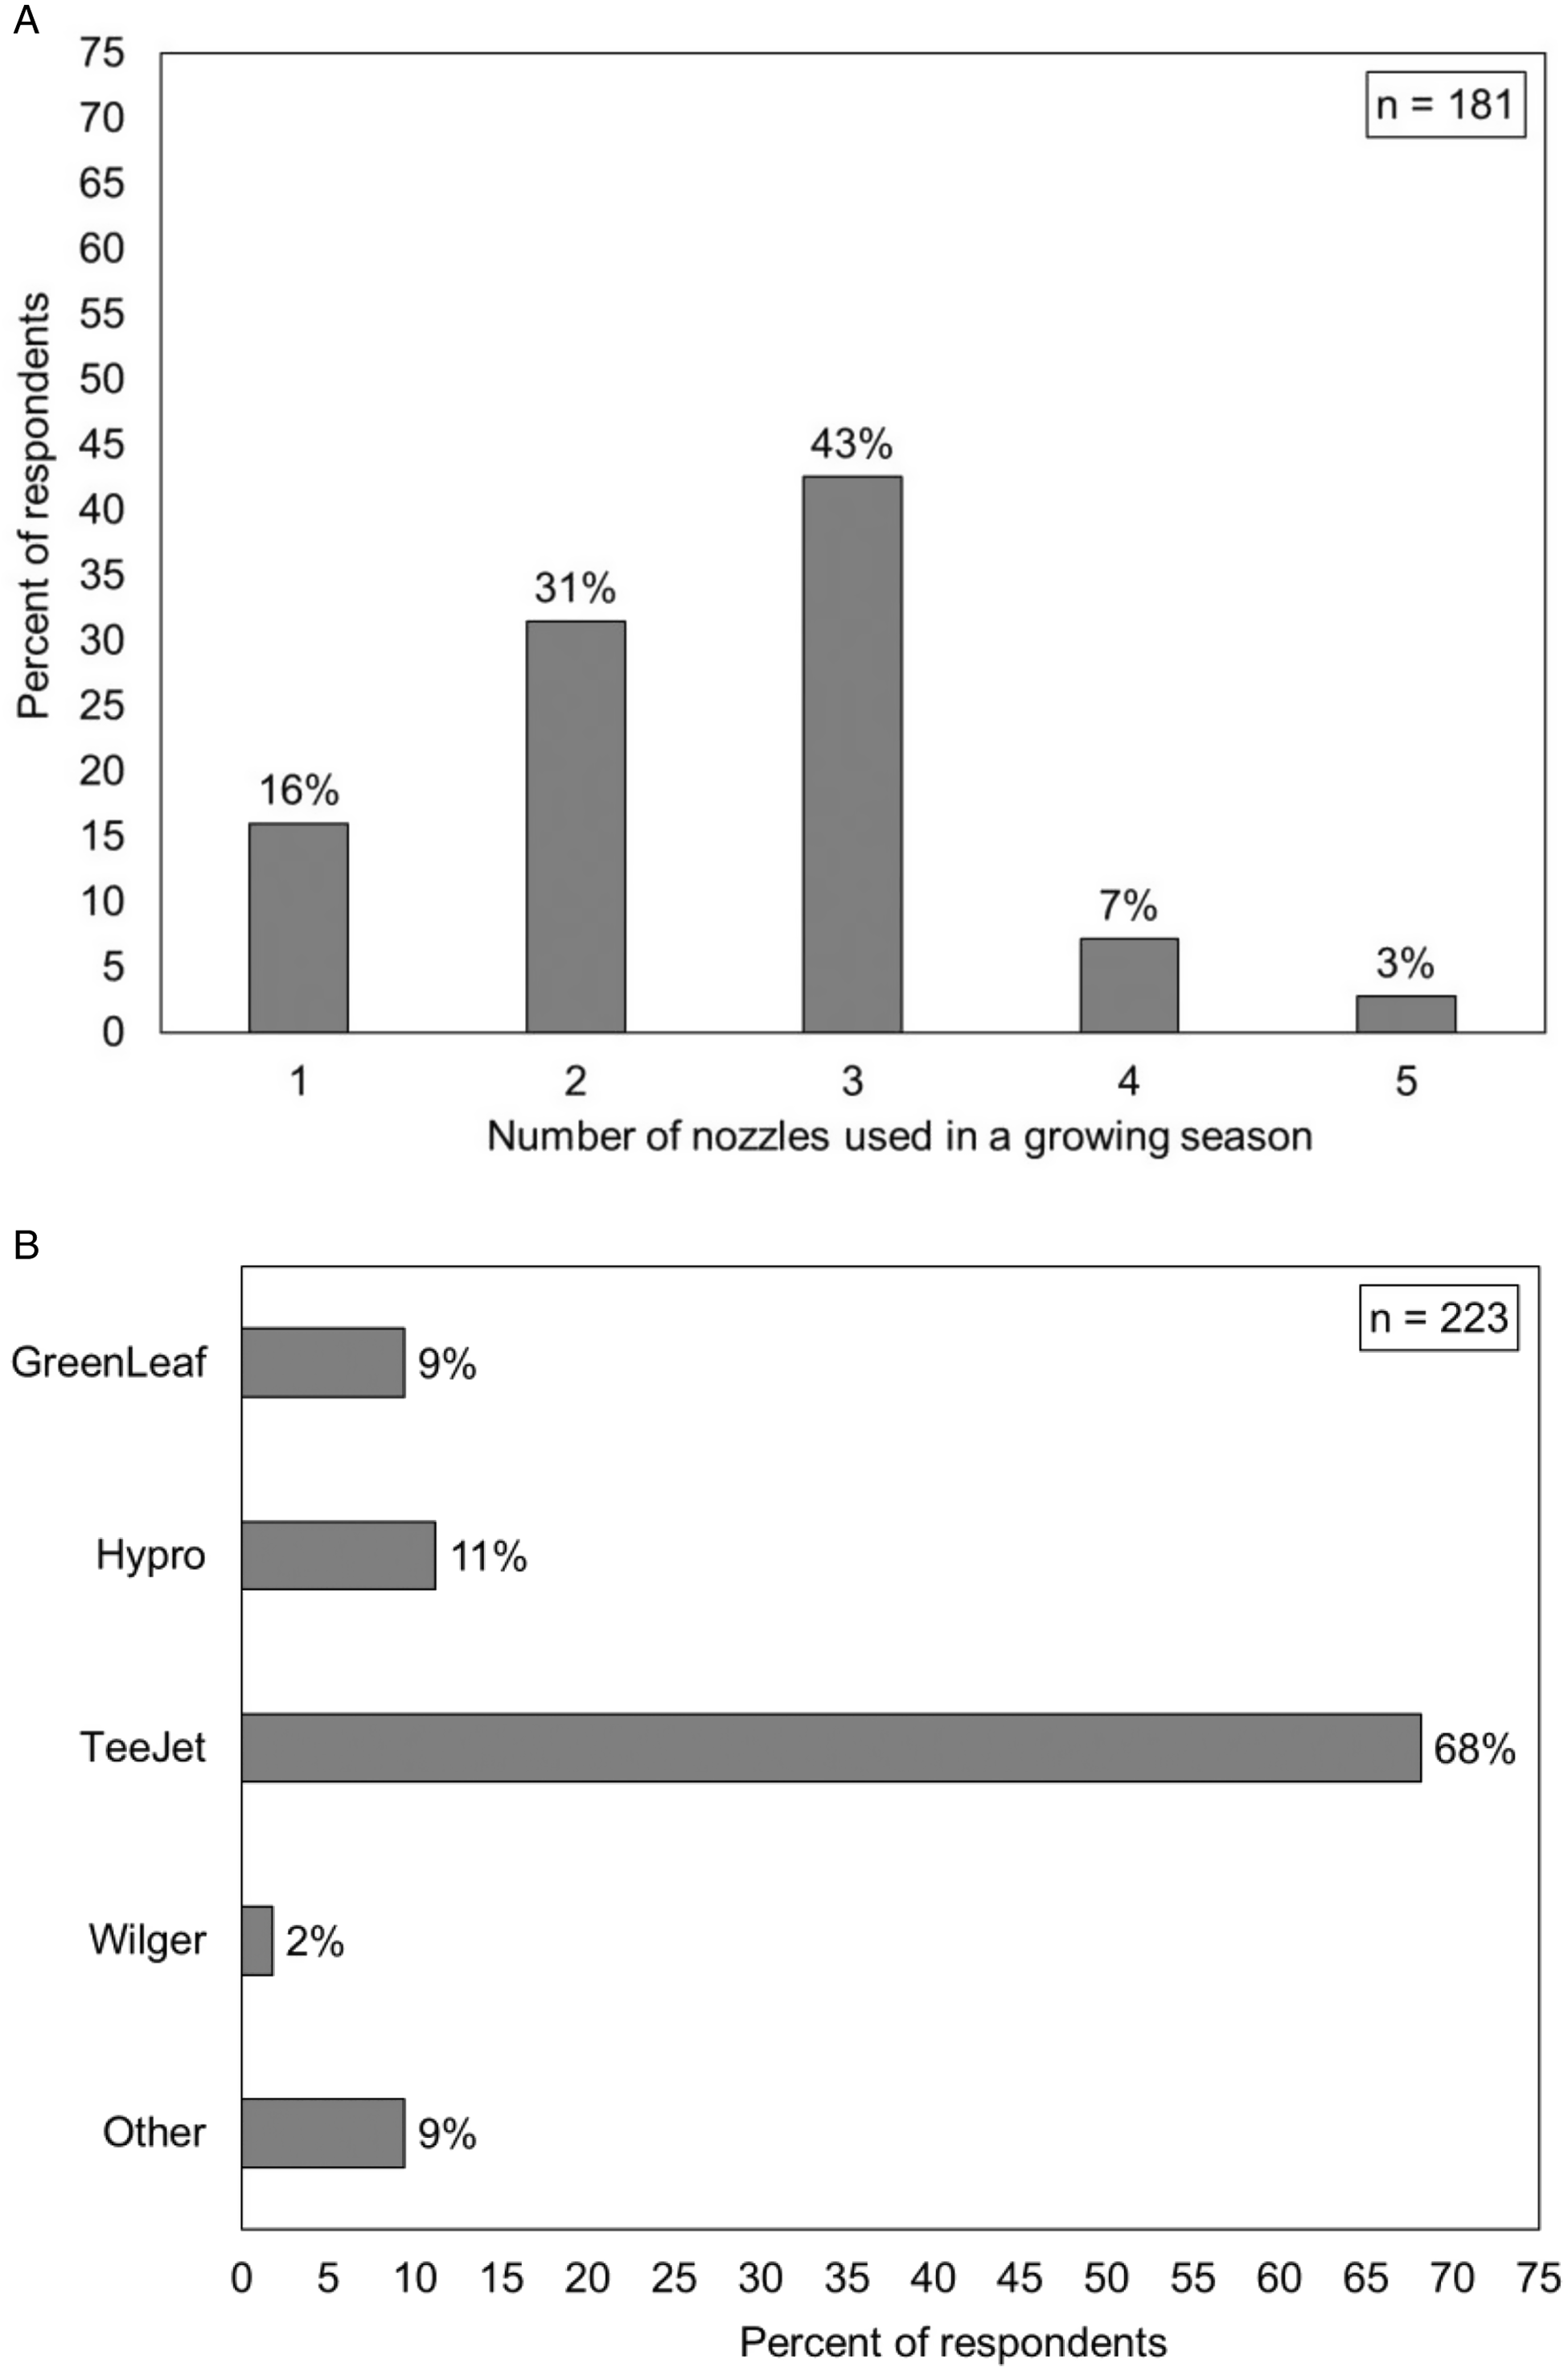
Nozzle selection is an important aspect of pesticide application because it can influence spray coverage, product efficacy, and spray particle drift. Nozzles that produce finer particles are desired for applying contact pesticides in order to attain adequate coverage and efficacy (Etheridge et al. Reference Etheridge, Hart, Hayes and Mueller2001), whereas nozzles that produce larger droplets are more suited for applying systemic pesticides, especially when drift control is a priority (Creech et al. Reference Creech, Henry, Fritz and Kruger2015). Georgia growers typically use both contact and systemic pesticides for pest control throughout the season in agricultural crops; however, changing nozzles between crops or products is not a common practice. A survey question asked growers about the number and type of nozzles (e.g., standard flat-fan, air-induction, or flood jet based on the type of the application and/or product) they typically use in a growing season. Of the 181 respondents who answered this question, nearly 74% indicated using two or three different nozzle types in a growing season (Figure 4A). Sixteen percent of the respondents used only one nozzle, while 10% said they use four or more nozzle types in a single growing season. Collectively, these results suggest that most growers know the importance of selecting the correct nozzle to maximize the pesticide efficacy, and to either change nozzles or to use multi-nozzle bodies that can make switching between nozzles relatively easier and quicker during the season. Nozzles manufactured by TeeJet® Technologies (Springfield, IL) were the most commonly used, followed by Hypro (Pentair, Minneapolis, MN), GreenLeaf Technologies (Covington, LA), and Wilger Industries Ltd (Saskatoon, SK, Canada; see Figure 4B). Other nozzle types reported by survey respondents included flood nozzles or nozzles for boomless sprayers that are typically used for pesticide applications in orchards or forages.
(A) Number of nozzles used in a growing season and (B) nozzle type/manufacturer used by survey respondents in Georgia. Percentages may not total 100% due to rounding.
Application Parameters
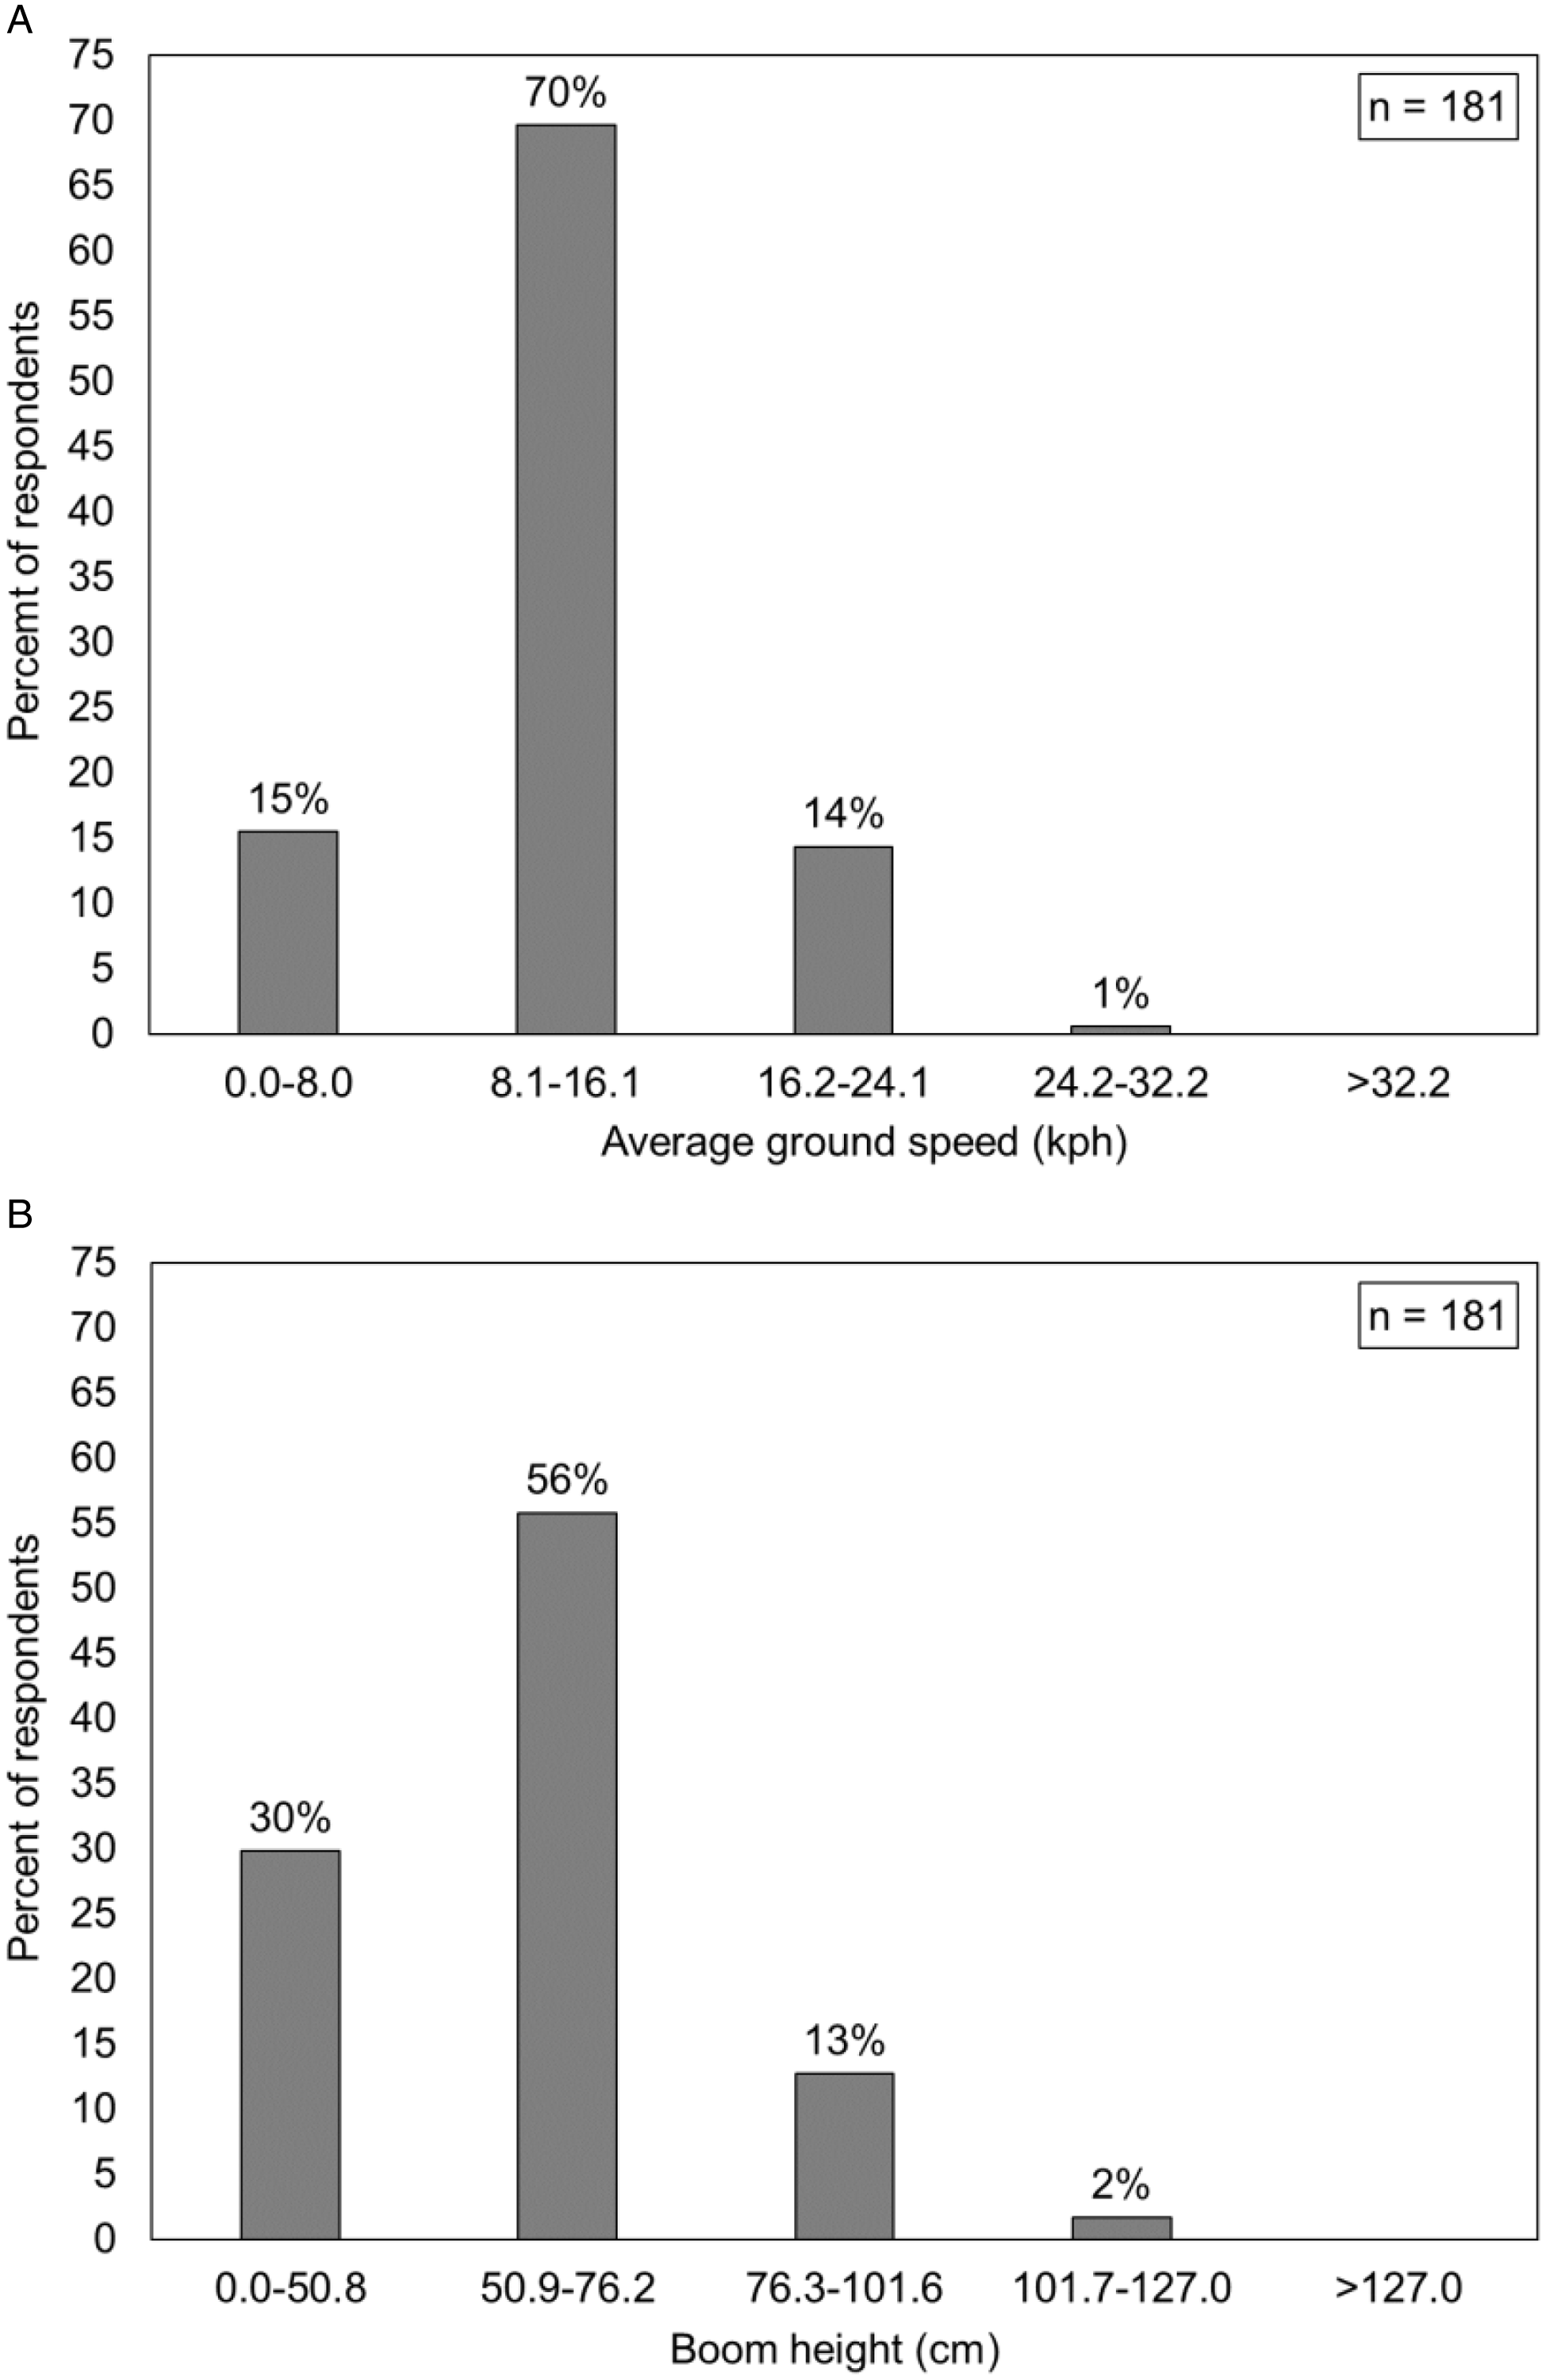
The availability of larger spray equipment has led to an increasing trend toward higher application speeds to cover more hectares quickly. While a higher application speed can reduce the total time spent in the field, it could also lead to reduced coverage due to inefficient application and/or increased potential for off-target movement of spray particles (Van de Zande et al. Reference Van de Zande, Stallinga, Michielsen and Van Velde2005). Survey results indicated that 85% of respondents apply pesticides at ground speeds of ≤16.1 kph, while only 1% indicated they have applied pesticides at >24.1 kph (Figure 5A). The height of the spray boom can also affect both application uniformity and spray drift. Ideally, a boom height of 50.8 to 61.0 cm from the soil surface or crop canopy is recommended for optimum coverage and for mitigating spray drift during pesticide applications. In response to a question about boom height, 30% of survey respondents said they used a boom height of ≤50.8 cm, while 56% said they used a boom height between 50.9 and 76.2 cm to apply pesticides (Figure 5B). Only 15% of respondents said they used boom heights >76.2 cm from the crop or soil surface. These results indicate that growers are generally aware of application inefficiencies associated with increased ground speeds and higher boom heights, so they tend to follow best management practices for those factors in making uniform and efficient pesticide applications. These results indicate that growers who attend regular Extension meetings are in general more aware about the importance of correct application parameters than growers who may not implement recommendations provided in information from university extension services.
(A) Average ground speed and (B) boom height for pesticide applications in Georgia as reported by survey respondents. Percentages may not total 100% due to rounding.
Because general application practices or selection of spray parameters can differ between the type of pesticides, the survey asked questions about other application parameters (spray volume, nozzle size, spray pressure, and droplet size) specifically for herbicides, fungicides, and insecticides. Survey results indicated that growers use spray volumes between 95 and 140 L ha−1 for most of the pesticides they apply (Table 4). Approximately 40% to 45% of respondents indicated they used spray volumes of 113 to 140 L ha−1 to apply herbicides and fungicides, whereas spray volumes of 95 to 114 L ha−1 were more common for insecticide applications. At least 10% of respondents also said they used higher spray volumes (169 to 196 L ha−1) for applying all pesticides. For nozzle size/color, the majority of the respondents indicated using a size 03 (blue) or 04 (red) nozzle regardless of the pesticide type. Nearly 10% to 15% of respondents were unsure about the size/color of the nozzle they typically use. This is interesting but also concerning because information on nozzle type and size is considered critical for making accurate and efficient pesticide application decisions. One possible reason behind this could be that a small percentage of survey participants represented growers who besides using row-crop sprayers also use specialty or spot sprayers in orchard and forage production, and may not pay as much attention to nozzle type or size as is usually needed to apply pesticides to row-crops.
Spray volume, nozzle size/color, spray pressure and droplet size used for pesticide applications as reported by survey respondents. Percentages may not total 100% due to rounding.
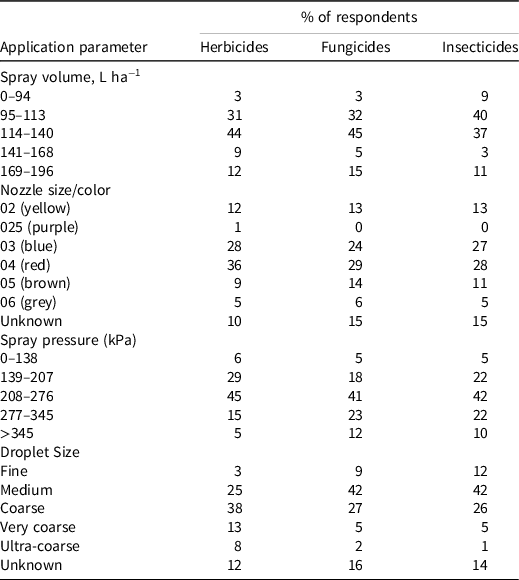
Another important application parameter is spray pressure because it affects volume and droplet size. Using a spray pressure below an optimal range can result in poor spray pattern, while higher pressures tend to produce fine sprays that result in increased spray drift potential (Nuyttens et al. Reference Nuyttens, Baetens, De Schampheleire and Sonck2007). Survey results showed that nearly 60% of survey respondents use spray pressures between 139 and 276 kPa for applying most pesticides. For fungicides and insecticides, adequate coverage within the crop canopy is also important for optimum pesticide efficacy, therefore approximately 32% to 35% of growers reported using higher pressures (>277 kPa) to apply these pesticides. Droplet size is another important spray parameter because smaller droplets can provide better coverage and efficacy (Etheridge et al. Reference Etheridge, Hart, Hayes and Mueller2001), but they are also more susceptible to spray drift. Similarly, larger droplets are less prone to drift but their efficacy is decreased if adequate coverage is not achieved (Spillman Reference Spillman1984). When asked about the droplet size, nearly 50% to 54% of respondents who said they use fine or medium droplets for fungicide and insecticide applications, compared to only 28% of respondents who said they use fine or medium droplets to apply herbicides. Similarly, about 51% of respondents said they use larger droplets (i.e., coarse to ultra-coarse) to apply herbicides, and they mostly do so to reduce spray drift. Similar to the responses regarding nozzle size/color, only 12% to 16% of respondents were unsure about the droplet size they use to apply pesticides, which is again concerning given the importance of using an optimal droplet size in effective pesticide applications. It is also possible that some of these may be used for specialty applications at higher spray volumes and pressures that do not require any specific droplet size.
Overall, the survey results imply that respondents are mostly aware of the importance of selecting correct application parameters (spray volume, nozzle size and type, spray pressure, and droplet size) specific to the type of pesticide for maximizing product efficiency and efficacy while also understanding the implications of off-target applications on crops and environment. However, the lack of knowledge of nozzle type and/or droplet size among some respondents, regardless of the sprayer type and crop, also suggests the need to continue educational efforts to improve growers’ knowledge about selection and use of optimal application parameters for applying pesticides safely and efficiently.
Application Technologies and Benefits
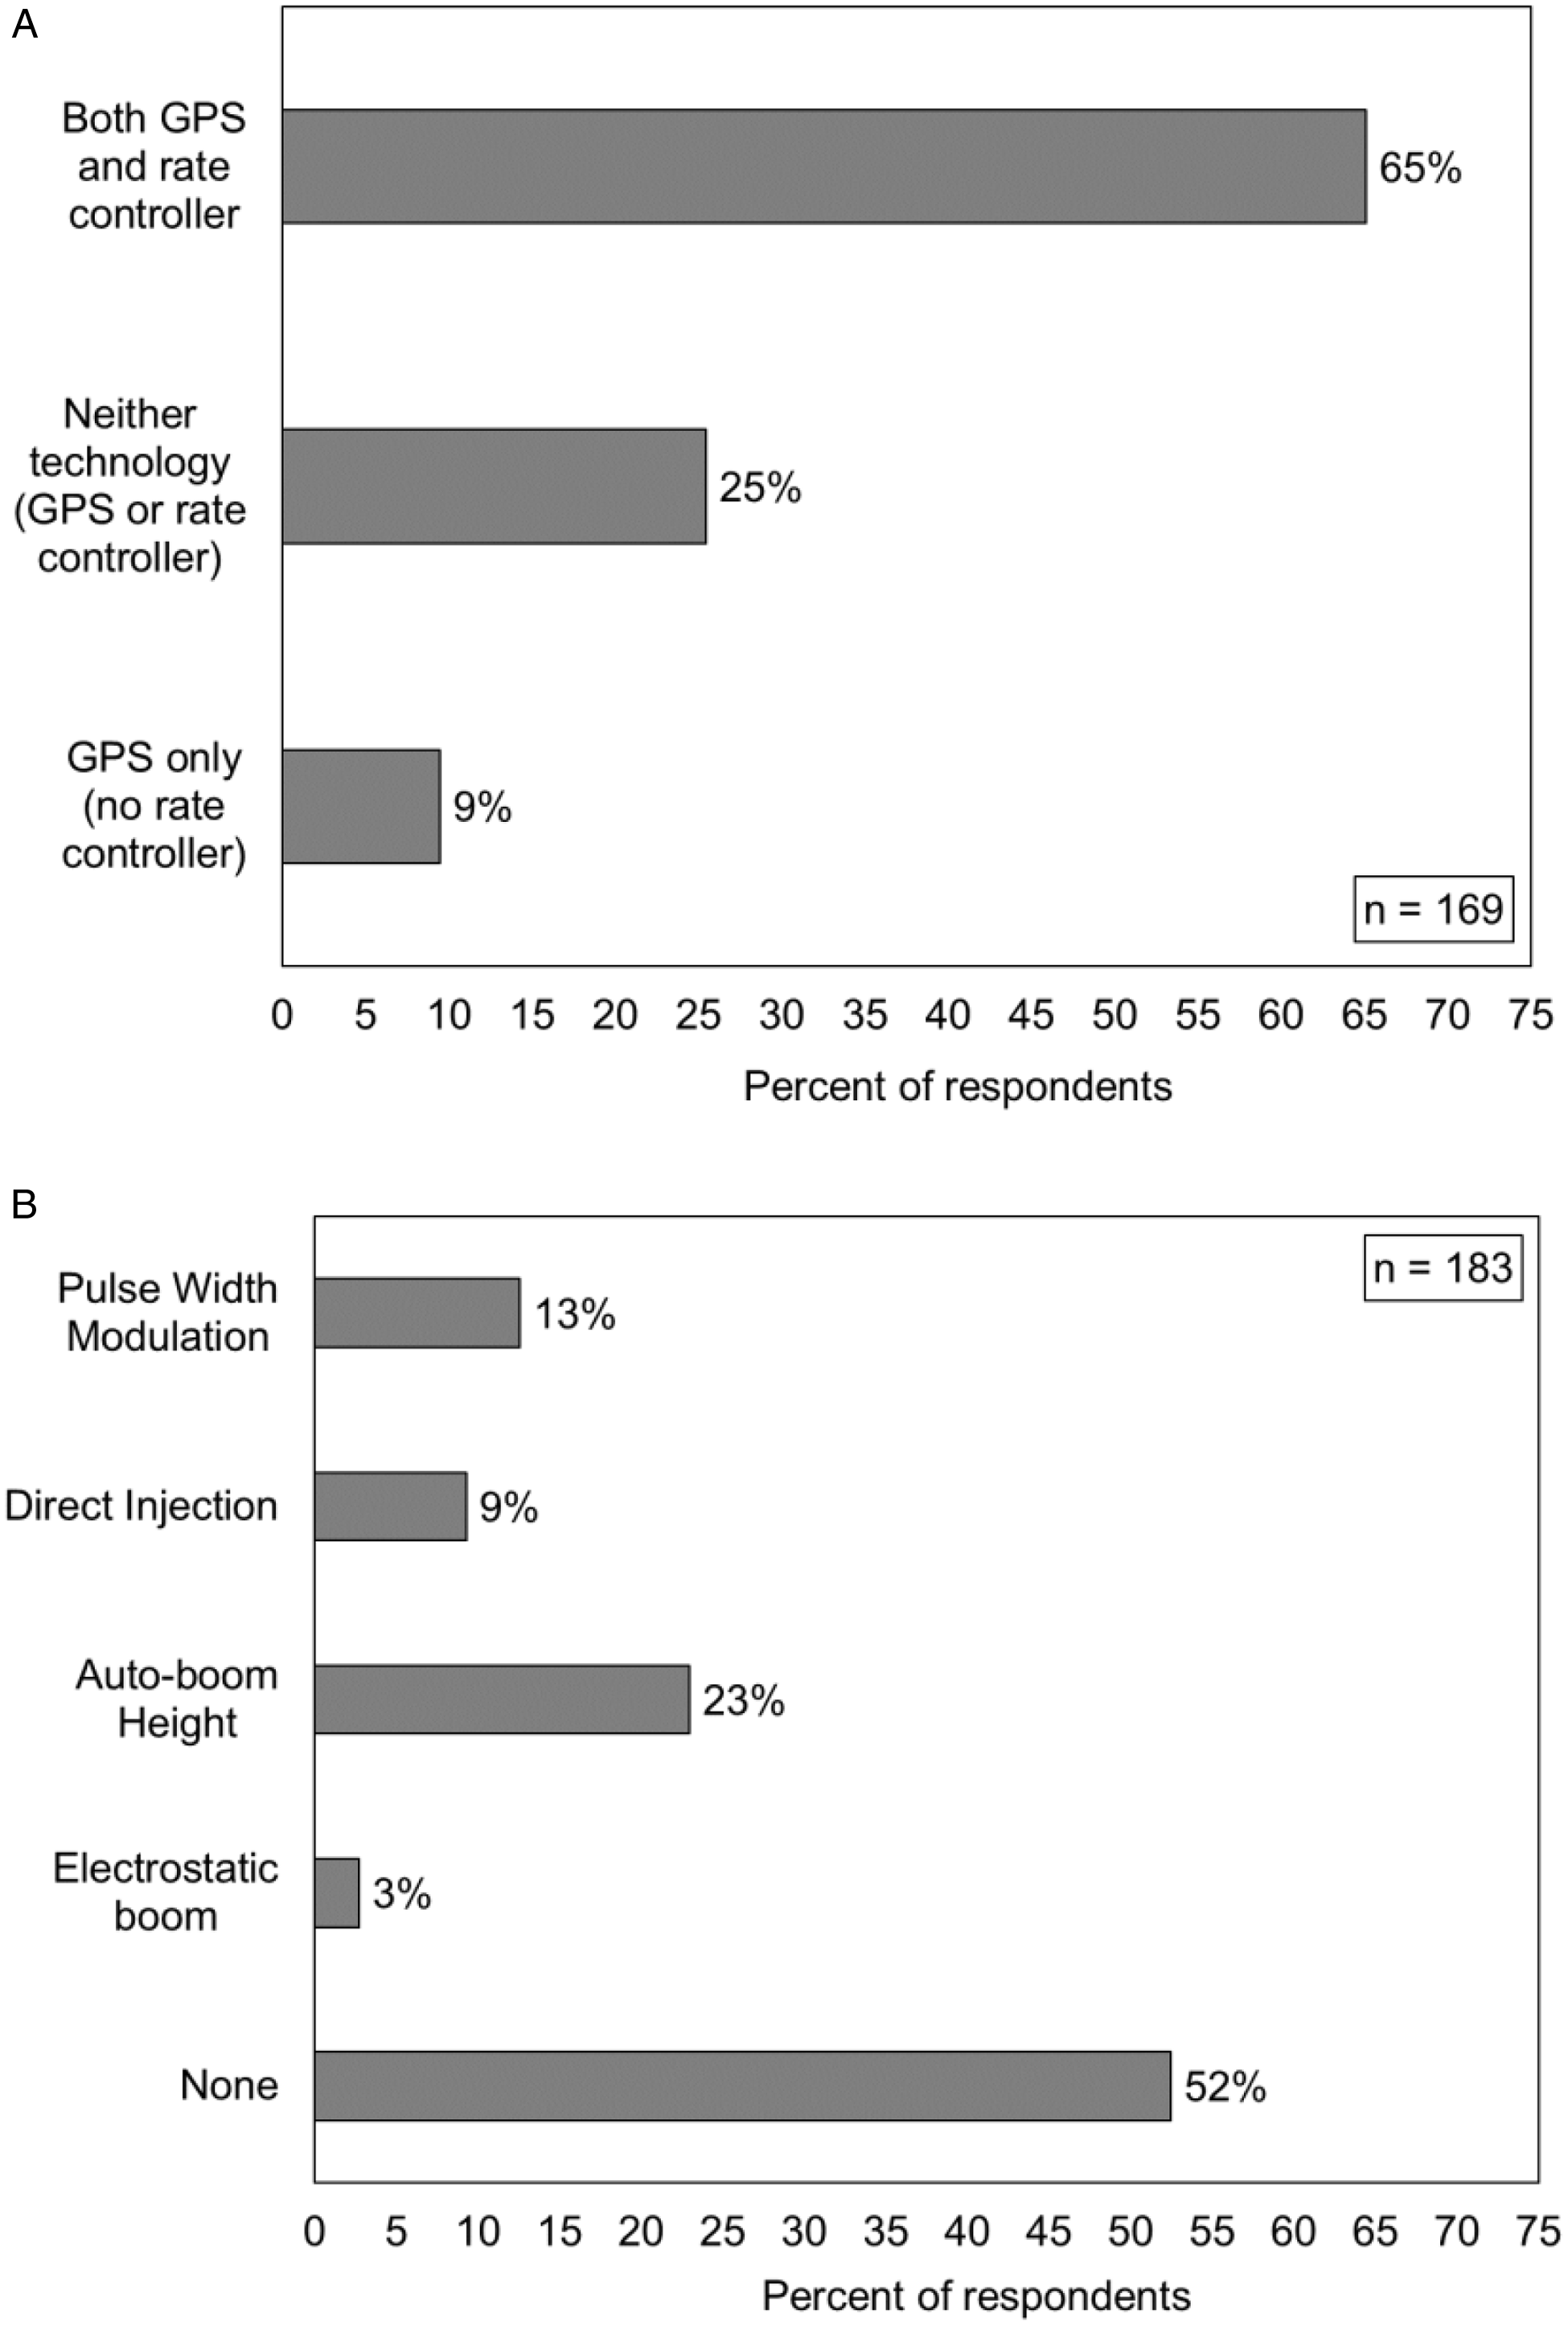
Application technologies are becoming more common on both commercial and specialty sprayers today as the interest in improving application accuracy and efficiency continues to increase among the industry and growers. One of the survey questions asked about the use of GPS or rate controllers on their sprayers when applying pesticides. Of the 169 responses to the question, 65% of respondents indicated using both GPS and rate controller on their sprayers, whereas 9% of the respondents reported using a GPS but no rate controller (Figure 6A). Previous research (Luck et al. Reference Luck, Zandonadi, Luck and Shearer2010; Sharda et al. Reference Sharda, Fulton, McDonald and Brodbeck2011) has demonstrated the benefits of these basic technologies, thus it was an interesting find that 25% of respondents indicated they didn’t use any of these technologies on their farm. Advanced spray technologies such as PWM and direct injection systems are also now being offered on new equipment or as a retrofit option, and adoption among growers has increased, especially in the midwestern United States. In response to a question regarding the use of new application technologies, 23% of the respondents (n = 183) indicated using auto-boom height technology, 13% reported using PWM technology, and 9% reported using a direct injection system on their sprayers (Figure 6B). Use of electrostatic boom/sprayer was not very common, with only 3% of respondents indicating having used it for pesticide application purposes. Fifty-two percent of respondents said they did not use any advanced spray technologies. These results suggest that adoption and use of both basic and advanced spray technologies can be improved among Georgia growers by promoting the various available technologies and by demonstrating their benefits through hands-on trainings and workshops.
Use of (A) global positioning system (GPS) and/or rate controller, and (B) other precision spray technologies by Georgia growers as reported in a 2021 survey. Percentages may not total 100% due to rounding.
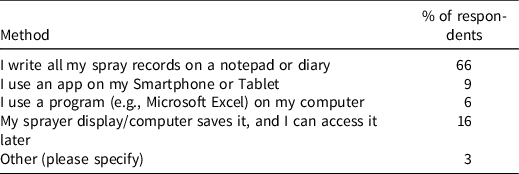
To ensure proper and safe use of pesticides on agricultural farms, all private pesticide applicators, including growers, are required by law to keep records of their federally restricted use pesticide applications for a period of 2 yr. Most growers also use those records to manage their spraying schedule and to make future management decisions. Pesticide applications can be recorded using any format, such as handwritten notes or with computer software as long as all the required information related to the pesticide application is logged, including product name, Environmental Protection Agency registration number, total amount applied, application date, location, crop, size of the area, and name and certification of the applicator (USDA-AMS 2021). Survey participants were asked to indicate their preferred methods of recording pesticide application records. Results indicated most growers (66%) use a traditional method of writing records on a notepad or diary to log their pesticide application information, while only a few growers (15%) indicated using a smartphone application (app) or a computer program (e.g. Microsoft Excel) to log their pesticide records (Table 5). These smartphone or computer apps range from a simple note-keeping app such as Evernote or Google Sheets, to dedicated farm data management apps such as Farm Logs or Climate FieldView. These results were surprising because smartphones or tablets are becoming more common among growers today, and numerous apps are available for free or at low cost for the purpose of maintaining farming logs. These findings suggest that either most growers may not be aware of the various electronic or digital applications available for logging pesticide records or they may not find these applications user-friendly or useful. Currently, most in-cab sprayer displays/computers can also record application data that can be accessed later, although some of the required pesticide and application information needs to be manually entered before spraying. One of the main benefits of these records is the availability of as-applied data, which can be used for verifying and showing record of the actual product rates applied across the field, as well as other additional information, including total product applied, area covered, and ground speed for the application. When equipped with advanced capabilities, some of the newer spray technologies today can also monitor and log other useful parameters such as boom height, droplet size, wind speed and direction, and air temperature. Only 16% of the respondents responded indicated using a sprayer display/computer to log pesticide records. A few survey participants (3%) also indicated they use other methods such as writing on a calendar or using “home-made” charts on paper to record when they apply pesticides.
Pesticide application recording methods reported by survey respondents (n = 196).
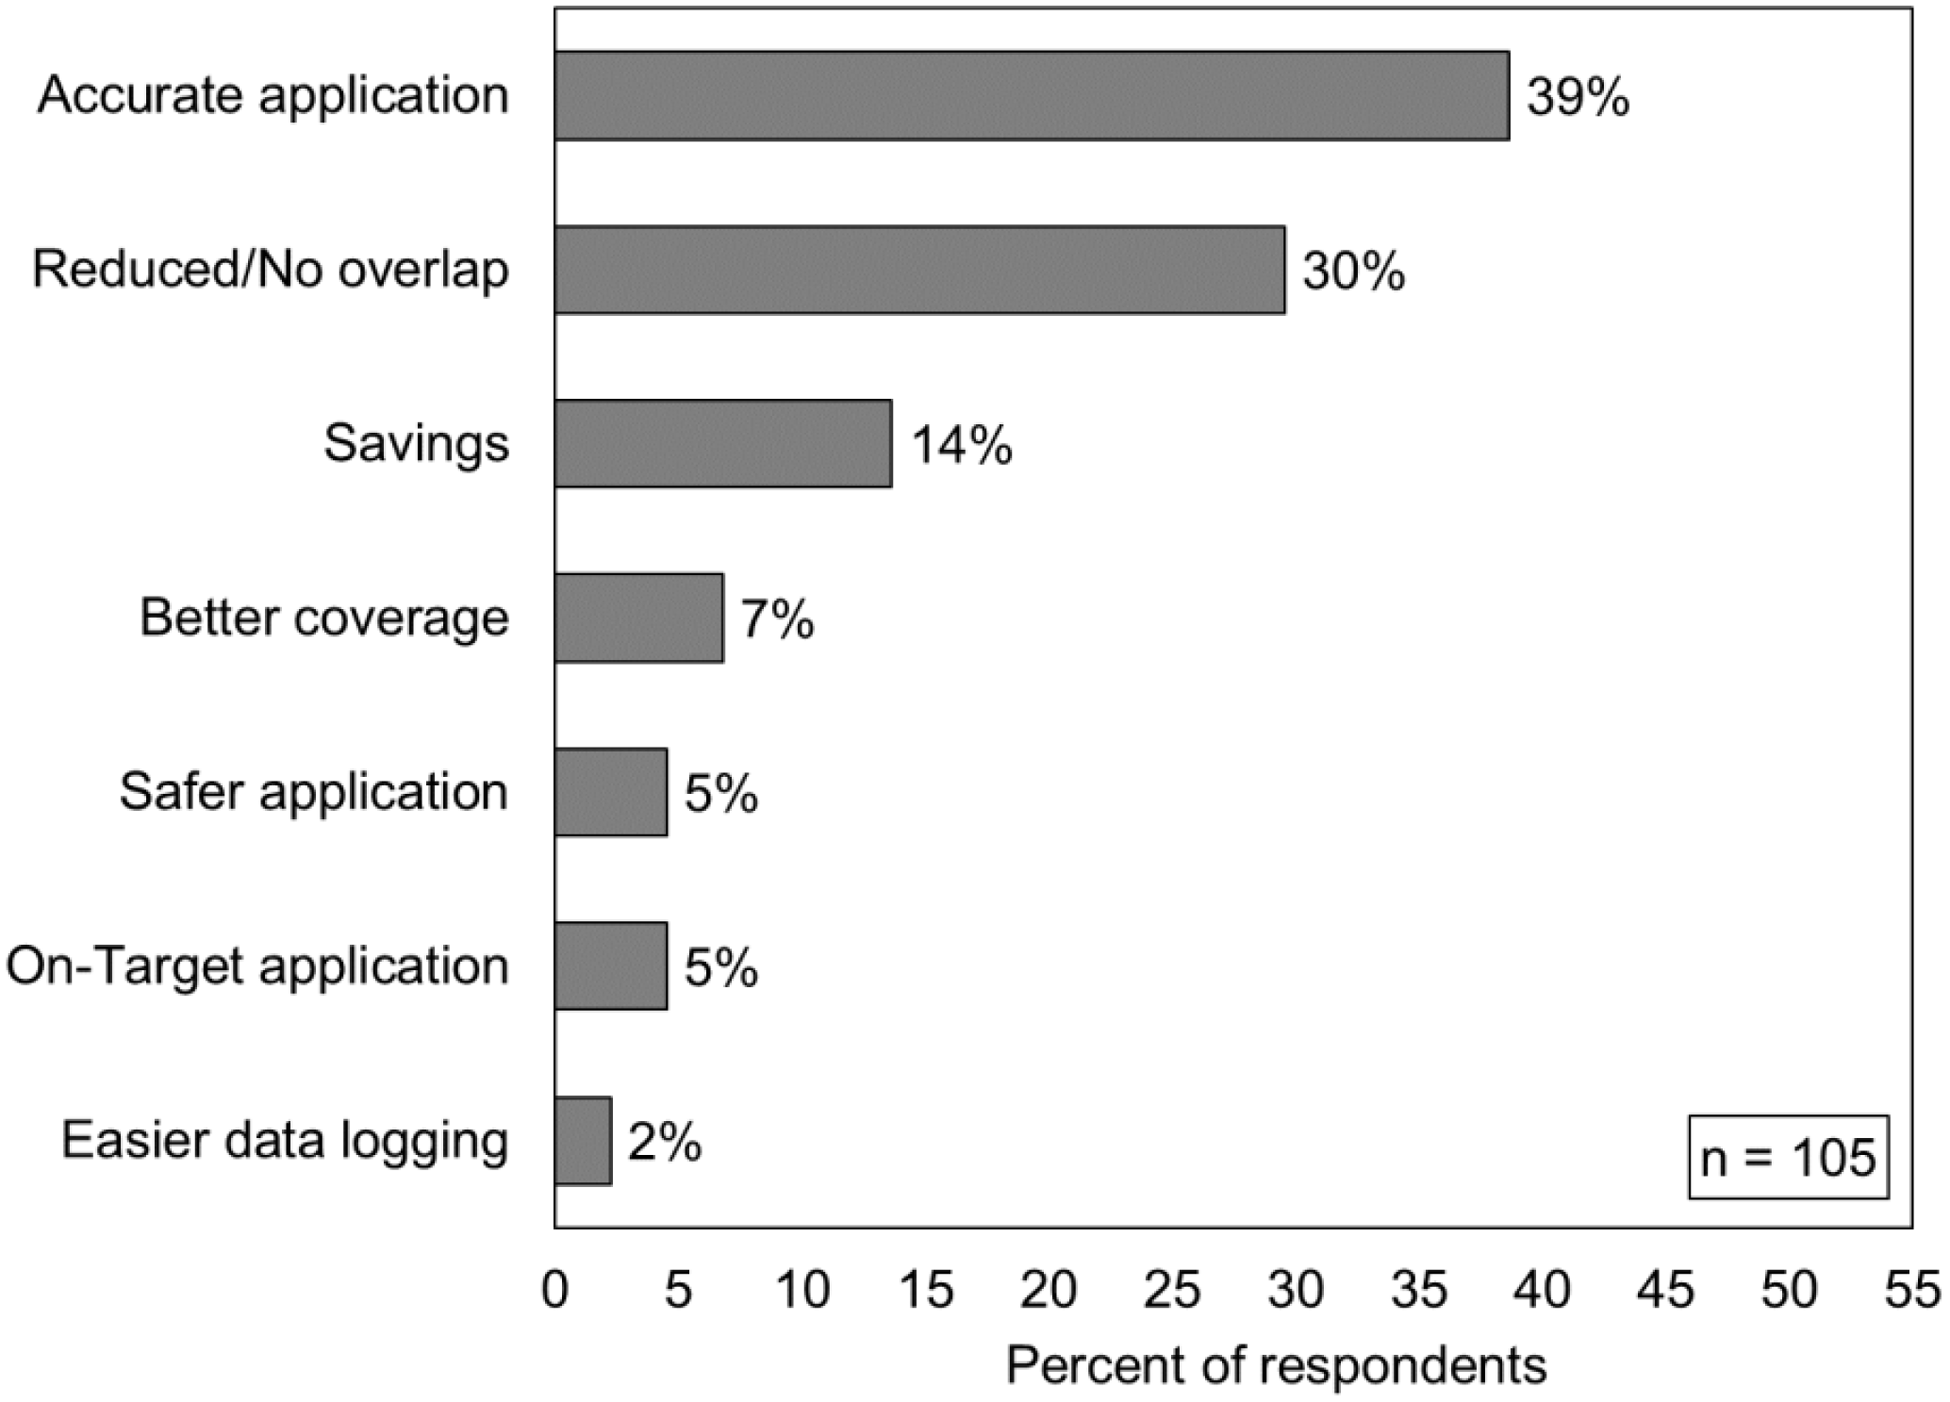
The last question in this section asked survey participants to provide an opinion to the open-ended question “According to you, what is the biggest advantage of using application technologies when making pesticide applications?” A total of 105 responses were received, which were summarized into seven distinct one- or two-word descriptors as listed in Figure 7. According to respondents, the three biggest benefits of using application technologies were accurate application (39%), reduced/no overlap (30%), and cost savings (14%). It is interesting to note that these three benefits are all related to each other because accurate applications help in reducing overlap or over-application, which further results in cost savings. Better coverage (7%), safer application (5%), on-target application (5%), and easier data logging (2%) were also among the other technology benefits indicated by survey respondents. Although adoption of spray technology is moderately low to average across Georgia, growers who use these technologies understand their benefits in making efficient pesticide applications. Additionally, these growers can also help advance the adoption and use of technologies by sharing their experience and technology benefits with other growers. Previous research has shown that growers are more likely to adopt new technologies when they learn about their benefits from other growers who were either early technology adopters and/or have benefitted from certain technologies in their own farming operations (Tey and Brindal Reference Tey and Brindal2012). Application technologies play an important role in ensuring safe and efficient pesticide applications, therefore, new developments and improvements in these technologies will likely continue in the future. However, to encourage more adoption and effective use among growers, it is important for industry to make these technologies simple, affordable, and easy to use, and for educators to develop programs and modules to effectively train and educate growers on the operation and benefit of these technologies.
Benefits of spray technologies as reported by Georgia growers in a 2021 survey. Results reported here are based on a word frequency analysis of responses. Percentages may not total 100% due to rounding.
Application Challenges and Future Research
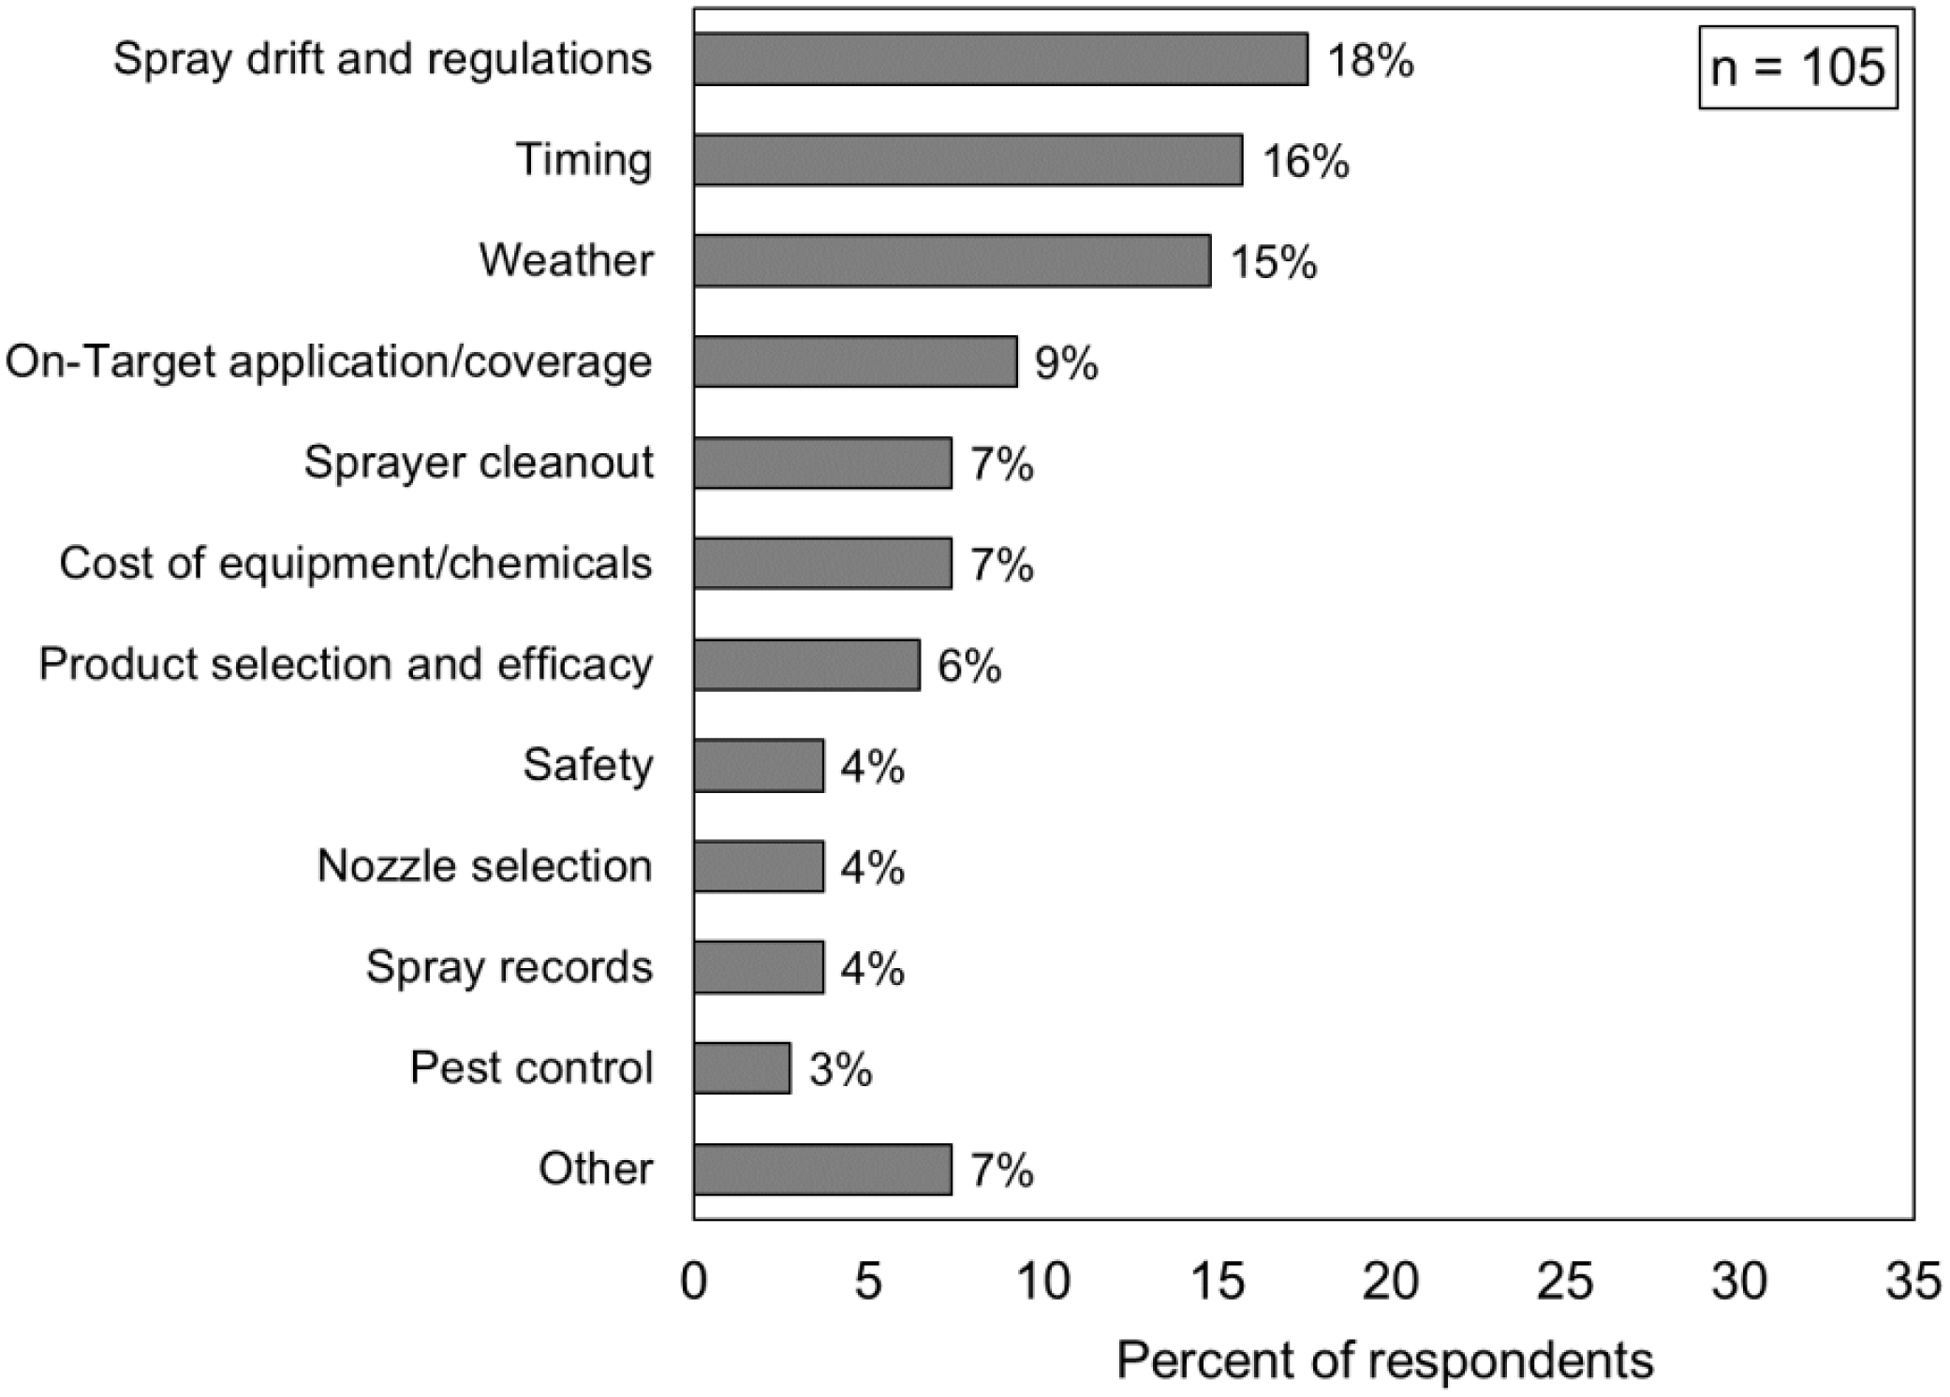
At the end of the survey, growers were asked two open-ended questions about the pesticide applications. The first question was, “What is your biggest challenge related to pesticide applications on your farm?” From a total of 105 responses, spray drift and regulations (18%), application timing (16%), and weather (15%) were the top three responses listed by the survey participants (Figure 8). With nearly 98% of the cotton producers in Georgia utilizing auxin herbicides such as dicamba and 2,4-D for weed control (USDA-AMS 2020), it was not surprising to see spray drift and application regulations at the top of the application challenges listed by the growers. Interestingly, spray drift, weather, timeliness, and regulations were also among the top challenges indicated by the pesticide applicators in Arkansas in a survey (Butts et al.Reference Butts, Barber, Norsworthy and Davis2021). As stated by Butts et al. (Reference Butts, Barber, Norsworthy and Davis2021), the authors also agree that spray drift and regulations are amongst the biggest challenges due to the increased focus on off-target movement of pesticides in recent years, which have brought more awareness among the applicators about the spray drift issues and pesticide regulations. Application timing was indicated as another big challenge possibly due to diversity of cropping systems and crop rotations utilized by the growers in Georgia. One of the primary factors likely adding to the timing issue is that peanut requires a very extensive fungicide program (6 to 8 applications throughout the season) and maintaining the planned spray schedule becomes difficult, especially for growers with considerable acreage in both cotton and peanut. Weather further influences application timing by creating conditions such as too wet field conditions or winds above 10 mph which are undesirable for making pesticide applications. Some of the other challenges indicated by survey respondents included on-target application and coverage (9%), sprayer cleanout (7%), cost of equipment/chemicals (7%), product selection and efficacy (6%), safety (4%), nozzle selection (4%), spray records (4%) and pest control (5%). Some less-common challenges mentioned only by few respondents were grouped under the category “other” and included topics such as application knowledge, sprayer calibration, small farm size, and urban invasion. While some of the challenges listed by survey respondents have also been reiterated by growers and Extension agents at various educational trainings and county meetings across the state, the survey also helped in bringing attention to other common but less noticeable challenges faced by the growers.
Challenges (identified from word frequency analysis) to pesticide applications as reported by Georgia growers in a 2021 survey.
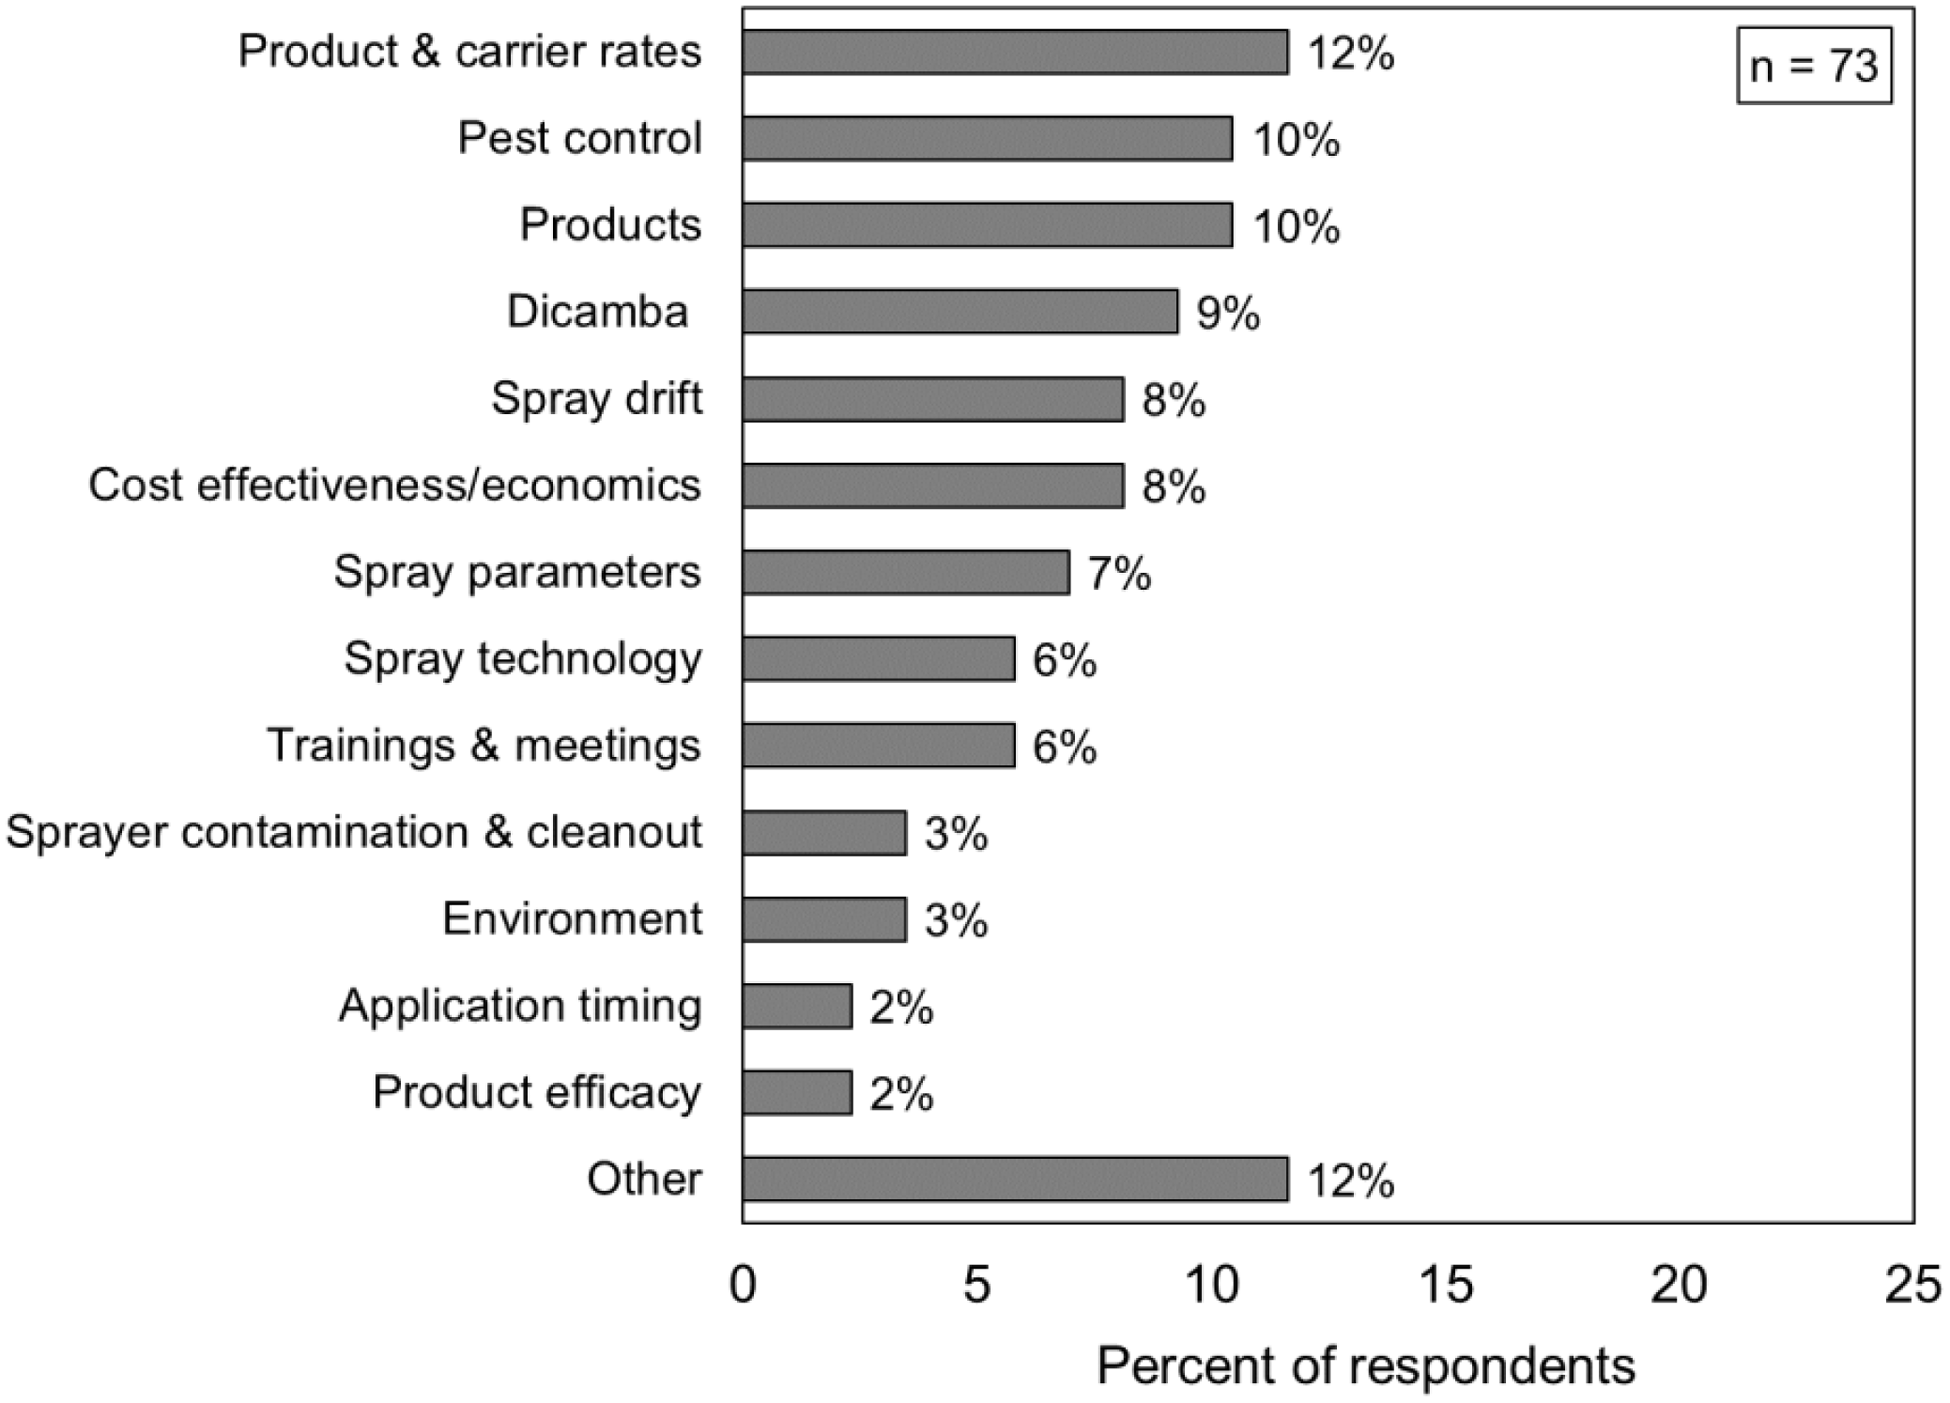
The second open-ended question was “What pesticide application research would you like to see University of Georgia conduct to address your applications issues or concerns?” Seventy-three survey participants answered this question, and individual responses were grouped and categorized into one or more of the 14 categories listed in Figure 9. Product and carrier rates (12%), pest control (10%), and products (10%) were the among the top three research categories based on the responses. Responses for product and carrier rates were related to both rate of the product (i.e., active ingredient and kilograms of active ingredient per hectare) and spray volume (i.e., liters per hectare) of the carrier, while the responses related to the products included information or data on different types of chemicals, adjuvants, crop oils, and surfactants. Responses for pest control mentioned research needed for the control of certain pests [stink bug (Halyomorpha halys), pigweed (Amaranthus spp.), armyworm (Spodoptera frugiperda), etc.], increasing pest resistance, and pest thresholds by crop. Other frequently mentioned responses included dicamba (9%), spray drift (8%), cost effectiveness/economics (8%), spray parameters (7%), and spray technology (6%). Again, it was not surprising to note that the terms “dicamba” and “spray drift” together (total 17%) were mentioned largely in the responses and the need for more research on different ways (nozzle type, droplet size, wind effect, ground speed, boom height, etc.) to safely apply chemicals while mitigating pesticide drift. With increasing chemical and application equipment prices, growers are also interested in obtaining information on the economic feasibility of continuing the use of different pesticide products and the number of applications, as well as learning about affordable equipment and technology options that can help in efficient pesticide applications. Some of the specific responses categorized under the “other” (Figure 9) category included “compiling all necessary pesticide information on a user-friendly cheat sheet”, “information on organic farming/weed control”, “deer control in soybeans”, and “information to assist small-scale farmers”. Overall, the responses from survey participants provided valuable information regarding the current research needs related to pesticide applications by Georgia growers. In response to this open-ended question, some growers also shared positive feedback on the usefulness of current Extension trainings and meetings conducted by the University of Georgia Extension specialists to share timely and relevant information on different topics related to pesticide application and technology.
Areas for future research in pesticide application and technology as reported by Georgia growers in a 2021 survey.
Survey respondents represented growers from 65 different counties in Georgia with 83% of the growers farming a total of 809 hectares or less. They prefer to receive information on pesticide application practices and technologies primarily through University of Georgia Cooperative Extension, agriculture industry, and consultants/salesperson. Self-propelled and pull-behind sprayers with boom lengths between 13.8 and 27.4 m were the most commonly used spray equipment, while some growers also used a separate sprayer for applying auxin herbicides. Most growers use two or more nozzles in a growing season, indicating adequate knowledge about the importance of proper nozzle selection for maximizing pesticide performance. A majority of growers indicated following best management practices by making pesticide applications at nominal ground speeds and using lower boom heights. Survey respondents also showed good understanding of the importance of other application parameters such using correct nozzle size and adequate volume to maximize coverage, canopy penetration and efficacy, and modulating spray pressure and droplet size by pesticide type. However, few growers (15%) also indicated the lack of knowledge on nozzle type and droplet size they used when applying a pesticide on their farm. Basic spray technologies (GPS and rate controller) are more common on the application equipment, while advanced technologies (PWM, direct injection, auto-boom height and electrostatic boom) are not widely adopted or used by Georgia growers. A majority of respondents said they prefer to manually write their pesticide records and identified accurate application, reduced overlap, and cost savings as the greatest benefits of new application technologies. Spray drift and regulations, application timing, and weather were identified as the major challenges to pesticide applications by respondents, whereas they also want future research on product rates, spray volumes, pest control, chemicals and adjuvants, spray drift, spray parameters and technology. Overall, these survey results help us to better understand the prevalent application practices and technologies in Georgia and to identify the common pesticide application challenges and research needs of growers. The information gained through this survey will be valuable for developing and implementing applied research and extension efforts to address growers’ challenges and needs related to pesticide applications and technology.
Acknowledgments
We thank the Georgia Cotton Commission, Georgia Peanut Commission, and University of Georgia Cooperative Extension agents for help with disseminating the survey to growers and encouraging them to fill it out. Additionally, we thank all the growers who took the time to complete this survey. The research received no specific grant from any funding agency, commercial. or not-for-profit sectors. No conflicts of interest have been declared.


 Open access

