1. INTRODUCTION
Inequality in Latin America, the most unequal region in the world, has its historical root in exclusionary institutions established in the Spanish colonial era and features a strong resilience towards different regimes and historical periods (De Ferranti et al. Reference De Ferranti, Perry, Ferreira and Walton2004; Walton Reference Walton2004). In particular, the distribution of education is a major determinant of the overall socio-economic inequality. As shown by Frankema (Reference Frankema2012), during the second half of the 20th century, educational inequality increased the vulnerability of distribution and welfare to skill-biased technological change and trade liberalisation in Latin America. Recent years have witnessed the proliferation of studies on inequality in Latin America, mainly economic inequality. However, due to the unavailability of data, especially micro-level data, pre-1980s inequality in Latin America is still under-studied, needless to say at a sub-country level. This status quo relates to a broader issue that economic historians lack knowledge of the social dimensions of Latin America's development over the 20th century (Astorga et al. Reference Astorga, Bergés and Fitzgerald2005, p. 770).
The 1980s were a watershed in Latin America's contemporary history. The import substitution industrialisation (ISI) prior to the 1980s and the neoliberal reform since the 1980s represented two ideologically distinct orientations and approaches towards socio-economic development, and were associated with strikingly different economic performances. Therefore, it is interesting to explore how education and its inequality developed prior to and since the 1980s, which serves as an investigation of the social impacts of the two distinct models. In particular, had Latin America's educational inequality, which is rooted in historical inequality in political rights and assets, been mitigated under the, at least nominally, progressive ISI regimes? On the other hand, the great within-country heterogeneity in Latin America weakens the validity of country-level studies, which constitute the current mainstream. This issue relates to a main hypothesis of this paper that different types of sub-country regions may be differently affected by the same policy or political change. First, given that inequality is context-specific, inequality in regions where traditional social structure dominates (e.g. rural regions) should be less susceptible to exogenous changes. Second, considering political instability and limited state capacity in Latin America, it is reasonable to hypothesise that governmental policies (e.g. trade and taxation) have weaker effects on regions farther from a country's political centre or external market, say politically or geographically peripheral regionsFootnote 1. This concern is especially relevant for the second half of the last century, as both the ISI model and the neoliberal reform favoured urban regions, especially large cities, over rural regions. This paper will provide descriptive and econometric evidence on the aforementioned issues.
The recently burgeoning anthropometric approach towards measuring inequality and increasingly available anthropometric data have made it possible to estimate pre-1980s inequality in Latin America, even at a sub-country level. Following Baten and Mumme (Reference Baten and Mumme2010), this paper uses the difference in mean years of schooling between the taller and the shorter half of the female population, which is calculated based on the Demographic and Health Surveys (DHS), to measure the socio-economic inequality in education between the better-off and the worse-off socio-economic stratumFootnote 2. It aims to trace the development of the level of and the inequality in years of schooling within sub-country regions (i.e. capital region, non-capital region, urban region and rural region) by cohort analysis from the 1950s to the 1990s in Bolivia, Brazil, Colombia, the Dominican Republic, Guatemala, Haiti, Honduras, Nicaragua and Peru, and then econometrically examine the determinants of this inequalityFootnote 3.
A particular interest lies in the impact on sub-country educational inequality of trade liberalisation, democratisation and educational expansion, which represented Latin America's three landmark changes in the economic, political and social spheres between the 1950s and the 1990s. Trade liberalisation has been found to be economically disequalising in Latin America during not only the neoliberal period (Gasparini and Lustig Reference Gasparini, Lustig, Ocampo and Ros2011) but also the entire second half of the last century (Baten and Fraunholz Reference Baten and Fraunholz2004). However, educational inequality and economic inequality in Latin America tend to follow different dynamics (Sahn and Younger Reference Sahn and Younger2006; Cox Reference Cox, Attewell and Newman2010). As shown by Baten and Mumme (Reference Baten and Mumme2010), trade liberalisation has reduced, rather than increased, educational inequality in developing countries since 1945. Concerning the impact of democracy on educational inequality, despite some positive evidence (e.g. Brown and Hunter Reference Brown and Hunter2004), doubts about the actual positive effect of democracy in Latin America are strong (e.g. Brown and Hunter Reference Brown and Hunter1999; Cárdenas and Helfand Reference Cárdenas, Helfand, Durlauf and Blume2011). Similarly, whether educational expansion reduces educational inequality in developing countries is also contentious (Ram Reference Ram1990; Frankema Reference Frankema2008). This paper contributes to these debates by evidence at the sub-country level in light of the hypothesis that the same policy has different influences on different sub-country regions.
This paper finds positive trends in the absolute educational level but persistent educational inequality for birth cohorts from the 1950s to the 1990s for countries in question, regardless of sub-country region or socio-economic stratum. This finding indicates the achievement of the ISI era in educational development but its failure to mitigate the unequal distribution of education. Econometric analysis finds significant influences of economic policies and politics on educational inequality in urban regions, especially capital and large cities, but educational inequality in rural regions was hardly influenced. This finding raises a question for future research as to whether the insensitivity of educational inequality in Latin America's rural regions to policy and political changes is due to their traditional social structure (e.g. endemic elites' resistance to redistribution).
Some limitations due to sample and data should be borne in mind when interpreting and generalising the findings. The country sample in question basically represents the economically and educationally weaker and more unequal half of Latin America, except for Brazil in economic terms, without the more advanced and equal Southern Cone (Argentina, Chile and Uruguay) and Mexico and Venezuela, two countries with large and strong economyFootnote 4, Footnote 5. As a result, this paper tends to reflect the lower bound of years of schooling and the upper bound of educational inequality in Latin America. Furthermore, it is unclear if and how the use of data exclusively on women affects the estimation of years of schooling and educational inequality, because the nine countries in question do not share a common pattern of gender disparity in education and it is unclear if educational distribution amongst women systematically differs from that amongst menFootnote 6.
This paper is organised as follows. Section 2 introduces the anthropometric measure of educational inequality. Section 3 introduces data and discusses regional classification. Section 4 presents cohort analysis of years of schooling and educational inequality at the sub-country level from the 1950s to the 1990s. Section 5 discusses determinants of educational inequality. Section 6 presents empirical strategy and regression results. Section 7 concludes the findings.
2. AN ANTHROPOMETRIC MEASURE OF EDUCATIONAL INEQUALITY
Following Baten and Mumme (Reference Baten and Mumme2010), this paper measures educational inequality by the difference in mean years of schooling between the taller half and the shorter half of the female population. Height has been increasingly used by economic historians as a proxy for living standards in situations in which direct data (e.g. wage) are lacking (Komlos and Baten Reference Komlos and Baten2004). There is robust evidence in anthropometric research that people of upper socio-economic strata tend to be taller than those of lower strata (Steckel Reference Steckel1995). Therefore, in the absence of information on social classification (e.g. income and occupation), taller people can represent the better-off socio-economic stratum, and shorter people can represent the worse-off socio-economic stratum (López-Alonso and Vélez-Grajales Reference López-Alonso, Vélez-Grajales, Bértola and Williamson2017). In this regard, the difference in mean years of schooling between the taller half and the shorter half is a proxy for educational inequality between the better-off stratum and the worse-off stratum, namely the socio-economic inequality in education. This method falls within the «gradient» or «socio-economic» approach, which measures inequality in social indicators by differences between groups with different socio-economic characteristics (Sahn and Younger Reference Sahn and Younger2006). Height can be seen as a socio-economic characteristic, because at the population level it is mostly determined by living standards. The data in this paper show that biologically better-off, namely taller, people tend to be educationally better-off, as 281 out of the total 284 observations of taller–shorter differences in years of schooling are positive in favour of taller individualsFootnote 7. The three negative exceptions are all close to zero.
The height-based approach to measuring social classification is particularly relevant for Latin America, where pre-1980s data are quite lacking, especially at a sub-country level. Since adult height is mostly determined by nutrition and environment during early childhood, in particular the first 3 years following birth, it is a good proxy for childhood living standards (Baten Reference Baten2000; Cole Reference Cole2003). Thus, inequality in living standards of a particular period in history can be inferred from height information. For instance, the difference between the taller half and the shorter half of people who were born in 1960 reflects inequality between the better-off half and the worse-off half of that population between approximately 1960 and 1963. This method overcomes the unavailability of historical data on social classification. Moreover, height data cover a wider range of social groups than do income data. This advantage is particularly important for Latin America, which features high informality, high unemployment and poor rural population.
A question may be raised concerning the genetic determinant of height. At an individual level, height indeed has a genetic basis (Magnusson et al. Reference Magnusson, Rasmussen and Gyllensten2006, p. 662), while at a population level, genetic differences across individuals are mostly averaged out and mean height is mostly determined by living standards (Baten and Mumme Reference Baten and Mumme2010, p. 284). However, genetic differences account for height differences between different ethnic groups, even at a population level, unless the distinct ethnic groups have had comparable living standards for several generationsFootnote 8. Differences in dietary habits may also explain height differences between ethnic groups (Blum Reference Blum2013). These two issues are relevant for Latin America, where ethnic heterogeneity is great (e.g. indigenous people vs. white people). The availability of ethnic information in the database does not allow for controlling for ethnic differences in gene and dietary habits. However, this should not be a major problem, because, within a given region, ethnic composition tends to be relatively homogeneous and this paper does not compare heights across regionsFootnote 9. Second, according to Leunig and Voth (Reference Leunig, Voth, David and Thomas2001), some factors other than nutritional intake and the intensity of manual labour influence height, such as heating and the concentration of lead in water. However, these factors are closely correlated with household conditions. Poor families are more likely to suffer from the so-called «fuel poverty» and the replacement of lead pipe is slower in poorer areas. Thus, the influences of these factors on height are actually included in the overall influences of household conditions on height. Third, significant improvement in living standards at later ages (e.g. adolescence) basically does not reverse height stunting caused by poor living standards earlier in life, because the influence of environment on height at later ages is negligible in comparison with the influence of the environment in early childhood (Baten Reference Baten2000). Thus, height robustly reflects early childhood living standards. Finally, heights converge as people approach their biological height limits. However, this is more relevant for today's developed countries rather than Latin America in the last century. Even in England, men of the first and the second strata were still 3 cm taller than those of the fourth and the fifth strata in the 1980s (Floud et al. Reference Floud, Floud, Gregory and Wachter1990).
3. DATA AND REGIONAL CLASSIFICATION
This paper uses various rounds of the DHS on the nine countries, covering women aged between 15 and 49 years of age. Women aged 15–19 are dropped because people younger than 20 years of age may not have reached their final height (Moradi and Baten Reference Moradi and Baten2005, p. 4; Akachi and Canning Reference Akachi and Canning2015, p. 115). Height shrinking after 50 years of age is not a problem because the upper bound of age in the DHS is 49. Another potential bias is that women under 22 years of age may not have completed schooling. If so, the level of schooling of women aged 20 and 21 may be underestimated. However, this downward bias is not found due to the very low proportion of women enrolled in tertiary education. Sampling weight and de-normalisation across survey rounds are taken into account in the calculations. Table 1 shows sample size for each country, which is not necessarily proportional to country size. For example, Brazil has the smallest sample size because it was surveyed in only two rounds after 1988Footnote 10.
SAMPLE SIZES AT THE SUB-COUNTRY LEVEL
Source: Computed with data from the DHS database.
The nine countries, which are chosen purely based on data availability as explained in section 1, can be dichotomised as the four large South American countries and the five small Central American and Caribbean countries. These countries feature great heterogeneity. Ethnic composition is a telling example. For instance, while Bolivia, Peru and Guatemala have significant indigenous populations, Brazil and Colombia are dominated by white people and people of mixed race. Fixed-effects regression is thus used to control for unobservable or unmeasurable country-specific factors.
The empirical analysis is carried out at a sub-country level. The four types of regions are pre-defined in the DHS database. Capital region includes the capital city and major cities; non-capital region refers to all regions other than capital region; urban region includes the capital city, major and small cities and towns; and rural region refers to regions other than urban regionFootnote 11. The four partly overlapping regions consist of two mutually exclusive pairs: capital vs. non-capital regions and urban vs. rural regions. Capital regions are singled out not only because of developing countries' typical great disparity between capital and non-capital regions, the so-called «primacy effect», but also because of the Latin America-specific characteristic that both the ISI model and the neoliberal reform favoured capitals and large cities more so than other regions. The state-led industrialisation prior to the 1980s was biased towards capital-intensive industry, which clustered in capitals and large cities, and led to the geographical concentration of wealth, especially in large Latin American countries (Baer Reference Baer1972, pp. 107–108). During the neoliberal period, capital regions benefited from advantageous access to foreign information and foreign investors' preference, which enlarged interregional inequality (Baten and Fraunholz Reference Baten and Fraunholz2004, p. 73; Baltzer and Baten Reference Baltzer and Baten2008, p. 193). These asymmetries between capital and non-capital regions can be generalised to the case of urban vs. rural regions.
However, policies in favour of capital and urban regions have side effects. The ISI period witnessed great internal migration largely due to poor economic situations in rural regions and better living standards and preferential policies in urban regions (Frankema Reference Frankema2008). However, newly established industries, which tended to be capital-intensive, did not generate enough employment opportunities, especially for unskilled labours (Frankema Reference Frankema2012). In the 1950s and the 1960s, manufacturing employment grew much slower than the urban population (Baer Reference Baer1972, pp. 106–107). Consequently, unskilled labours were oversupplied, and informality dramatically increased in urban regions, which increased urban inequality. The increasing inequality was not reversed during the neoliberal period (Goldberg and Pavcnik Reference Goldberg and Pavcnik2004; Oostendorp and Quang Reference Oostendorp and Quang2010).
The great internal migration leads to a potential migration bias for regional classificationFootnote 12. For instance, if an individual was born in rural region and moved to capital or urban region at her school age, then her place of early childhood residence is different from the place where she received schooling. That is to say, interregional migrants' heights reflect the living standards of their places of early childhood residence, but they received schooling in other regions. In order to avoid this discrepancy, this paper combines individuals' birthplace information with their mobility records in the database. An individual is classified under a given region (i.e. capital, non-capital, urban or rural) if she has always lived in this region since she was born, or if she had moved to this region by 5 years old and did not move out thereafter, except for within-region mobility. On the one hand, this treatment ensures that one's regional classification matches her place of early childhood residence, which determines her height. On the other hand, as people usually start schooling at around 6 years old, having moved to a region by 5 years old without moving out thereafter ensures that she received schooling in this region. This treatment leads to the loss of some observations, but not to a large extent.
4. YEARS OF SCHOOLING AND EDUCATIONAL INEQUALITY
Figure 1 shows mean years of schooling for the taller half and the shorter half of women in each type of region for each country from the birth cohort of 1950–1954 to the birth cohort of 1990–1994. Since people normally start schooling at around 6 years of age, data from the birth cohort of 1950–1954 to the cohort of 1990–1994 actually reflect educational inequality from approximately the period of 1956–1960 to the period of 1996–2000 or slightly later. Except for Brazil, all countries show increasing years of schooling across birth cohorts, especially prior to the 1980sFootnote 13. In Haiti, rural women's years of schooling even increased from less than 1 year in the 1950s to around 6 years in the 1990s. Different regions within a country share quite similar trends. The taller half and the shorter half also follow similar trends. The increase in years of schooling tends to be weaker in the 1980s and the 1990s for countries with available data. However, it is unclear if this growth stagnation was due to the debt crisis or a «ceiling effect» after mean years of schooling had reached a certain level. At any rate, the recession did not reduce years of schooling.
MEAN YEARS OF SCHOOLING OF THE TALLER HALF AND THE SHORTER HALF.
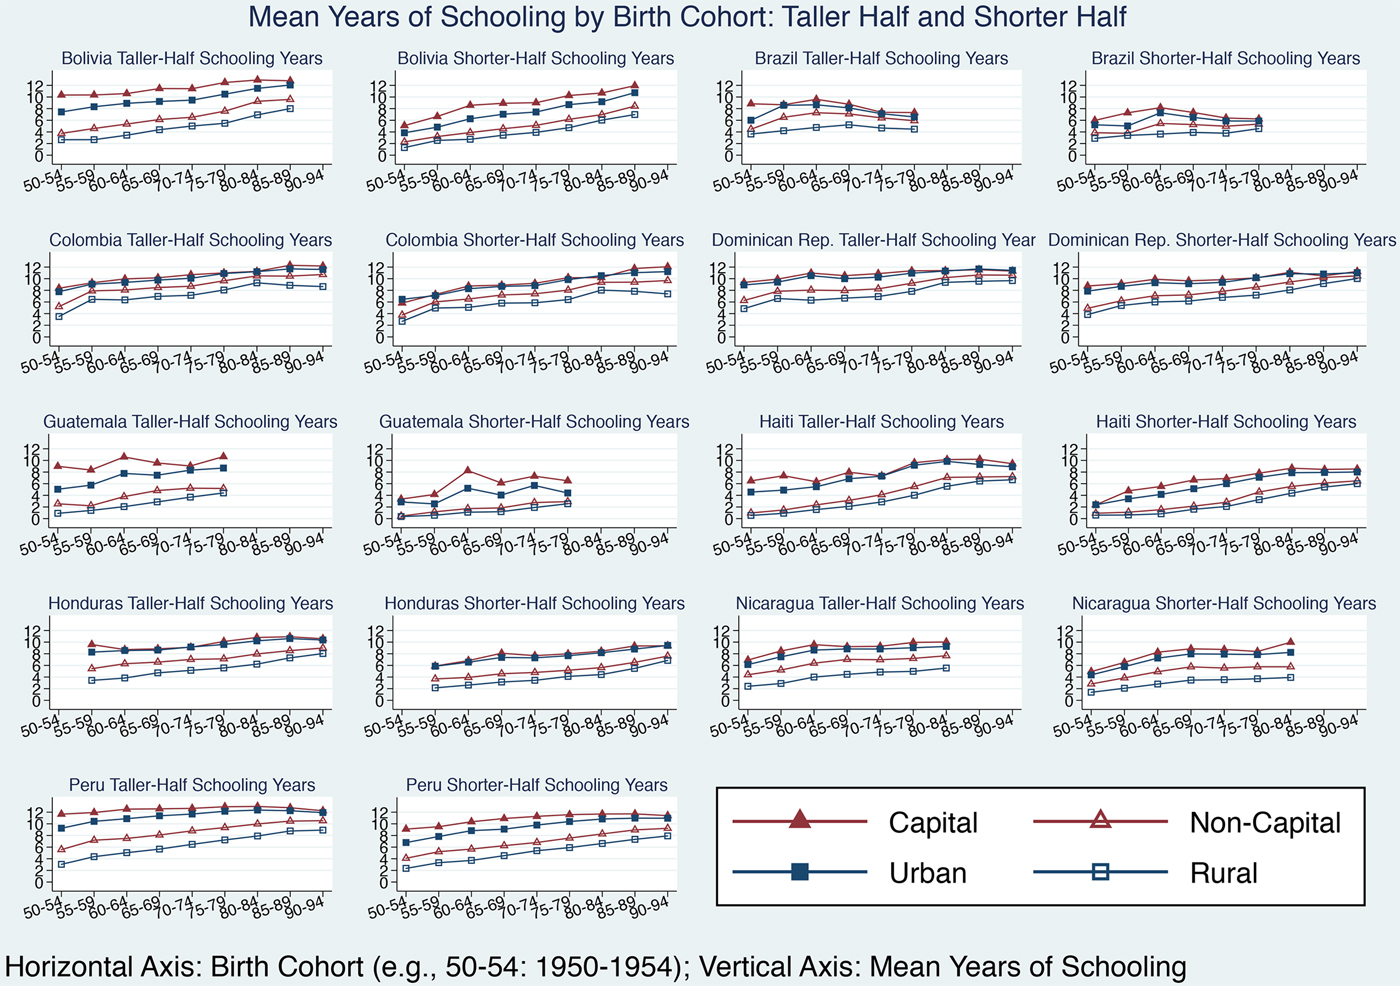
Women born in capital regions have the most years of schooling for almost all birth cohorts, regardless of the taller half or the shorter half. Rural regions always have the fewest years of schooling. The capital–non-capital and urban–rural gaps are considerable. For the birth cohort of 1950–1954, taller women born in capital regions have approximately 8–12 years of schooling across countries, except for Haiti and Nicaragua, whereas years of schooling for those born in rural regions are approximately 0–4. According to the Barro-Lee data, women born between 1951 and 1955 in the United Kingdom and France have on average 9.47 and 9.35 years of schooling (national average), respectively. Thus, the better-off Latin American women born in the early 1950s in capital regions have comparable years of schooling with women born during the same period in the most advanced countries. This phenomenon still holds true for subsequent birth cohorts. By contrast, rural regions in these countries have schooling level similar to that of other underdeveloped countries. Thus, a simple national average for years of schooling masks the great regional disparity. For instance, according to the Barro-Lee data, the national mean years of schooling for women born between 1951 and 1955 in Bolivia and Peru are 5.51 and 7.07, respectively. Figure 1, however, shows that taller (shorter) women born between 1950 and 1954 in capital regions of Bolivia and Peru have 10.33 (5.09) and 11.65 (9.09) years of schooling, respectively. By contrast, taller (shorter) women from the same birth cohort in rural regions have 2.66 (1.31) years of schooling in Bolivia and 3.04 (2.34) in Peru.
Figure 2 depicts the trend of differences in mean years of schooling between the taller half and the shorter half of women from the birth cohort of 1950–1954 to the birth cohort of 1990–1994. Taller women have more years of schooling than shorter women in 281 out of a total of 284 observations. Inequality in years of schooling tends to be persistent and fluctuant across cohorts. However, birth cohorts in the 1950s and the early 1960s in capital regions show obvious reductions in educational inequality in all countries except for the Dominican Republic, Nicaragua and Peru. The 1950s and the 1960s witnessed the peak of the ISI model and a wave of progressive reforms led by populist and nationalist movements in some Latin American countries (e.g. the Bolivian Revolutionary Nationalist Movement—MNR, the historical Brazilian Labour Party—PTB and the Guatemalan Revolutionary Action Party—PAR). If the ISI model and progressive reforms can explain this educational equalisation in capital regions, it may be argued that they only mattered in capital regions where the government had a stronger influence and the endemic social structure was susceptible to reforms and changes.
TALLER–SHORTER DIFFERENCE IN MEAN YEARS OF SCHOOLING.
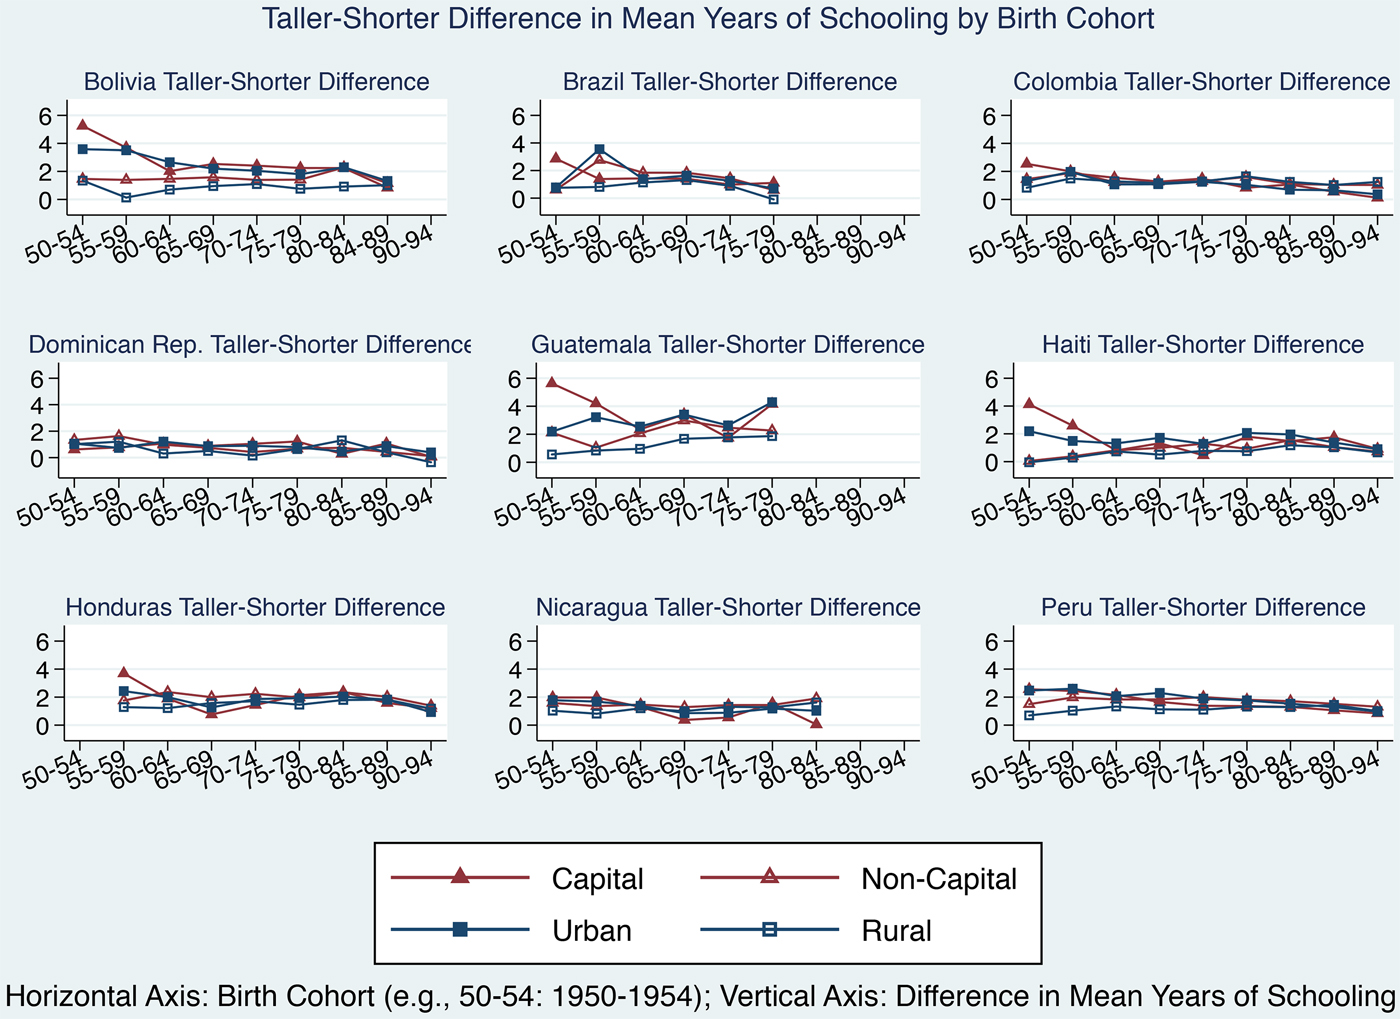
In countries with available data, educational inequality tends to decrease for birth cohorts in the 1980s and the 1990s, regardless of region. This finding is in sharp contrast to the well-documented increase in economic inequality during the recession, which corroborates the observation of opposite dynamics between educational inequality and economic inequality (Cox Reference Cox, Attewell and Newman2010). Figure 1 shows that, for the birth cohorts in the 1980s and the 1990s, stagnation of the taller half's increase in years of schooling is more significant than that of the shorter half's. The shorter half in Colombia and Honduras did not even experience stagnation. Thus, educational equalisation for the «recession cohorts» may have been due to the greater (weaker) negative impact of the recession on the better-off half (worse-off half) in educational terms, provided that it was not due to a «ceiling effect». Interregional differences in educational inequality are quite small, except for in Bolivia and Guatemala. Rural regions always have the lowest inequality, regardless of country or cohort. An explanation for this phenomenon is that both better-off and worse-off people in rural regions have few years of schooling, leaving limited space for inequality.
5. DETERMINANTS OF EDUCATIONAL INEQUALITY
This paper focuses on policy and political determinants of educational inequality, because the government's growing role in the Latin American economy during the 20th century makes it necessary to examine how the government has influenced inequality (Arroyo Abad and Lindert Reference Arroyo Abad, Lindert, Bértola and Williamson2017). The particular interest lies in trade liberalisation, democratisation and educational expansion, which represent three landmark changes in Latin America's economic, political and social spheres in the second half of the last century. Trade policy was the key issue in both the paradigm shift from the early export-led model to the ISI model and the shift from the ISI model to the neoliberal model; democratisation was a historic transition in Latin America during the Third Wave of Democracy in the 1980s; and expansion of primary education was a great social programme prevalent in Latin America in the last century. Moreover, Latin America's tax reform in the 1970s and the 1980s is another variable of interest. This section discusses these four policy and political factors in Latin America, especially their impact on inequality, and then introduces the measurement of these variables and other control variables.
5.1 Trade Liberalisation
Trade may be the most important and contentious issue in Latin America's contemporary economic history. In the 1950s and the 1960s, trade restriction was the core policy tool of the ISI regime (Taylor Reference Taylor1998). In turn, in the 1980s and the 1990s, trade liberalisation was a core component of neoliberal reform. Table 2 shows the periods of trade restriction and trade liberalisation in the nine countries from 1950 to 1994.
TRADE RESTRICTION AND TRADE LIBERALISATION BETWEEN 1950 AND 1994
Source: Based on Sachs and Warner (Reference Sachs and Warner1995).
The influence of trade liberalisation on inequality, mostly economic inequality, has provoked great debates. According to the Stolper–Samuelson theorem, trade openness increases demand for and return to a country's abundant production factor. Thus, openness should reduce inequality in developing countries, which are abundant in less-skilled and unskilled labour. By contrast, the skill premium argument suggests that trade openness generates skill premium by introducing skill-biased technology and benefits skilled labour more than unskilled labour, which increases inequality (Green et al. Reference Green, Dickerson and Arbache2001). As Latin America became a labour-abundant continent in the last century, trade liberalisation should have an equalising effect. However, empirical studies on Latin America tend to reject the Stolper–Samuelson theorem and support the skill premium argument (Castilho et al. Reference Castilho, Menéndez and Sztulman2012). Wood (Reference Wood1997) argues that Latin America's trade liberalisation coincided with that of large labour-abundant Asian countries, and those Asian countries' lower labour costs offset Latin America's cost advantage in unskilled products. A second explanation for the disequalising effect of trade liberalisation is the so-called «skill-enhancing trade» (Robbins Reference Robbins1995). Particularly, the presence of large Asian countries drove Latin American countries to produce semi-skilled products, which generated skill premium (Oostendorp and Quang Reference Oostendorp and Quang2010, p. 4).
However, how trade liberalisation has influenced educational inequality is under-studied. From the supply side, the influence can be analysed through how trade liberalisation affects social spending, because educational spending is a major part of social spending. The «efficiency hypothesis» argues that trade liberalisation motivates the government to cut down social spending in exchange for competitiveness; as such, inequality increases. By contrast, the «compensation hypothesis» suggests that trade liberalisation motivates the government to raise social spending to maintain political stability in the uncertain post-liberalisation environment. Therefore, it can be argued that post-liberalisation educational provision is partly determined by how the government perceives and deals with opportunities and challenges. Kaufman and Segura-Ubiergo (Reference Kaufman and Segura-Ubiergo2001) find evidence in support of the «efficiency hypothesis» for Latin America. From the demand side, increases in economic inequality after trade liberalisation may translate into corresponding increases in educational inequality. However, skill premium generated by trade liberalisation may encourage poor people to attend school, thus reducing educational inequality, provided that education is affordable. Baten and Mumme (Reference Baten and Mumme2010) find that, in the post-war period, trade liberalisation reduced educational inequality in developing countries, including Latin America. Similarly, Sahn and Younger (Reference Sahn and Younger2006) find that, in Latin America, educational inequality decreased while income inequality increased in the late 1980s and the 1990s. These findings suggest opposite dynamics between educational inequality and economic inequality, because only a small portion of schooling translates into real output (World Bank 2005, p. 68; Cox Reference Cox, Attewell and Newman2010, p. 5). Thus, an equalising effect of trade liberalisation on education is more likely to hold. However, this equalising effect is expected to take place mainly in capital and urban regions. In rural regions, this effect may be weak, if any, due to limited access to external market and limited tradable sectors.
Therefore, how do we measure trade liberalisation? First, it is important to distinguish between «natural openness» and trade liberalisation. Studies that focus on the former usually measure trade openness by deriving from the gravity equation the share of trade in GDP that is purely explained by geography and country size (e.g. Frankel and Romer Reference Frankel and Romer1999). Studies focusing on the latter tend not to use trade share, as it reflects many contributors to trade other than trade policy. As argued by Rodríguez and Rodrik (Reference Rodríguez and Rodrik2000), trade policy indeed affects trade volume, but the outcome of trade policy should not be confused with that of trade volume. Some studies use tariff rates or revenues to measure trade liberalisation (e.g. Santos-Paulino and Thirlwall Reference Santos-Paulino and Thirlwall2004). However, the availability of data on tariff rates and duty revenues for Latin America prior to the 1970s does not allow for using this measure in this paper. Moreover, both official and effective tariff rates have been extensively criticised as a measure of trade liberalisation, primarily because prohibitive tariff rates on particular goods may highly depress their traded volume and the actual effect of tariff rates has to be analysed together with other trade policy instruments.
This paper measures trade liberalisation by two distinct variables. The first is the dummy variable based on trade liberalisation date (Sachs and Warner Reference Sachs and Warner1995). A 5-year birth cohort is classified under trade liberalisation (coded as 1), if at least three out of the 5 years are classified as liberalised period. It is important to note that the trade liberalisation date compiled by Sachs and Warner (Reference Sachs and Warner1995) is different from their well-known cross-sectional trade liberalisation dummy exclusively for the period of 1970–1989. The former is constructed based on review of the literature for each country case, whereas the latter is based on the famous five criteria on tariff, nontariff barrier, state monopoly of exports, black market premium and socialist economyFootnote 14. Although the cross-sectional trade liberalisation dummy has been extensively criticised (e.g. Rodríguez and Rodrik Reference Rodríguez and Rodrik2000), the data on trade liberalisation date correctly reflect changes in trade policies and are much less subject to the criticism (Wacziarg and Welch Reference Wacziarg and Welch2008). Moreover, following Fajnzylber and Lederman (Reference Fajnzylber and Lederman1999) and Giavazzi and Tabellini (Reference Giavazzi and Tabellini2005), this paper considers the Sachs and Warner trade liberalisation date as a signal of broader market-friendly policy and institutional changes, namely economic liberalisation, because such policy and institutional changes tend to accompany trade liberalisation, especially in Latin AmericaFootnote 15.
The second variable is constructed, following Wei (Reference Wei1999), by deriving the residual between observed trade share and fitted share (the «natural openness») based on geography, population, language and incomeFootnote 16. According to Wei (Reference Wei1999), this residual includes the effect of trade policy. A larger residual indicates a larger proportion of trade that is attributable to factors other than geography and population (e.g. trade policy), namely higher trade freedom. This paper extends the original model of Wei (Reference Wei1999) by adding GDP per capita as explanatory variable and using panel data. Clemens and Williamson (Reference Clemens and Williamson2011, p. 13) cite several statistics and show that, in history, at least half of the growth in the world trade and developed countries' trade can be explained by income growth, namely demand and supply factors, rather than reduction in trade barriers. Therefore, controlling for income makes the residual closer to the «policy component of trade». However, this residual has its drawbacks as a proxy for trade liberalisation. During the ISI period, the government restricted imports in basic manufactured goods but promoted imports in capital goods. As a result, in the 1950s and the 1960s, the share of imports in Latin America's GDP did not decline (Baer Reference Baer1972, p. 103). Moreover, even after controlling for income, the «residual» still includes many contributors to trade volume in addition to trade policy. In this regard, this residual is similar to a black box, as it is unclear to what extent it is driven by trade policy. Thus, it is used only as a secondary option. In brief, the Sachs and Warner dummy mainly reflects subjective policy attitudes, while the residual openness mainly reflects objective outcomes of policy changes and other unspecified factors.
Can the causality run from educational inequality to trade policy? Baten and Mumme (Reference Baten and Mumme2010) consider this not to be a major problem, in light of the finding of Baltzer and Baten (Reference Baltzer and Baten2008) that lower economic inequality in Latin America did not stimulate openness. However, stronger rejections of the possibility of endogeneity can be derived from history. Trade policy, either restriction or liberalisation, was the core and symbolic policy tool of both the ISI model and the neoliberal model. Because the emergence of these two models is due to factors exogenous to educational inequality, trade restriction and trade liberalisation should be considered as exogenous. Latin America's ISI was driven by «big facts», such as the turndown of international trade and the collapse of the global financial system caused by the two world wars and the Great Depression, the success of the Soviet state-led industrialisation, and the promotion by the Latin American structuralist school (Baer Reference Baer1972; Ocampo and Ros Reference Ocampo, Ros, Ocampo and Ros2011). Moreover, Latin America's trade restriction policy also had its root in the earlier balance of payments management as a response to the volatile global market and capital inflow (Ocampo and Ros Reference Ocampo, Ros, Ocampo and Ros2011, p. 5). The neoliberal reform in the 1980s was a response to the debt crisis under the influence of international agencies, to the success of the East Asian model, and to the failure of the Soviet model, which are the «big facts» as well in the words of Lindauer et al. (Reference Lindauer, Pritchett, Rodrik and Eckhaus2002) and Ocampo and Ros (Reference Ocampo, Ros, Ocampo and Ros2011). Moreover, Latin America's neoliberal reform was also part of the global wave of neoliberalisation following the «Washington Consensus». Finally, in the following regressions, trade liberalisation is treated with a lag structure, which further avoids endogeneity.
5.2 Democracy
Latin America's inequality is rooted in the exclusionary institutions established in the Spanish colonial period and has been perpetuated by elites' privilege-based institutional arrangement (De Ferranti et al. Reference De Ferranti, Perry, Ferreira and Walton2004; Prados de la Escosura Reference Prados De La Escosura, Hatton, O'Rourke and Taylor2007). Inequality in political rights between elites and the rest of the population impeded educational development and disequalised educational distribution (Engerman et al. Reference Engerman, Mariscal, Sokoloff, Eltis, Lewis and Sokoloff2009). Latin America's elites resisted the redistribution of income and wealth through tax-supported education, because of the privilege-based social structure and low benefits from investing in public education (Frankema Reference Frankema2009; Lindert Reference Lindert2010). By contrast, the evidence that the Northern United States led its Southern counterpart in primary education in the 19th century shows how equal distribution of political rights promoted redistribution towards tax-supported education (Go and Lindert Reference Go and Lindert2010). Brown (Reference Brown1999) and Brown and Hunter (Reference Brown and Hunter2004) find a positive influence of democracy on education in Latin America. However, a condition for democracy to take equalising effect is sufficient political consciousness of the poor (Bollen and Jackman Reference Bollen and Jackman1985). For many Latin American countries in the last century, this condition might not hold, especially for rural regions. Moreover, the functioning of democratic governments in some Latin American countries was subject to the strong presence of business and military elites (Brown and Hunter Reference Brown and Hunter1999). Economic inequality is another factor that prevents democracy from operating (Cárdenas and Helfand Reference Cárdenas, Helfand, Durlauf and Blume2011). Thus, although democracy can in theory weaken the elites' resistance to redistribution, it is likely that social structure restricts the functioning of democracy in Latin America. This leads the actual effect of democracy to be an empirical question.
Another concern stems from the diverse political spectrum of the Latin American non-democratic regimes. Among the nine countries under study, non-democratic rulers range from the leftist Nicaraguan Sandinista National Liberation Front—FSLN to the rightist Haitian Duvalier family. Different non-democratic regimes may have had opposite influences on inequality. This complicates the question on the role of democracy. In this paper, democracy is measured by the dummy variable from the Dictatorship and Democracy Database (Cheibub et al. Reference Cheibub, Gandhi and Vreeland2010). If a 5-year birth cohort has at least 3 years under democracy, this cohort is classified under «democracy». Table 3 lists democratic periods in the nine countries between 1950 and 1994.
PERIODS OF DEMOCRACY BETWEEN 1950 AND 1994

Source: Based on Cheibub et al. (Reference Cheibub, Gandhi and Vreeland2010).
5.3 Expansion of Primary Education
Latin American countries' educational expansion can be divided into three waves: the most developed «early movers» in the Southern Cone and British colonies in the Caribbean in the late 19th century, the least developed «late movers» (e.g. Guatemala, Haiti, Honduras and Nicaragua) in the 1950s, and others in the 1920s and the 1930s (Frankema Reference Frankema2008). Despite the problem of «enrolment over attendance», by the end of the last century, Latin America had achieved universal primary education (Frankema Reference Frankema2009). The public tends to expect that educational expansion generates more opportunities and thus reduces educational inequality. However, some evidence shows that educational inequality increases in educational expansion until a certain point and then decreases. Thus, the actual effect of educational expansion remains an empirical question, especially for developing countries (Ram Reference Ram1990; Frankema Reference Frankema2008). Similarly, the «elite saturation» theory in sociology argues that educational inequality increases in educational expansion until better-off people have attained universal lower-level education (elite saturation), and then educational expansion turns to benefit worse-off people and reduces educational inequality. This is empirically supported by Torche (Reference Torche2010) for Brazil, Colombia, Chile and Mexico. However, the initial disequalising effect of educational expansion may be alleviated, if the government expands primary education more so than secondary and tertiary education (Ram Reference Ram1990, p. 272). For Latin America, the elites' bias towards tertiary education and resistance to redistribution through tax-supported education make this hope less likely. However, the ISI model, which gave priority to social spending, may be a countervailing force. Educational expansion is measured by the female enrolment ratio of primary education from the Barro-Lee database. Despite problems of grade repetition and absenteeism, the enrolment ratio is a good proxy for the government's efforts to expand education.
5.4 Tax Reform
In the 1970s and the 1980s, Latin America experienced a wave of tax reforms by weakening the progressivity of income tax and introducing or expanding value-added tax (VAT). As a result, redistribution became a secondary goal of taxation. From the supply side, enlarged tax revenues from the more easily administered indirect taxation do not necessarily result in less redistribution, as more public spending can be made (Mahon Reference Mahon and Blofield2011, p. 4). According to Engel et al. (Reference Engel, Galetovic and Raddatz1999), the size of tax revenues is more important for redistribution than is the progressivity of the tax system. A high-yield regressive taxation may have a bigger equalising effect than a low-yield progressive taxation. However, whether social spending benefits the poor's education depends on whether tax revenues are paid for primary education (Arroyo Abad and Lindert Reference Arroyo Abad, Lindert, Bértola and Williamson2017). As found by Clifton et al (Reference Clifton, Díaz-Fuentes, Revuelta, Bértola and Williamson2017), in the second half of the last century, Latin America's fiscal policy was hardly progressive. From the demand side, by contrast, regressive tax relatively increases (reduces) the burden of the poor (the rich), and thus vertical equity across social strata is replaced by horizontal equity within a stratum. Trostel (Reference Trostel1993) shows that regressive taxation reduces the poor's human capital formation. Therefore, the actual effect of tax reform remains an empirical issue. Tax reform is measured by a dummy variable capturing whether a 5-year period is under the use of VAT for at least 3 years. Data are from Mahon (Reference Mahon and Blofield2011).
5.5 Control Variables
The share of people aged 40–59, namely the richest age group (Higgins and Williamson Reference Higgins and Williamson2002), in the total working population (15–69), Mature, and the share of school-aged children (7–14) in the total population, Immature, are used to control for demographic compositionFootnote 17. Data (from the CEPAL/ECLAC population projection) on urban regions, rural regions and national averages are used for regressions on capital and urban regions, rural regions and non-capital regions, respectively. Other controls include GDP per capita (from the Penn World Table 7.1) and war dummy (from the UCDP/PRIO Armed Conflict Dataset).
6. EMPIRICAL STRATEGY AND RESULTS
Separate panel regressions are used to examine the determinants of educational inequality in capital regions, non-capital regions, urban regions and rural regions, respectively. The dependent variable is the difference in mean years of schooling between taller and shorter women in each region of each country for each birth cohort. All data are arranged quinquennially. Table A1 in Appendix provides summary statistics for the panel used in regressions in Table 4Footnote 18. Country-invariant and year-variant shocks (e.g. the debt crisis), namely time fixed effects, are controlled by using quinquennial dummies. Because people usually start schooling at around 6 years old, schooling data for each 5-year birth cohort (e.g. 1950–1954) actually reflect educational inequality for the 5-year period more or less 6 years later (e.g. 1956–1960). Thus, there are two sets of regressions.
DETERMINANTS OF EDUCATIONAL INEQUALITY: FIXED-EFFECTS REGRESSIONS WITH LAGGED EFFECT
Note: Robust standard errors in parentheses: ***P < 0.01, **P < 0.05, *P < 0.1. Dependent variable (Edu. ineq.): taller–shorter difference in mean years of schooling. SW refers to using the dummy of liberalisation date (Sachs and Warner Reference Sachs and Warner1995) to measure trade liberalisation. Residual refers to using the residual between observed trade share in GDP and fitted share to measure trade liberalisation.
The first set of regressions takes a lag structure by using the values of all explanatory variables during each birth cohort (e.g. 1950–1954) to estimate that birth cohort's educational inequality, which realises in the 5-year period around 6 years later (e.g. 1956–1960). For instance, educational inequality of the birth cohort of 1950–1954, which realised during approximately 1956–1960, is regressed on trade liberalisation during 1950–1954. This lag of approximately 6 years allows the explanatory variables to take effect. Lagged effect is particularly important for trade liberalisation and democracy, as their influence on educational decision tends to operate via a lag (Wood and Ridao-Cano Reference Wood and Ridao-Cano1999; Galor and Mountford Reference Galor and Mountford2008; Cárdenas and Helfand Reference Cárdenas, Helfand, Durlauf and Blume2011; Blanchard and Olney Reference Blanchard and Olney2017). The second set of regressions is concerned with the possible contemporaneous effect on educational inequality of GDP per capita, educational expansion, tax reform, war and demographic composition, and thus uses the contemporaneous form of these variables (e.g. using war dummy during 1955–1959 to estimate educational inequality of the birth cohort of 1950–1954, which realised in 1956–1960). Due to data availability, I use data from the next 5-year period (e.g. 1955–1959) rather than exactly the 5-year period 6 years later (e.g. 1956–1960), but this should not have been a problem. Trade liberalisation and democracy are still arranged with a lag structure due to the clear lagged effect indicated in the literature. The Hausman test favours fixed-effects model, and Huber–White robust standard errors are used to deal with heteroskedasticity.
Table 4 presents the results from the lag regressions. Trade liberalisation is defined by Sachs and Warner's dummy in columns denoted by «SW». In columns denoted by «Residual», trade liberalisation is defined by the residual between observed trade share and fitted share. Adjusted R 2 shows that the model has much higher explanatory power for capital regions than other regions. The SW dummy reduces educational inequality by 0.43 years in capital regions but is statistically insignificant for other regions. In contrast, increasing Residual by one percentage point raises educational inequality in rural regions by 0.02 years. The magnitude of impact is negligible given the limited within-country dispersion of Residual by only several percentage points. Residual is insignificant for other regions. However, due to the black-box feature of Residual, it is unclear to what extent its effect is driven by trade policy. Thus, it may not be advisable to interpret much from this result. Shift to democracy increases educational inequality in capital regions by 0.71 years and 0.67 years in the two specifications, but it is insignificant for other regions. This is quite a large impact, and it contradicts the expectation that democracy serves as an equalising force. Increasing the primary enrolment ratio by one percentage point reduces educational inequality by 0.04 or 0.03 years in capital regions. This magnitude of impact is not small considering that the within-country standard deviation of enrolment ratios is around ten percentage points. This variable is insignificant for other regions. Neither tax reform nor war is statistically significant for any regions. The two demographic variables are barely significant. GDP per capita is significant in all specifications, increasing educational inequality in capital and urban regions but reducing it in non-capital and rural regions. A one-standard-deviation increase in logged GDP per capita (0.39 or 39 per cent) increases educational inequality by around 0.64 years (0.39×1.64) in capital regions but reduces it by 0.27 or 0.32 years in rural regions. However, this interpretation has to be treated cautiously, because within-country standard deviation of GDP per capita greatly varies across countries, ranging from 0.07 in Bolivia to 0.45 in Brazil.
Table 5 presents results for the contemporaneous regressions, which are basically similar to the lag regressions. The statistical significance of SW dummy's equalising effect in capital regions increases to the 1 per cent level. Democracy's disequalising effect in capital regions increases to over 0.9 years. Educational expansion loses its significance in capital regions in column 2. Tax reform becomes significant in capital regions with quite a large disequalising effect of 0.75 years and 0.74 years in the two specifications, respectively, indicating the disequalising effect of regressive taxation. For non-capital and rural regions, GDP per capita loses its significance. The share of school-aged people (Immature) becomes significant in non-capital and rural regions, with a small disequalising effect. Finally, specifications with quadratic terms for the enrolment ratio do not show Kuznets effect. Adding mean years of schooling and the quadratic term in the model does not show statistical significance either, implying the absence of educational Kuznets effect. For the parsimony of the model, mean years of schooling are not included in the final regressions.
DETERMINANTS OF EDUCATIONAL INEQUALITY: FIXED-EFFECTS REGRESSIONS WITH CONTEMPORANEOUS EFFECT

Note: Robust standard errors in parentheses: ***P < 0.01, **P < 0.05, *P < 0.1. Dependent variable (Edu. ineq.): taller–shorter difference in mean years of schooling. SW refers to using the dummy of liberalisation date (Sachs and Warner Reference Sachs and Warner1995) to measure trade liberalisation. Residual refers to using the residual between observed trade share in GDP and fitted share to measure trade liberalisation.
Finally, are the results driven by influential observations? Table 6 provides results for regressions after dropping influential observations detected by influence statisticsFootnote 19. Only regressions with the SW dummy are presented, because regressions with Residual do not show any qualitative differences. Dropping influential observations significantly increases adjusted R 2 for all regions. The model's explanatory power for capital and urban regions is still higher than that for non-capital and rural regions. Regressions for capital regions do not show qualitative differences in comparison with full-sample regressions. The SW dummy becomes statistically significant with equalising effect for non-capital and urban regions in the lag regressions, but remains insignificant for rural regions. Educational expansion becomes significant with equalising effect in urban regions and remains insignificant in non-capital and rural regions. Democracy becomes significant with small disequalising effect in urban regions in the lag regression. The two demographic variables become significant, implying that demographic composition may be an important factor for educational inequality, which is beyond the scope of this paper. In summary, dropping influential observations leads to a sharper contrast between capital and urban regions on the one hand and rural regions on the other.
ROBUSTNESS CHECKS: FIXED-EFFECTS REGRESSIONS WITH LAGGED AND CONTEMPORANEOUS EFFECT
Note: Robust standard errors in parentheses: ***P < 0.01, **P < 0.05, *P < 0.1. Dependent variable (Edu. ineq.): taller–shorter difference in mean years of schooling. SW refers to using the dummy of liberalisation date (Sachs and Warner Reference Sachs and Warner1995) to measure trade liberalisation.
7. CONCLUSION
Data unavailability has restricted explorations into inequality in Latin America prior to the 1980s, especially at a sub-country level. By using an anthropometric approach to overcome data unavailability, this paper examines the level of and the inequality in women's years of schooling at a sub-country level in nine Latin American countries from the 1950s to the 1990s. Years of schooling show significant increase across birth cohorts, especially prior to the 1980s, regardless of socio-economic stratum, region or country. However, inequality in years of schooling tended to persist. This finding indicates that educational development during the ISI period spread equally across sub-country regions and socio-economic strata. A consequence of the equal spread is that neither poor regions nor poor socio-economic strata caught up with their rich counterparts. In terms of education, benefits accruing to the better-off people were at least as many as those to the worse-off people. Thus, the ISI model, as an ideological break with Latin America's traditional socio-economic structure, seems not to have mitigated the unequal distribution of education, which has its roots in inequality in political rights and assets. The recession in the 1980s and the 1990s slowed down the growth in years of schooling, but it did not reduce the absolute schooling level.
Econometric analyses of the determinants of educational inequality reveal great asymmetry between capital and urban regions on the one hand and rural regions on the other. Educational inequality in capital regions and, to a lesser extent, urban regions was significantly influenced by trade liberalisation, democratisation, educational expansion and tax reform. By contrast, rural regions were hardly influenced by those policy and political changes. This sharp contrast may be due to the closeness and proximity of capital and urban regions to the central government and external markets as well as the government's weaker influence over rural regions, supporting the hypothesis on regional heterogeneity. This finding urges future explorations into the mechanisms underlying educational inequality in rural regions. Since rural regions tend to be less susceptible to social changes in comparison with capital and urban regions, it is of particular interest to explore whether the insensitivity of educational inequality in Latin America's rural regions to government policy is due to the maintenance of their traditional social structure (e.g. endemic elites' privileges and resistance to redistribution) as a historical legacy. This question may be examined through the actual role of the government in rural regions. On the one hand, geographical remoteness weakens the influence of the central government over rural regions given the limited state capacity of Latin American governments. On the other hand, endemic rural social structure may restrict or even distort the effect of government policy. A telling example is the resistance of the powerful landowning class to the introduction of minimum wage and trade union in rural El Salvador (Bulmer-Thomas Reference Bulmer-Thomas2003, p. 306).
The influences of policy and political factors deserve some discussion. The literature considers post-liberalisation skill premium as a major contributor to the increasing economic inequality in Latin America in the 1980s and the 1990s. However, the equalising effect of trade liberalisation on education in capital and urban regions found in this paper suggests the possibility that post-liberalisation skill premium increased the educational motivation of the worse-off group. Such an incentive-enhancing effect of skill premium is less likely to take place during the ISI period. Although in some Latin American countries skill premium peaked during the ISI period (Astorga Reference Astorga2017), the ISI policy bias towards capital-intensive industries resulted in limited opportunities for average labours. The skill requirement of those industries might have been too high for average labours to meet. In contrast, trade liberalisation in the 1980s put Latin America in the global labour division based on comparative advantages. Meanwhile, low-cost Asian countries squeezed Latin American countries' space in unskilled products and pressured them to produce semi-skilled products with moderate skill requirement that was easier for average labours to meet. However, the skill premium was less relevant for rural regions, as neither capital-intensive industries in the ISI period nor semi-skilled industries in the neoliberal period tended to be established in rural regions. Furthermore, provided that trade liberalisation is a signal of broader market-friendly reforms, the finding suggests that expanded economic opportunities in urban regions during the reform period might increase lower socio-economic strata's educational motivation. However, economic reforms might not significantly affect rural regions, at least in the short run.
The equalising effect of primary educational expansion may be, in theory, ascribed to the elite saturation effect (the inverted-U relationship) or the government's priority to expand primary education disproportionately in comparison with secondary or tertiary education (Ram Reference Ram1990). Since the Kuznets effects on educational inequality of educational expansion and mean years of schooling are not found, the second hypothesis seems to hold. If so, it can be argued that educational expansion in Latin America was of a pro-poor type, at least in capital and urban regions.
The disequalising effect of democracy in capital regions indicates a possibility that Latin America's democratic governments, like their authoritarian counterparts, used preferential policy to buy support from university students in capital and large cities. It is reasonable to assume that, in an unequal society, university students, rather than the silent less-educated majority, are more important to the government. If so, then the finding supports the argument that economic inequality has impeded the functioning of democracy in Latin America (Cárdenas and Helfand Reference Cárdenas, Helfand, Durlauf and Blume2011). Moreover, Latin America's non-democratic regimes feature a wide spread of political spectrum, and a simple dichotomy of democracy and dictatorship may not capture such a diversification. As argued by Lindert (Reference Lindert2003), the split in the styles of public expenditure lies between populist and elitist regimes rather than between democratic and autocratic regimes. This issue requires future research with more detailed data on political parties and regimes.
ACKNOWLEDGEMENTS
The author would like to thank two anonymous referees, Jörg Baten, Enrico Rettore, Carlo Fezzi and participants of the 66th Annual Meeting of the French Economic Association in Nice and the 10th Anniversary Conference of the Global History and Culture Centre in Warwick for comments on the manuscript and its previous versions.
Appendix
SUMMARY STATISTICS FOR THE FULL SAMPLE: 1950–1994