

1. Introduction
In ice-core studies, methanesulfonic acid (MSA, CH3SO3H) is used as a proxy for marine biogenic productivity (e.g. Reference Saigne and LegrandSaigne and Legrand, 1987). MSA is a product of marine biogenic dimethyl sulfide (DMS, (CH3)2S) emission and does not appear to have any source other than DMS. In polar waters, MSA production is strongly influenced by sea-ice coverage. Under present conditions in the Arctic Ocean, the highest DMS concentrations are found in open water at the ice edge, and the lowest concentrations occur beneath heavy pack ice (Reference Leck and PerssonLeck and Persson, 1996). Thus, MSA has been suggested as a potential sea-ice proxy in ice-core studies, and many attempts have been made to link the present sea-ice conditions with the MSA record from high-altitude ice cores from the large ice sheets in Antarctica (Reference Welch, Mayewski and WhitlowWelch and others, 1993; Reference Pasteur, Mulvaney, Peel, Saltzman and WhungPasteur and others, 1995; Reference Meyerson, Mayewski, Kreutz, Meeker, Whitlow and TwicklerMeyerson and others, 2002; Reference Curran, van Ommen, Morgan, Phillips and PalmerCurran and others, 2003) and Greenland (Reference Whung, Saltzman, Spencer, Mayewski and GundestrupWhung and others, 1994; Reference LegrandLegrand and others, 1997). However, not much is known about MSA in ice cores from smaller ice caps at lower elevations where there could be a more direct link with the source areas than at high-altitude sites. In our previous work with a Svalbard ice core from the ice field Lomonosovfonna (Fig. 1), we have suggested that MSA is related to sea ice and sea surface temperatures (SSTs) in the nearby Barents Sea between 1920 and 1997 (Reference O’DwyerO’Dwyer and others, 2000). At that time, we had not analyzed the complete core. In this paper, we discuss the MSA records from the entire 121 m deep core (Fig. 1), spanning the period from approximately AD 1200 to AD1997.
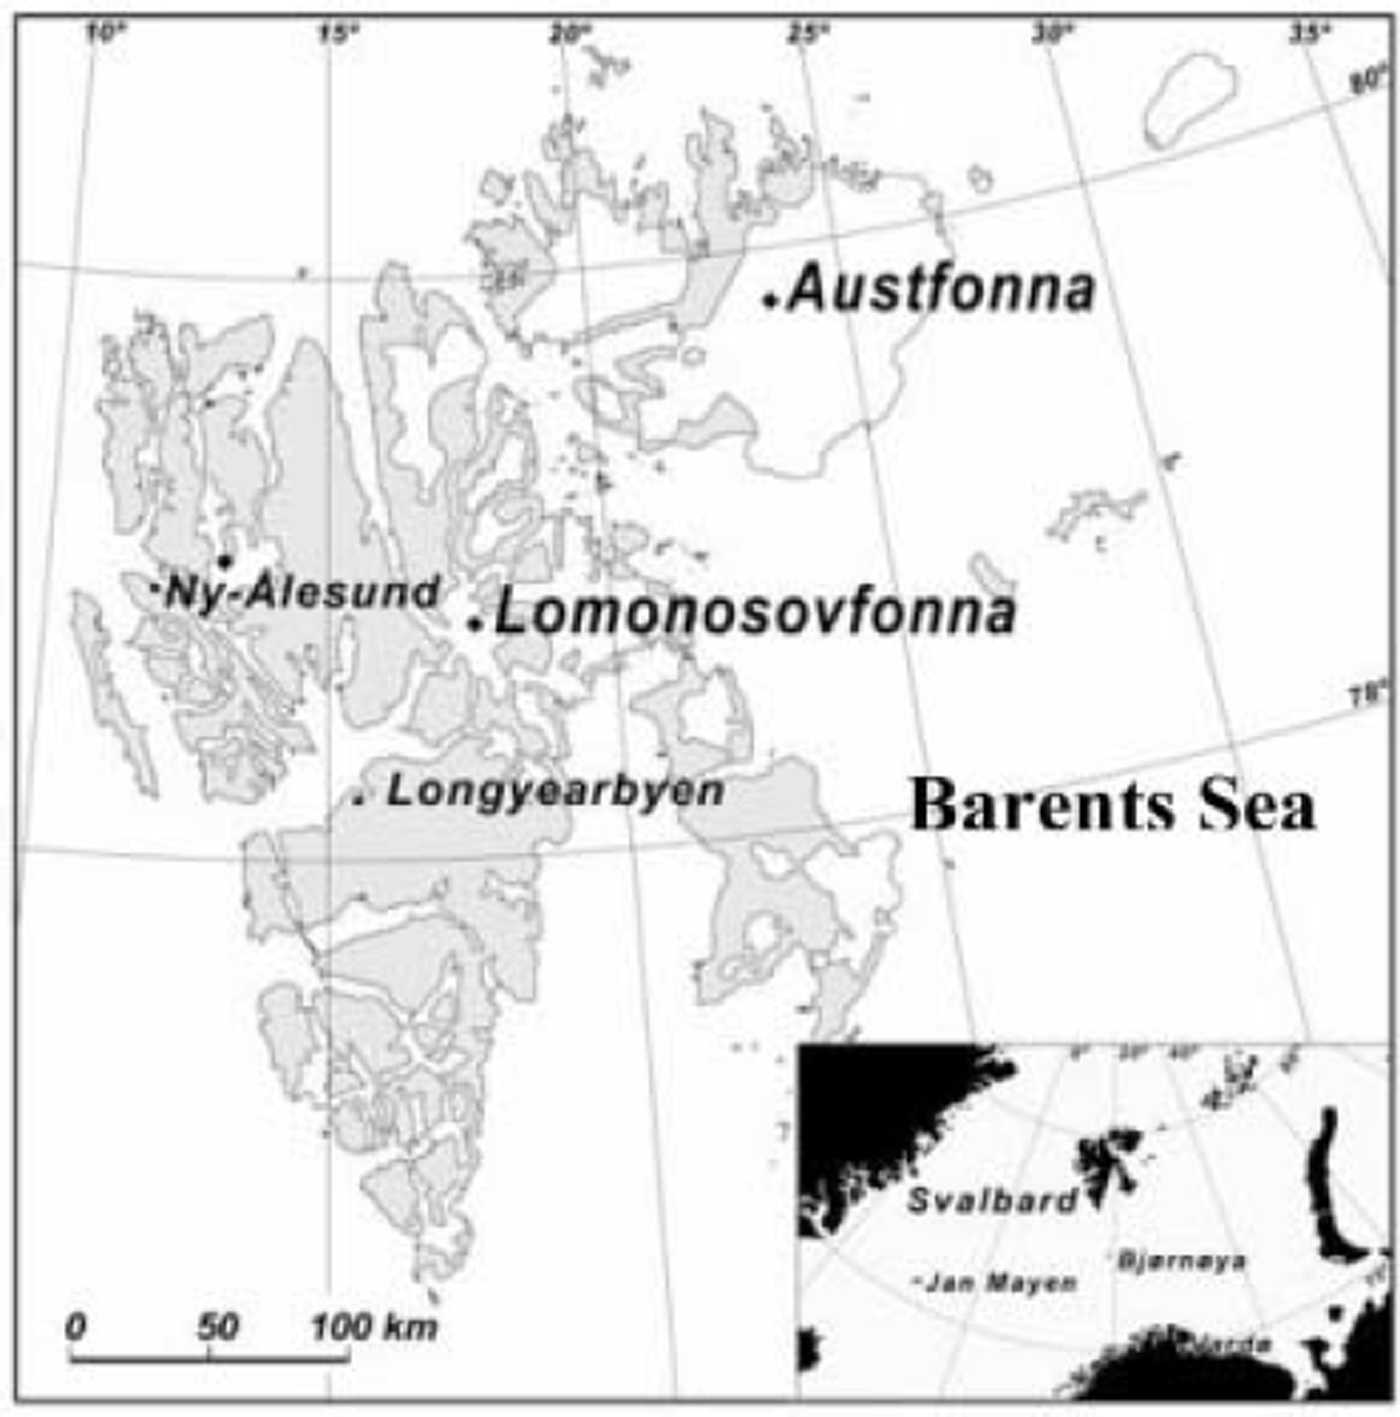
Fig. 1. Svalbard with the drill location on Lomonsovfonna. The location of the Austfonna ice core mentioned in the text is also indicated.
2. Physical Settings
Svalbard is positioned in the zone that includes both the polar ocean and atmospheric fronts between the Arctic Ocean, Nordic Seas and Barents Sea (Fig. 1). The Norwegian Current brings warm water towards the west coast of the archipelago and into the Barents Sea, and mild air is transported from lower latitudes by southerly to southwesterly winds. This creates a very mild climate over Svalbard, considering its northern position (Reference HisdalHisdal, 1998).
Temperature measurements in Svalbard started in 1911, and by combining several records from the vicinity of Longyearbyen at Isfjorden (Fig. 1) a continuous record has been created (Reference Nordli, Hanssen-Bauer and FørlandNordli and others, 1996). The most characteristic feature is the abrupt warming following a temperature minimum in 1917 that lasted until the late 1930s. After a cooler period culminating in the late 1960s, there has been a significant increase in temperature, but Svalbard is still somewhat colder than it was in the 1930s.
Sea ice has a strong effect on Svalbard climate. In a recent study using Arctic temperature records and gridded sea-ice data, a strong link was found between the local climate in Svalbard and the ice edge (Reference Benestad, Hanssen-Bauer, Skaugen and FørlandBenestad and others, 2002). This connection was particularly strong after 1950, when the quality of sea-ice data was good. The sea-ice reconstructions around Svalbard based on records from whaling and sealing ships compiled by Reference VinjeVinje (1999, Reference Vinje2001) form a valuable climatic archive. His work has shown that sea-ice variability in this area has been large and that in general the period before 1920 was characterized by heavy sea ice interrupted by periods with more modest sea-ice conditions.
In the Barents Sea, the phytoplankton Phaeocystis pouchetii dominates DMS emissions (Reference Lancelot and WassmannLancelot and Wassmann, 1994). A major bloom in the Barents Sea usually starts in late April, triggered by a combination of increases in insolation, surface water stability and nutrient input from the melting sea ice. Thus, the bloom follows the retreating sea-ice edge, and can be seen clearly on satellite images (Reference Engelsen, Hegseth, Hop, Hansen and Falk-PetersenEngelsen and others, 2002). A second bloom occurs somewhat later, in the first half of May, in the permanently ice-free southwestern part of the Barents Sea. In general, there is a positive relationship between plankton growth and warm years. In addition, plankton growth is affected by many other factors such as the position of storm tracks and the storm intensity. There is also an annual variability, which is partly related to large-scale changes such as the North Atlantic Oscillation and the El Niño–Southern Oscillation (Reference Sakshaug, Walsh, Nuttall and CallaghanSakshaug and Walsh, 2000).
3. Descriptions of the Ice Core and Analytical Methods
The 121 m deep Lomonosovfonna ice core was retrieved in April 1997 from the highest ice field in Spitsbergen (1230 m a.s.l.) and, according to ice radar measurements, extended to within a few meters of the bed. Dating with a glaciological flow model (Reference NyeNye, 1963) using the 1963 137Cs peak (Reference PinglotPinglot and others, 1999) and the Laki (Iceland) 1783 eruption as reference horizons suggests that the core contains at least 800 years of climate and environmental information (Reference KekonenKekonen and others, 2005).
The ice core was subsampled in 5 cm pieces to detect seasonal signals for the best possible dating. The analysis has involved major ions, methylsulfonate (CH3SO3 –), acidity (H+), δ18O and δD. More details on the analytical methods can be found in Reference Jauhiainen, Moore, Perämäki, Derome and DeromeJauhiainen and others (1999) and Reference IsakssonIsaksson and others (2001). Although the original ice-core signals have probably been altered to some degree by melt, our analysis suggests that annual or pseudo-annual signals are preserved (Reference PohjolaPohjola and others, 2002a), permitting the development of an annual timescale back to at least 1920 using ions (Reference IsakssonIsaksson and others, 2001), and to the early 18th century using δ18O (Reference PohjolaPohjola and others, 2002b).
To evaluate the significant trends and cycles in the data, we have used the statistical tool Significant Zero Crossings of Derivatives (SiZer) (Reference Chaudhuri and MarronChaudhuri and Marron, 1999; Reference Godtliebsen, Olsen and WintherGodtliebsen and others, 2003) on the original data smoothed at different levels. SiZer is a graphical tool that discriminates quantitatively between features that represent real underlying structure in the dataset, and features attributable to noise or sampling variability. In SiZer, significant features are found at different scales (e.g. at different levels of data smoothing).
Color coding is used to visualize the statistical significance of the data trends at various smoothing timescales. This is controlled by the size of the smoothing window (bandwidth, h) and location (x) of the signal. For each scale and location of the signal, SiZer tests whether the smoothed series has a derivative significantly different from zero.
4. Results and Discussion
The mean MSA concentration for the whole Lomonosovfonna ice core is 9.33 mg L–1 (determination limit (DL) = 0.39 mg L–1 and n = 1128). For the period 1900–97 the mean concentration is 7.43 mg L–1 (n = 325), and for 1800– 99 it is 11.72 mg L–1 (n = 278). The MSA concentrations are shown in Table 1. The complete MSA record from Lomonosovfonna is shown in Figure 2 together with the results from the SiZer analysis.
Table 1. The MSA concentration data in the Lomonosovfonna ice core for different time periods
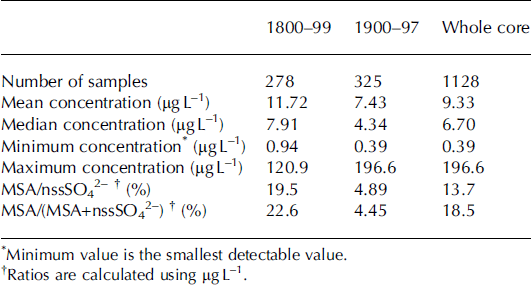
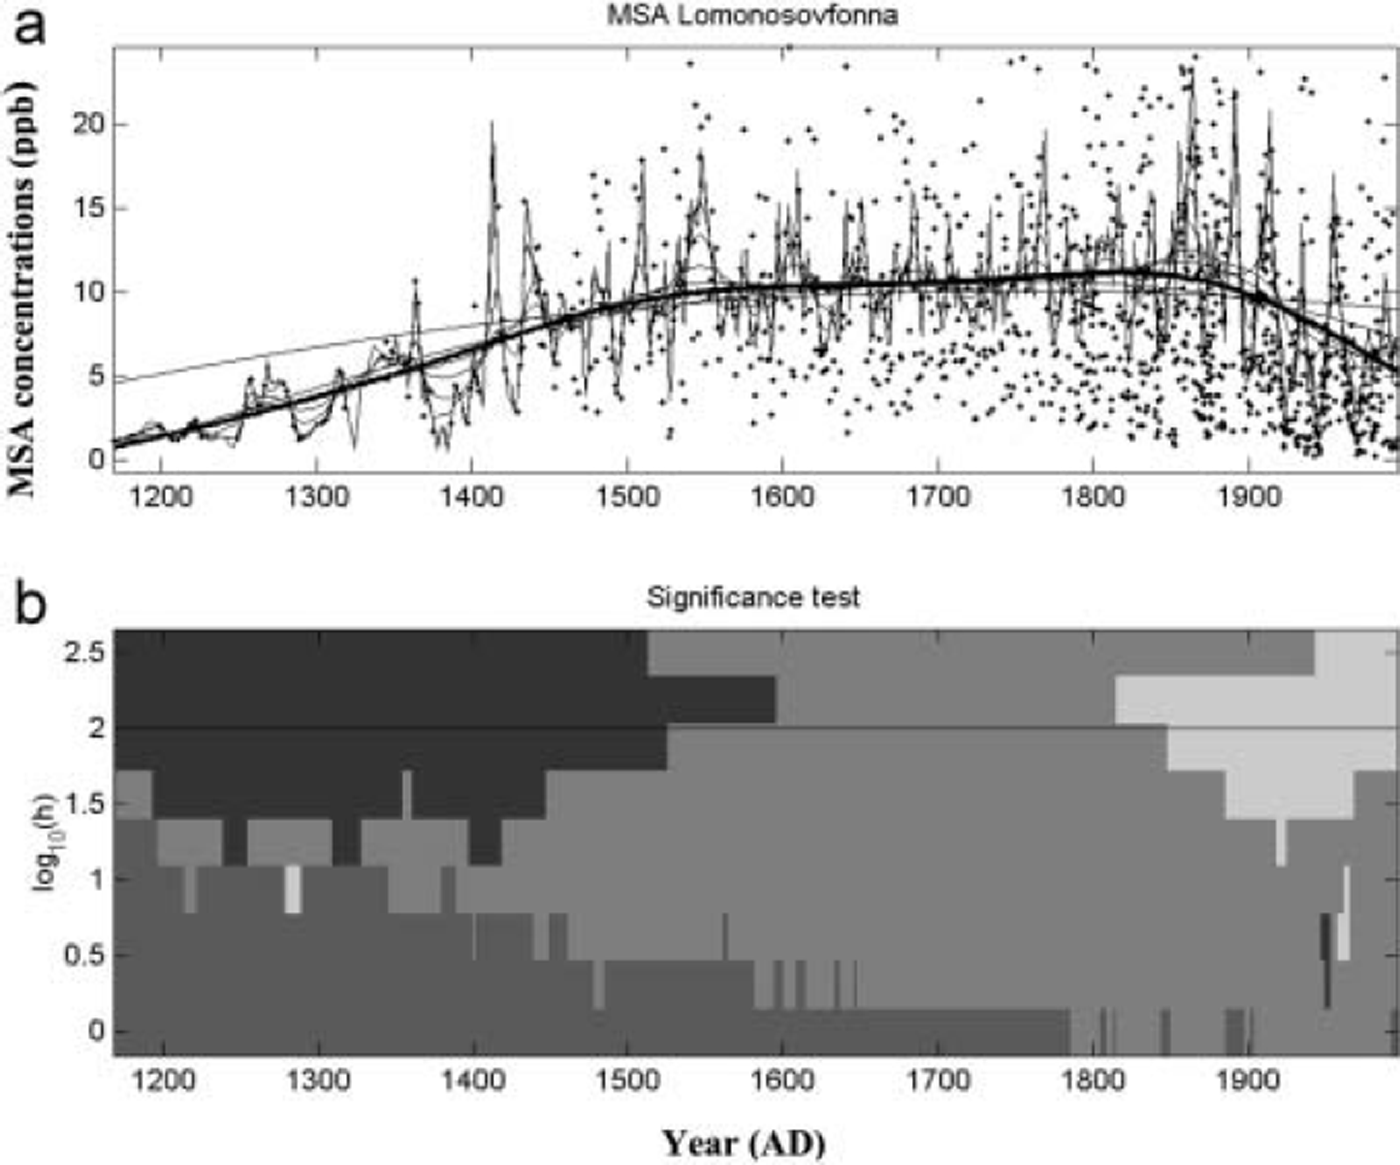
Fig. 2. (a) The MSA concentration record (in ngg –1) from Lomonosovfonna, AD1200–1997, with various smoothings. The dots shows all the data points. The thick line corresponds to the 100 year smoothing time window, indicated by a line in (b). (b) The significance of the trends at different smoothing scales (y axis) shown in a greyscale for the 90% level. h is the time window in which the smoothing operation is performed. The SiZer analysis suggests a significant increase in MSA concentrations from the beginning of the record until about AD 1600 and a decrease from about AD1800 to the present. Color coding: black: increasing trend; dark grey: not enough data; medium grey: no trend; light grey: decreasing trend.
The MSA fractions (MSA/MSA+non-sea-salt (nss) SO4 2–) range from 4% to 23% (Table 1), which are similar to those found in Greenland (Reference Whung, Saltzman, Spencer, Mayewski and GundestrupWhung and others, 1994; Reference LegrandLegrand and others, 1997) and from aerosol sampling in the atmospheric boundary layer in the ocean west of Svalbard (Reference Leck and PerssonLeck and Persson, 1996) and in Ny-Ålesund (Reference Teinilä, Hillamo, Kerminen and BeineTeinilä and others, 2003). This implies a strong influence of high-latitude sources for the MSA under present conditions.
4.1. Seasonality of MSA in recent Svalbard snow and air
In aerosol studies from Ny-Ålesund, MSA seems to peak in mid-summer (Reference Hara, Osada, Hayashi, Matsunaga and IwasakaHara and others, 1997), most likely due to the phytoplankton bloom west of Svalbard. Furthermore, the marine air masses from the west have higher concentrations of MSA and sea salts than the colder, drier Barents Sea air, and during some winter months MSA was found in air associated with coarser particles, suggesting transport from middle latitudes (Reference Hara, Osada, Hayashi, Matsunaga and IwasakaHara and others, 1997). In another study, no MSA was found above the detection limit during the polar night (Reference Teinilä, Hillamo, Kerminen and BeineTeinilä and others, 2003).
Snow-pit studies performed during two winters on Lomonosovfonna show that high concentrations of MSA begin to appear in the snow in April (K. Virkkunen, unpublished information) at the same time as the start of the algae bloom. Prevailing easterly winds suggest that conditions in the Barents Sea should have a strong influence on the amount of MSA deposited on Lomonosovfonna.
4.2. The MSA record after 1900
As already mentioned, our previous work has shown that the MSA and the sea-ice records over the 1920–97 period are closely related (Reference O’DwyerO’Dwyer and others, 2000). MSA concentrations appear to be higher for warm years with reduced ice cover in the Barents Sea, which is probably related directly to the availability of a productive source, where less sea ice and warmer water promotes more DMS production and thus more MSA. A greater influx of Atlantic water in low-sea-ice years may be responsible for this. Analysis by Reference O’DwyerO’Dwyer and others (2000) suggests that MSA concentrations in Lomonosovfonna snow correlate better with Barents Sea SST and ice cover than with conditions west of Svalbard. The same study also hypothesized that MSA might indirectly reflect larger-scale changes in the region via Atlantic Ocean input driven by the positive state of the Arctic Oscillation increasing the inflow of warm Atlantic water to the Barents Sea (Reference DicksonDickson and others, 2000). Thus, previous results suggested that MSA variations may be used as a proxy for past local climate changes on a decadal scale.
There is a close relationship between nssSO4 2– and MSA concentrations after about 1920 (R = 0.7) (Reference KekonenKekonen and others, 2005) (Fig. 3), whereas between 1900 and 1920 there is no correlation.
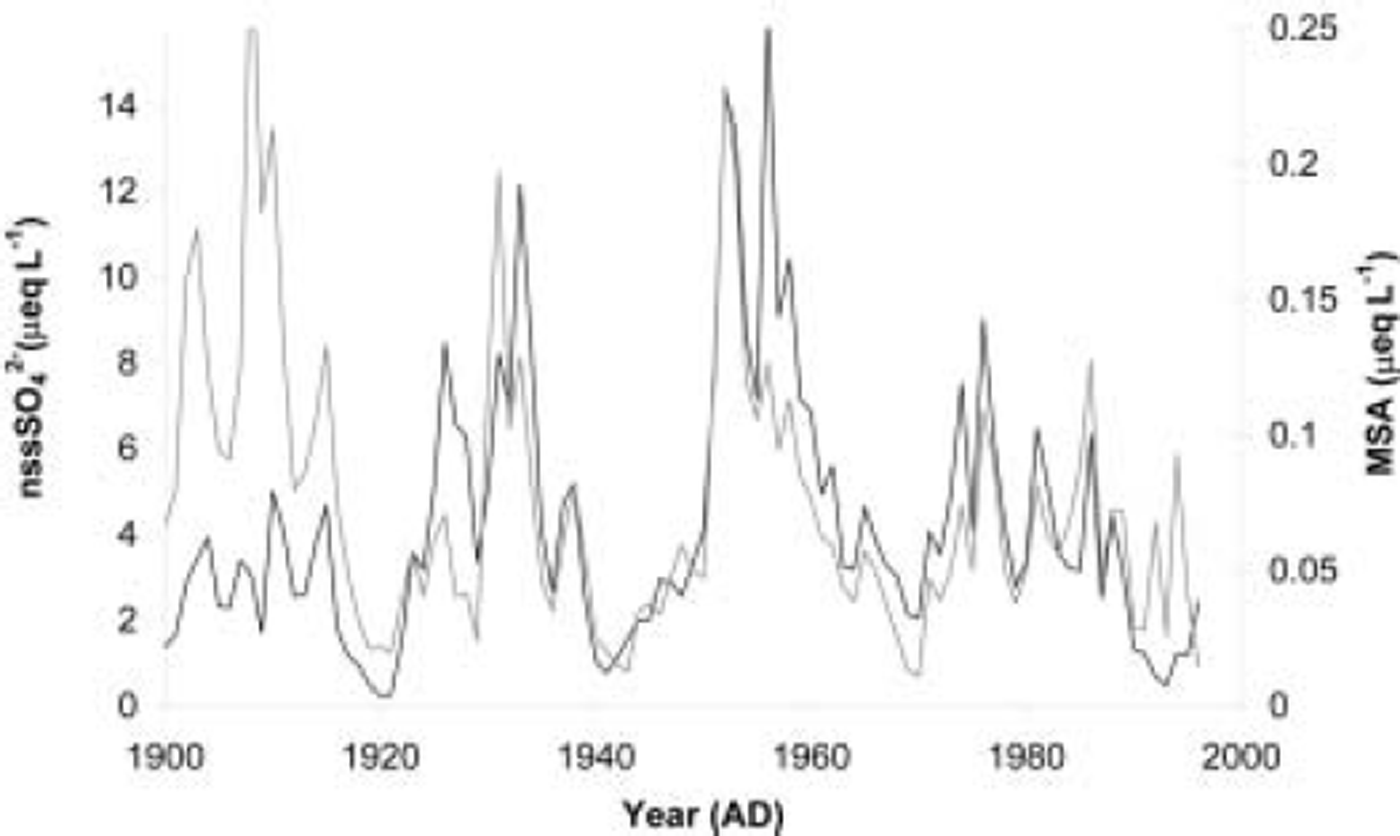
Fig. 3. The relationship between nssSO42– (black line) and MSA (grey line) concentrations, 1920–97.
4.3. The MSA record before 1900
The MSA record shows that the highest concentrations occurred during the mid-19th century (Fig. 2). The SiZer analysis suggests that there was a significant increase in MSA concentrations from the beginning of the record to about AD 1600 and a significant decrease after about AD 1800 (Fig. 2). The decadal MSA and nssSO4 2– concentration profiles show relatively weak correlations during the 19th century (R = 0.6) (Fig. 3), but their ratio is different compared with the post-1920 period. MSA/nssSO42- ratios are 19.5% during the 19th century, and 2.5% from 1920 to 1997 (Fig. 4a). During the 17th and 18th centuries, there are no correlations between MSA and nssSO42- (Fig. 4b). During the 15th and 16th centuries, weak correlations are evident, but the reduced correlations are probably due to post-depositional movement rather than climatic reasons because other ions are also weakly correlated with MSA (Reference KekonenKekonen and others, 2005).
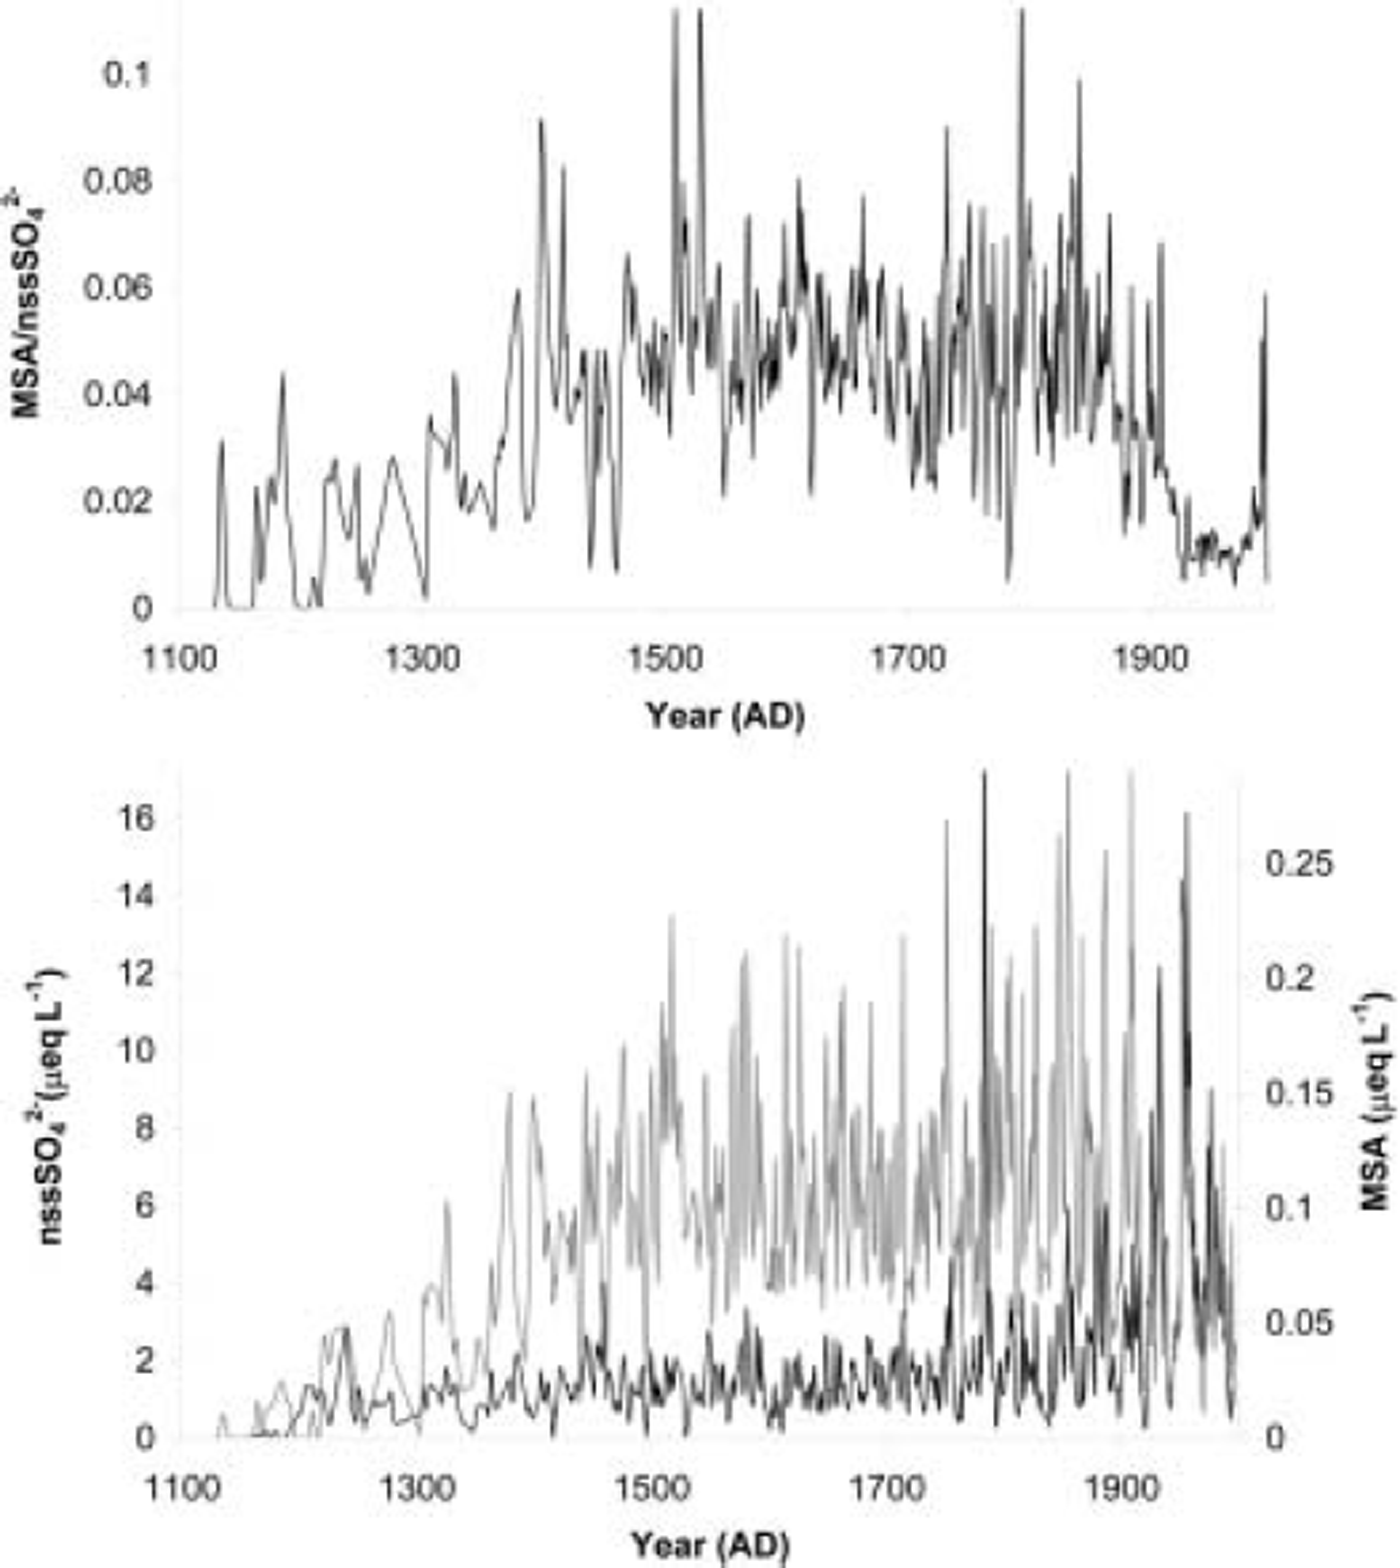
Fig. 4. (a) The MSA/nssSO42– ratio over the whole time period in the ice core. (b) The nssSO42– (black line) and MSA (grey line) concentrations over the whole core length.
The deepest 10 m of the ice core, dated to the period AD ∼1200-1400, shows low MSA concentration and has a very different character than the rest of the core. All the ions except ammonium have anomalously low concentrations. Possible explanations for this include migration of ions from the deepest and warmest ice to the bed, or loss of ions in the original snowpack caused by warm conditions prior to about 1300. Calculations of likely flow rates to the bed and snow-pit analyses over recent seasons suggest that loss of ions by runoff from the original snowpack is the most likely explanation (Reference KekonenKekonen and others, 2005). However, we want to emphasize that this only applies to the lowermost part of the ice core and does not affect the trends we are discussing in this paper.
Because the sea ice was more extensive before 1920 (Reference VinjeVinje, 2001) (Fig. 5), the negative MSA–sea-ice relationship after 1920 does not apply before 1920. Despite the higher sea-ice concentrations, the MSA concentrations were more than twice as high before 1920 as after 1920. Since this is not true for all the ion species (Reference KekonenKekonen and others, 2005), it is not purely an effect of more vigorous circulation, as has been suggested for the atmosphere over Greenland during the Little Ice Age (Reference O’Brien, Mayewski, Meeker, Meese, Twickler and WhitlowO’Brien and others, 1995; Reference Kreutz, Mayewski, Meeker, Twickler, Whitlow and PittalwalaKreutz and others, 1997), nor can it be an effect of changes in accumulation rate, since our accumulation record does not suggest any such increase (Reference PohjolaPohjola and others, 2002b).
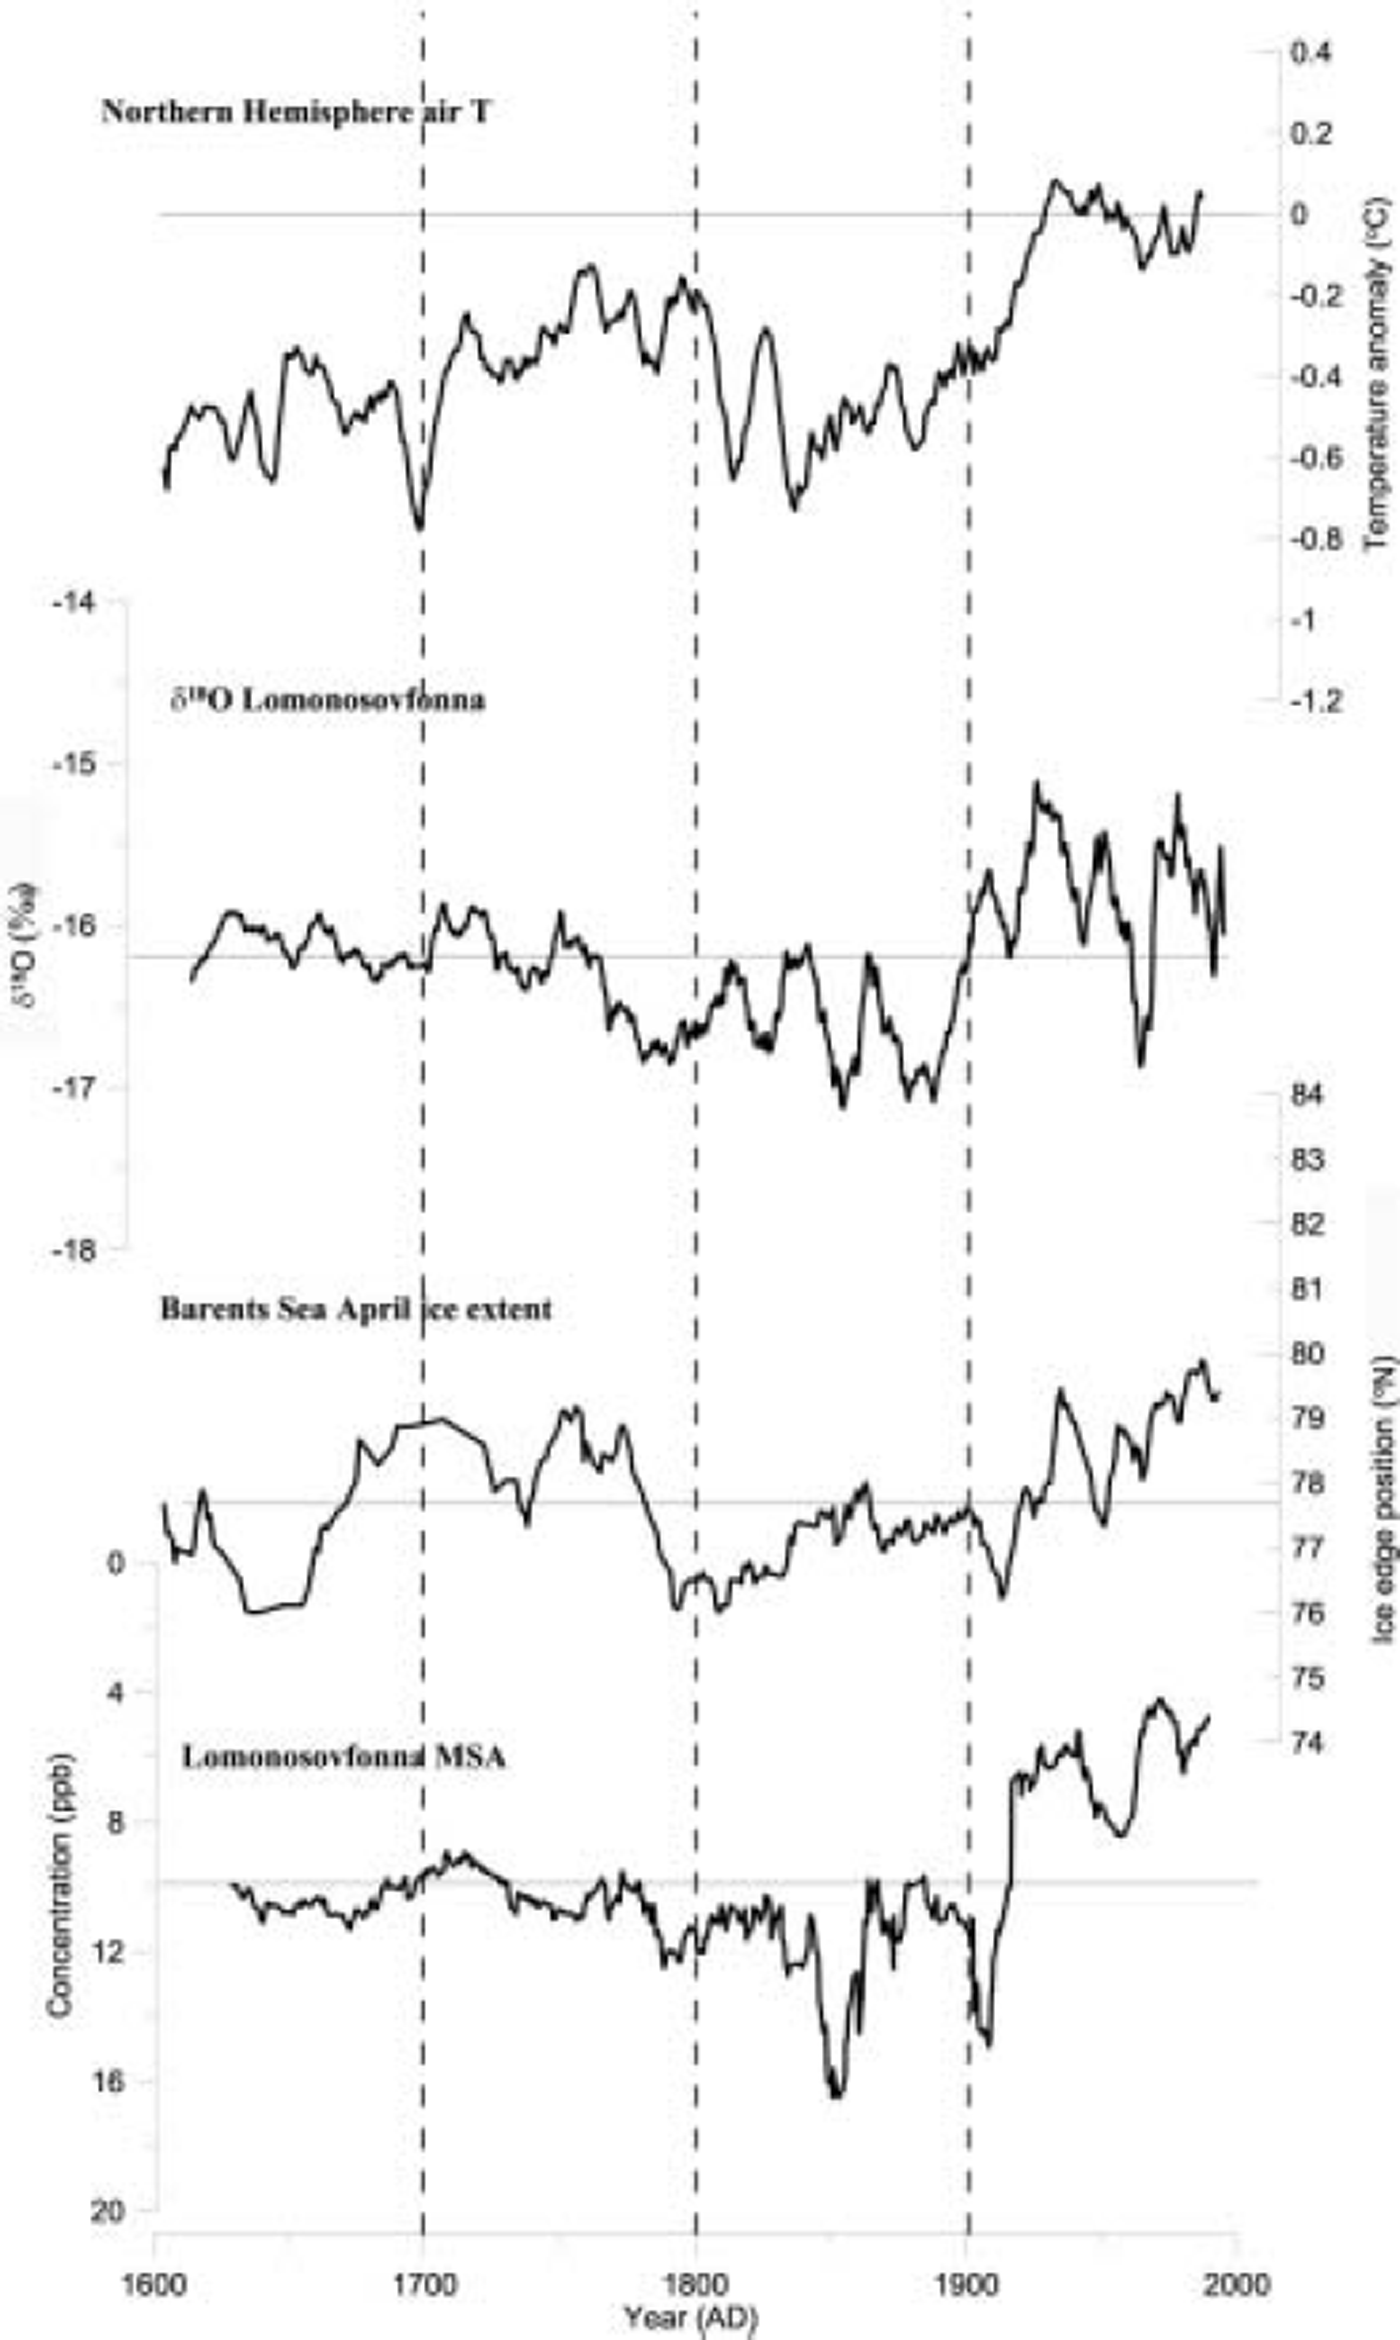
Fig. 5. Comparisons of the δ18O (Reference IsakssonIsaksson and others, 2003) and MSA records from Svalbard, sea ice from the Barents Sea (Reference VinjeVinje, 1999) and Northern Hemisphere air-temperature anomaly record (Reference Jones, Briffa, Barnett and TettJones and others, 1998). All records are smoothed to an equivalent of a 10year running mean.
There could be many possible reasons for the concentration pattern we find, and below we discuss the ones we find most likely.
Source change
Because sea-ice conditions were more severe during the 19th than during the 20th century (Fig. 5), it is possible that there was a stronger contribution from a DMS source in mid-latitudes with higher production than in Arctic waters. The decrease in MSA over the last 200 years is in agreement with the high-resolution MSA record from the Greenland interior (Reference Whung, Saltzman, Spencer, Mayewski and GundestrupWhung and others, 1994; Reference LegrandLegrand and others, 1997) (Fig. 6), suggesting that there may have been a common source and/or similar mechanisms at work on Svalbard as well. Because the Greenland sites are at high elevations, it is likely that the source is partly local (the Greenland Sea) and partly distant (mid-latitudes) (Reference LegrandLegrand and others, 1997 and references therein). In this context, it is of interest to note that Reference FischerFischer (2001) found a 30% enhanced sea-salt concentration during the 19th century in ice cores from North Greenland. Recent weather patterns suggest that the Pacific is an important source region for North Greenland, and Reference FischerFischer (2001) proposes that the sea-salt increase during the 19th century was related to an enhancement of sea-salt export from the Pacific. Also, Reference Kahl, Martinez, Kuhns, Davidson, Jaffrezo and HarrisKahl and others (1997) concluded, based on trajectory studies, that long-range transport might be responsible for increased MSA aerosols in the air. As already mentioned, the present conditions indicate the highest MSA concentrations in the air at Ny-Ålesund with westerly winds (Reference Hara, Osada, Hayashi, Matsunaga and IwasakaHara and others, 1997). The similarities between Greenland and Svalbard data may also reflect large-scale changes in marine productivity or in the oxidative capacity of the atmosphere (Reference LegrandLegrand and others, 1997).
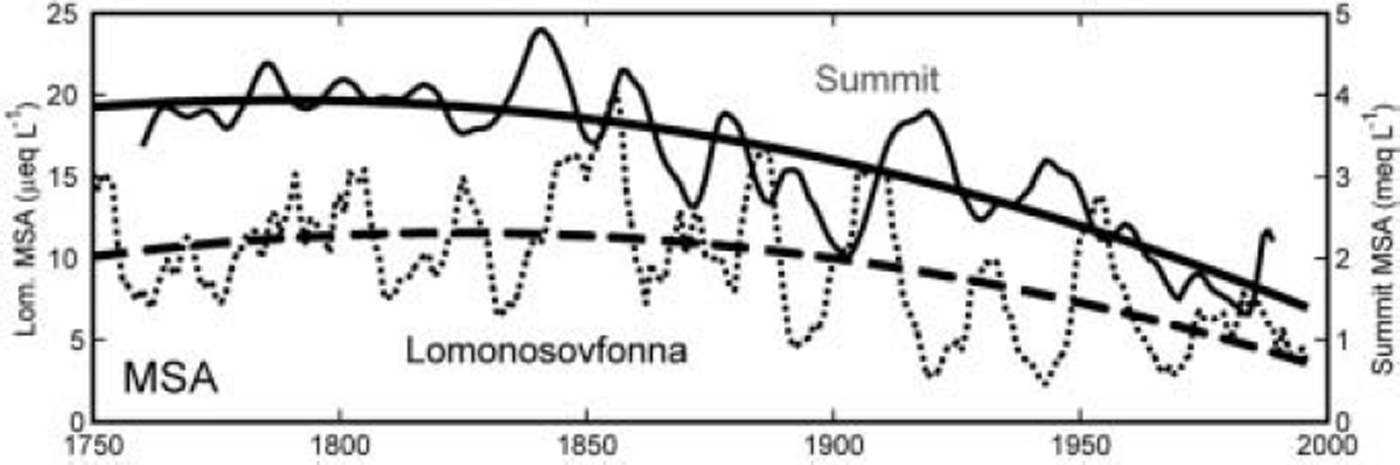
Fig. 6. The smoothed MSA records from Lomonosovfonna (stippled) and Summit (black), Greenland (Reference LegrandLegrand and others, 1997). Both records show a decrease from the mid-19th century to the present, suggesting that this might be a regional signal.
Sea ice
As already mentioned, the highest concentrations of DMS are found in open water at the ice edge, and the lowest concentrations occur beneath heavy pack ice under present conditions in the Arctic Ocean (Reference Leck and PerssonLeck and Persson, 1996). Thick ice cover prevents biogenic production, but the increased meltwater release from the sea ice during spring and summer increases the stability of the water column. This holds the phytoplankton in the euphotic zone, and, in combination with the favorable light conditions, creates a highly productive environment (e.g. Reference Sakshaug, Walsh, Nuttall and CallaghanSakshaug and Walsh, 2000). Therefore, it is likely that an increased length of the ice edge would cause increased biomass production. In addition, it is possible that, given the generally colder temperatures, the sea ice was also thicker. This would lead to increased production of meltwater and thus favorable conditions for the phytoplankton.
Storminess
Under the present conditions, there is a positive relationship between storm activity and primary production in Atlantic waters due to increased vertical mixing (Reference Sakshaug, Walsh, Nuttall and CallaghanSakshaug and Walsh, 2000 and references therein). If this was true for the past, the more stormy conditions that supposedly prevailed during the 19th century (Reference LambLamb, 1995) may have increased DMS production and may have also increased aerosol incorporation. However, since the sea-salt records do not show such increased concentrations during this period (Reference KekonenKekonen and others, 2005), it seems more plausible that the MSA increase is due to increased primary productivity. However, present atmospheric aerosol measurements of MSA at Ny-Ålesund suggest that MSA is not affected by increased cyclonic activity in the same way as sea salts, and that high concentrations of MSA are associated with warm, humid storm conditions (Reference Hara, Osada, Hayashi, Matsunaga and IwasakaHara and others, 1997). Cyclonic storm conditions increase the coarse fraction of sea salt but not MSA, and the abundance of MSA in the dark winter months is due to transport from mid-latitudes (Reference Hara, Osada, Hayashi, Matsunaga and IwasakaHara and others, 1997).
Seasonality
A change of storm season could directly affect the incorporation of DMS into the atmosphere. More prevalent storms in the spring/summer season during the 19th century but more frequent winter storms in the 20th century would explain the higher MSA concentrations in the 19th-century ice. However, one can assume that this would also affect other ions, and there is no such indication (Reference KekonenKekonen and others, 2005). Another scenario could be a longer emission season for DMS due to favorable conditions, i.e. melting sea ice. With the data available, it is difficult to find such evidence in our cores.
Change in branching ratio
Colder air temperatures favor MSA oxidation which changes the branching ratio (Reference Seinfeld and PandisSeinfeld and Pandis, 1998). Since the air temperatures were lower in the 19th century than after 1920, this may explain the higher MSA concentrations in the ice-core data before 1920. MSA/nssSO4 2– ratios are clearly different after 1920 (2.47%) than during the 19th century (19.5%) (Fig. 4a). However, increases in nssSO4 2– concentrations after 1920 are also affected by anthropogenic sources.
After considering the above possibilities, we believe that the most plausible explanations for the high MSA concentrations during the 19th century are a change of source and/ or more favorable growing conditions for the DMS-producing algae in a more extensive sea-ice environment. Reference VinjeVinje (2001) suggested that the April sea-ice extent has decreased by 33% since 1864. That decrease coincides with the high MSA concentrations in the ice cores (Fig. 5) and it is therefore tempting to believe that sea ice and MSA are connected.
4.4. Discussion
As mentioned in the introduction, the relationship between MSA and sea ice has been discussed in several papers concerned with recent conditions in Antarctica. When comparing MSA records from different ice cores, it is evident that the transfer function between DMS production and the MSA in ice cores is not straightforward. Most recently, Reference Curran, van Ommen, Morgan, Phillips and PalmerCurran and others (2003) found a clear positive correlation between the MSA record from Law Dome and local sea-ice extent. Reference Welch, Mayewski and WhitlowWelch and others (1993) found a positive relationship between MSA and sea-ice extent in the Ross Sea, while Reference Pasteur, Mulvaney, Peel, Saltzman and WhungPasteur and others (1995) found the opposite effect when comparing an ice core from the Antarctic Peninsula with the Weddell Sea ice. On the glacial-to-interglacial scale, the MSA was higher during glacial times in the Vostok ice core (Reference Legrand, Delmas and CharlsonLegrand and others, 1988). This has been attributed to more favorable conditions for DMS-producing Phaeocystis pouchetii (Reference Gibson, Garrick, Burton and McTaggartGibson and others, 1989) with extensive sea ice. In contrast, ice cores from Greenland suggest lower MSA during glacial times (Reference Hansson and SaltzmanHansson and Saltzman, 1993), possibly related to sea-ice cover over local DMS-producing sources.
The δ18O records from both Lomonosovfonna and Austfonna suggest that the 19th century was the coldest during the past 600 years (Reference IsakssonIsaksson and others, 2003), as is also the case for other proxy records of air temperatures (Reference Jones, Briffa, Barnett and TettJones and others, 1998) (Fig. 5). A comparison of the ice-core and sea-ice records suggests that sea-ice extent and Austfonna δ18O are related over the past 400 years (Reference IsakssonIsaksson and others, 2003). This may reflect the position of the storm tracks and their direct influence on the relatively low-altitude Austfonna. Lomonosovfonna may be less sensitive to such changes and may primarily record atmospheric changes due to its higher elevation. Thus, it appears that lower-altitude ice cores might better reveal a sea-ice connection, although currently there are relatively few such records available. In a study of sulfate and MSA in air and snow at two sites on Greenland, the variations of the MSA concentrations did not differ between a coastal and an inland site (Reference Jaffrezo, Davidson, Legrand and DibbJaffrezo and others, 1994). Svalbard ice cores might, together with some of the other lower-lying Arctic ice caps such as Zemlya Frantsa Iosifa and Severnaya Zemlya, provide a link between MSA and sea ice.
There is variability on a 20–25 year scale in the MSA data from about 1800 to the present. Such variations have also been described from Greenland ice cores, and no correspondence with known climatic oscillations has been found there (Reference Whung, Saltzman, Spencer, Mayewski and GundestrupWhung and others, 1994). At this point, we do not have any good suggestion to explain this 20–25 year variability.
Clearly, more knowledge about the whole DMS–MSA oxidative process, the incorporation of MSA into air–snow, and the depositional and post-depositional process is required (cf. Reference Pasteur and MulvaneyPasteur and Mulvaney, 1999).
5. Conclusions
The exploration of MSA records from one Svalbard ice core suggests that sea-ice extent has a dominant effect on MSA concentrations in the snow/ice. The ice core suggests lower MSA concentrations during the 20th century than during the 19th century. Between 1920 and 1997, there is a negative correlation between sea ice, SST in the Barents Sea and MSA on sub-decadal scales in the Lomonosovfonna snow, but our data suggest that, before 1920, sea ice affected MSA in a positive direction, i.e. periods with large sea-ice extent coincide with high MSA content in Svalbard snow. The same general pattern is apparent in the available MSA data from Greenland spanning the same time period, suggesting that MSA reflects processes on a regional scale. However post-depositional processes modify the local records, making detailed comparisons impossible.
Acknowledgements
We thank all the people who, in various ways, helped to make the Lomonosovfonna ice-coring project possible. Logistical support came from the Norwegian Polar Institute (NPI) in Longyearbyen, and financial support came from the NPI, the Norwegian Research Council, the Finnish Forest Research Institute in Rovaniemi, the Finnish Global Change Research Program (FIGARE) of the Finnish Academy, and the Nordic Arctic Research Program (NARP). We thank P. Wassman and K. Holmén for helpful discussions during the preparation of this paper, and J. Kohler for assistance with SiZer. Helpful comments from F. Koerner, P. Mayewski, I. Willis and J. Jania (Scientific Editor) improved the final version of this paper.


