


1. Introduction
As the need for sustainable energy sources continues to rise, more attention has been paid to tidal flow energy due to its high predictability and abundance when compared with other sources like wind and solar (Uihlein & Magagna Reference Uihlein and Magagna2016; Khare & Bhuiyan Reference Khare and Bhuiyan2022). Research into hydrokinetic turbine technologies has grown in the past decade (Xiao & Zhu Reference Xiao and Zhu2014; Young, Lai & Platzer Reference Young, Lai and Platzer2014) due to their promise as tidal flow energy extraction devices, as well as for the fluid phenomena that govern their behaviour. The main types of tidal energy-harvesting turbines are horizontal axis rotary turbines (HATs), vertical axis rotary turbines (VATs) and oscillating foil turbines (OFTs). Both HATs and VATs have some significant disadvantages such as high rotational speeds that can affect local wildlife and a tendency to biofoul. In addition, HATs create messy wakes that interfere with downstream turbines, a crucial issue for efficient array deployments.
First proposed by McKinney & DeLaurier (Reference McKinney and DeLaurier1981), OFTs extract energy using a wing that moves with a coupled heaving and pitching motion in an oscillating manner with respect to an oncoming flow. The motion can be prescribed (Karakas & Fenercioglu Reference Karakas and Fenercioglu2016; Kim et al. Reference Kim, Strom, Mandre and Breuer2017), semi-passive (Su & Breuer Reference Su and Breuer2019; He et al. Reference He, Mo, Gao, Wang, Zhang, Yang and Mao2022a ) or fully passive (Oshkai et al. Reference Oshkai, Iverson, Lee and Dumas2022; Zhao et al. Reference Zhao, Jiang, Wang, Qadri, Li and Tang2023), depending on how much of the kinematics are directly controlled. The OFT takes advantage of unsteady force generation, where lift, force and pitching moments are generated during the oscillation cycle. The high angle of attack achieved results in the turbines operating within the dynamic stall regime, with flow separation a prominent feature and strong coherent vortices generated during the oscillation cycle. Kinsey & Dumas (Reference Kinsey and Dumas2008) and Simpson (Reference Simpson2009) identified that highly loaded cases see strong leading-edge vortices (LEVs) formed on the suction side of the foil, resulting in a low-pressure region that induces additional lift on the foil.
Although single-foil performance has been well characterised (Kinsey & Dumas Reference Kinsey and Dumas2008; Kim et al. Reference Kim, Strom, Mandre and Breuer2017), array configurations are an area of significant research interest (Kinsey & Dumas Reference Kinsey and Dumas2012; Ribeiro et al. Reference Ribeiro, Su, Guillaumin, Breuer and Franck2021; Zheng & Bai Reference Zheng and Bai2022; Zhao et al. Reference Zhao, Jiang, Wang, Qadri, Li and Tang2023). An important characteristic of OFT design is the structured wake that develops behind the hydrofoil. In comparison with a rotary turbine, whose wake is characterised by a cylindrical ‘sheath’ of blade tip vortices (Massouh & Dobrev Reference Massouh and Dobrev2007), the wake behind an OFT develops into an unsteady vortex-dominated flow akin to the von Kármán vortex street (Simpson Reference Simpson2009). This vortex-dominated wake is characterised by a single primary LEV being advected every oscillation stroke that remains coherent several chord lengths downstream. Multiple studies have looked at the wake topology of oscillating foils and, although the focus has been primarily on thrust-producing regimes, similar wake topology characteristics could have important effects for OFT arrays. Notably, Verma & Hemmati (Reference Verma and Hemmati2021) studied the evolution of the wake behind a heaving and pitching foil within a thrust regime and identified a performance setting where the foil operated with high efficiency but low thrust at a low Strouhal number, and which corresponded to cases where wake vortices interacted and coalesced. They observed a second low-efficiency but high-thrust setting that displayed minimal vortex interactions in the wake. In a subsequent oscillating foil study, Verma & Hemmati (Reference Verma and Hemmati2024) characterised the transition of the primary and secondary LEVs to hairpin vortex groups according to an increasing chord-based Strouhal number in propulsive regimes. In a combined numerical and experimental study, Gao et al. (Reference Gao, Cantwell, Son and Sherwin2023) looked at the transition and force characteristics of a purely plunging foil at a fixed angle of attack. They noted that the interaction between the LEV and trailing-edge vortex (TEV) was the mechanism responsible for the three-dimensional transition of the wake.
The impact on performance due to the effects of vortex-dominated wakes interacting with downstream turbines is an important consideration for the successful development of efficient turbine arrays. While a HAT array will have downstream turbines always negatively impacted by interactions with an upstream turbine’s wake (Kuang et al. Reference Kuang, Katsuchi, Zhou, Chen, Han, Zhang, Wang, Bao, Cao and Liu2023), other types of turbines, such as VATs and OFTs, can harness wake–foil interactions to improve array performance. The similar phenomenon of fish schooling and hydrodynamic interactions in swimmer arrays has been studied extensively (Ramananarivo et al. Reference Ramananarivo, Fang, Oza, Zhang and Ristroph2016; Newbolt, Zhang & Ristroph Reference Newbolt, Zhang and Ristroph2019; Li et al. Reference Li, Nagy, Graving, Bak-Coleman, Xie and Couzin2020; Wei et al. Reference Wei, Hu, Li and Shi2023; Gungor, Khalid & Hemmati Reference Gungor, Khalid and Hemmati2024). Improving array performance by optimising wake–turbine interactions has been studied extensively in VATs. Inspired by the schooling phenomenon, Whittlesey, Liska & Dabiri (Reference Whittlesey, Liska and Dabiri2010) proposed a VAT array design using a potential flow model that optimised the turbines’ spatial arrangement to increase array performance. Following from this study, Dabiri (Reference Dabiri2011) studied an array of counter-rotating vertical axis wind turbines (VAWTs) and was able to achieve improved power output per unit area when compared with traditional arrays. This was achieved by optimally arranging VAWTs such that they are able to extract energy from nearby turbine wakes. In a later study, Howland, Lele & Dabiri (Reference Howland, Lele and Dabiri2019) tested wake steering in VAWTs to deflect a turbine’s wake from downstream turbines and reduce power production variability. Scherl et al. (Reference Scherl, Strom, Shang, Williams, Polagye and Brunton2020) optimised the array geometry, control and turbine rotation direction of a pair of VATs and found that performance increases were achieved due to beneficial mean and periodic flow alterations or blockage.
Harnessing wake–foil interactions to improve an array’s energy-harvesting performance depends on properly tuning the turbines’ kinematic parameters. In a tandem foil configuration, these parameters are the reduced frequency, $f^*$
, the inter-foil phase,
$f^*$
, the inter-foil phase, $\psi _{1-2}$
, and the inter-foil distance,
$\psi _{1-2}$
, and the inter-foil distance, $S_x$
(Kinsey & Dumas Reference Kinsey and Dumas2012; Karakas & Fenercioglu Reference Karakas and Fenercioglu2016; He et al. Reference He, Yang, Mo, Zhao, Wang and Ghassemi2022b
). Tuning these parameters affects the timing of interactions, the magnitude of these effects and ultimately the performance of both foils in the array. Notably, an optimal range for a single foil’s reduced frequency has been identified by several groups in the literature as
$S_x$
(Kinsey & Dumas Reference Kinsey and Dumas2012; Karakas & Fenercioglu Reference Karakas and Fenercioglu2016; He et al. Reference He, Yang, Mo, Zhao, Wang and Ghassemi2022b
). Tuning these parameters affects the timing of interactions, the magnitude of these effects and ultimately the performance of both foils in the array. Notably, an optimal range for a single foil’s reduced frequency has been identified by several groups in the literature as $0.1\lt f^*\lt 0.15$
, lower than that of foils oscillating for propulsion. This was explored extensively by several groups including Kinsey & Dumas (Reference Kinsey and Dumas2008), Simpson (Reference Simpson2009) and Zhu (Reference Zhu2011) and later Kim et al. (Reference Kim, Strom, Mandre and Breuer2017), who noted the role of
$0.1\lt f^*\lt 0.15$
, lower than that of foils oscillating for propulsion. This was explored extensively by several groups including Kinsey & Dumas (Reference Kinsey and Dumas2008), Simpson (Reference Simpson2009) and Zhu (Reference Zhu2011) and later Kim et al. (Reference Kim, Strom, Mandre and Breuer2017), who noted the role of $f^*$
in stabilising the LEV formed on the foil during the high-velocity portion of its heaving cycle, resulting in increased performance. In an effort to combine the main parameters affecting the timing of wake interactions into a predictive quantity, Kinsey & Dumas (Reference Kinsey and Dumas2012) proposed the global phase parameter. Their results only showed a consistent optimal global phase across cases with similar maximum effective angles of attack. They noted that their global phase lacked information about the wake velocity faced by the downstream foil, which led to different cases presenting a different optimal phase alignment. Xu & Xu (Reference Xu and Xu2017) studied configurations using potential flow theory and observed a different optimal phase from that of Kinsey and Dumas. Ribeiro et al. (Reference Ribeiro, Su, Guillaumin, Breuer and Franck2021) studied tandem arrays computationally and experimentally by separating different cases into wake regimes, a characterisation based on the maximum effective angle of attack and the structure of the wake behind the leading foil. In follow-up work, Ribeiro & Franck (Reference Ribeiro and Franck2023) were able to identify and classify further wake patterns from simulation results of oscillating hydrofoil turbines through a machine learning approach. Su (Reference Su2019) introduced a modified global phase parameter that, based on particle image velocimetry (PIV) measurements, incorporated a decelerated wake velocity with respect to the free stream. Ribeiro et al. (Reference Ribeiro, Su, Guillaumin, Breuer and Franck2021) similarly modified the global phase parameter from Kinsey & Dumas (Reference Kinsey and Dumas2012) and proposed the wake phase parameter, given by
$f^*$
in stabilising the LEV formed on the foil during the high-velocity portion of its heaving cycle, resulting in increased performance. In an effort to combine the main parameters affecting the timing of wake interactions into a predictive quantity, Kinsey & Dumas (Reference Kinsey and Dumas2012) proposed the global phase parameter. Their results only showed a consistent optimal global phase across cases with similar maximum effective angles of attack. They noted that their global phase lacked information about the wake velocity faced by the downstream foil, which led to different cases presenting a different optimal phase alignment. Xu & Xu (Reference Xu and Xu2017) studied configurations using potential flow theory and observed a different optimal phase from that of Kinsey and Dumas. Ribeiro et al. (Reference Ribeiro, Su, Guillaumin, Breuer and Franck2021) studied tandem arrays computationally and experimentally by separating different cases into wake regimes, a characterisation based on the maximum effective angle of attack and the structure of the wake behind the leading foil. In follow-up work, Ribeiro & Franck (Reference Ribeiro and Franck2023) were able to identify and classify further wake patterns from simulation results of oscillating hydrofoil turbines through a machine learning approach. Su (Reference Su2019) introduced a modified global phase parameter that, based on particle image velocimetry (PIV) measurements, incorporated a decelerated wake velocity with respect to the free stream. Ribeiro et al. (Reference Ribeiro, Su, Guillaumin, Breuer and Franck2021) similarly modified the global phase parameter from Kinsey & Dumas (Reference Kinsey and Dumas2012) and proposed the wake phase parameter, given by
 \begin{equation} \varPhi =2\pi \frac {S_x}{\bar {u}_p}f^*+\psi _{1-2}. \end{equation}
They showed that optimal phase alignment could be predicted across different tandem foil arrays. This parameter, which includes the average wake velocity within the swept distance directly upstream from the trailing foil, $\bar {u}_p$
, to more accurately describe the mean flow speed between the two foils in the array, gives a sense of the alignment of the trailing foil with respect to primary wake structures. Rival, Hass & Tropea (Reference Rival, Hass and Tropea2011) found two types of wake–foil interactions that resulted in either an increase or a decrease in the performance of the trailing foil. Ma et al. (Reference Ma, Wang, Xie, Han, Sun and Zhang2019) also showed how for a semi-passive system, negative vortex interactions had a more detrimental effect on system performance than the performance gained from favourable interactions. Zhao et al. (Reference Zhao, Jiang, Wang, Qadri, Li and Tang2023) did an experimental and numerical study of fully passive flapping foils in tandem configuration and found that the trailing foil always became ‘locked in’ by the wake generated from the leading foil, regardless of their initial states. They also found that the highest-efficiency cases saw the trailing foil heaving with a larger amplitude than that of the leading foil and displayed higher pitching velocities. Wang & Ng (Reference Wang and Ng2023) studied a semi-passive tandem foil array in which both foils were interconnected and operated with a spacing of
$\bar {u}_p$
, to more accurately describe the mean flow speed between the two foils in the array, gives a sense of the alignment of the trailing foil with respect to primary wake structures. Rival, Hass & Tropea (Reference Rival, Hass and Tropea2011) found two types of wake–foil interactions that resulted in either an increase or a decrease in the performance of the trailing foil. Ma et al. (Reference Ma, Wang, Xie, Han, Sun and Zhang2019) also showed how for a semi-passive system, negative vortex interactions had a more detrimental effect on system performance than the performance gained from favourable interactions. Zhao et al. (Reference Zhao, Jiang, Wang, Qadri, Li and Tang2023) did an experimental and numerical study of fully passive flapping foils in tandem configuration and found that the trailing foil always became ‘locked in’ by the wake generated from the leading foil, regardless of their initial states. They also found that the highest-efficiency cases saw the trailing foil heaving with a larger amplitude than that of the leading foil and displayed higher pitching velocities. Wang & Ng (Reference Wang and Ng2023) studied a semi-passive tandem foil array in which both foils were interconnected and operated with a spacing of $0.2c\lt S_x\lt 0.33c$
(where
$0.2c\lt S_x\lt 0.33c$
(where $c$
is the foil’s chord length). They showed how the closely inter-connected foils could leverage constructive foil–foil interactions to improve their performance, and noted that this decreased separation improved the deployment density of the array. In very recent work, Ribeiro & Franck (Reference Ribeiro and Franck2024) proposed a model to predict the efficiency of tandem foil arrays by relating the effective angle of attack and the change in instantaneous power output due to wake vortex interactions through the use of a coefficient of proportionality. They demonstrate that the model is able to predict direct vortex–foil impingement events as well as weak interactions of the trailing foil solely based on simulations of a single foil, although less accuracy is achieved at high-angle-of-attack wake regimes due to the increasing unsteadiness of the wake.
$c$
is the foil’s chord length). They showed how the closely inter-connected foils could leverage constructive foil–foil interactions to improve their performance, and noted that this decreased separation improved the deployment density of the array. In very recent work, Ribeiro & Franck (Reference Ribeiro and Franck2024) proposed a model to predict the efficiency of tandem foil arrays by relating the effective angle of attack and the change in instantaneous power output due to wake vortex interactions through the use of a coefficient of proportionality. They demonstrate that the model is able to predict direct vortex–foil impingement events as well as weak interactions of the trailing foil solely based on simulations of a single foil, although less accuracy is achieved at high-angle-of-attack wake regimes due to the increasing unsteadiness of the wake.
Previous studies have enforced the same kinematics on both foils in tandem arrays. Although this simplifies the parameter space required to seek optimal array configurations, enforcing single-foil optimal kinematics on all foils in the array might not lead to optimal system performance. The primary objective of this paper is to allow for the two foils to have different kinematics, to seek the settings that result in optimal collective energy-harvesting performance and to understand how the different foil kinematics within the array can result in improved wake–foil interactions. By prescribing the wake regimes identified by Ribeiro et al. (Reference Ribeiro, Su, Guillaumin, Breuer and Franck2021) (and further described by Ribeiro & Franck (Reference Ribeiro and Franck2023)) through the kinematics of the leading foil, we evaluate the performance of the trailing foil within each wake regime over a large range of kinematic parameters. Performance is determined from force and torque measurements obtained through experiments performed in a water flume. An overview of the performance of all array configurations tested is presented, and a determination of which kinematic configuration of each foil results in the best-performing array is given. Finally, using the average power per cycle extracted from the array and flow measurements from PIV, comparisons are made between optimal and suboptimal cases to further investigate the effects of wake–foil interactions on the system.
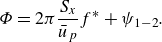
Experimental set-up.
2. Experimental methods
Figure 1 shows a diagram of the experimental set-up. Experiments were performed in an open-channel recirculating flume at Brown University with test section cross-section size of 0.8 m $\times$
0.6 m and 4 m in length. Two rectangular flat-plate hydrofoils were mounted vertically in the flow. Kim et al. (Reference Kim, Strom, Mandre and Breuer2017) tested multiple hydrofoils with different cross-sectional shapes and found that the shape of the foil did not have a significant influence on its energy-harvesting performance. Except where noted, the foils tested had a chord length of
$\times$
0.6 m and 4 m in length. Two rectangular flat-plate hydrofoils were mounted vertically in the flow. Kim et al. (Reference Kim, Strom, Mandre and Breuer2017) tested multiple hydrofoils with different cross-sectional shapes and found that the shape of the foil did not have a significant influence on its energy-harvesting performance. Except where noted, the foils tested had a chord length of $c=0.061$
m, a span of
$c=0.061$
m, a span of $b=0.366$
m and were fitted with end plates extending
$b=0.366$
m and were fitted with end plates extending $0.75c$
from the hydrofoil edge to their edge, which were used to suppress tip vortex effects. The heave and pitch motions of the hydrofoils were prescribed by using two gantry traverse systems controlled with servo motors (Parker rotary servo and AeroTech linear servo) mounted on the frame of the flume. The position of each hydrofoil was monitored independently using optical encoders (US Digital). Mounted between each traverse and foil, a six-axis force/torque transducer (ATI F/T Delta IP65) recorded force and torque at a sampling rate of 1000 Hz. The free-stream velocity was set at
$0.75c$
from the hydrofoil edge to their edge, which were used to suppress tip vortex effects. The heave and pitch motions of the hydrofoils were prescribed by using two gantry traverse systems controlled with servo motors (Parker rotary servo and AeroTech linear servo) mounted on the frame of the flume. The position of each hydrofoil was monitored independently using optical encoders (US Digital). Mounted between each traverse and foil, a six-axis force/torque transducer (ATI F/T Delta IP65) recorded force and torque at a sampling rate of 1000 Hz. The free-stream velocity was set at $0.33$ $\mathrm{m\,s{^-{^1}}}$
, measured with an acoustic Doppler velocimeter (Nortek Vectrino) positioned upstream, yielding a chord Reynolds number of
$\mathrm{m\,s{^-{^1}}}$
, measured with an acoustic Doppler velocimeter (Nortek Vectrino) positioned upstream, yielding a chord Reynolds number of $Re=20\,000$
. Water temperature was monitored during experiments and did not vary more than
$Re=20\,000$
. Water temperature was monitored during experiments and did not vary more than $1\,^{\circ}$
C. At each experimental condition, (frequency, heave and pitch amplitude, etc.) measurements were taken for 40 oscillation cycles. The first and last five cycles were discarded to guard against any transients, and the middle 30 cycles were subsequently phase-averaged.
$1\,^{\circ}$
C. At each experimental condition, (frequency, heave and pitch amplitude, etc.) measurements were taken for 40 oscillation cycles. The first and last five cycles were discarded to guard against any transients, and the middle 30 cycles were subsequently phase-averaged.
Two-component, time-resolved PIV measurements were acquired in an $x$
–
$x$
– $y$
plane located at the foil’s mid-span. Two cameras (Photron Fastcam Nova R2, 2048
$y$
plane located at the foil’s mid-span. Two cameras (Photron Fastcam Nova R2, 2048 $\times$
2048 pixels) were positioned below the test section, side by side, yielding a field of view measuring 0.25 m
$\times$
2048 pixels) were positioned below the test section, side by side, yielding a field of view measuring 0.25 m $\times$
0.43 m. The flow field was illuminated using an Nd:YLF laser (Photonics Industries DM30) and image pairs were acquired at 200 Hz (approximately 310 flow fields for each foil oscillation cycle). The velocity fields were computed using DaVis v10 (LaVision). Velocity and vorticity fields were then phase-averaged over six oscillation cycles.
$\times$
0.43 m. The flow field was illuminated using an Nd:YLF laser (Photonics Industries DM30) and image pairs were acquired at 200 Hz (approximately 310 flow fields for each foil oscillation cycle). The velocity fields were computed using DaVis v10 (LaVision). Velocity and vorticity fields were then phase-averaged over six oscillation cycles.
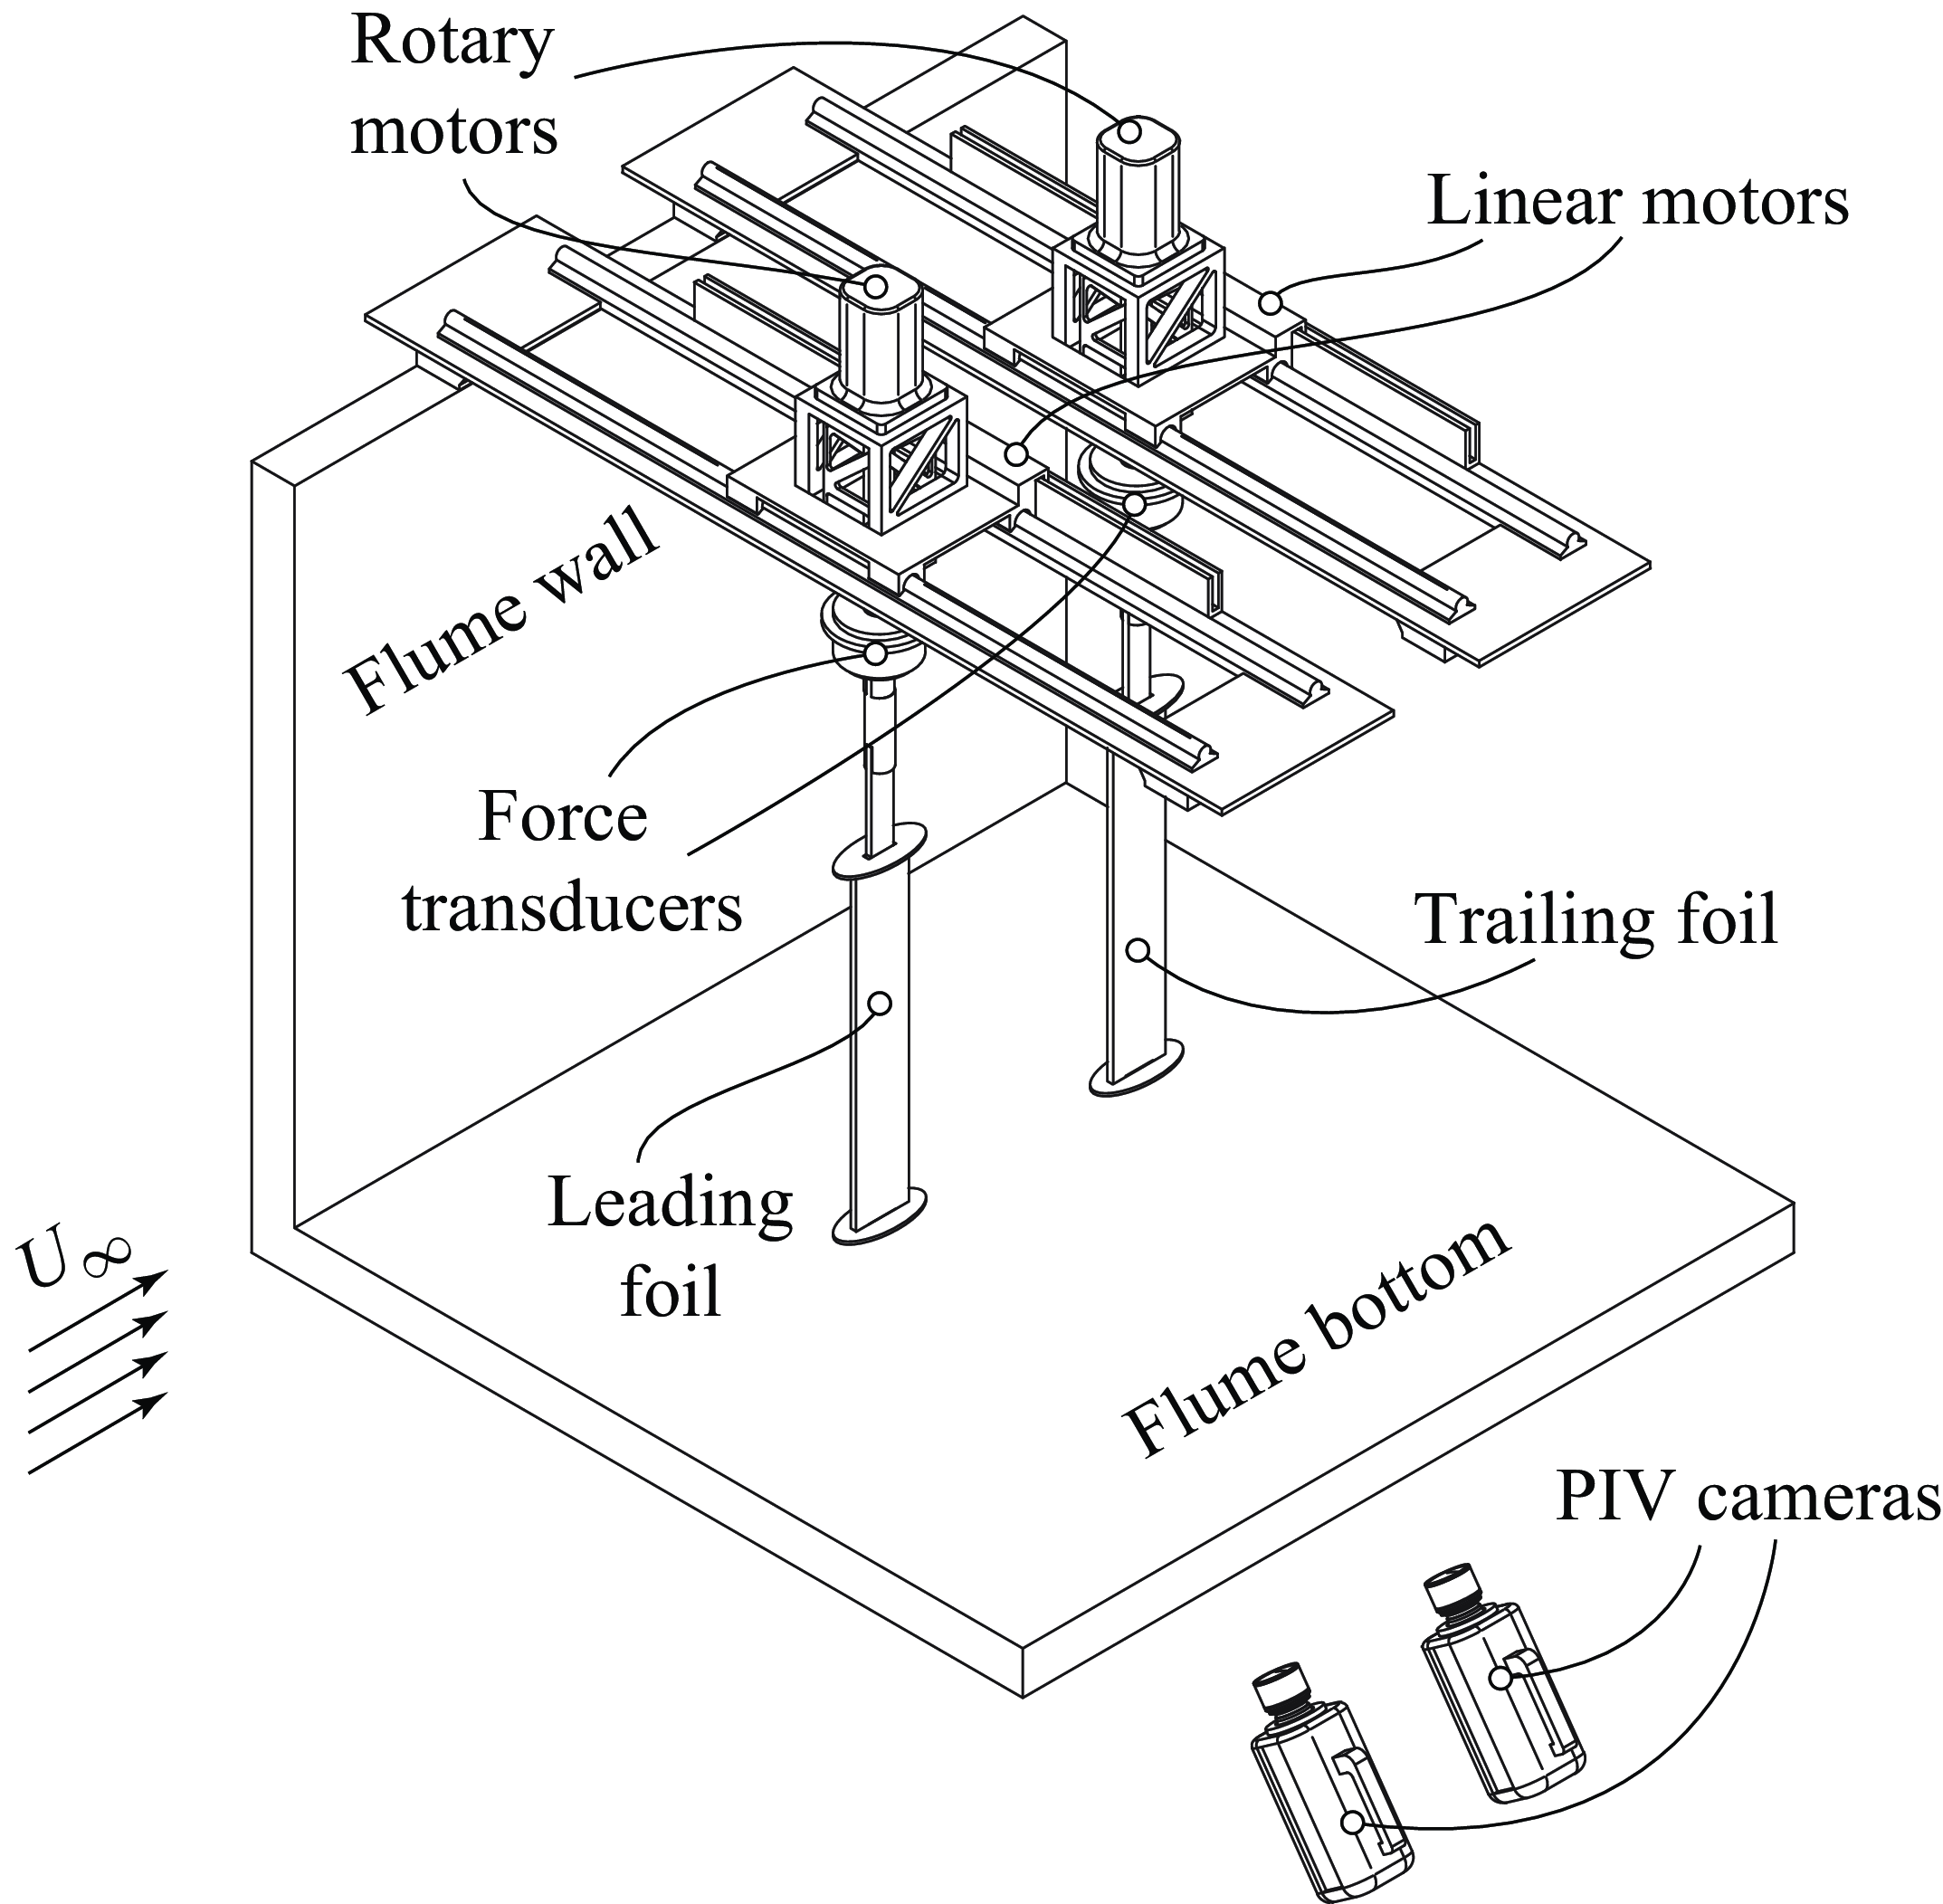
2.1. Oscillating hydrofoil kinematics and energy-harvesting performance
Top view of the measurement space, illustrating the kinematics of a tandem oscillating hydrofoil turbine. Shown are the pitching and heaving amplitudes, $\theta _0$
and
$\theta _0$
and $h_0$
, respectively, the maximum effective angle of attack of the leading foil
$h_0$
, respectively, the maximum effective angle of attack of the leading foil $\alpha _{T/4,{le}}$
, the swept distance
$\alpha _{T/4,{le}}$
, the swept distance $Y_s$
and the inter-foil separation
$Y_s$
and the inter-foil separation $S_x$
. Here
$S_x$
. Here $L(t)$
and
$L(t)$
and $M(t)$
are the lift force and pitching moment and
$M(t)$
are the lift force and pitching moment and $U_{\infty }$
is the free-stream velocity. The distance from the coordinate axis origin to the flume sidewalls in the transverse direction is 6 chord lengths.
$U_{\infty }$
is the free-stream velocity. The distance from the coordinate axis origin to the flume sidewalls in the transverse direction is 6 chord lengths.
The main kinematic parameters governing the operation of the tandem hydrofoil array are shown in figure 2. The sinusoidal motion profiles of the hydrofoils are described by
 \begin{equation} h(t) = h_0 \sin (2\pi ft - \psi _{1-2}) \ \ \mathrm{and} \end{equation}
 \begin{equation} \theta (t) = \theta _0 \sin (2\pi ft - \pi /2 - \psi _{1-2}), \end{equation}
where $h_0$
and
$h_0$
and $\theta _0$
are the amplitudes of the heave and pitch motions, respectively,
$\theta _0$
are the amplitudes of the heave and pitch motions, respectively, $f$
is the frequency of oscillation in hertz,
$f$
is the frequency of oscillation in hertz, $t$
is time in seconds and
$t$
is time in seconds and $\psi _{1-2}$
is the phase between the motions of the leading and trailing foils. The phase between heaving and pitching motions was kept constant at
$\psi _{1-2}$
is the phase between the motions of the leading and trailing foils. The phase between heaving and pitching motions was kept constant at $\pi /2$
based on the findings of Jones & Platzer (Reference Jones and Platzer1997) and Jones, Lindsey & Platzer (Reference Jones, Lindsey and Platzer2003), who investigated the relation of this parameter to propulsive and power extraction efficiency in OFTs.
$\pi /2$
based on the findings of Jones & Platzer (Reference Jones and Platzer1997) and Jones, Lindsey & Platzer (Reference Jones, Lindsey and Platzer2003), who investigated the relation of this parameter to propulsive and power extraction efficiency in OFTs.
We can relate a single foil’s effective angle of attack, defined as
 \begin{equation} \alpha _{\textit{eff}}(t) = \theta (t) - \tan ^{-1}(\dot {h}(t)/U_\infty ), \end{equation}
to the performance of the foil by using its maximum value, referred to $\alpha _{T/4}$
because it is the effective angle of attack at
$\alpha _{T/4}$
because it is the effective angle of attack at $t = T/4$
, and which is defined as
$t = T/4$
, and which is defined as
 \begin{equation} \alpha _{{max}}\approx \alpha _{T/4} = \theta _0-\tan ^{-1}{(2\pi h_0^*f^*)}, \end{equation}
where $h^*_0=h_0/c$
is the non-dimensional heave and
$h^*_0=h_0/c$
is the non-dimensional heave and $f^*=fc/U_\infty$
the reduced frequency (note that
$f^*=fc/U_\infty$
the reduced frequency (note that $\alpha _{T/4}$
values for the leading and trailing foils are indicated by the subscripts ‘
$\alpha _{T/4}$
values for the leading and trailing foils are indicated by the subscripts ‘ ${le}$
’ and ‘
${le}$
’ and ‘ ${tr}$
’, respectively). Previous studies (Kinsey & Dumas Reference Kinsey and Dumas2008; Simpson Reference Simpson2009; Kim et al. Reference Kim, Strom, Mandre and Breuer2017; Ribeiro et al. Reference Ribeiro, Su, Guillaumin, Breuer and Franck2021; Ribeiro & Franck Reference Ribeiro and Franck2023) have shown that
${tr}$
’, respectively). Previous studies (Kinsey & Dumas Reference Kinsey and Dumas2008; Simpson Reference Simpson2009; Kim et al. Reference Kim, Strom, Mandre and Breuer2017; Ribeiro et al. Reference Ribeiro, Su, Guillaumin, Breuer and Franck2021; Ribeiro & Franck Reference Ribeiro and Franck2023) have shown that $\alpha _{T/4}$
effectively parametrises the energy-harvesting performance of an oscillating foil.
$\alpha _{T/4}$
effectively parametrises the energy-harvesting performance of an oscillating foil.
The energy-harvesting performance of the hydrofoil is obtained from the sum of the power extracted due to the lift force, $L$
, and the pitching moment,
$L$
, and the pitching moment, $M$
:
$M$
:
 \begin{equation} P(t)=L(t)\dot {h}(t)+M(t)\dot {\theta }(t). \end{equation}
Energy-harvesting (or Betz) efficiency, $\eta$
, is defined as the ratio between the power extracted per cycle by the foil and the power available in the oncoming flow:
$\eta$
, is defined as the ratio between the power extracted per cycle by the foil and the power available in the oncoming flow:
 \begin{equation} \eta =\overline {P(t)}/0.5\rho U_{\infty }^{3}A_s , \end{equation}
where $\rho$
is the fluid density,
$\rho$
is the fluid density, $A_s$
the swept area and
$A_s$
the swept area and $\overline {P(t)}$
is the cycle-averaged power. The swept area is calculated as
$\overline {P(t)}$
is the cycle-averaged power. The swept area is calculated as $A_s=bY_s$
, where
$A_s=bY_s$
, where
 \begin{align} Y_s=\left [h(t)+\frac {c}{2}\sin {\left (\theta (t)\right )}\right ]_{{max}} \end{align}
is the swept distance, defined as the maximum distance travelled by the leading edge of the hydrofoil, and where $c$
is the foil chord length and
$c$
is the foil chord length and $b$
its span. Note that the efficiency as defined by (2.6) is only valid for a foil facing a clean free stream. Although not employed in the current study, Ribeiro et al. (Reference Ribeiro, Su, Guillaumin, Breuer and Franck2021) re-defined
$b$
its span. Note that the efficiency as defined by (2.6) is only valid for a foil facing a clean free stream. Although not employed in the current study, Ribeiro et al. (Reference Ribeiro, Su, Guillaumin, Breuer and Franck2021) re-defined $\eta$
for the trailing foil in their tandem array by using an average wake velocity.
$\eta$
for the trailing foil in their tandem array by using an average wake velocity.
2.2. Blockage correction
Hydrofoil performance is affected by blockage effects due to experiments being performed in the flume which has sidewalls. We account for these effects using a blockage correction model from Maskell (Reference Maskell1965), as implemented by Ross & Polagye (Reference Ross and Polagye2020). This model couples axial momentum theory with assumptions about the wake behind a highly loaded turbine. Information on the bypass flow is required to make use of this correction, which, for this study, is obtained using the open-channel blockage correction model developed by Houlsby, Draper & Oldfield (Reference Houlsby, Draper and Oldfield2008), as implemented by Ribeiro et al. (Reference Ribeiro, Su, Guillaumin, Breuer and Franck2021).
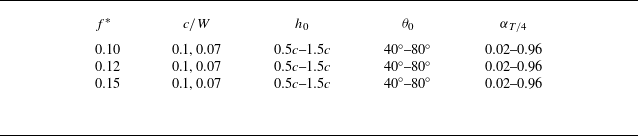
Single-foil experimental parameters explored in this study. Reduced frequency ( $f^*$
), heaving amplitude (
$f^*$
), heaving amplitude ( $h_0$
) and pitching amplitude (
$h_0$
) and pitching amplitude ( $\theta _0$
) were varied for foils with two different chord-to-test-section ratios,
$\theta _0$
) were varied for foils with two different chord-to-test-section ratios, $c/W$
. The combinations of parameters were selected to yield values of
$c/W$
. The combinations of parameters were selected to yield values of $\alpha _{T/4}$
ranging from
$\alpha _{T/4}$
ranging from $0.02$
to
$0.02$
to $0.96$
rad.
$0.96$
rad.
2.3. Kinematic parameter selection
Several series of experiments were conducted. In order to validate our system, we first characterised single-foil performance, measuring forces and torques over a range of frequencies, heave and pitch amplitudes (table 1). The single-foil-experiment parameters were chosen to yield $\alpha _{T/4}$
values ranging from
$\alpha _{T/4}$
values ranging from $0.02$
to
$0.02$
to $0.96$
rad (as shown in figure 3). In addition, two foil sizes were tested with chord measuring 0.061 and 0.0762 m. The plates had thicknesses measuring 0.00635 and 0.0079 m, respectively, and had the same aspect ratio. The free-stream velocity was adjusted to preserve a constant Reynolds number (20 000). Thus the only parameter changing was the ratio of chord to flume width,
$0.96$
rad (as shown in figure 3). In addition, two foil sizes were tested with chord measuring 0.061 and 0.0762 m. The plates had thicknesses measuring 0.00635 and 0.0079 m, respectively, and had the same aspect ratio. The free-stream velocity was adjusted to preserve a constant Reynolds number (20 000). Thus the only parameter changing was the ratio of chord to flume width, $c/W$
.
$c/W$
.
Secondly, we conducted a parameter sweep study of the energy-harvesting performance (i.e. force/torque, no PIV) of tandem foils. In this series of measurements (table 2) we chose three leading-foil operating points representing the shear layer, LEV and LEV + TEV wake regimes (Ribeiro et al. Reference Ribeiro, Su, Guillaumin, Breuer and Franck2021; Ribeiro & Franck Reference Ribeiro and Franck2023). As is discussed in § 3.1, these wake regimes each have an $\alpha _{T/4}$
range associated with it, and the chosen
$\alpha _{T/4}$
range associated with it, and the chosen $\alpha _{T/4,{le}}$
lie within the range of each regime. The values selected for
$\alpha _{T/4,{le}}$
lie within the range of each regime. The values selected for $f^*$
were chosen to be near the single-foil optimum identified in the literature while allowing for two
$f^*$
were chosen to be near the single-foil optimum identified in the literature while allowing for two $\alpha _{T/4,{le}}$
combinations firmly within each wake regime and that are close in value. The choice of
$\alpha _{T/4,{le}}$
combinations firmly within each wake regime and that are close in value. The choice of $f^*$
additionally allows the investigation of the two performance branches identified by Ribeiro & Franck (Reference Ribeiro and Franck2023) (also discussed in § 3.1). For each of the three leading-foil operating kinematics, a full parameter sweep of the trailing foil was performed by varying
$f^*$
additionally allows the investigation of the two performance branches identified by Ribeiro & Franck (Reference Ribeiro and Franck2023) (also discussed in § 3.1). For each of the three leading-foil operating kinematics, a full parameter sweep of the trailing foil was performed by varying $h_{0,{\textit{tr}}}$
,
$h_{0,{\textit{tr}}}$
, $\theta _{0,{\textit{tr}}}$
,
$\theta _{0,{\textit{tr}}}$
, $\psi _{1-2}$
,
$\psi _{1-2}$
, $S_x$
and
$S_x$
and $f^*$
, and the performance of the full system was quantified by calculating the power extracted by the tandem foil combination. The ranges selected for
$f^*$
, and the performance of the full system was quantified by calculating the power extracted by the tandem foil combination. The ranges selected for $h_{0,{\textit{tr}}}$
and
$h_{0,{\textit{tr}}}$
and $\theta _{0,{\textit{tr}}}$
where chosen to deviate significantly from the single-foil optimal combination found in the literature (Kinsey & Dumas Reference Kinsey and Dumas2008; Kim et al. Reference Kim, Strom, Mandre and Breuer2017), while still encompassing said combination. The range in
$\theta _{0,{\textit{tr}}}$
where chosen to deviate significantly from the single-foil optimal combination found in the literature (Kinsey & Dumas Reference Kinsey and Dumas2008; Kim et al. Reference Kim, Strom, Mandre and Breuer2017), while still encompassing said combination. The range in $\psi _{1-2}$
allows for the exploration of a full range of phase configurations. The two separations
$\psi _{1-2}$
allows for the exploration of a full range of phase configurations. The two separations $S_x$
tested were chosen to explore the effect of placing the trailing foil closer upstream and having it interact with – presumably – stronger vortices shed by the leading foil. A total of 1323 combinations of kinematic parameters were tested.
$S_x$
tested were chosen to explore the effect of placing the trailing foil closer upstream and having it interact with – presumably – stronger vortices shed by the leading foil. A total of 1323 combinations of kinematic parameters were tested.
Tandem-foil experimental parameters explored in this study. The leading foil’s heaving ( $h_{0,{le}}$
) and pitching (
$h_{0,{le}}$
) and pitching ( $\theta _{0,{le}}$
) amplitudes, as well as the reduced frequency (
$\theta _{0,{le}}$
) amplitudes, as well as the reduced frequency ( $f^*$
) were set to obtain a desired
$f^*$
) were set to obtain a desired $\alpha _{{T/4},{le}}$
within each wake regime. Different combinations of inter-foil separation (
$\alpha _{{T/4},{le}}$
within each wake regime. Different combinations of inter-foil separation ( $S_x$
), inter-foil phase (
$S_x$
), inter-foil phase ( $\psi _{1-2}$
) and heaving (
$\psi _{1-2}$
) and heaving ( $h_{0,{\textit{tr}}}$
) and pitching (
$h_{0,{\textit{tr}}}$
) and pitching ( $\theta _{0,{\textit{tr}}}$
) amplitudes of the trailing foil were then tested.
$\theta _{0,{\textit{tr}}}$
) amplitudes of the trailing foil were then tested.

Lastly, PIV was carried out for 16 parameter combinations – chosen to provide detailed flow information on the constructive and destructive wake–foil interactions identified during the full parameter sweep. The parameters for these cases are shown in table 3.
Tandem-foil PIV experiments performed in this study. Wake regimes were prescribed by obtaining a desired $\alpha _{{T/4},{\textit{le}}}$
through the choice of the leading foil’s reduced frequency (
$\alpha _{{T/4},{\textit{le}}}$
through the choice of the leading foil’s reduced frequency ( $f^*$
), heaving (
$f^*$
), heaving ( $h_{0,{le}}$
) and pitching (
$h_{0,{le}}$
) and pitching ( $\theta _{0,{le}}$
) amplitudes. Then PIV was performed on selected combinations of trailing-foil heaving (
$\theta _{0,{le}}$
) amplitudes. Then PIV was performed on selected combinations of trailing-foil heaving ( $h_{0,{\textit{tr}}}$
) and pitching (
$h_{0,{\textit{tr}}}$
) and pitching ( $\theta _{0,{\textit{tr}}}$
) amplitudes, inter-foil separation (
$\theta _{0,{\textit{tr}}}$
) amplitudes, inter-foil separation ( $S_x$
) and inter-foil phase (
$S_x$
) and inter-foil phase ( $\psi _{1-2}$
).
$\psi _{1-2}$
).
3. Results and discussion
3.1. Single-foil performance and blockage correction
Figure 3 shows the Betz efficiency, $\eta$
, of a single foil as a function of
$\eta$
, of a single foil as a function of $\alpha _{T/4}$
measured over a range of frequencies, pitch and heave amplitudes and blockage,
$\alpha _{T/4}$
measured over a range of frequencies, pitch and heave amplitudes and blockage, $c/W$
(table 1). Several features should be noted. Firstly we see that the efficiency of the larger foil (
$c/W$
(table 1). Several features should be noted. Firstly we see that the efficiency of the larger foil ( $c/W = 0.10$
, open circle markers) is higher than that of the smaller foil (
$c/W = 0.10$
, open circle markers) is higher than that of the smaller foil ( $c/W = 0.07$
, open star markers) and that the performance of both foils decreases and almost perfectly collapses onto a single curve once the blockage correction is applied (filled circle and star markers). With the blockage correction applied, both sets of experimental data agree very well with the computations of Ribeiro & Franck (Reference Ribeiro and Franck2023) (filled orange triangle markers), which were performed for an elliptical foil in an infinite (unconstrained) domain.
$c/W = 0.07$
, open star markers) and that the performance of both foils decreases and almost perfectly collapses onto a single curve once the blockage correction is applied (filled circle and star markers). With the blockage correction applied, both sets of experimental data agree very well with the computations of Ribeiro & Franck (Reference Ribeiro and Franck2023) (filled orange triangle markers), which were performed for an elliptical foil in an infinite (unconstrained) domain.
Energy-harvesting efficiency of a single foil as a function of its $\alpha _{T/4}$
value. Blue, red and green markers indicate different reduced frequencies. Orange triangle markers indicate simulation results from Ribeiro & Franck (Reference Ribeiro and Franck2023). Circle and star markers correspond to the efficiency calculated from two differently scaled hydrofoils, where
$\alpha _{T/4}$
value. Blue, red and green markers indicate different reduced frequencies. Orange triangle markers indicate simulation results from Ribeiro & Franck (Reference Ribeiro and Franck2023). Circle and star markers correspond to the efficiency calculated from two differently scaled hydrofoils, where $c/W$
is the ratio of the foil’s chord to the flume width. Overall, open markers indicate measured values and filled markers are blockage-corrected values (Maskell Reference Maskell1965; Ross & Polagye Reference Ross and Polagye2020).
$c/W$
is the ratio of the foil’s chord to the flume width. Overall, open markers indicate measured values and filled markers are blockage-corrected values (Maskell Reference Maskell1965; Ross & Polagye Reference Ross and Polagye2020).
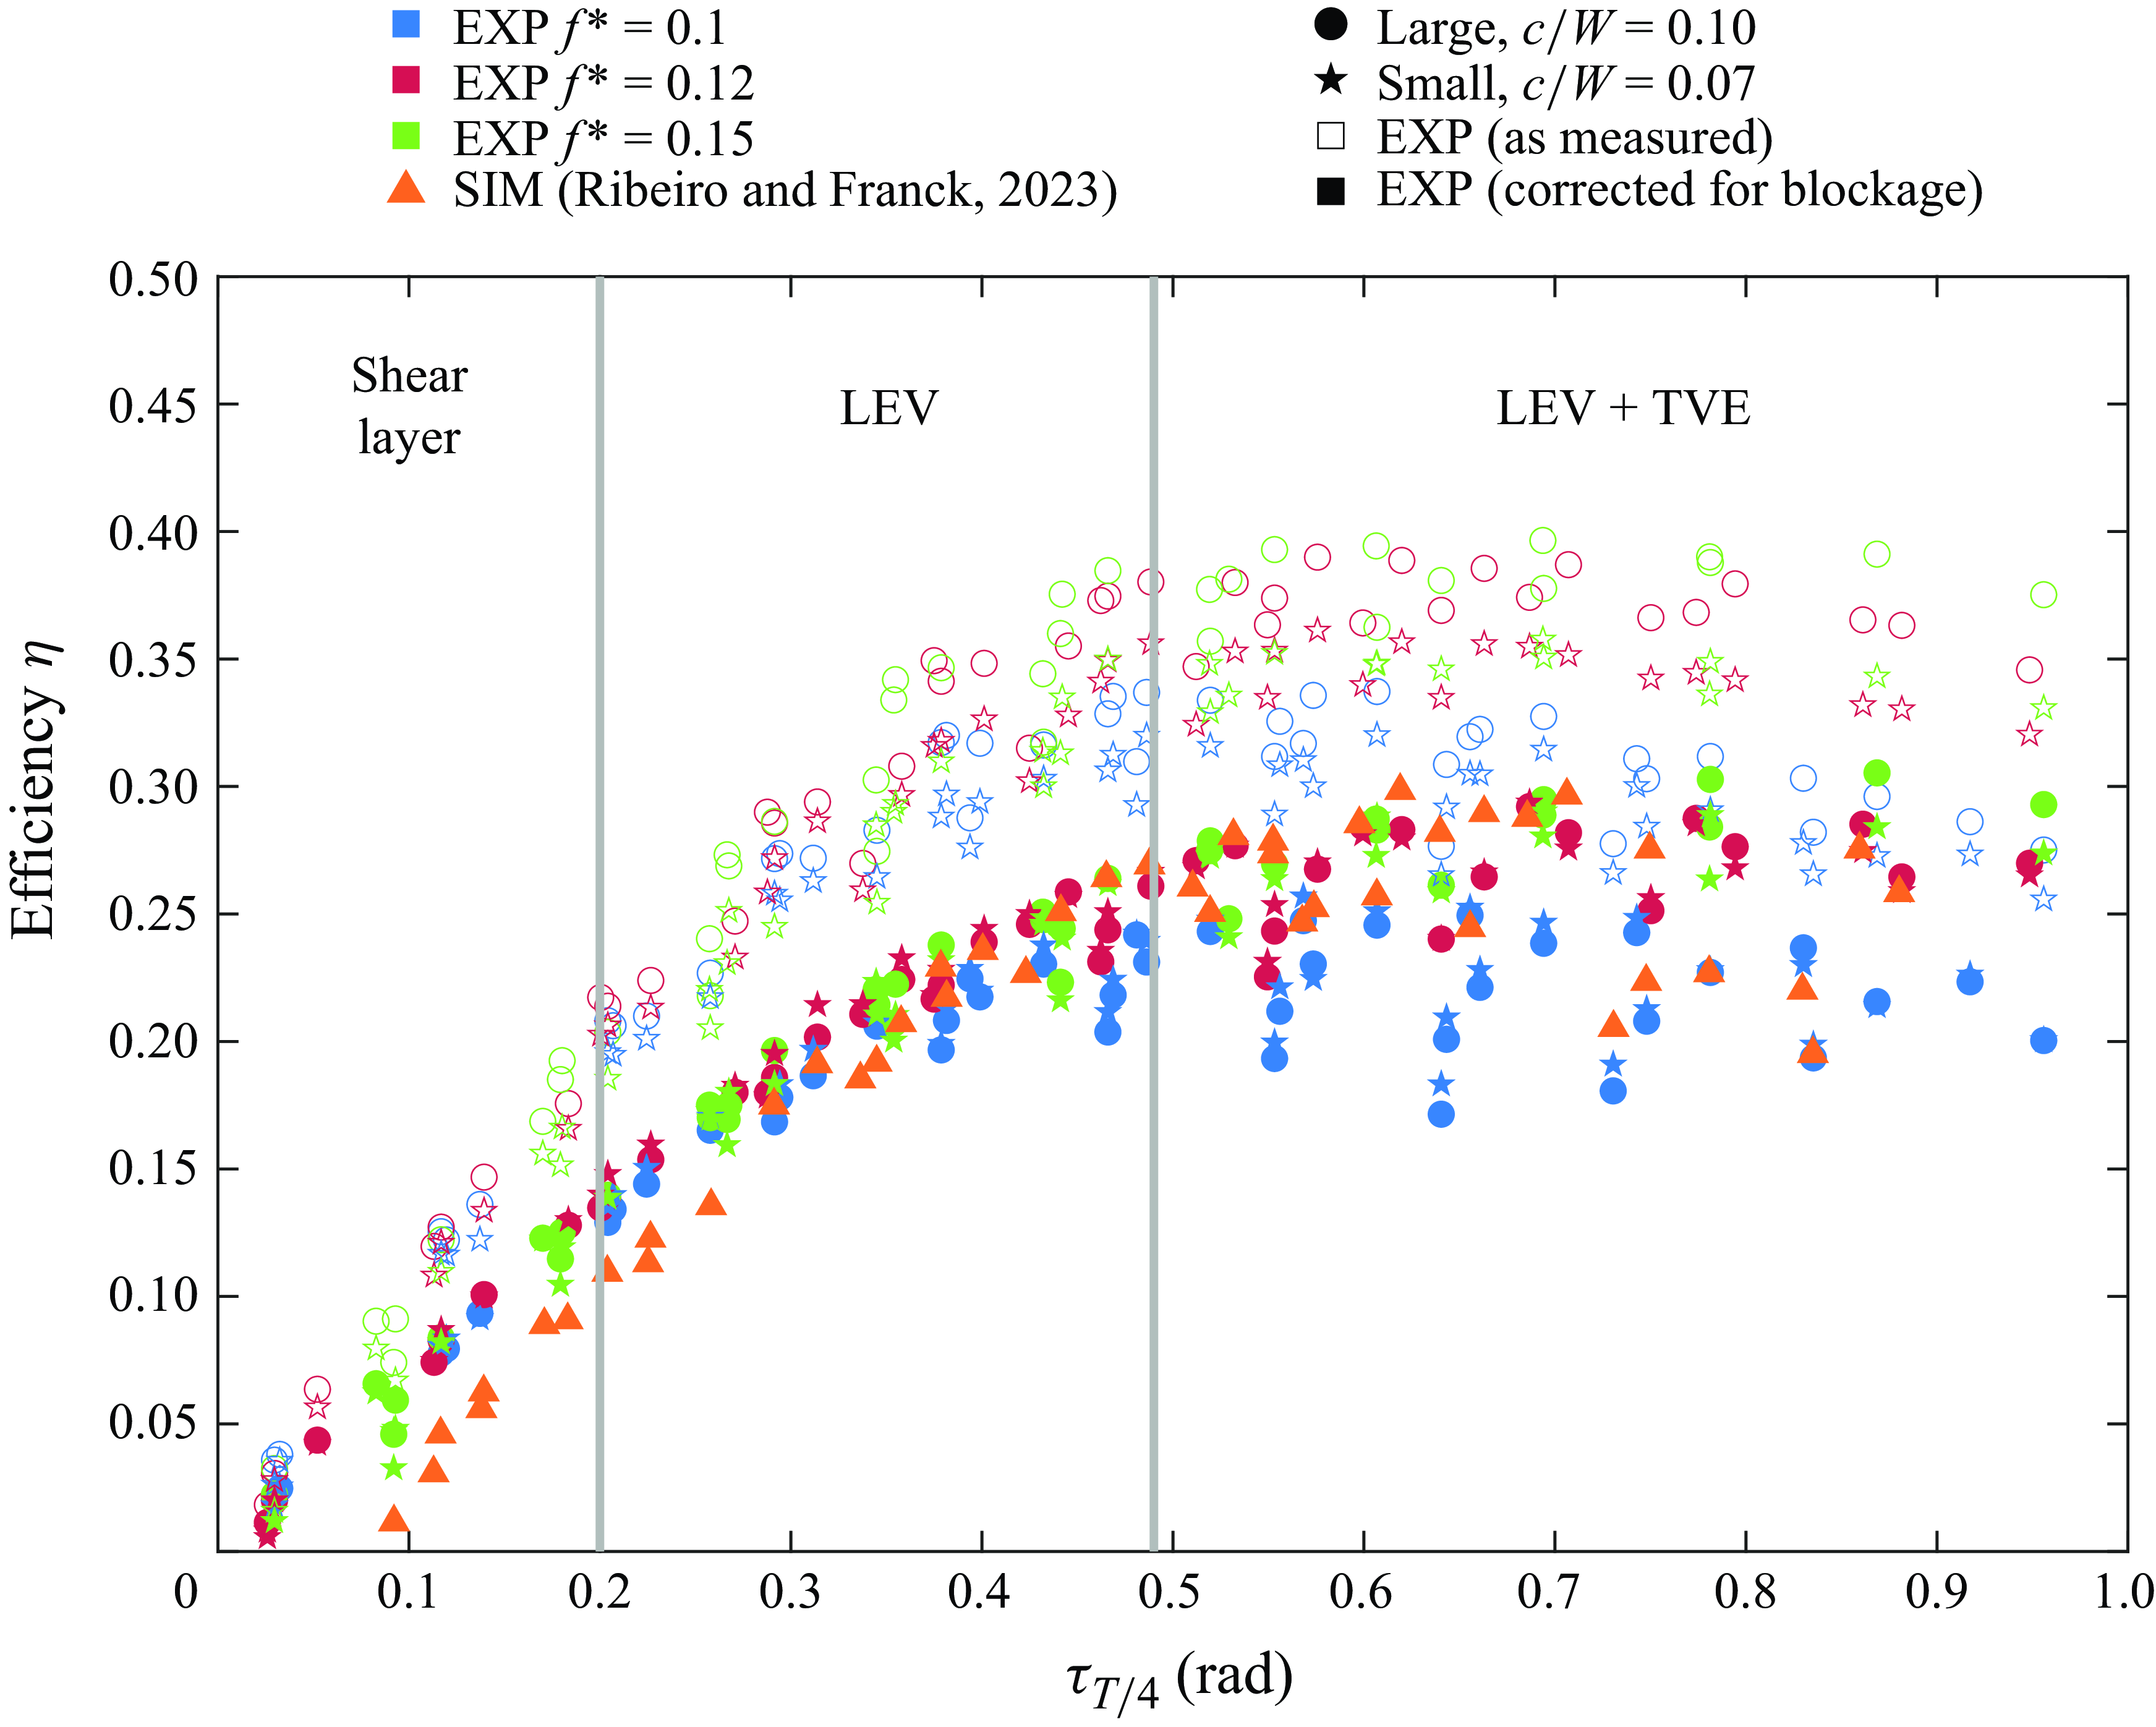
Secondly, once the blockage correction is applied (filled symbols) there is excellent scaling of $\eta$
within the shear-layer and LEV regimes (
$\eta$
within the shear-layer and LEV regimes ( $\alpha _{T/4} \lt 0.5$
), while in the LEV + TEV regime (
$\alpha _{T/4} \lt 0.5$
), while in the LEV + TEV regime ( $\alpha _{T/4} \gt 0.5$
) we see the efficiency spread out with the lower frequencies (blue symbols) exhibiting a lower efficiency than the higher frequencies (red and green symbols). This behaviour agrees with the computations of Ribeiro & Franck (Reference Ribeiro and Franck2023) (orange symbols), who also observed this bifurcation, and remarked that the split in the
$\alpha _{T/4} \gt 0.5$
) we see the efficiency spread out with the lower frequencies (blue symbols) exhibiting a lower efficiency than the higher frequencies (red and green symbols). This behaviour agrees with the computations of Ribeiro & Franck (Reference Ribeiro and Franck2023) (orange symbols), who also observed this bifurcation, and remarked that the split in the $\alpha _{T/4}$
scaling in the LEV + TEV regime divided according to the frequency, with the upper branch corresponding to cases with
$\alpha _{T/4}$
scaling in the LEV + TEV regime divided according to the frequency, with the upper branch corresponding to cases with $f^*=0.15$
and
$f^*=0.15$
and $f^*=0.12$
, while the lower branch corresponded to cases with a lower frequency,
$f^*=0.12$
, while the lower branch corresponded to cases with a lower frequency, $f^*=0.1$
.
$f^*=0.1$
.
3.2. Wake structure and vortex trajectories behind a single hydrofoil
Contours of vorticity for each wake regime at different times within an oscillation cycle. In all three cases the leading foil’s reduced frequency is $f^*=0.12$
and its heaving amplitude is
$f^*=0.12$
and its heaving amplitude is $h_{0,{le}}=0.8c$
. (a) The shear-layer regime,
$h_{0,{le}}=0.8c$
. (a) The shear-layer regime, $\alpha _{{T/4},{le}}=0.16$
,
$\alpha _{{T/4},{le}}=0.16$
, $\theta _{0,{le}}=40^{\circ}$
. (b) The LEV regime,
$\theta _{0,{le}}=40^{\circ}$
. (b) The LEV regime, $\alpha _{T/4,{le}}=0.33$
,
$\alpha _{T/4,{le}}=0.33$
, $\theta _{0,{le}}=50^{\circ}$
. (c) The LEV + TEV regime,
$\theta _{0,{le}}=50^{\circ}$
. (c) The LEV + TEV regime, $\alpha _{T/4,{le}}=0.68$
,
$\alpha _{T/4,{le}}=0.68$
, $\theta _{0,{le}}=70^{\circ}$
. The main vortices in the LEV and LEV + TEV regimes are highlighted in the last snapshot, as well as the trajectory of the primary vortex. The small green circle marker in the fourth panel of each wake regime (
$\theta _{0,{le}}=70^{\circ}$
. The main vortices in the LEV and LEV + TEV regimes are highlighted in the last snapshot, as well as the trajectory of the primary vortex. The small green circle marker in the fourth panel of each wake regime ( $t/T=0.4$
) indicates the location of the vortex core at that instance.
$t/T=0.4$
) indicates the location of the vortex core at that instance.
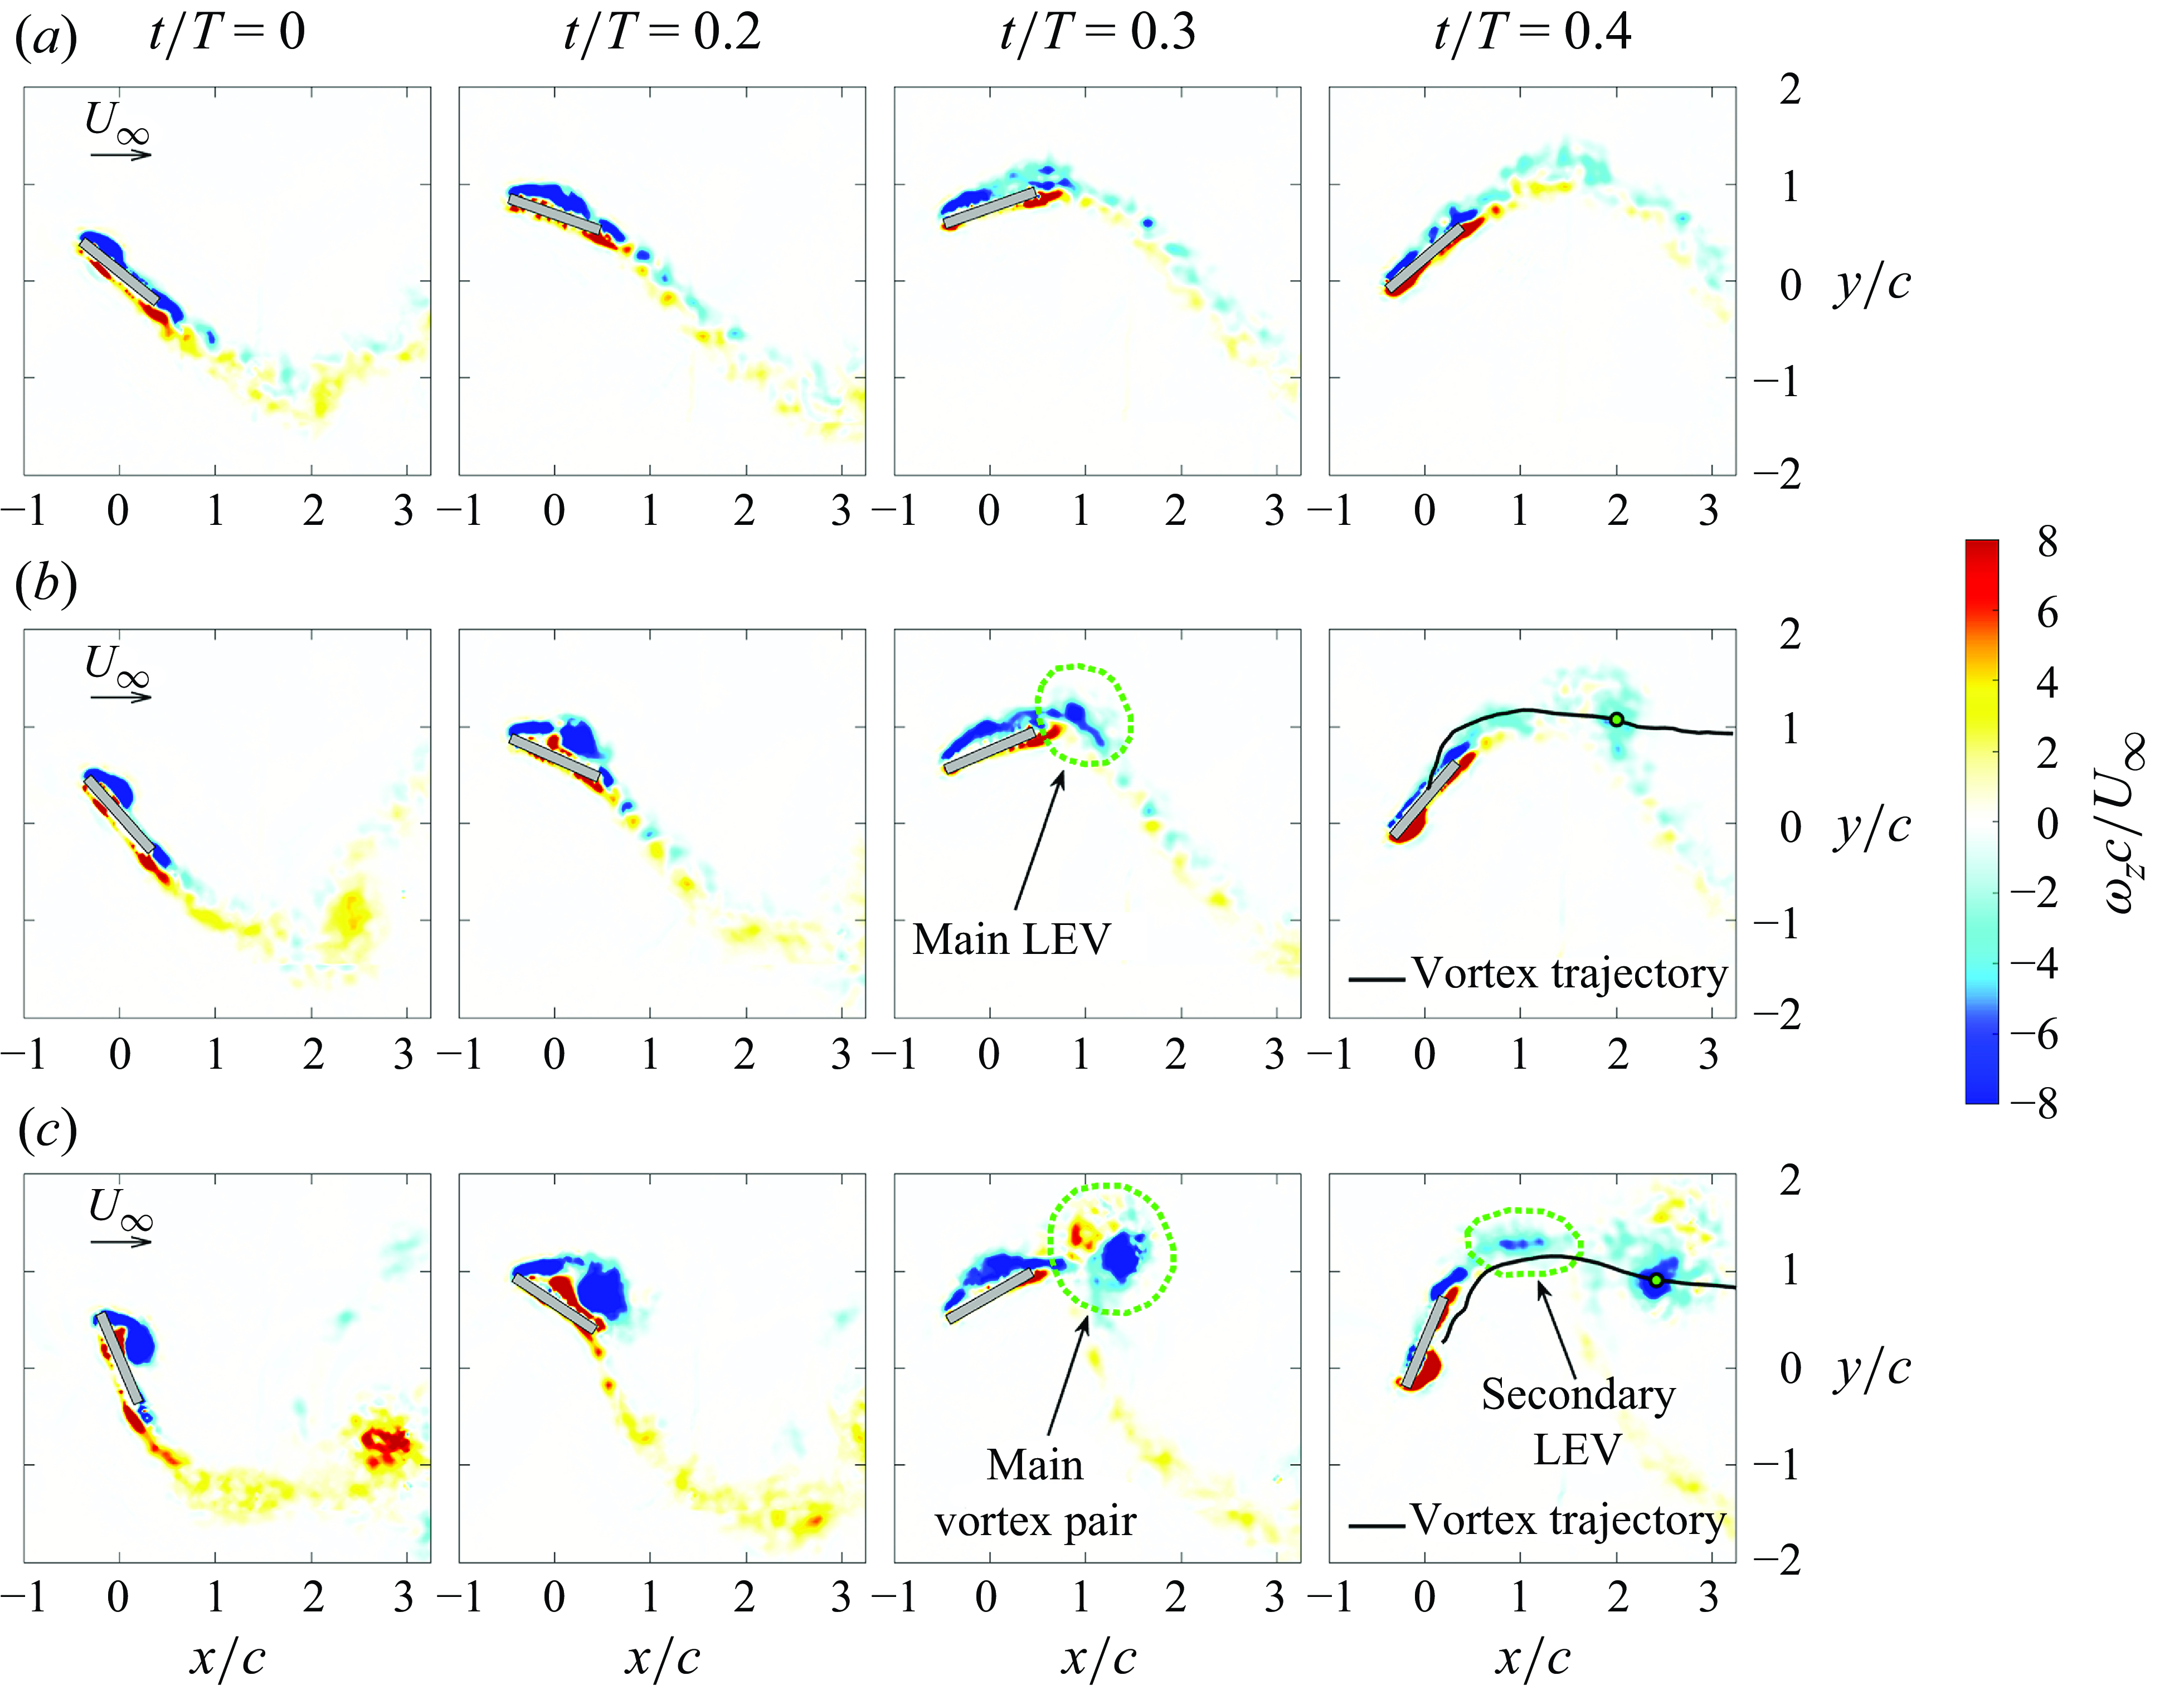
The three wake regimes identified by Ribeiro et al. (Reference Ribeiro, Su, Guillaumin, Breuer and Franck2021) are confirmed by PIV measurements behind the leading foil, and are shown in figure 4 at four times during the cycle. At the lowest angles of attack, over a range of $0\lt \alpha _{T/4,{le}}\leqslant 0.2$
, the ‘shear-layer regime’ is characterised by a shear layer in the wake with only weak vortex formation. At intermediate angles of attack, we can identify the ‘leading edge vortex regime’ (LEV regime) at values of
$0\lt \alpha _{T/4,{le}}\leqslant 0.2$
, the ‘shear-layer regime’ is characterised by a shear layer in the wake with only weak vortex formation. At intermediate angles of attack, we can identify the ‘leading edge vortex regime’ (LEV regime) at values of $0.2\lt \alpha _{T/4,{le}}\leqslant 0.49$
. Lee et al. (Reference Lee, Simone, Su, Zhu, Ribeiro, Franck and Breuer2022) showed how the primary LEV shed by the foil in this regime is advected downstream in a mostly straight downstream direction from its detachment location. This behaviour is confirmed by the vortex path shown in the last panel of figure 4(b). The highest range of
$0.2\lt \alpha _{T/4,{le}}\leqslant 0.49$
. Lee et al. (Reference Lee, Simone, Su, Zhu, Ribeiro, Franck and Breuer2022) showed how the primary LEV shed by the foil in this regime is advected downstream in a mostly straight downstream direction from its detachment location. This behaviour is confirmed by the vortex path shown in the last panel of figure 4(b). The highest range of $\alpha _{T/4,{le}}$
denotes the ‘leading edge vortex + trailing edge vortex regime’ (LEV + TEV) which sees a vortex pair shed by the foil every stroke. The primary LEV is stronger and larger than in the other wake regimes and is accompanied by a small counter-rotating TEV. Lee et al. (Reference Lee, Simone, Su, Zhu, Ribeiro, Franck and Breuer2022) also showed that the orbiting interaction between these two vortices in this regime results in a curved trajectory as the vortex pair travels downstream (figure 4
c;
$\alpha _{T/4,{le}}$
denotes the ‘leading edge vortex + trailing edge vortex regime’ (LEV + TEV) which sees a vortex pair shed by the foil every stroke. The primary LEV is stronger and larger than in the other wake regimes and is accompanied by a small counter-rotating TEV. Lee et al. (Reference Lee, Simone, Su, Zhu, Ribeiro, Franck and Breuer2022) also showed that the orbiting interaction between these two vortices in this regime results in a curved trajectory as the vortex pair travels downstream (figure 4
c; $t/T = 0.4)$
.
$t/T = 0.4)$
.
(a–c) The averaged wake velocity, $\overline {u}_{{wake}}$
, calculated from PIV measurements for each wake regime, obtained from time-averaging the instantaneous wake velocity over 10 oscillation cycles. The three cases presented have the same
$\overline {u}_{{wake}}$
, calculated from PIV measurements for each wake regime, obtained from time-averaging the instantaneous wake velocity over 10 oscillation cycles. The three cases presented have the same $\alpha _{T/4,{le}}$
values as those presented in figure 4, i.e. (a) 0.16, (b) 0.33 and (c) 0.68 rad. Also shown are the (d) trajectory and the (e)
$\alpha _{T/4,{le}}$
values as those presented in figure 4, i.e. (a) 0.16, (b) 0.33 and (c) 0.68 rad. Also shown are the (d) trajectory and the (e) $Q$
-value of the primary vortex in the LEV and the LEV + TEV regimes.
$Q$
-value of the primary vortex in the LEV and the LEV + TEV regimes.
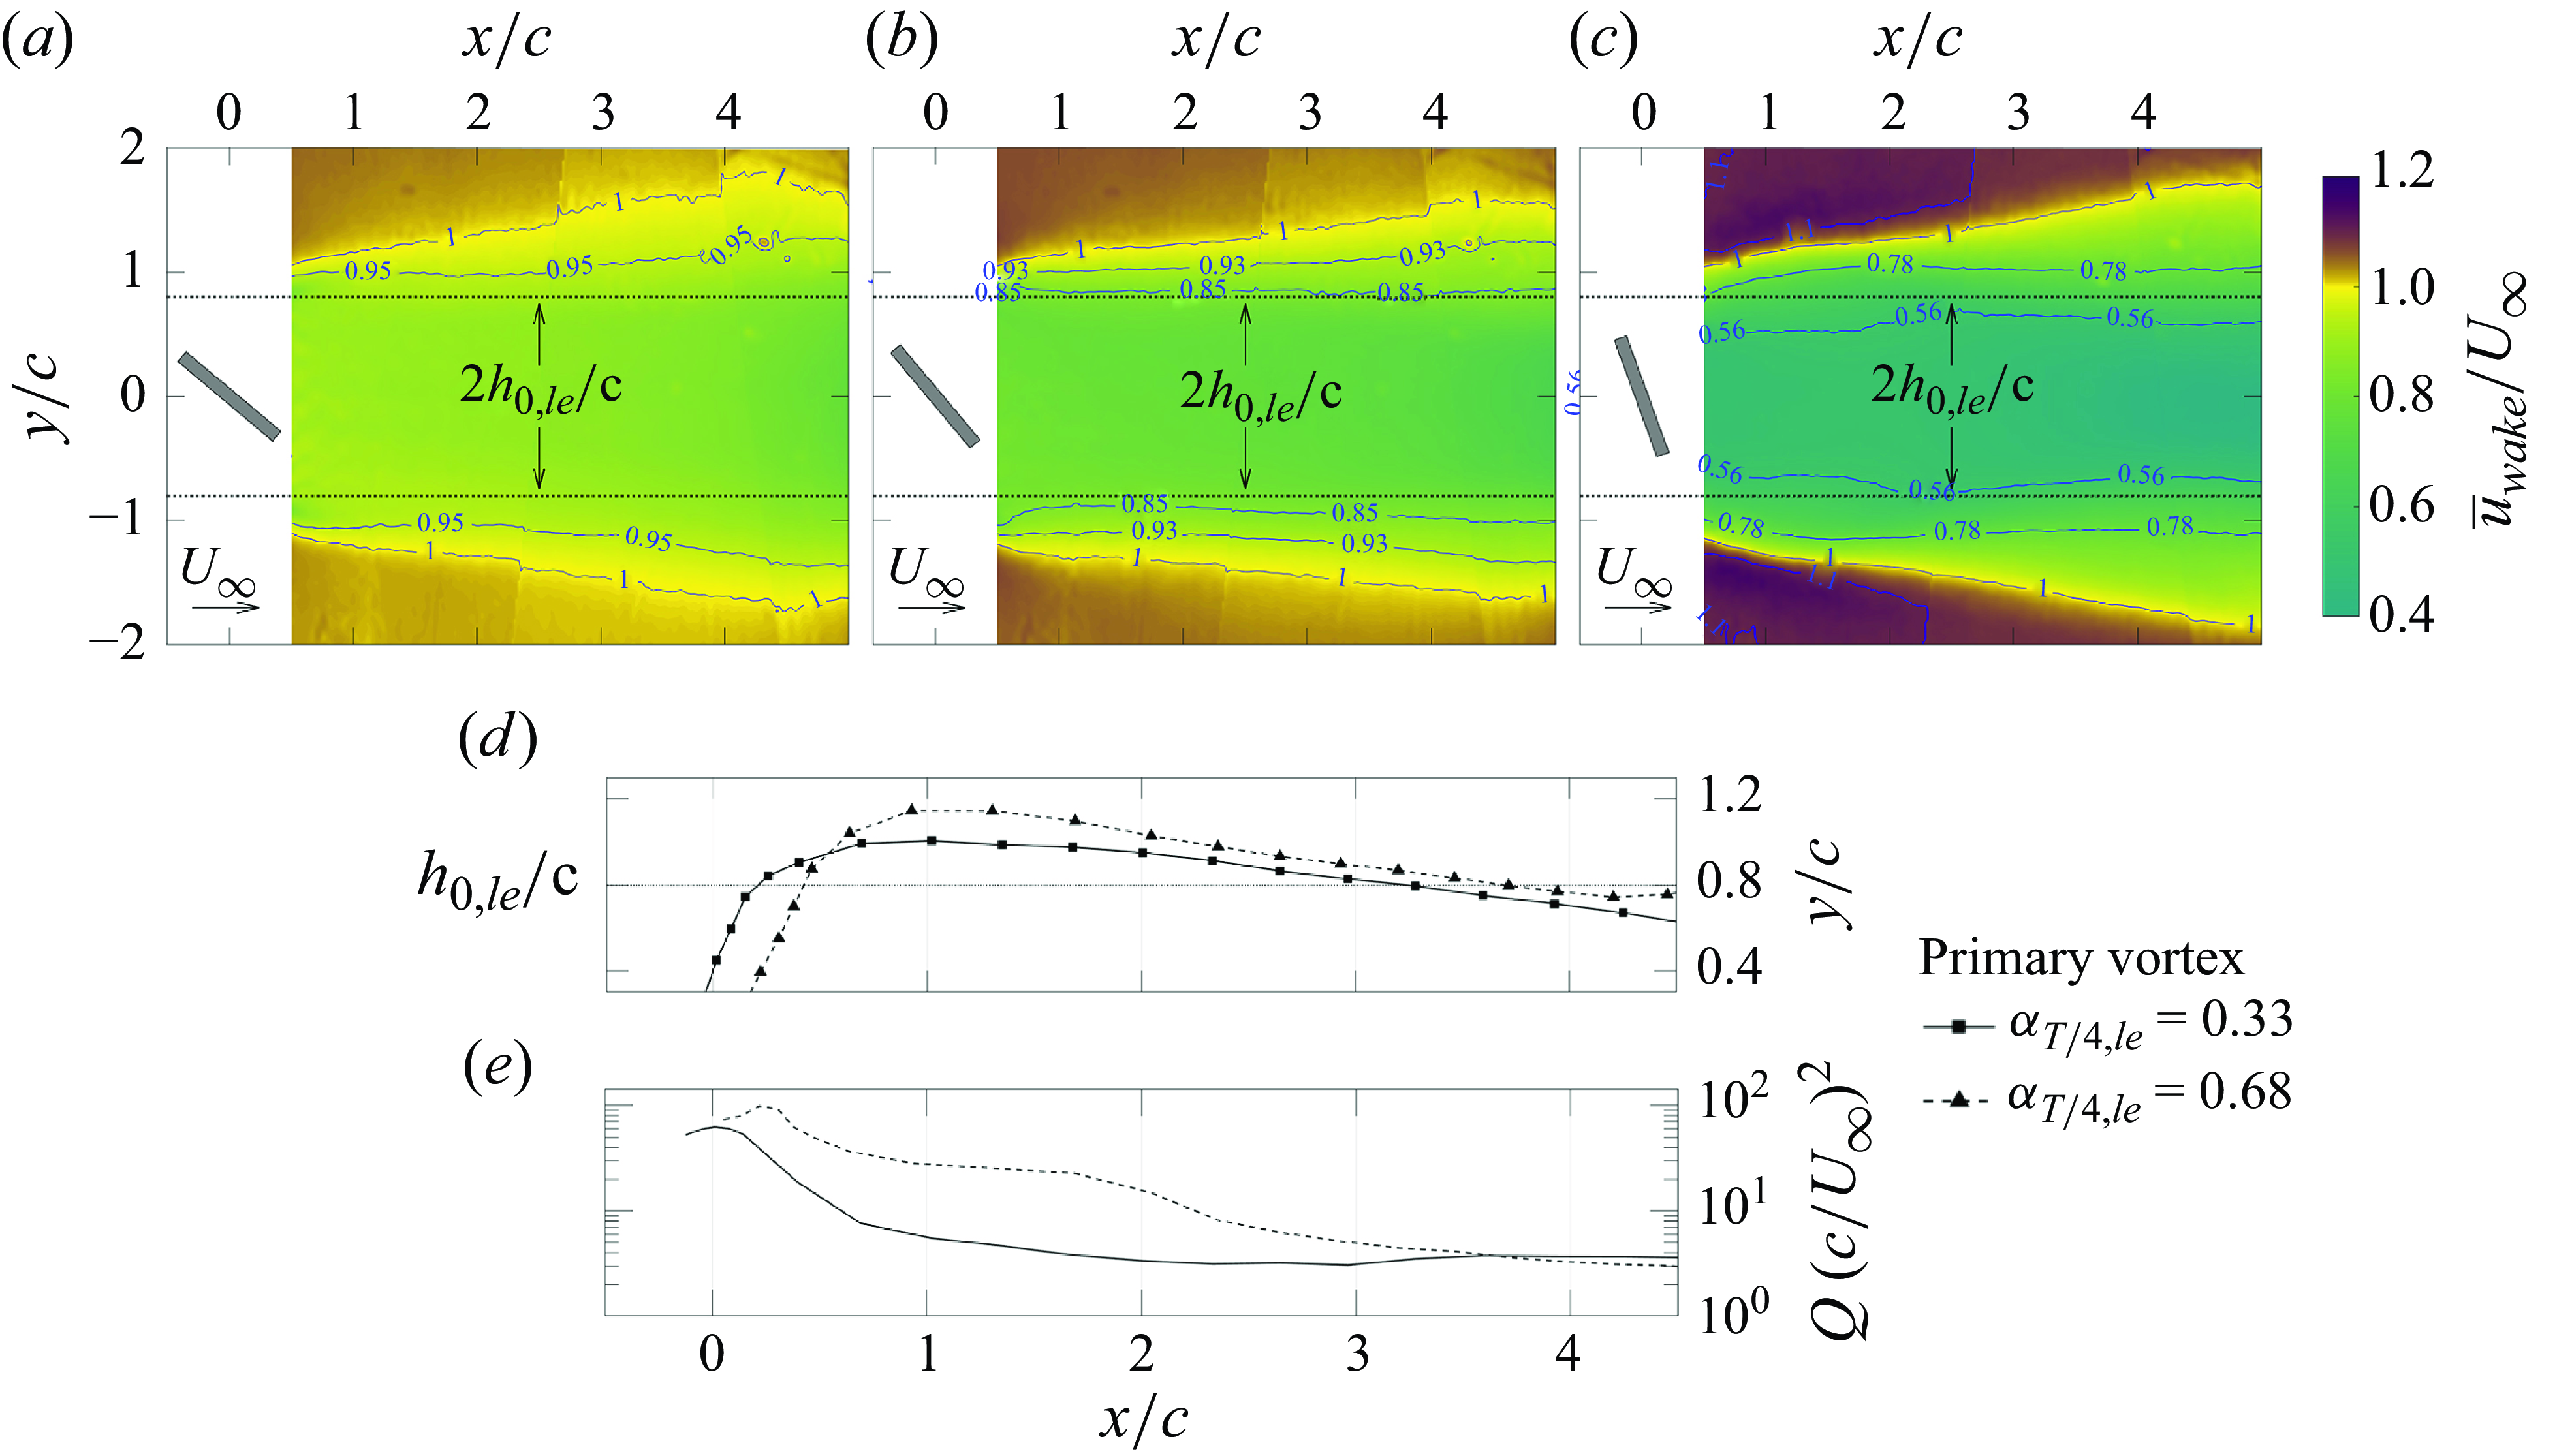
Figure 5(a–c) shows the wake velocity averaged over all snapshots, $\overline {u}_{{wake}}$
, behind the leading foil for each wake regime. These results, which align closely with those reported by Ribeiro et al. (Reference Ribeiro, Su, Guillaumin, Breuer and Franck2021), show how the wake velocity within the confines of the leading foil’s heaving amplitude decreases at higher values of
$\overline {u}_{{wake}}$
, behind the leading foil for each wake regime. These results, which align closely with those reported by Ribeiro et al. (Reference Ribeiro, Su, Guillaumin, Breuer and Franck2021), show how the wake velocity within the confines of the leading foil’s heaving amplitude decreases at higher values of $\alpha _{T/4,{le}}$
. The leading foil’s heaving amplitude is fixed at
$\alpha _{T/4,{le}}$
. The leading foil’s heaving amplitude is fixed at $h_{0,{le}}=0.8c$
in all wake regimes, setting the shedding location of the primary LEV. Although the trajectory of the primary LEV is slightly different in both wake regimes, the vortex remains within the same
$h_{0,{le}}=0.8c$
in all wake regimes, setting the shedding location of the primary LEV. Although the trajectory of the primary LEV is slightly different in both wake regimes, the vortex remains within the same $y/c$
region as it nears the position of the trailing foil. Due to the presence of the strong vortices, this region in the wake is characterised by high turbulent kinetic energy, as shown by Ribeiro et al. (Reference Ribeiro, Su, Guillaumin, Breuer and Franck2021), which defines a sort of boundary of the pure deficit region. Figures 5(d) and 5(e) show the main vortex trajectory and
$y/c$
region as it nears the position of the trailing foil. Due to the presence of the strong vortices, this region in the wake is characterised by high turbulent kinetic energy, as shown by Ribeiro et al. (Reference Ribeiro, Su, Guillaumin, Breuer and Franck2021), which defines a sort of boundary of the pure deficit region. Figures 5(d) and 5(e) show the main vortex trajectory and $Q$
-value, where
$Q$
-value, where $Q$
is the second invariant of the velocity gradient tensor,
$Q$
is the second invariant of the velocity gradient tensor,
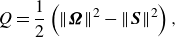 \begin{equation} Q=\frac {1}{2} \left(\|\boldsymbol{\Omega }\|^2-\|\boldsymbol{S}\|^2 \right), \end{equation}
for the two wake regimes with prominent vortex structures, where $\mathbf{\Omega }$
is the rotation-rate tensor and
$\mathbf{\Omega }$
is the rotation-rate tensor and $\textbf {S}$
the strain-rate tensor. It can be inferred from figure 5 that
$\textbf {S}$
the strain-rate tensor. It can be inferred from figure 5 that $h_{0,{le}}$
indirectly affects the optimal choice
$h_{0,{le}}$
indirectly affects the optimal choice $h_{0,{\textit{tr}}}$
, as it defines the region of decelerated flow in which the trailing foil will have to operate.
$h_{0,{\textit{tr}}}$
, as it defines the region of decelerated flow in which the trailing foil will have to operate.
3.3. Array performance
Power extracted by the system as a function of the trailing-foil pitch amplitude $\theta _{0,{\textit{tr}}}$
. The grey bars are the power extracted by the leading foil, while the coloured bars are the power from the trailing foil.
$\theta _{0,{\textit{tr}}}$
. The grey bars are the power extracted by the leading foil, while the coloured bars are the power from the trailing foil.
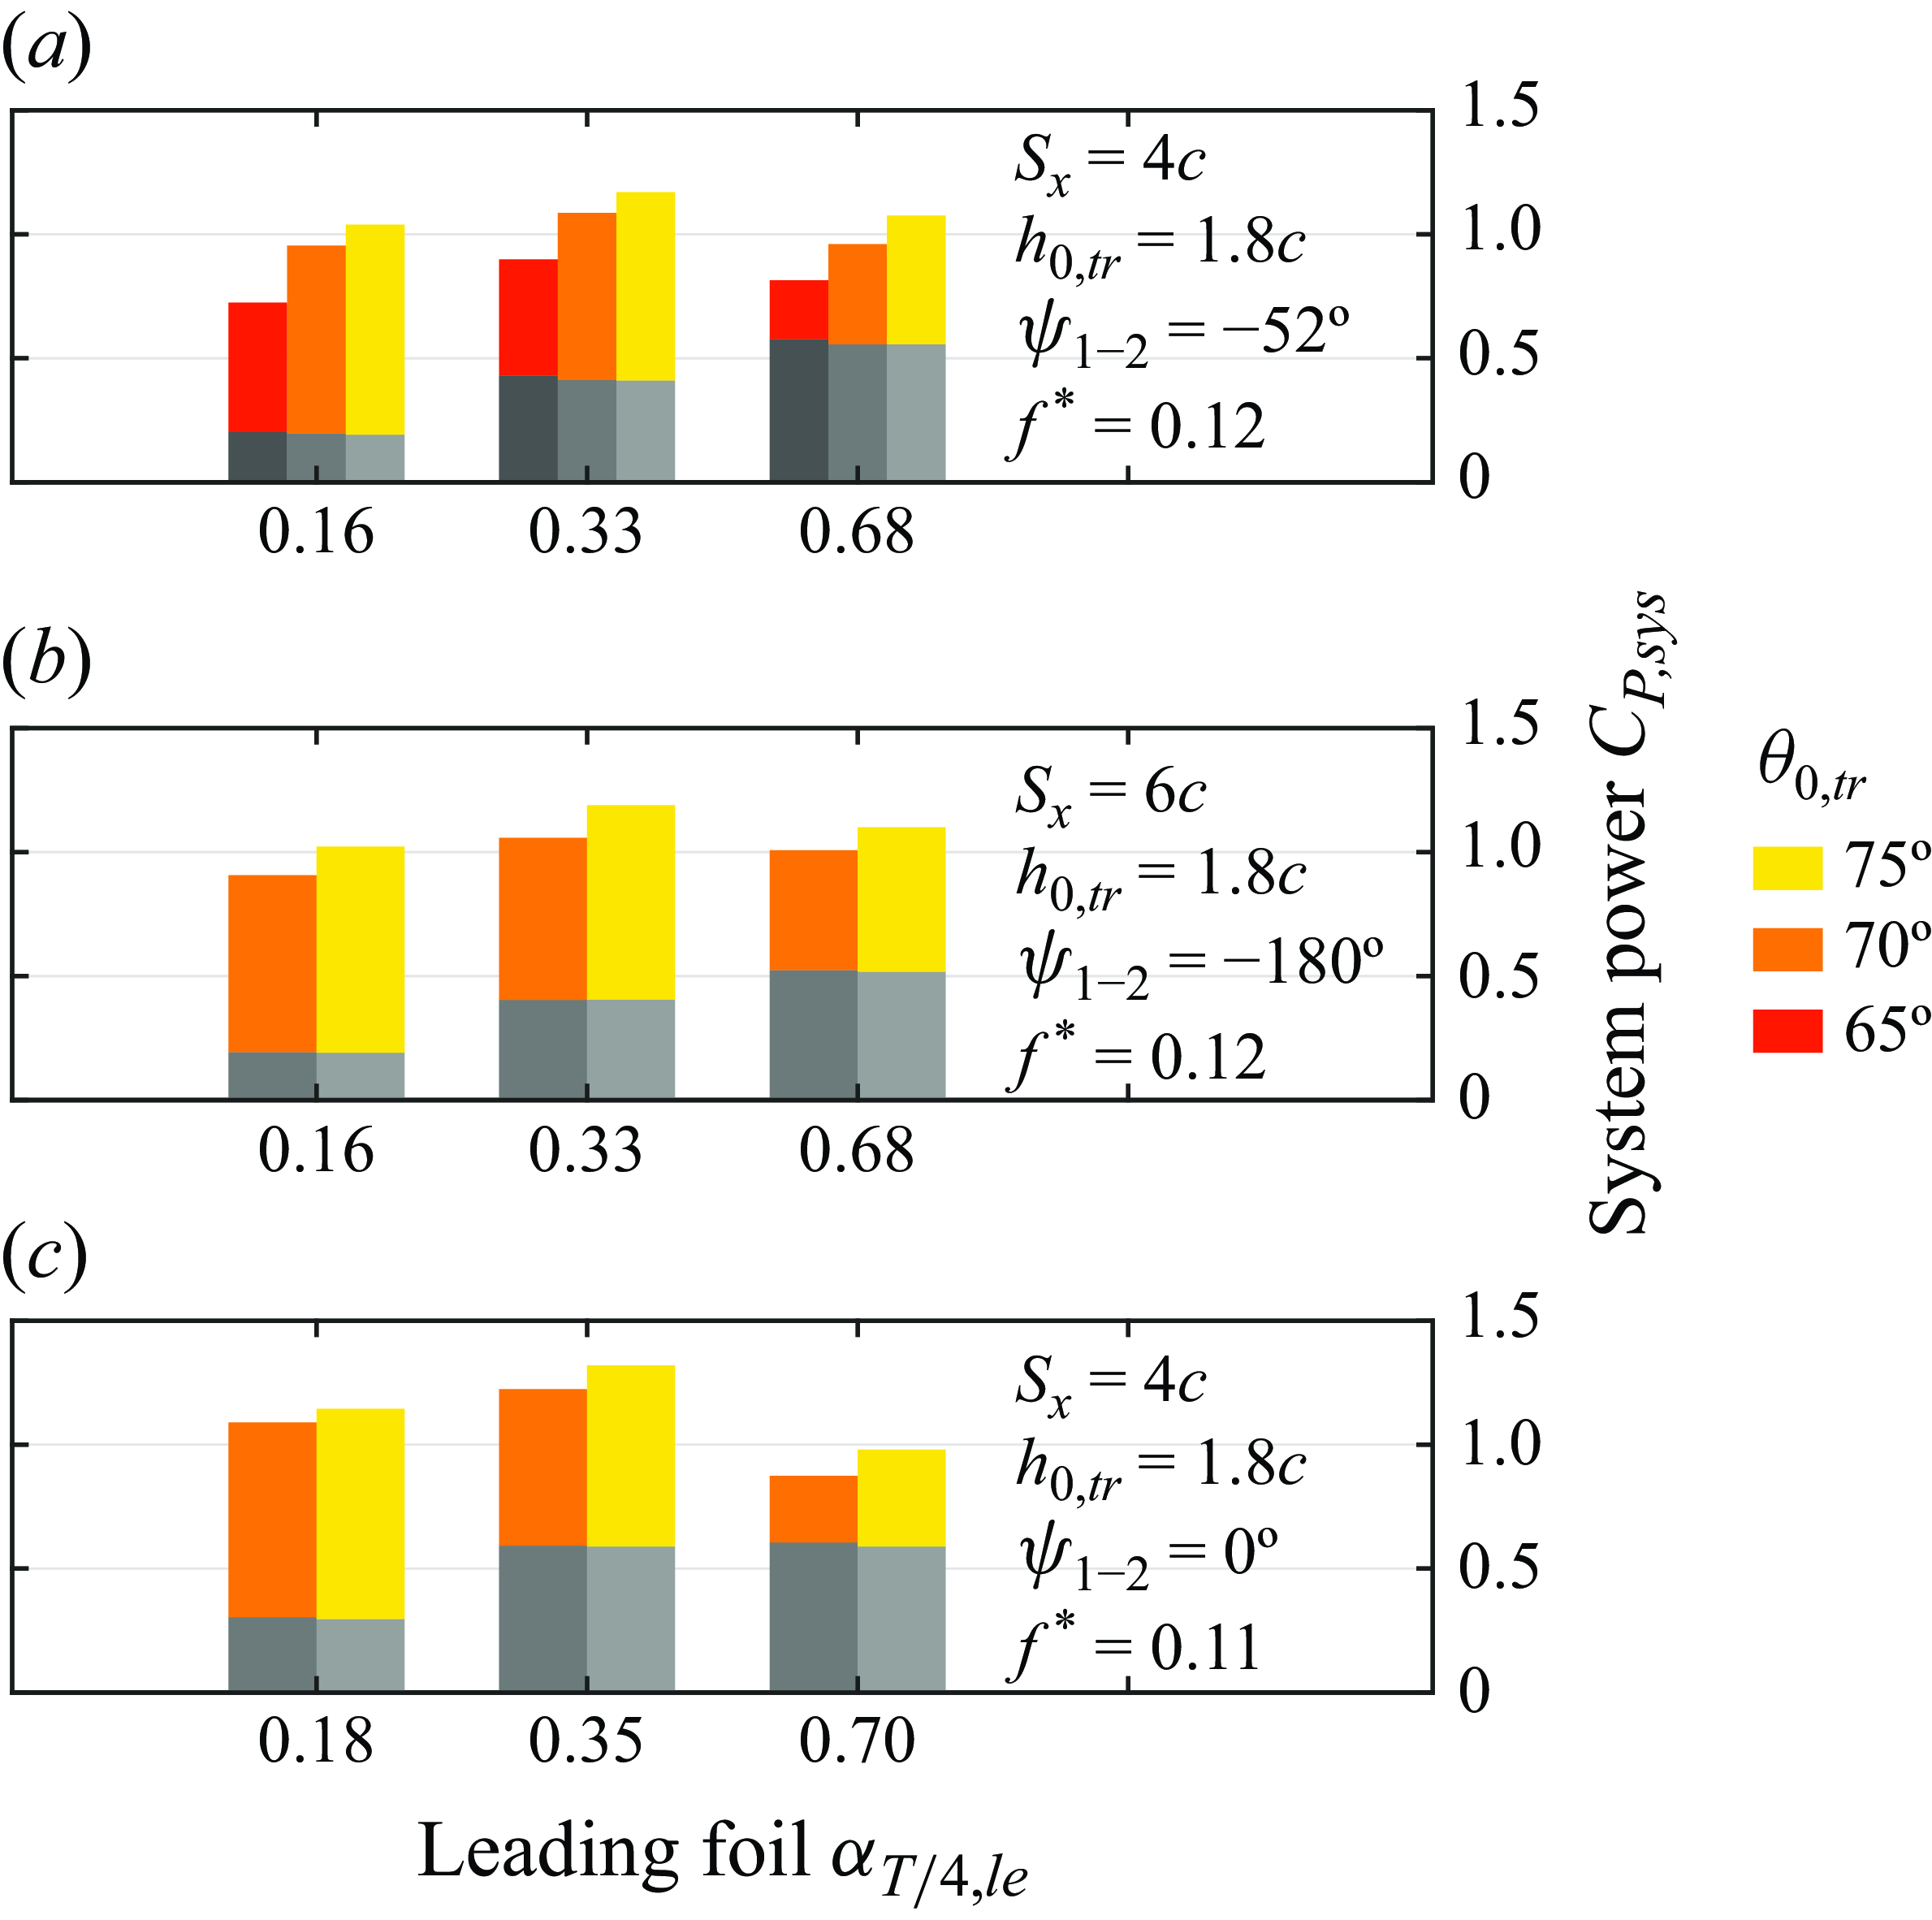
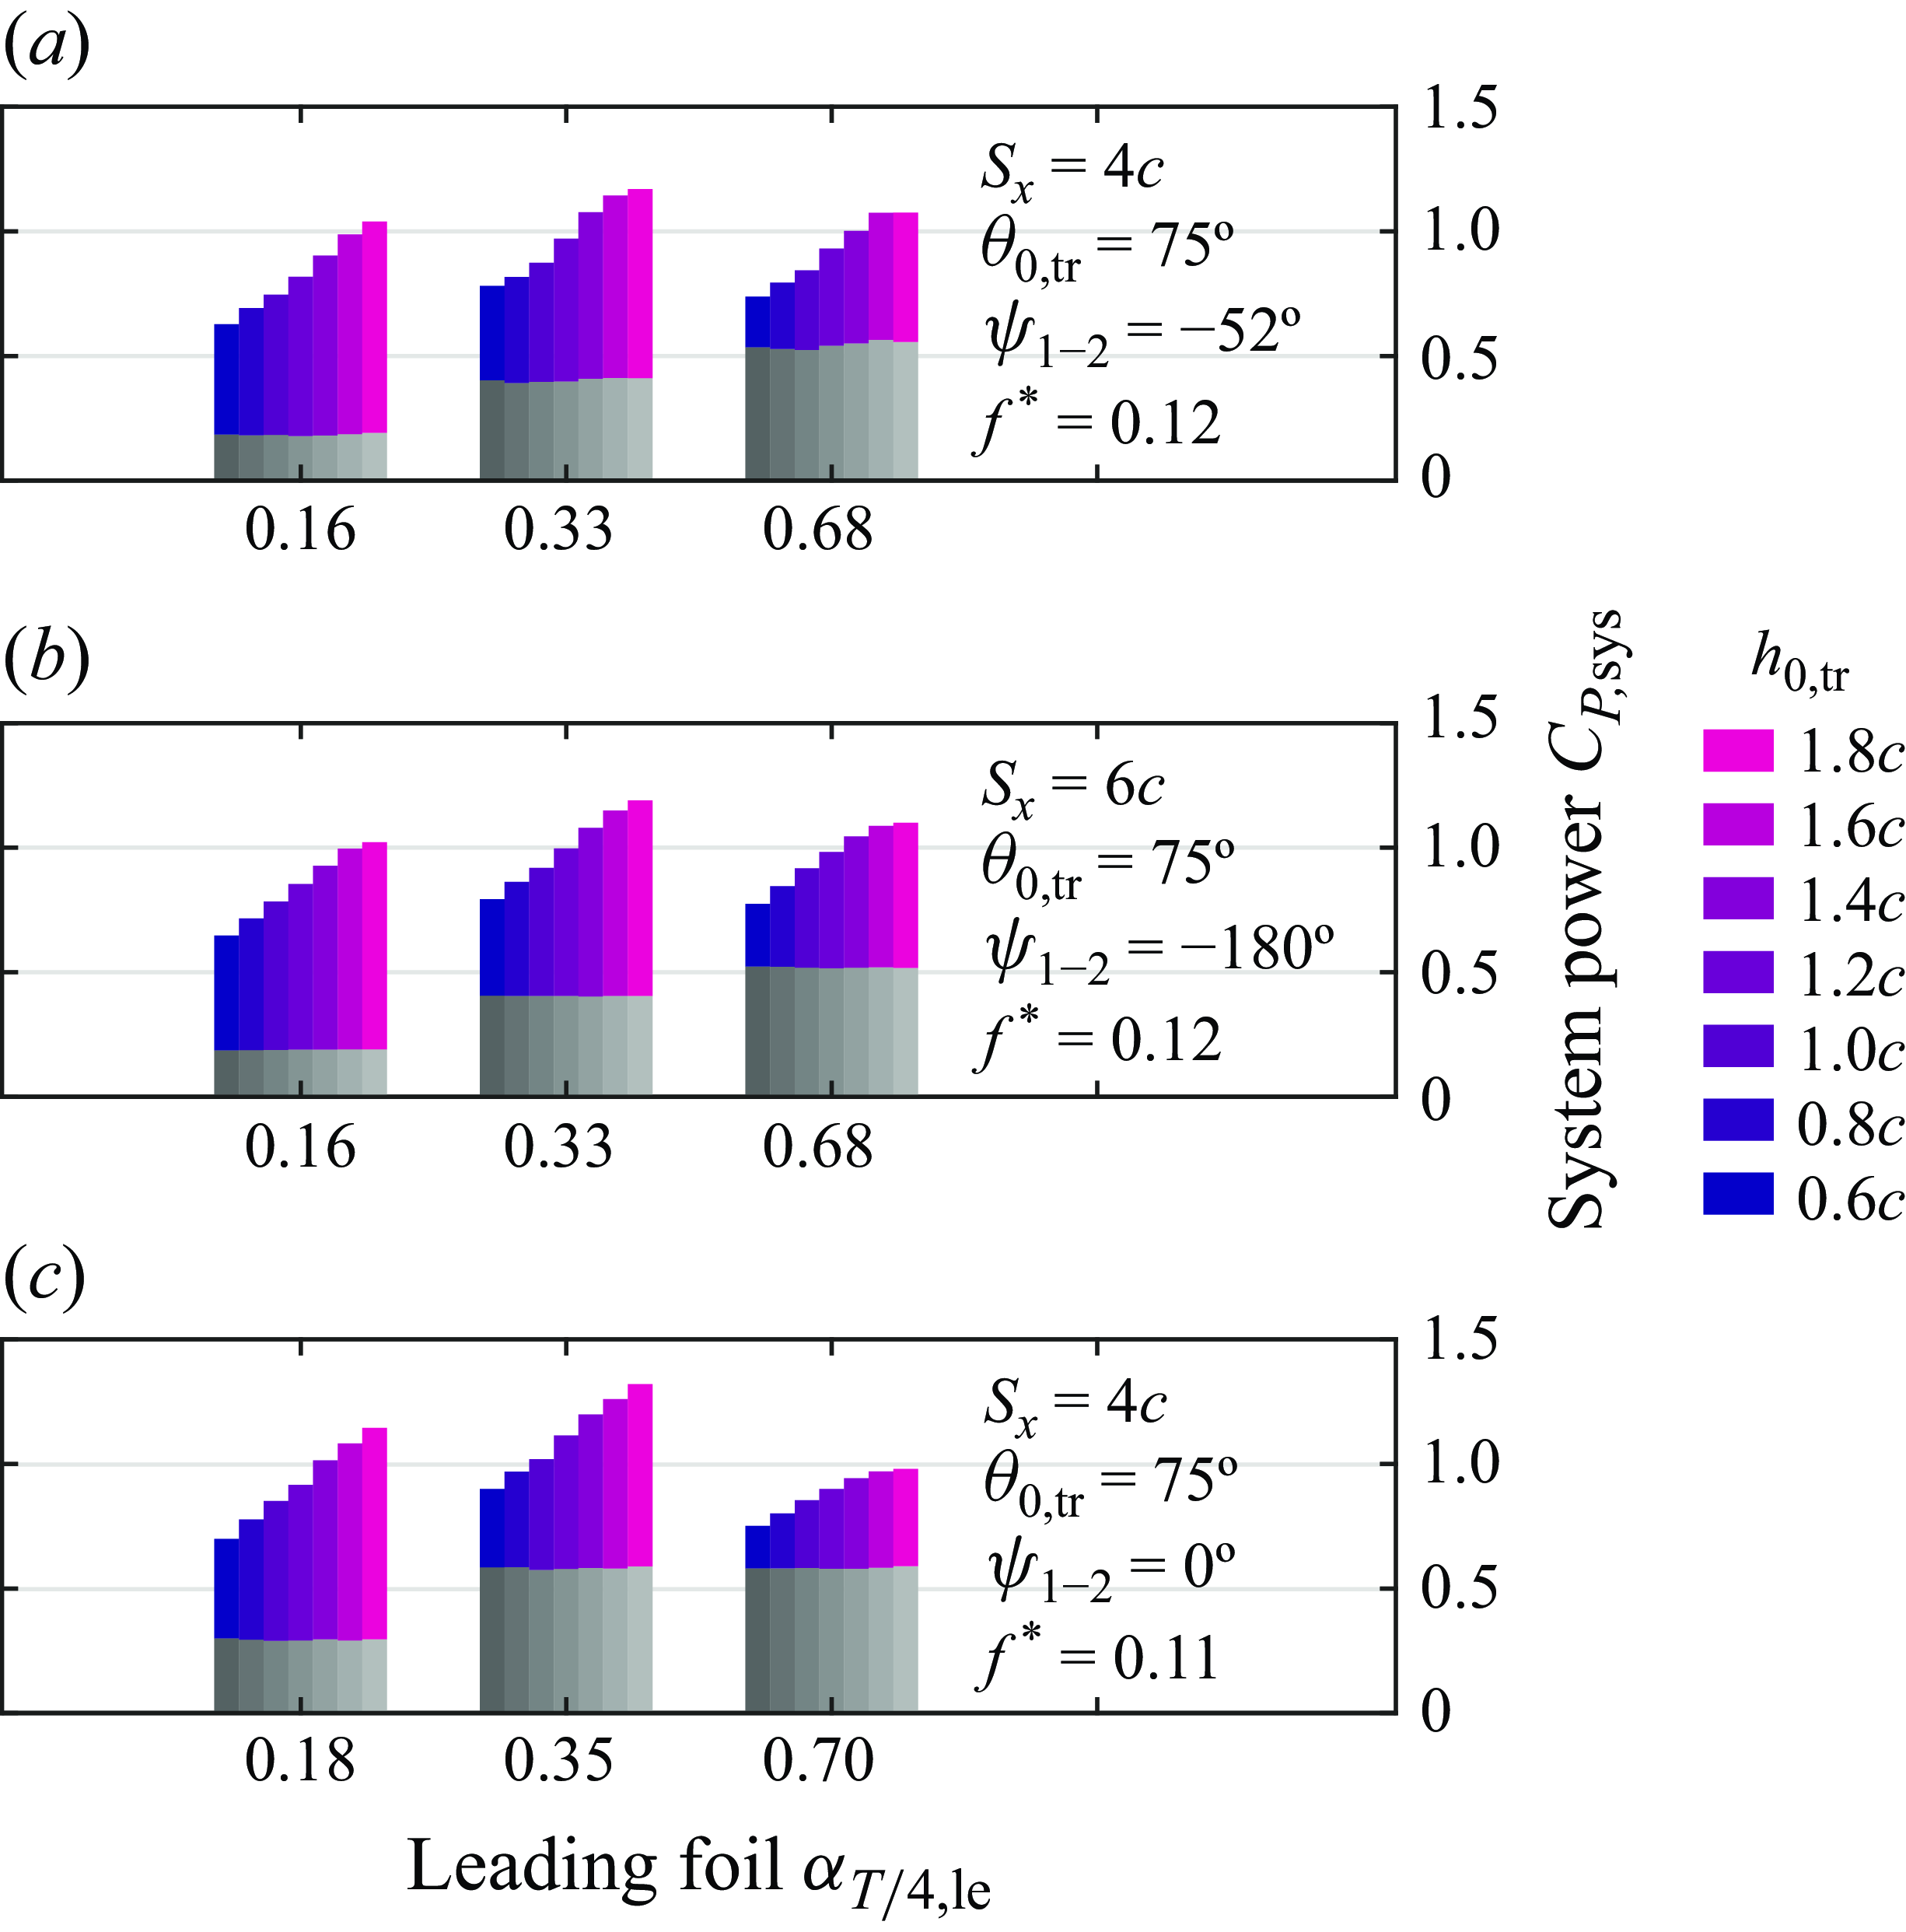
Power extracted by the system as a function of the trailing-foil heave amplitude $h_{0,{\textit{tr}}}$
. The grey bars are the power extracted by the leading foil, while the coloured bars are the power from the trailing foil.
$h_{0,{\textit{tr}}}$
. The grey bars are the power extracted by the leading foil, while the coloured bars are the power from the trailing foil.
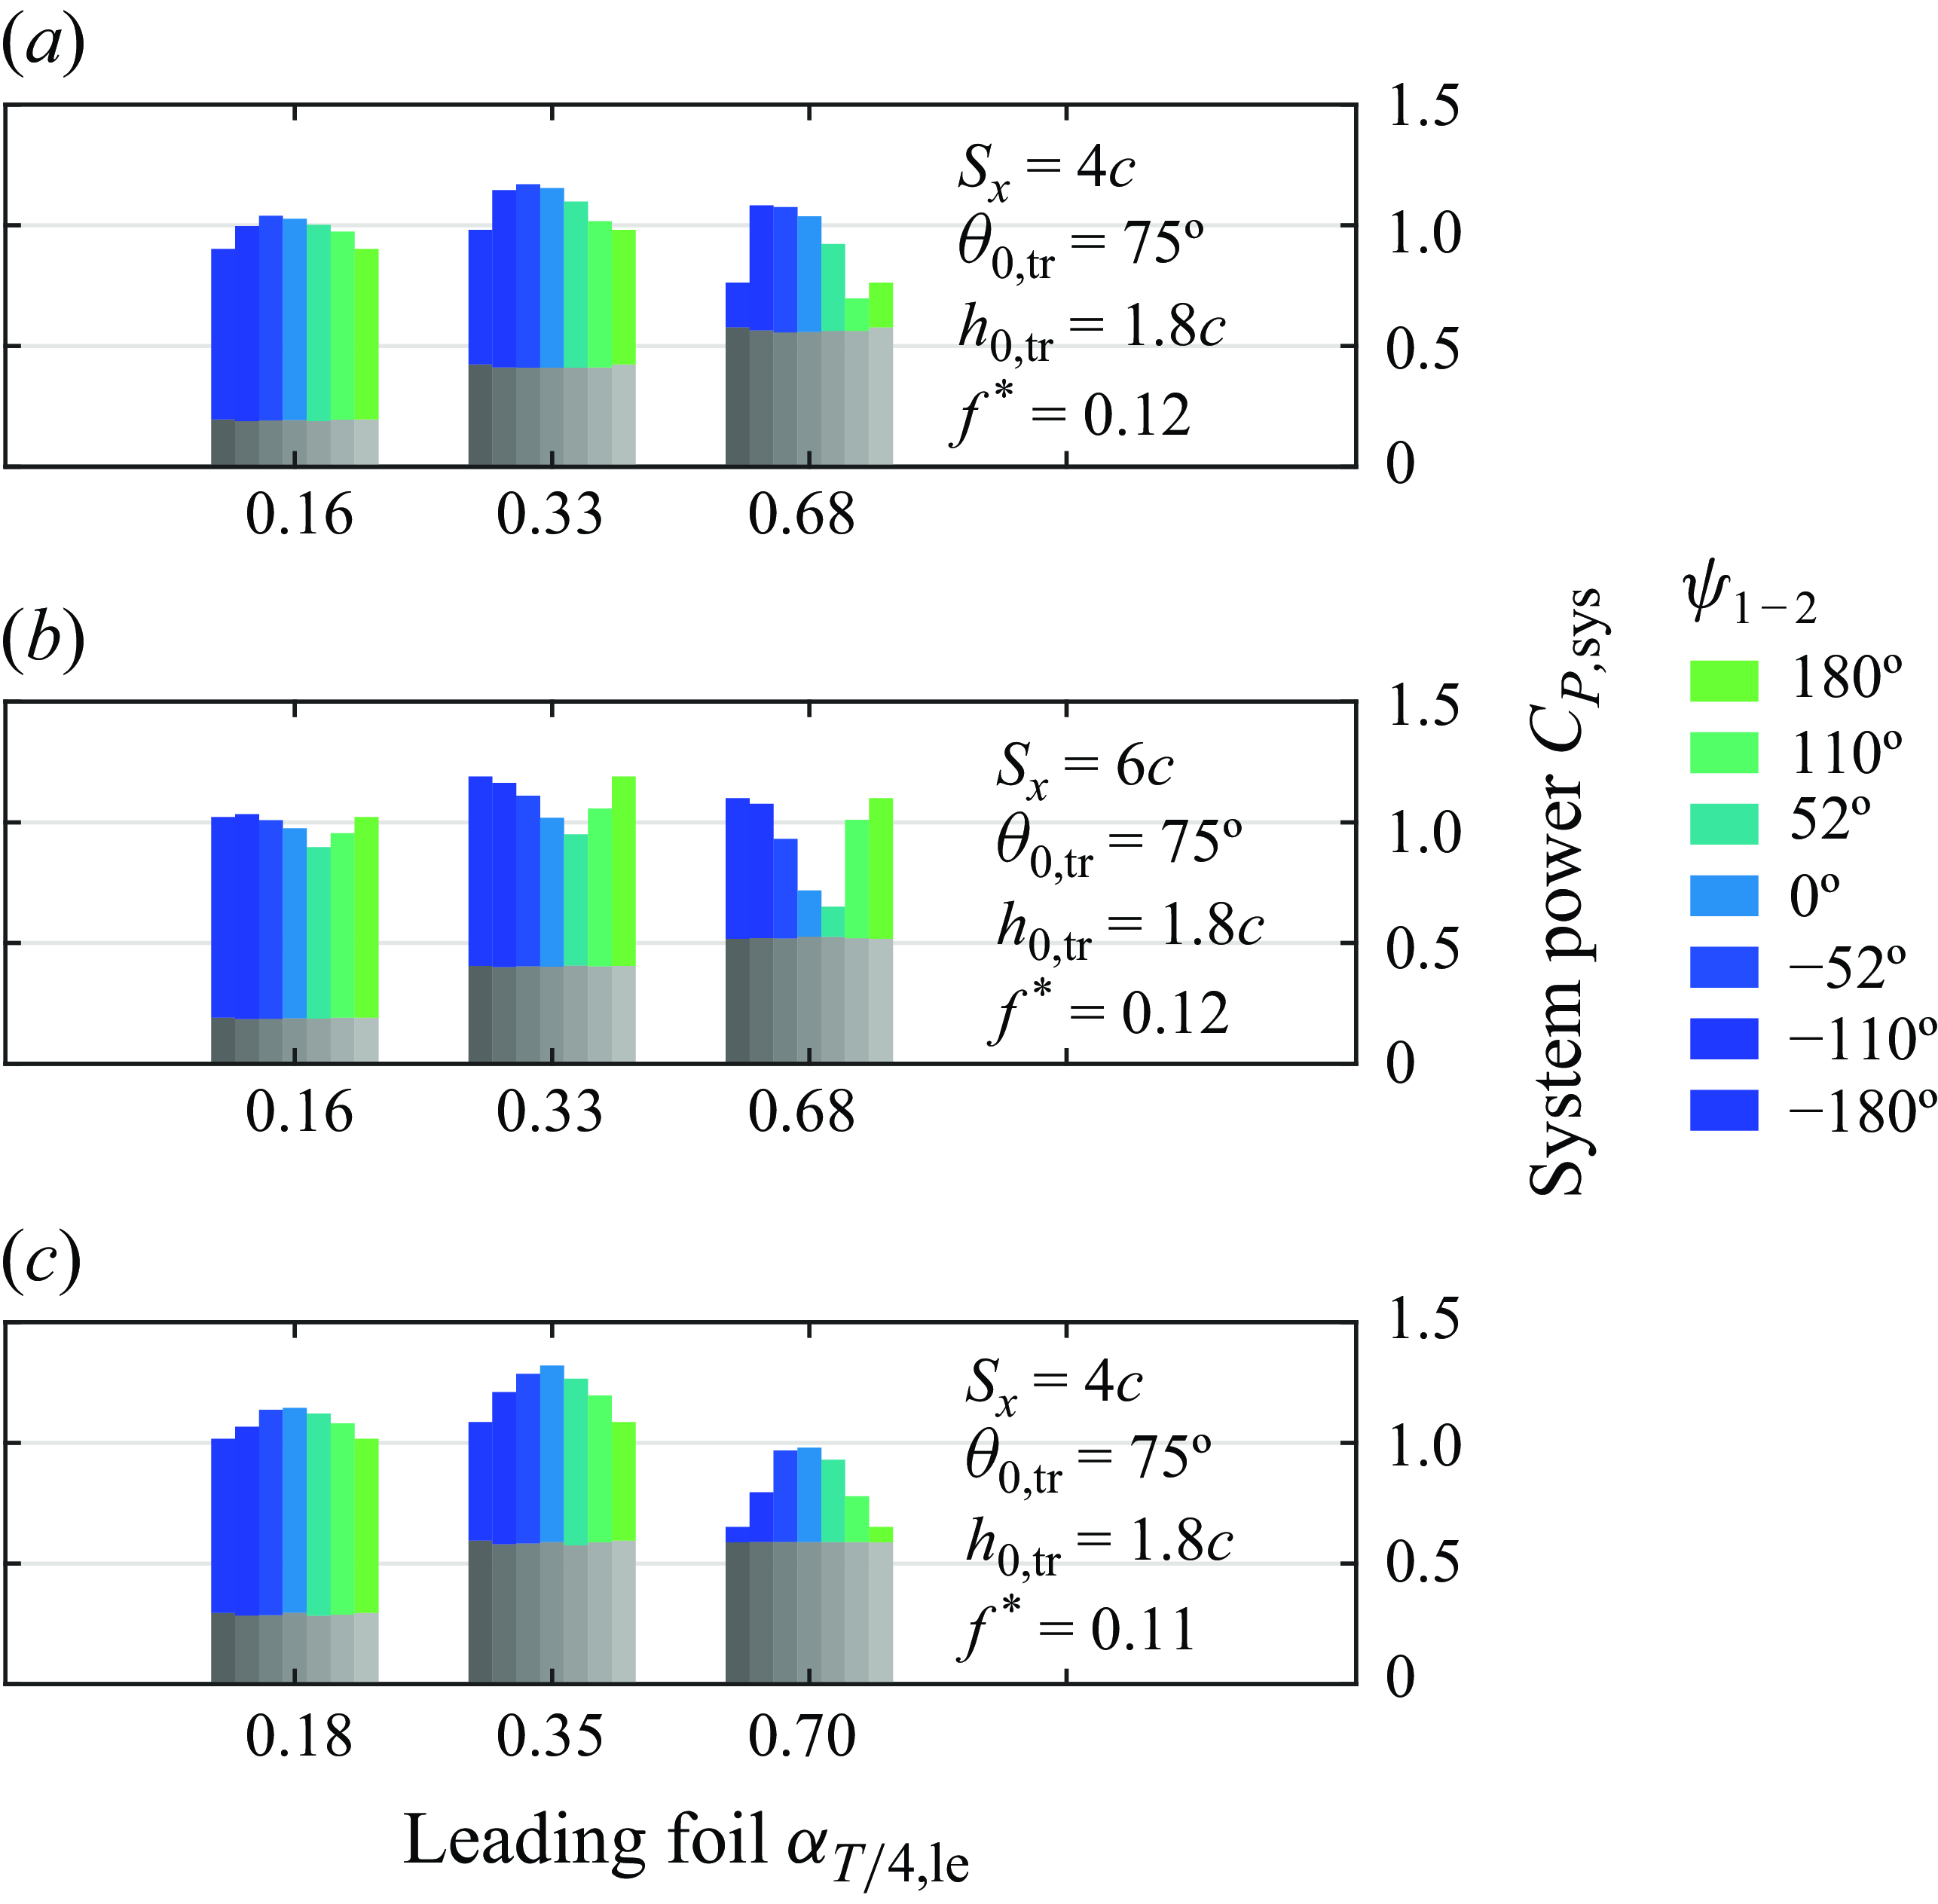
Power extracted by the system as a function of inter-foil phase $\psi _{12}$
. The grey bars are the power extracted by the leading foil, while the coloured bars are the power from the trailing foil.
$\psi _{12}$
. The grey bars are the power extracted by the leading foil, while the coloured bars are the power from the trailing foil.
It would seem logical to assess the performance of the tandem array through the Betz efficiency (2.3) as with the single-foil results presented in figure 3. The problem arises in choosing the appropriate scale of energy available to both foils in the array. Several factors complicate the choice of efficiency metric: the large difference in flow windows for each foil, the wake deficit region and bypass flow region, the presence of strong wake vortices that result in either better or worse trailing-foil performance and the increasingly unsteady character of the wake at higher $\alpha _{T/4,{le}}$
ranges. An array efficiency would require information on both foils’ kinematic configuration as well as the effects of wake–foil interactions. This was addressed by Ribeiro et al. (Reference Ribeiro, Su, Guillaumin, Breuer and Franck2021) with a rescaled trailing-foil efficiency that incorporated the energy from the mean wake flow and the turbulent kinetic energy. While this modified efficiency provides a more complete picture of the performance of the array, the reliance on flow measurements to obtain this modified efficiency makes it unsuitable for systematically evaluating the performance of configurations where the trailing foil has a large range of different kinematics. The predictive model subsequently proposed by Ribeiro & Franck (Reference Ribeiro and Franck2024) could offer a simplified approach, where the predicted trailing-foil efficiency could be used to rescale the power obtained from it and finally using the result along with the leading foil’s power to obtain a system-wide efficiency. In this study, however, we focus only on the cumulative power of the two foils as it allows us to assess the effective performance of the array and simplify the array analysis, while still making the primary effects of wake–foil interactions evident.
$\alpha _{T/4,{le}}$
ranges. An array efficiency would require information on both foils’ kinematic configuration as well as the effects of wake–foil interactions. This was addressed by Ribeiro et al. (Reference Ribeiro, Su, Guillaumin, Breuer and Franck2021) with a rescaled trailing-foil efficiency that incorporated the energy from the mean wake flow and the turbulent kinetic energy. While this modified efficiency provides a more complete picture of the performance of the array, the reliance on flow measurements to obtain this modified efficiency makes it unsuitable for systematically evaluating the performance of configurations where the trailing foil has a large range of different kinematics. The predictive model subsequently proposed by Ribeiro & Franck (Reference Ribeiro and Franck2024) could offer a simplified approach, where the predicted trailing-foil efficiency could be used to rescale the power obtained from it and finally using the result along with the leading foil’s power to obtain a system-wide efficiency. In this study, however, we focus only on the cumulative power of the two foils as it allows us to assess the effective performance of the array and simplify the array analysis, while still making the primary effects of wake–foil interactions evident.
Figures 6–8 present a cross-sectional overview of the system power extraction results of the two-foil tandem array. The total power coefficient of the system is given by
 \begin{equation} C_{P,{sys}}=\frac {\overline {P_{{le}}(t)}+\overline {P_{{tr}}(t)}}{0.5 \rho U_\infty ^3 cb}, \end{equation}
and each figure shows the variation of the system power as a function of different parameter combinations for the array. Within each figure, there are three sub-figures, each representing a different sampling of the trailing-foil parameters. Each sub-figure contains three groups of power coefficients representing the shear-layer, LEV and LEV + TEV regimes, defined by three values of $\alpha _{T/4,{le}}$
. Lastly, in each group of
$\alpha _{T/4,{le}}$
. Lastly, in each group of $C_P$
plots, a bar-graph ‘stack’ is shown in which a specific parameter is systematically varied:
$C_P$
plots, a bar-graph ‘stack’ is shown in which a specific parameter is systematically varied: $\theta _{0,{\textit{tr}}}$
,
$\theta _{0,{\textit{tr}}}$
, $h_{0,{\textit{tr}}}$
and
$h_{0,{\textit{tr}}}$
and $\psi _{1-2}$
(figures 6, 7 and 8, respectively). Each bar-graph stack shows the leading-foil
$\psi _{1-2}$
(figures 6, 7 and 8, respectively). Each bar-graph stack shows the leading-foil $C_{P,{le}}$
in grey (which is more-or-less constant within each group, since the leading-foil kinematics are fixed for that group); the trailing-foil performance,
$C_{P,{le}}$
in grey (which is more-or-less constant within each group, since the leading-foil kinematics are fixed for that group); the trailing-foil performance, $C_{P,{tr}}$
, is shown in colour.
$C_{P,{tr}}$
, is shown in colour.
Results from Kinsey & Dumas (Reference Kinsey and Dumas2012) and Xu, Sun & Tan (Reference Xu, Sun and Tan2016) identified that $S_x$
mainly affects the timing of wake–foil interactions. And while other parameters like
$S_x$
mainly affects the timing of wake–foil interactions. And while other parameters like $f^*$
and
$f^*$
and $\psi _{1-2}$
also affect directly these interactions,
$\psi _{1-2}$
also affect directly these interactions, $S_x$
further influences the energy extracted by the downstream foil due to the wake velocity deficit. Figures 6(a,b), 7(a,b) and 8(a,b) correspond to cases that have the same
$S_x$
further influences the energy extracted by the downstream foil due to the wake velocity deficit. Figures 6(a,b), 7(a,b) and 8(a,b) correspond to cases that have the same $\alpha _{T/4,{le}}$
values but different inter-foil separations (
$\alpha _{T/4,{le}}$
values but different inter-foil separations ( $S_x=4c$
in (a) and
$S_x=4c$
in (a) and $6c$
in (b)); therefore the only parameter changing is
$6c$
in (b)); therefore the only parameter changing is $S_x$
(at optimal phasing,
$S_x$
(at optimal phasing, $\psi _{1-2}$
). We observe that the magnitude of
$\psi _{1-2}$
). We observe that the magnitude of $C_{P,{sys}}$
does not vary significantly due to
$C_{P,{sys}}$
does not vary significantly due to $S_x$
, which we can explain with figure 5(a–c), where it is observed that the wake velocity does not recover very much between these two separations in all wake regimes, and thus the trailing foil faces approximately the same decreased upstream flow velocity for both separations tested. Considering the negligible variation of wake velocity for the tested
$S_x$
, which we can explain with figure 5(a–c), where it is observed that the wake velocity does not recover very much between these two separations in all wake regimes, and thus the trailing foil faces approximately the same decreased upstream flow velocity for both separations tested. Considering the negligible variation of wake velocity for the tested $S_x$
, it might be desirable to space the foils closely to increase the number of turbines deployed in a given area, i.e. the power density of the array. As shown by figure 5(e), decreasing
$S_x$
, it might be desirable to space the foils closely to increase the number of turbines deployed in a given area, i.e. the power density of the array. As shown by figure 5(e), decreasing $S_x$
would ensure that vortices being shed from the leading foil are stronger and more coherent, and therefore could be harnessed by the trailing foil more effectively. However, this also means that strong negative vortex–foil interactions could also occur, making optimising the array kinematics all the more important. It is important to note that decreased leading-foil performance can result from spacing the foils closer together, as observed by Xu et al. (Reference Xu, Sun and Tan2016), who noted that the blockage effect of the trailing foil on the leading foil becomes more important at these close separations. This detrimental effect was also shown by Zhao et al. (Reference Zhao, Jiang, Wang, Qadri, Li and Tang2023) in their passive system who found that as
$S_x$
would ensure that vortices being shed from the leading foil are stronger and more coherent, and therefore could be harnessed by the trailing foil more effectively. However, this also means that strong negative vortex–foil interactions could also occur, making optimising the array kinematics all the more important. It is important to note that decreased leading-foil performance can result from spacing the foils closer together, as observed by Xu et al. (Reference Xu, Sun and Tan2016), who noted that the blockage effect of the trailing foil on the leading foil becomes more important at these close separations. This detrimental effect was also shown by Zhao et al. (Reference Zhao, Jiang, Wang, Qadri, Li and Tang2023) in their passive system who found that as $S_x$
is decreased near
$S_x$
is decreased near $2c$
, the trailing foil’s influence on the leading foil can lead to decreased leading-foil performance.
$2c$
, the trailing foil’s influence on the leading foil can lead to decreased leading-foil performance.
Figure 6 demonstrates that increases in the trailing-foil pitch amplitude, $\theta _{0,{\textit{tr}}}$
, correlate with increased trailing-foil performance. As proposed by Ribeiro et al. (Reference Ribeiro, Su, Guillaumin, Breuer and Franck2021), we consider an effective wake velocity,
$\theta _{0,{\textit{tr}}}$
, correlate with increased trailing-foil performance. As proposed by Ribeiro et al. (Reference Ribeiro, Su, Guillaumin, Breuer and Franck2021), we consider an effective wake velocity, $\overline {u}_{\textit{eff}}$
, for the trailing foil given by integrating the time-averaged wake velocity (
$\overline {u}_{\textit{eff}}$
, for the trailing foil given by integrating the time-averaged wake velocity ( $\overline {u}_{{wake}}$
) within the swept area
$\overline {u}_{{wake}}$
) within the swept area $1c$
upstream of the trailing foil. This can be used to rescale
$1c$
upstream of the trailing foil. This can be used to rescale $f^*_{{tr}}$
and
$f^*_{{tr}}$
and $\alpha _{T/4,{tr}}$
. Therefore, although the physical frequency is fixed for both foils in the array, the trailing foil’s effective non-dimensional frequency is increased with respect to the leading foil’s according to
$\alpha _{T/4,{tr}}$
. Therefore, although the physical frequency is fixed for both foils in the array, the trailing foil’s effective non-dimensional frequency is increased with respect to the leading foil’s according to $f^*_{{tr}} =fc/\overline {u}_{\textit{eff}}$
, due to the diminished velocity faced by the trailing foil with respect to the leading foil (see figure 5
a–c). In their single-foil experiments Kim et al. (Reference Kim, Strom, Mandre and Breuer2017) showed that the optimal pitch amplitude rises as
$f^*_{{tr}} =fc/\overline {u}_{\textit{eff}}$
, due to the diminished velocity faced by the trailing foil with respect to the leading foil (see figure 5
a–c). In their single-foil experiments Kim et al. (Reference Kim, Strom, Mandre and Breuer2017) showed that the optimal pitch amplitude rises as $f^*$
is increased, and this same trend was observed in the numerical simulations of Kinsey & Dumas (Reference Kinsey and Dumas2008). This effect can be explained by observing that the relative speed between the oncoming flow and the trailing foil is lower (leading to the increased
$f^*$
is increased, and this same trend was observed in the numerical simulations of Kinsey & Dumas (Reference Kinsey and Dumas2008). This effect can be explained by observing that the relative speed between the oncoming flow and the trailing foil is lower (leading to the increased $f^*_{{tr}}$
relative to
$f^*_{{tr}}$
relative to $f^*$
) which, by rescaling (2.4) with
$f^*$
) which, by rescaling (2.4) with $\overline {u}_{\textit{eff}}$
,
$\overline {u}_{\textit{eff}}$
,
 \begin{equation} \alpha _{T/4,{tr}}=\theta _{0,{\textit{tr}}}-\tan ^{-1}\left (2\pi h^*_{{tr}} f^*_{{tr}}\right )=\theta _{0,{\textit{tr}}}-\tan ^{-1}\left (2\pi h^*_{{tr}} \left (\frac {fc}{\overline {u}_{\textit{eff}}}\right )\right ), \end{equation}
results in a lower maximum effective angle of attack. This can then be compensated for by a shift of the optimal $\theta _{0,{\textit{tr}}}$
towards higher amplitudes, possibly beyond the maximum value tested (
$\theta _{0,{\textit{tr}}}$
towards higher amplitudes, possibly beyond the maximum value tested ( $75^{\circ}$
) in this sequence of experiments.
$75^{\circ}$
) in this sequence of experiments.
Figure 7 presents the system performance dependency on the trailing-foil heave amplitude and demonstrates that the performance of the trailing foil rises with increasing $h_{0,{\textit{tr}}}$
in all three wake regimes. This was also observed for a single foil by Kinsey & Dumas (Reference Kinsey and Dumas2008), and although their work focused on the efficiency of the foil (which is scaled by the swept area; see (2.6)), they remarked that by increasing the foil’s
$h_{0,{\textit{tr}}}$
in all three wake regimes. This was also observed for a single foil by Kinsey & Dumas (Reference Kinsey and Dumas2008), and although their work focused on the efficiency of the foil (which is scaled by the swept area; see (2.6)), they remarked that by increasing the foil’s $h_0$
a higher
$h_0$
a higher $C_P$
(which is scaled by the foil’s surface area) was obtained despite a lower efficiency. Additionally, by allowing
$C_P$
(which is scaled by the foil’s surface area) was obtained despite a lower efficiency. Additionally, by allowing $h_{0,{\textit{tr}}}$
to be much larger than
$h_{0,{\textit{tr}}}$
to be much larger than $h_{0,{le}}$
, the trailing foil can access higher momentum fluid and thus improve its
$h_{0,{le}}$
, the trailing foil can access higher momentum fluid and thus improve its $C_{P,{tr}}$
. Note how figure 5 shows an increase in the amplitude of the bypass flow behind the leading foil, most notably in the LEV + TEV regime where it reaches up to
$C_{P,{tr}}$
. Note how figure 5 shows an increase in the amplitude of the bypass flow behind the leading foil, most notably in the LEV + TEV regime where it reaches up to $\bar {u}_{{wake}}/U_\infty \sim 1.1$
. As with the pitch amplitude discussion earlier, it is possible that our test matrix did not explore sufficiently large values of
$\bar {u}_{{wake}}/U_\infty \sim 1.1$
. As with the pitch amplitude discussion earlier, it is possible that our test matrix did not explore sufficiently large values of $h_{0,{\textit{tr}}}$
, although the incremental improvement does seem to be flattening out. Interestingly, Zhao et al. (Reference Zhao, Jiang, Wang, Qadri, Li and Tang2023) also found that the best performance of the trailing foil was achieved for higher heaving and pitching amplitudes at inter-foil separations ranging from
$h_{0,{\textit{tr}}}$
, although the incremental improvement does seem to be flattening out. Interestingly, Zhao et al. (Reference Zhao, Jiang, Wang, Qadri, Li and Tang2023) also found that the best performance of the trailing foil was achieved for higher heaving and pitching amplitudes at inter-foil separations ranging from $S_x=1c$
to
$S_x=1c$
to $6c$
, even though they had a fully passive system. Notably, the local
$6c$
, even though they had a fully passive system. Notably, the local $C_{P,{tr}}$
maximum is only reached at the LEV + TEV wake regime at
$C_{P,{tr}}$
maximum is only reached at the LEV + TEV wake regime at $h_{0,{\textit{tr}}}=1.6c$
, after which it plateaus. One possible reason for this is that the more unsteady wake of the LEV + TEV regime limits the power extraction of the trailing foil at very high
$h_{0,{\textit{tr}}}=1.6c$
, after which it plateaus. One possible reason for this is that the more unsteady wake of the LEV + TEV regime limits the power extraction of the trailing foil at very high $h_{0,{\textit{tr}}}$
due to the presence of strong vortices in this region.
$h_{0,{\textit{tr}}}$
due to the presence of strong vortices in this region.
The performance variations of the trailing foil with respect to changing the inter-foil phase, $\psi _{1-2}$
, are presented in figure 8. Many studies (Ashraf et al. Reference Ashraf, Young, Lai and Platzer2011; Kinsey & Dumas Reference Kinsey and Dumas2012; Karakas & Fenercioglu Reference Karakas and Fenercioglu2017; Ribeiro et al. Reference Ribeiro, Su, Guillaumin, Breuer and Franck2021) have explored the effect of this critical parameter on the performance of the array. For foils sharing the same
$\psi _{1-2}$
, are presented in figure 8. Many studies (Ashraf et al. Reference Ashraf, Young, Lai and Platzer2011; Kinsey & Dumas Reference Kinsey and Dumas2012; Karakas & Fenercioglu Reference Karakas and Fenercioglu2017; Ribeiro et al. Reference Ribeiro, Su, Guillaumin, Breuer and Franck2021) have explored the effect of this critical parameter on the performance of the array. For foils sharing the same $f^*$
,
$f^*$
, $\theta _0$
and
$\theta _0$
and $h_0$
, Ribeiro et al. (Reference Ribeiro, Su, Guillaumin, Breuer and Franck2021) evaluated the tandem array’s performance for a large range of
$h_0$
, Ribeiro et al. (Reference Ribeiro, Su, Guillaumin, Breuer and Franck2021) evaluated the tandem array’s performance for a large range of $\psi _{1-2}$
and observed the same harmonic trends that figure 8 demonstrates. The effect of
$\psi _{1-2}$
and observed the same harmonic trends that figure 8 demonstrates. The effect of $\psi _{1-2}$
becomes more pronounced as
$\psi _{1-2}$
becomes more pronounced as $\alpha _{T/4,{le}}$
is increased due to the stronger wake features, leading to variations of different magnitude in
$\alpha _{T/4,{le}}$
is increased due to the stronger wake features, leading to variations of different magnitude in $C_{P,{tr}}$
for each wake regime (
$C_{P,{tr}}$
for each wake regime ( $\pm 0.05$
in the shear-layer regime and
$\pm 0.05$
in the shear-layer regime and $\pm 0.25$
in the LEV + TEV regime). The timing of wake–foil interactions, dictated mainly by
$\pm 0.25$
in the LEV + TEV regime). The timing of wake–foil interactions, dictated mainly by $\psi _{1-2}$
, will lead to optimal or suboptimal parameter combinations, which can be more easily identified by using the wake phase parameter,
$\psi _{1-2}$
, will lead to optimal or suboptimal parameter combinations, which can be more easily identified by using the wake phase parameter, $\varPhi$
, from Ribeiro et al. (Reference Ribeiro, Su, Guillaumin, Breuer and Franck2021) (1.1).
$\varPhi$
, from Ribeiro et al. (Reference Ribeiro, Su, Guillaumin, Breuer and Franck2021) (1.1).
(a) Power extracted by the trailing foil for different kinematic configurations within the LEV + TEV wake regime as a function of the wake phase parameter $\varPhi$
from Ribeiro et al. (Reference Ribeiro, Su, Guillaumin, Breuer and Franck2021). The cases highlighted by
$\varPhi$
from Ribeiro et al. (Reference Ribeiro, Su, Guillaumin, Breuer and Franck2021). The cases highlighted by $\bigtriangleup$
markers and
$\bigtriangleup$
markers and $\bigtriangledown$
markers demonstrate constructive and destructive interactions, respectively, and are analysed with PIV in § 3.5. (b) Power extracted by the trailing foil at optimal values of
$\bigtriangledown$
markers demonstrate constructive and destructive interactions, respectively, and are analysed with PIV in § 3.5. (b) Power extracted by the trailing foil at optimal values of $\varPhi$
for each wake regime, for a range of
$\varPhi$
for each wake regime, for a range of $\theta _{0,{\textit{tr}}}$
, and with maximum
$\theta _{0,{\textit{tr}}}$
, and with maximum $C_{P,{tr}}$
values highlighted for each
$C_{P,{tr}}$
values highlighted for each $\theta _{0,{\textit{tr}}}$
. Data are scaled using the trailing foil’s
$\theta _{0,{\textit{tr}}}$
. Data are scaled using the trailing foil’s $\alpha _{T/4,{tr}}$
and with the effective wake velocity,
$\alpha _{T/4,{tr}}$
and with the effective wake velocity, $\overline {u}_{\textit{eff}}$
, where it is observed that maximum values of
$\overline {u}_{\textit{eff}}$
, where it is observed that maximum values of $C_{P,{tr}}$
fall within a range of
$C_{P,{tr}}$
fall within a range of $0.32\lt \alpha _{T/4,{tr}}\lt 0.41$
rad, highlighted in green.
$0.32\lt \alpha _{T/4,{tr}}\lt 0.41$
rad, highlighted in green.

Figure 9(a) presents cases in the LEV + TEV regime over a range of trailing-foil heave, $h_{0,{\textit{tr}}}$
, and foil separation,
$h_{0,{\textit{tr}}}$
, and foil separation, $S_x$
, scaled using the wake phase parameter. We observe that, while cases with low performance fall in a clear trough at
$S_x$
, scaled using the wake phase parameter. We observe that, while cases with low performance fall in a clear trough at $\varPhi =90^{\circ}$
, high-performance cases fall within a much wider
$\varPhi =90^{\circ}$
, high-performance cases fall within a much wider $\varPhi$
envelope spanning a range of
$\varPhi$
envelope spanning a range of $-180^{\circ}$
to
$-180^{\circ}$
to $0^{\circ}$
. Although this optimal range is rather flat, most of the cases shown have an optimal wake phase of
$0^{\circ}$
. Although this optimal range is rather flat, most of the cases shown have an optimal wake phase of $\varPhi =-90^{\circ}$
, with a slight negative shift at higher
$\varPhi =-90^{\circ}$
, with a slight negative shift at higher $h_{0,{\textit{tr}}}$
, which seems to indicate that the phase relationship between the trailing foil and the wake is sensitive to having a larger trailing-foil heaving amplitude than that of the leading. Although not shown, cases in the LEV regime show the worst-performing configurations at a value of
$h_{0,{\textit{tr}}}$
, which seems to indicate that the phase relationship between the trailing foil and the wake is sensitive to having a larger trailing-foil heaving amplitude than that of the leading. Although not shown, cases in the LEV regime show the worst-performing configurations at a value of $\varPhi =0^{\circ}$
, and an envelope of high-performance cases at
$\varPhi =0^{\circ}$
, and an envelope of high-performance cases at $|\varPhi |\gt 90^{\circ}$
. This same trend is observed less clearly in the shear-layer regime due to weaker wake–foil interactions, and additionally display a small negative phase shift. Although our results for the two lowest
$|\varPhi |\gt 90^{\circ}$
. This same trend is observed less clearly in the shear-layer regime due to weaker wake–foil interactions, and additionally display a small negative phase shift. Although our results for the two lowest $\alpha _{T/4,{le}}$
regimes align with those reported by Ribeiro et al. (Reference Ribeiro, Su, Guillaumin, Breuer and Franck2021), there is a notable difference in the LEV + TEV regime, where they found an optimal value of
$\alpha _{T/4,{le}}$
regimes align with those reported by Ribeiro et al. (Reference Ribeiro, Su, Guillaumin, Breuer and Franck2021), there is a notable difference in the LEV + TEV regime, where they found an optimal value of $\varPhi =120^{\circ}$
. This suggests that due to the increased unsteadiness of the wake in the LEV + TEV regime, additional considerations are required to characterise the wake’s wavelength such as incorporating the primary LEV’s advection speed and trajectory. This echoes the results from Ribeiro & Franck (Reference Ribeiro and Franck2024) who noted that their performance prediction model for tandem foil arrays (which relies on
$\varPhi =120^{\circ}$
. This suggests that due to the increased unsteadiness of the wake in the LEV + TEV regime, additional considerations are required to characterise the wake’s wavelength such as incorporating the primary LEV’s advection speed and trajectory. This echoes the results from Ribeiro & Franck (Reference Ribeiro and Franck2024) who noted that their performance prediction model for tandem foil arrays (which relies on $\varPhi$
) showed decreased accuracy for cases in the LEV + TEV regime (especially near the values tested in this study), possibly due to the presence of additional wake vortices and an increasingly complex wake structure. As shown in figure 4(c), there is a significant secondary LEV in the LEV + TEV regime that can potentially affect the trailing foil’s performance, along with the TEV accompanying the primary LEV. Although not explored in the current study, further modifications of the wake phase could incorporate effects of these additional wake vortices.
$\varPhi$
) showed decreased accuracy for cases in the LEV + TEV regime (especially near the values tested in this study), possibly due to the presence of additional wake vortices and an increasingly complex wake structure. As shown in figure 4(c), there is a significant secondary LEV in the LEV + TEV regime that can potentially affect the trailing foil’s performance, along with the TEV accompanying the primary LEV. Although not explored in the current study, further modifications of the wake phase could incorporate effects of these additional wake vortices.
As observed by Ashraf et al. (Reference Ashraf, Young, Lai and Platzer2011) and Kinsey & Dumas (Reference Kinsey and Dumas2012), some types of wake–foil interactions can lead to dramatically improved performance of the trailing foil. As is explained in § 3.5, unexpectedly better performance can be obtained from the trailing foil due to favourable interactions with wake vortices. These types of interactions were also captured by the results of Ribeiro & Franck (Reference Ribeiro and Franck2024), where for the higher $\alpha _{T/4}$
values tested (0.4 and 0.49 rad) their model predicted vortex–foil interactions that led to significant increases in power output due to lift. A similar conclusion can be obtained from looking at figure 8, as it is apparent that the large variation in performance in the LEV + TEV regime (where wake–foil interactions are presumed to be most influential) results in a system that is strongly affected by small changes in
$\alpha _{T/4}$
values tested (0.4 and 0.49 rad) their model predicted vortex–foil interactions that led to significant increases in power output due to lift. A similar conclusion can be obtained from looking at figure 8, as it is apparent that the large variation in performance in the LEV + TEV regime (where wake–foil interactions are presumed to be most influential) results in a system that is strongly affected by small changes in $\psi _{1-2}$
. From a practical perspective, it may be beneficial to operate within the LEV regime so that the trailing foil engages in weaker wake–foil interactions, yielding a more robust performance as well as slightly better system performance at the optimal operating kinematics.
$\psi _{1-2}$
. From a practical perspective, it may be beneficial to operate within the LEV regime so that the trailing foil engages in weaker wake–foil interactions, yielding a more robust performance as well as slightly better system performance at the optimal operating kinematics.
We note that an $\alpha _{T/4,{tr}}$
scaling of across all wake regimes can be found for the performance of the trailing foil. Figure 9(b) shows cases with different trailing-foil heave and pitch,
$\alpha _{T/4,{tr}}$
scaling of across all wake regimes can be found for the performance of the trailing foil. Figure 9(b) shows cases with different trailing-foil heave and pitch, $h_{0,{\textit{tr}}}$
and
$h_{0,{\textit{tr}}}$
and $\theta _{0,{\textit{tr}}}$
, but equal wake phase,
$\theta _{0,{\textit{tr}}}$
, but equal wake phase, $\varPhi$
. As previously discussed, optimal values of
$\varPhi$
. As previously discussed, optimal values of $\varPhi$
vary among all wake regimes. As indicated by the literature (Ma et al. Reference Ma, Wang, Xie, Han, Sun and Zhang2019; Ribeiro et al. Reference Ribeiro, Su, Guillaumin, Breuer and Franck2021; Ribeiro & Franck Reference Ribeiro and Franck2024), if we assume that vortex-foil interactions generally result in poor trailing foil performance, this would indicate that for optimal values of
$\varPhi$
vary among all wake regimes. As indicated by the literature (Ma et al. Reference Ma, Wang, Xie, Han, Sun and Zhang2019; Ribeiro et al. Reference Ribeiro, Su, Guillaumin, Breuer and Franck2021; Ribeiro & Franck Reference Ribeiro and Franck2024), if we assume that vortex-foil interactions generally result in poor trailing foil performance, this would indicate that for optimal values of $\varPhi$
cases would display weaker wake-foil interactions across wake regimes. Therefore, cases shown in figure 9(b) are chosen to be within the optimal range of
$\varPhi$
cases would display weaker wake-foil interactions across wake regimes. Therefore, cases shown in figure 9(b) are chosen to be within the optimal range of $\varPhi$
of their respective wake regime. This also ensures that potentially strong vortex–foil interactions do not introduce additional variability. By additionally scaling
$\varPhi$
of their respective wake regime. This also ensures that potentially strong vortex–foil interactions do not introduce additional variability. By additionally scaling $C_{P,{tr}}$
using the mean wake velocity,
$C_{P,{tr}}$
using the mean wake velocity, $\overline {u}_{\textit{eff}}$
, figure 9(b) demonstrates how the performance of the trailing foil scales with
$\overline {u}_{\textit{eff}}$
, figure 9(b) demonstrates how the performance of the trailing foil scales with $\alpha _{T/4,{tr}}$
when subjected to similar upstream conditions. By noting that increasing
$\alpha _{T/4,{tr}}$
when subjected to similar upstream conditions. By noting that increasing $\theta _{0,{\textit{tr}}}$
shifts up the optimal value of
$\theta _{0,{\textit{tr}}}$
shifts up the optimal value of $h_{0,{\textit{tr}}}$
for all wake regimes, it follows that larger
$h_{0,{\textit{tr}}}$
for all wake regimes, it follows that larger $h_{0,{\textit{tr}}}$
at a fixed frequency increases
$h_{0,{\textit{tr}}}$
at a fixed frequency increases $\dot {h}_{{tr}}$
and therefore the power due to lift,
$\dot {h}_{{tr}}$
and therefore the power due to lift, $P_L=L \dot {h}_{{tr}}$
. However, the trailing foil’s effective angle of attack,
$P_L=L \dot {h}_{{tr}}$
. However, the trailing foil’s effective angle of attack, $\alpha _{{eff},{tr}}$
, will decrease (2.3) as
$\alpha _{{eff},{tr}}$
, will decrease (2.3) as $\dot {h}_{{tr}}$
increases, acting to reduce the lift generated by the foil. This is countered by raising
$\dot {h}_{{tr}}$
increases, acting to reduce the lift generated by the foil. This is countered by raising $\theta _{0,{\textit{tr}}}$
to increase
$\theta _{0,{\textit{tr}}}$
to increase $\alpha _{{eff},{tr}}$
and subsequently the lift, therefore obtaining higher power extraction. Three key findings can be found from these results. The first is that there is an optimal range of
$\alpha _{{eff},{tr}}$
and subsequently the lift, therefore obtaining higher power extraction. Three key findings can be found from these results. The first is that there is an optimal range of $\alpha _{T/4,{tr}}$
for all wake regimes at
$\alpha _{T/4,{tr}}$
for all wake regimes at $0.32\lt \alpha _{T/4,{tr}}\lt 0.41$
, indicating that the effective angle of attack remains useful to parametrise the performance of multiple foils within an array. Secondly, the difference in trailing-foil performance between the shear-layer and LEV regimes can be described primarily by the wake deficit, indicated by the collapse of their performance into a single curve for each
$0.32\lt \alpha _{T/4,{tr}}\lt 0.41$
, indicating that the effective angle of attack remains useful to parametrise the performance of multiple foils within an array. Secondly, the difference in trailing-foil performance between the shear-layer and LEV regimes can be described primarily by the wake deficit, indicated by the collapse of their performance into a single curve for each $\theta _{0,{\textit{tr}}}$
. Finally, while the trailing foil’s performance within the LEV + TEV regime with an optimal
$\theta _{0,{\textit{tr}}}$
. Finally, while the trailing foil’s performance within the LEV + TEV regime with an optimal $\varPhi$
and the highest
$\varPhi$
and the highest $\theta _{0,{\textit{tr}}}$
tested (
$\theta _{0,{\textit{tr}}}$
tested ( $75^{\circ}$
) aligns with that of the shear-layer and LEV regimes, for the other two
$75^{\circ}$
) aligns with that of the shear-layer and LEV regimes, for the other two $\theta _{0,{\textit{tr}}}$
tested (
$\theta _{0,{\textit{tr}}}$
tested ( $65^{\circ}$
and
$65^{\circ}$
and $70^{\circ}$
) it deviates significantly. This is further evidence that the trailing foil’s performance within the LEV + TEV regime is complicated by the increased unsteadiness in this regime.
$70^{\circ}$
) it deviates significantly. This is further evidence that the trailing foil’s performance within the LEV + TEV regime is complicated by the increased unsteadiness in this regime.
3.4. Optimal system performance
It is interesting to recognise from all of these results (figures 6–8) that the maximum system power extracted is obtained from the LEV wake regime ( $\alpha _{T/4,{le}} \sim 0.35$
). In this case, even though the leading foil is not operating at its maximum capacity, the wake has more energy available for the trailing foil to capture and the system performance is maximised. Furthermore, the global optimum across all parameter combinations tested corresponds to the LEV regime with both foils operating with
$\alpha _{T/4,{le}} \sim 0.35$
). In this case, even though the leading foil is not operating at its maximum capacity, the wake has more energy available for the trailing foil to capture and the system performance is maximised. Furthermore, the global optimum across all parameter combinations tested corresponds to the LEV regime with both foils operating with $f^*=0.11$
. Figure 3 shows that a single foil’s maximum energy-harvesting efficiency can be achieved at
$f^*=0.11$
. Figure 3 shows that a single foil’s maximum energy-harvesting efficiency can be achieved at $f^*\gt 0.11$
when operating within the LEV + TEV regime. In the tandem array, when the leading foil operates in the LEV regime, the
$f^*\gt 0.11$
when operating within the LEV + TEV regime. In the tandem array, when the leading foil operates in the LEV regime, the $\alpha _{T/4,{le}}$
value for the
$\alpha _{T/4,{le}}$
value for the $f^*=0.11$
cases is slightly higher than for the
$f^*=0.11$
cases is slightly higher than for the $f^*=0.12$
cases (
$f^*=0.12$
cases ( $0.35$
versus
$0.35$
versus $0.33$
rad, respectively), which accounts for the increase in performance of the leading foil. Recall the performance bifurcation identified by Ribeiro & Franck (Reference Ribeiro and Franck2023) for higher
$0.33$
rad, respectively), which accounts for the increase in performance of the leading foil. Recall the performance bifurcation identified by Ribeiro & Franck (Reference Ribeiro and Franck2023) for higher $\alpha _{T/4}$
values, and that the lower branch in this bifurcation corresponds to
$\alpha _{T/4}$
values, and that the lower branch in this bifurcation corresponds to $f^*\sim 0.11$
. Cases with
$f^*\sim 0.11$
. Cases with $f^*=0.11$
place the leading foil in that lower-performance branch when operating in the LEV + TEV regime, explaining the notable drop in its performance with respect to cases with
$f^*=0.11$
place the leading foil in that lower-performance branch when operating in the LEV + TEV regime, explaining the notable drop in its performance with respect to cases with $f^*=0.12$
. Ultimately this results in significantly worse system performance within the LEV + TEV regime for the
$f^*=0.12$
. Ultimately this results in significantly worse system performance within the LEV + TEV regime for the $f^*=0.11$
cases.
$f^*=0.11$
cases.
3.5. Constructive and destructive vortex–foil interactions
The system power performance results do not directly explain why some wake–foil interactions enhance trailing-foil performance, while other kinematic choices degrade the trailing-foil performance. Ashraf et al. (Reference Ashraf, Young, Lai and Platzer2011), Kinsey & Dumas (Reference Kinsey and Dumas2012), Xu et al. (Reference Xu, Sun and Tan2016) and Karakas & Fenercioglu (Reference Karakas and Fenercioglu2017) identified some types of interactions that led to better or worse trailing-foil performance. However, in their tests both foils in the array shared the same heaving amplitude. In the present study, due to the large differences in heave amplitude between the leading and trailing foils, the wake phase parameter by itself does not make it immediately apparent what types of wake–foil interactions lead to high- and low-performance cases.
Detailed analysis of the four cases highlighted in figure 9(a) illustrates how certain kinematics, specifically $\psi _{1-2}$
and
$\psi _{1-2}$
and $h_{0,{\textit{tr}}}$
, lead to improvements in performance. We consider constructive interactions between the wake and the trailing foil as those that lead to improved trailing-foil performance (two up-facing triangle markers), while destructive interactions (two down-facing triangle markers) are those resulting in decreased performance. These cases are evaluated within the LEV + TEV regime so that wake–foil interactions are amplified due to the stronger vortices in the wake when compared with the lower
$h_{0,{\textit{tr}}}$
, lead to improvements in performance. We consider constructive interactions between the wake and the trailing foil as those that lead to improved trailing-foil performance (two up-facing triangle markers), while destructive interactions (two down-facing triangle markers) are those resulting in decreased performance. These cases are evaluated within the LEV + TEV regime so that wake–foil interactions are amplified due to the stronger vortices in the wake when compared with the lower $\alpha _{T/4,{le}}$
regimes. Furthermore, this analysis is done at the shortest separation tested (
$\alpha _{T/4,{le}}$
regimes. Furthermore, this analysis is done at the shortest separation tested ( $S_x=4c$
) since it is assumed that wake vortices are stronger than when they are further downstream.
$S_x=4c$
) since it is assumed that wake vortices are stronger than when they are further downstream.
Two pairs of constructive and destructive interactions are compared in figures 10 and 11. Each figure shows snapshots from the PIV-measured flow field taken at four instances in time (A–D) during half of the trailing foil’s oscillation cycle. In both figures, the colour shading represents the local dynamic pressure normalised by the free-stream dynamic pressure, $q^*$
:
$q^*$
:
 \begin{equation} q^*=(|\mathbf{u}|/U_\infty )^2, \end{equation}
where $|\mathbf{u}|$
is the instantaneous velocity field magnitude at each snapshot. Note that variations in
$|\mathbf{u}|$
is the instantaneous velocity field magnitude at each snapshot. Note that variations in $q^*$
are primarily due to the vortex-induced velocity. This metric allows us to determine when the trailing foil operates in more or less energetic regions of the wake, which we can relate to increases or decreases in the foil’s energy-harvesting performance. Instantaneous streamlines are shown to provide a sense of the direction of the flow. Thick black contour lines represent isolines of
$q^*$
are primarily due to the vortex-induced velocity. This metric allows us to determine when the trailing foil operates in more or less energetic regions of the wake, which we can relate to increases or decreases in the foil’s energy-harvesting performance. Instantaneous streamlines are shown to provide a sense of the direction of the flow. Thick black contour lines represent isolines of $Q$
(3.1), non-dimensionalised appropriately:
$Q$
(3.1), non-dimensionalised appropriately: $Q(c/U_\infty )^2=1.5$
(note that
$Q(c/U_\infty )^2=1.5$
(note that $q^*$
and
$q^*$
and $Q$
represent different quantities). These contour lines visualise the location of strong vortices in the wake. Below the
$Q$
represent different quantities). These contour lines visualise the location of strong vortices in the wake. Below the $q^*$
fields, the corresponding instantaneous effective angle of attack
$q^*$
fields, the corresponding instantaneous effective angle of attack $\alpha _{\textit{eff}}$
, lift coefficient
$\alpha _{\textit{eff}}$
, lift coefficient $C_L$
, moment coefficient
$C_L$
, moment coefficient $C_M$
and power coefficient
$C_M$
and power coefficient $C_P$
curves of the trailing foil are shown for both the constructive (blue line) and destructive (purple line) cases.
$C_P$
curves of the trailing foil are shown for both the constructive (blue line) and destructive (purple line) cases.
Snapshots of dynamic pressure $q^*=(|\textbf {u}|/U_\infty )^2$
, with instantaneous streamlines of wake–foil interactions for
$q^*=(|\textbf {u}|/U_\infty )^2$
, with instantaneous streamlines of wake–foil interactions for $S_x=4c$
,
$S_x=4c$
, $\alpha _{T/4,{le}}=0.68$
,
$\alpha _{T/4,{le}}=0.68$
, $\theta _{0,{\textit{tr}}}=75^{\circ}$
and
$\theta _{0,{\textit{tr}}}=75^{\circ}$
and $h_{0,{\textit{tr}}}=0.8c$
. Isolines of
$h_{0,{\textit{tr}}}=0.8c$
. Isolines of $Q(c/U_\infty )^2=1.5$
are shown to visualise primary vortices. Cases shown are for two values of inter-foil phase: (a)
$Q(c/U_\infty )^2=1.5$
are shown to visualise primary vortices. Cases shown are for two values of inter-foil phase: (a) $\psi _{1-2}=51^{\circ}$
for the constructive case and (b)
$\psi _{1-2}=51^{\circ}$
for the constructive case and (b) $\psi _{1-2}=180^{\circ}$
for the destructive case. Also shown are non-dimensional (c) lift, (d) torque, (e) effective angle of attack and (f) power over half of an oscillation cycle. Also shown in (f) are the power contributions from lift and torque.
$\psi _{1-2}=180^{\circ}$
for the destructive case. Also shown are non-dimensional (c) lift, (d) torque, (e) effective angle of attack and (f) power over half of an oscillation cycle. Also shown in (f) are the power contributions from lift and torque.
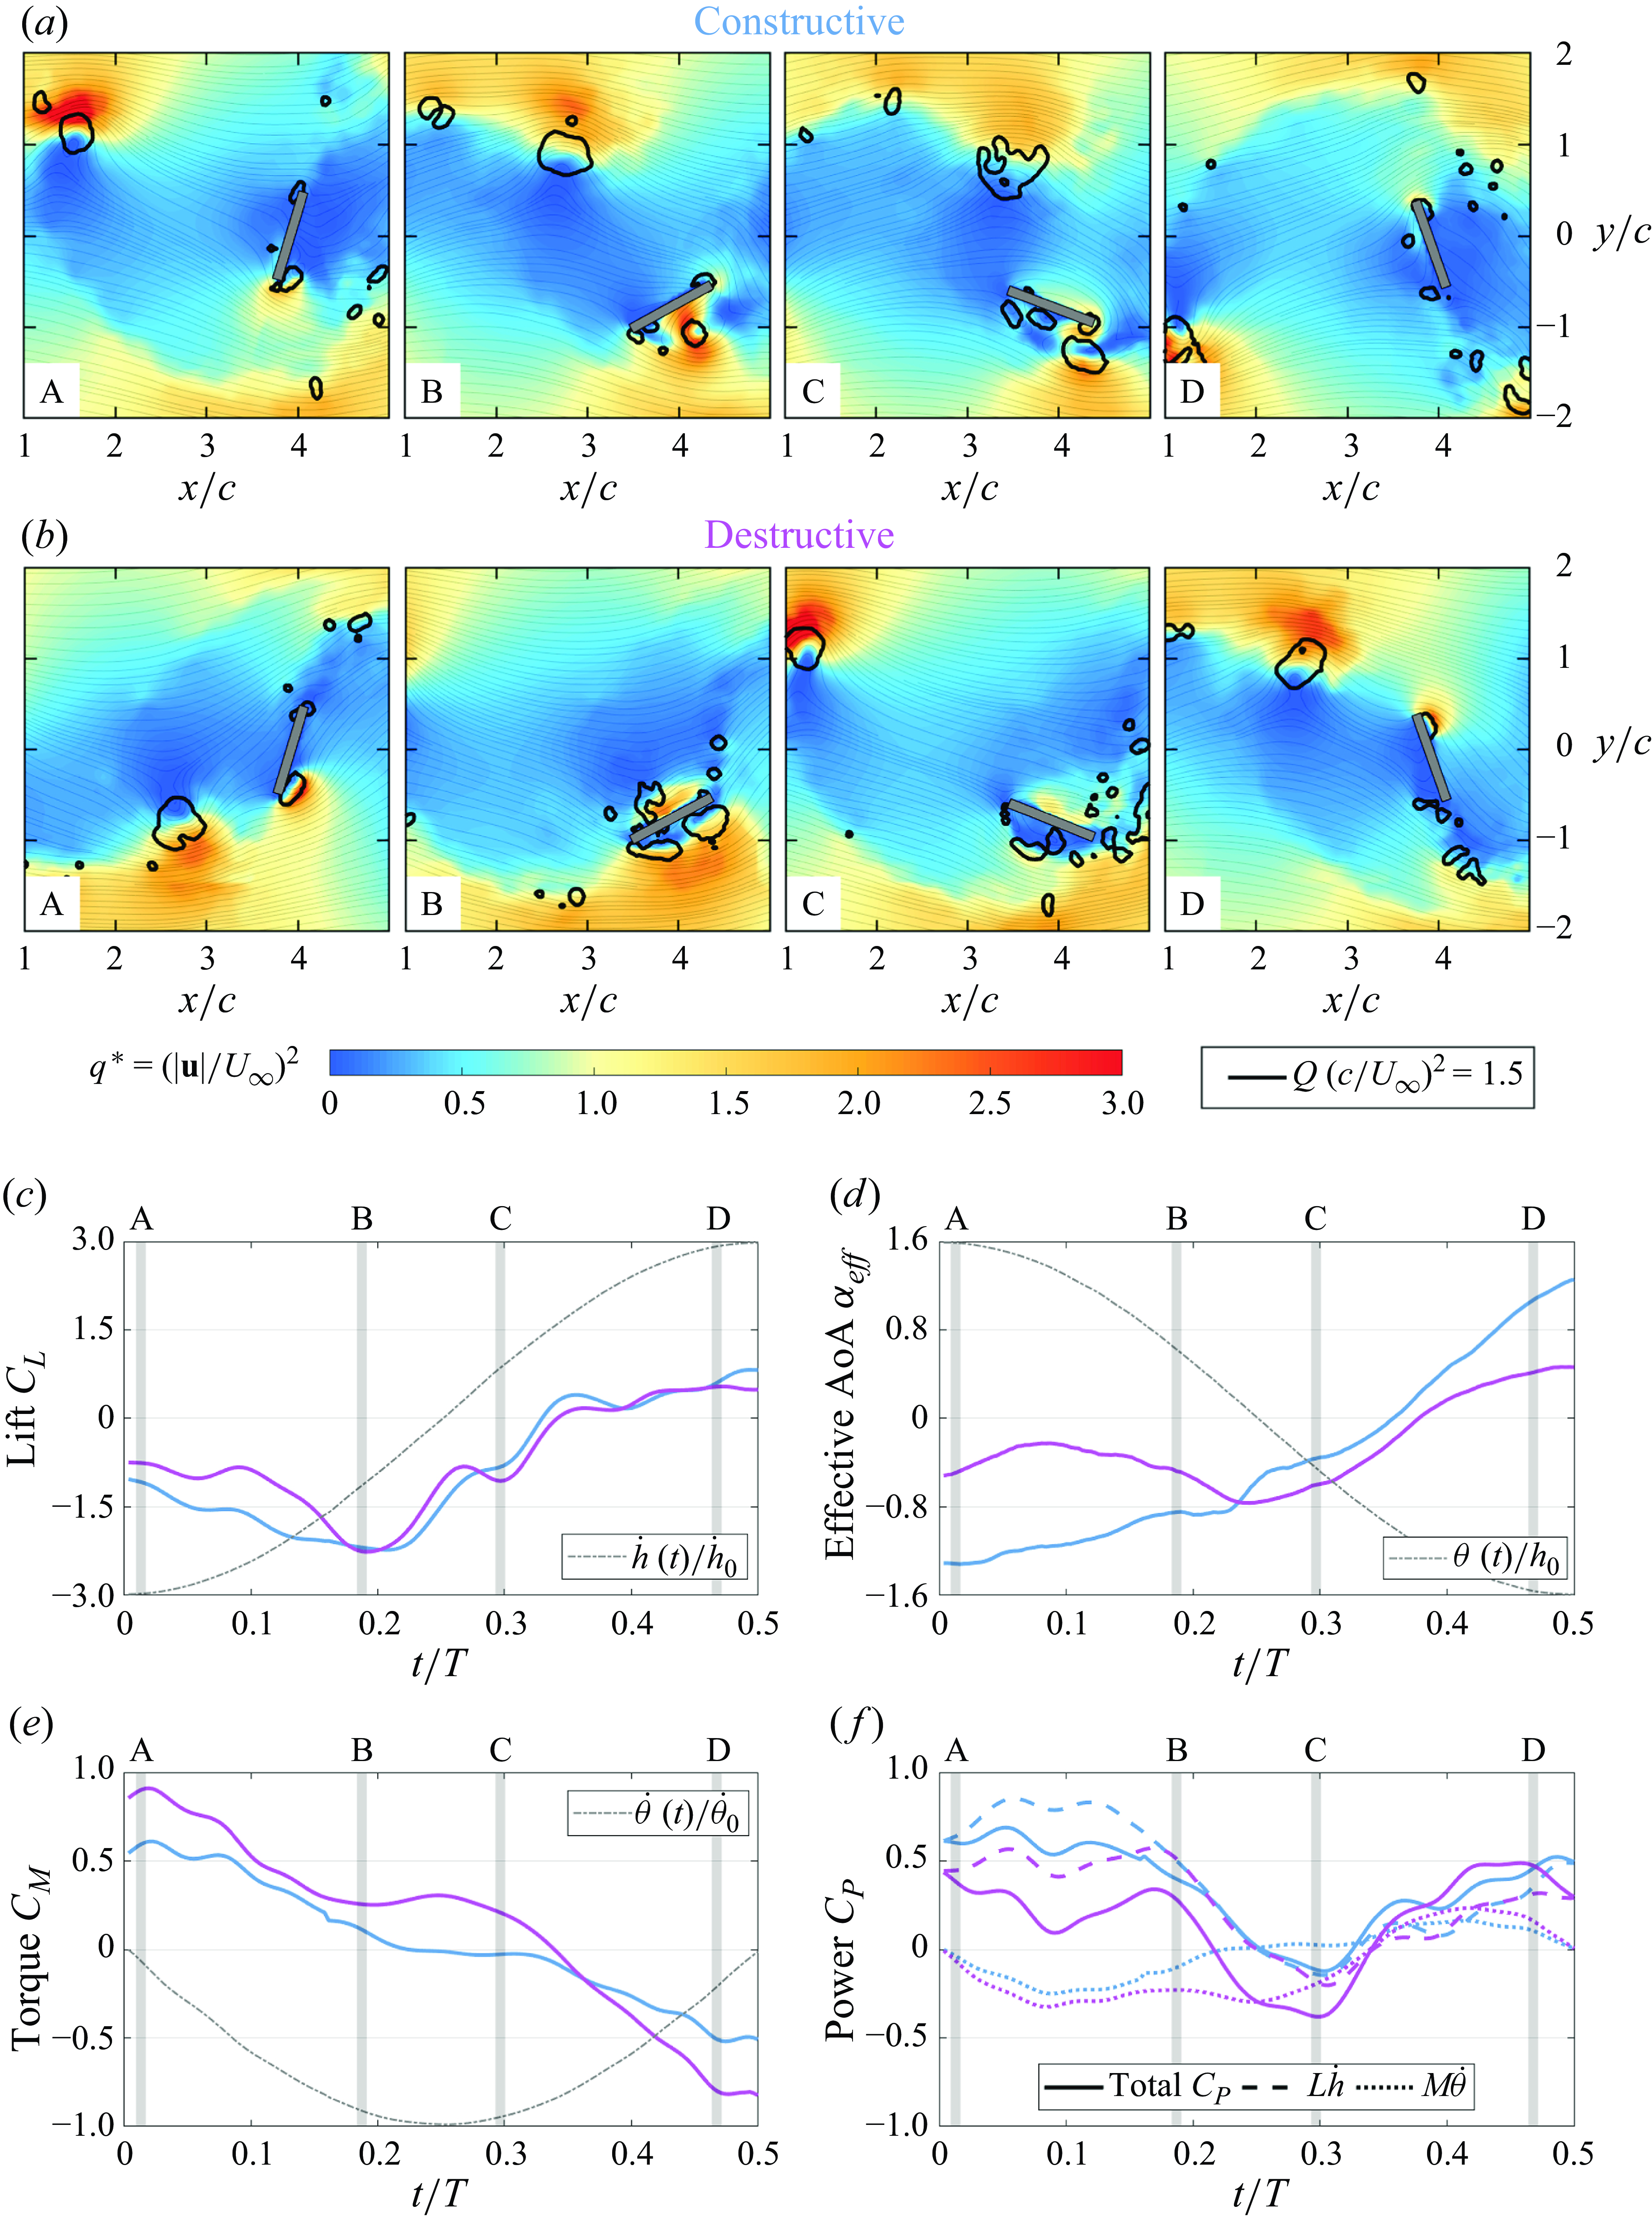
The maximum and minimum $C_{P,{tr}}$
cases at
$C_{P,{tr}}$
cases at $h_{0,{\textit{tr}}}=0.8c$
are presented as constructive and destructive interactions in figures 10(a) and 10(b), respectively. In this configuration, both foils are exposed to the same flow window. The trailing foil operates only within the pure wake deficit region, which can be observed from the snapshots presented in figure 10(a,b), showing the foil positioned within the blue-shaded region in all snapshots. In the constructive case, shown in figure 10(a), the trailing foil extracts an average power of
$h_{0,{\textit{tr}}}=0.8c$
are presented as constructive and destructive interactions in figures 10(a) and 10(b), respectively. In this configuration, both foils are exposed to the same flow window. The trailing foil operates only within the pure wake deficit region, which can be observed from the snapshots presented in figure 10(a,b), showing the foil positioned within the blue-shaded region in all snapshots. In the constructive case, shown in figure 10(a), the trailing foil extracts an average power of $\overline {C_{P,{tr}}}=0.299$
per cycle (blue
$\overline {C_{P,{tr}}}=0.299$
per cycle (blue $\bigtriangleup$
marker in figure 9
a), while the destructive case in figure 10(b) results in
$\bigtriangleup$
marker in figure 9
a), while the destructive case in figure 10(b) results in $\overline {C_{P,{tr}}}=0.138$
(purple
$\overline {C_{P,{tr}}}=0.138$
(purple $\bigtriangledown$
marker in figure 9
a). These first two cases are of interest as they see the leading and trailing foils heaving with the same amplitude, and their wake phase,
$\bigtriangledown$
marker in figure 9
a). These first two cases are of interest as they see the leading and trailing foils heaving with the same amplitude, and their wake phase, $\varPhi$
, is separated by
$\varPhi$
, is separated by $180^{\circ}$
(
$180^{\circ}$
( $-90^{\circ}$
for the constructive and
$-90^{\circ}$
for the constructive and $90^{\circ}$
for destructive; see figure 9
a). Here, the choice of
$90^{\circ}$
for destructive; see figure 9
a). Here, the choice of $\psi _{1-2}$
results in the trailing foil performing better due to its avoidance of wake vortices. This can be observed in the PIV snapshots in figure 10(a), whereby following the primary LEV in the wake (large circle on the top left in snapshot A), we observe how the trailing foil avoids it as it travels downstream throughout the subsequent snapshots. This is in contrast to the destructive case where, as observed in snapshots B and C in figure 10(b), the trailing foil collides head-on with the wake LEV. Due to the lack of strong vortex–foil interactions, the constructive case would be considered a weak interaction as described by Kinsey & Dumas (Reference Kinsey and Dumas2012) and Xu et al. (Reference Xu, Sun and Tan2016), while the direct collision with vortical structures in the destructive case makes it a strong wake interaction case.
$\psi _{1-2}$
results in the trailing foil performing better due to its avoidance of wake vortices. This can be observed in the PIV snapshots in figure 10(a), whereby following the primary LEV in the wake (large circle on the top left in snapshot A), we observe how the trailing foil avoids it as it travels downstream throughout the subsequent snapshots. This is in contrast to the destructive case where, as observed in snapshots B and C in figure 10(b), the trailing foil collides head-on with the wake LEV. Due to the lack of strong vortex–foil interactions, the constructive case would be considered a weak interaction as described by Kinsey & Dumas (Reference Kinsey and Dumas2012) and Xu et al. (Reference Xu, Sun and Tan2016), while the direct collision with vortical structures in the destructive case makes it a strong wake interaction case.
The difference in performance between these two cases is primarily due to the effective angle of attack that the trailing foil experiences during its oscillation (figure 10
d). There is a large difference in $\alpha _{\textit{eff}}$
during instances A and B. By looking at the flow direction faced by the trailing foil in these two snapshots, we observe that the destructive case (figure 10
b, A–B) sees the trailing foil’s
$\alpha _{\textit{eff}}$
during instances A and B. By looking at the flow direction faced by the trailing foil in these two snapshots, we observe that the destructive case (figure 10
b, A–B) sees the trailing foil’s $\alpha _{\textit{eff}}$
lowered because of the flow induced by the vortex shed from the leading foil (high
$\alpha _{\textit{eff}}$
lowered because of the flow induced by the vortex shed from the leading foil (high $Q$
contour). This behaviour was also observed by Kinsey & Dumas (Reference Kinsey and Dumas2012) in their ‘v4’ classification of wake–foil interactions. In contrast, snapshots A and B of the constructive case (figure 10
a) show that the foil experiences a sustained high
$Q$
contour). This behaviour was also observed by Kinsey & Dumas (Reference Kinsey and Dumas2012) in their ‘v4’ classification of wake–foil interactions. In contrast, snapshots A and B of the constructive case (figure 10
a) show that the foil experiences a sustained high $\alpha _{\textit{eff}}$
(figure 10
d, A–B). This results in higher lift (figure 10
c, A–B) at this initial part of the cycle. This difference in lift has a significant impact on performance due to the high heaving velocity of the foil at this time that, because of its alignment with
$\alpha _{\textit{eff}}$
(figure 10
d, A–B). This results in higher lift (figure 10
c, A–B) at this initial part of the cycle. This difference in lift has a significant impact on performance due to the high heaving velocity of the foil at this time that, because of its alignment with $C_L$
, yields a high contribution to the power extracted (figure 10
f, A–B).
$C_L$
, yields a high contribution to the power extracted (figure 10
f, A–B).
Turning attention to the stroke reversal (B–C in figure 10), in the constructive case, we observe minimal torque and power from the LEV as it moves over the foil towards the trailing edge (figure 10 a,e,f, B–C). In contrast, the destructive case sees the attached LEV partially suppressed due to its collision with the wake LEV (figure 10 b, B–C) which results in a positive torque (figure 10 e, B–C) and a negative contribution to power (figure 10 f, B–C). Over the entire cycle, most of the energy extraction (figure 10 f) comes from lift production – in agreement with Xu et al. (Reference Xu, Sun and Tan2016) and Kim et al. (Reference Kim, Strom, Mandre and Breuer2017) – while most of the energy loss is due to the pitching torque during the stroke reversal (snapshots B and C).
Leading up to snapshot D both cases have similar performances before repeating the same behaviour for the second half of the cycle.
3.6. Effects of increased trailing heave amplitude
The previous results, and all prior published results, have focused on tandem foils that share the same heave amplitude. However, figure 7 demonstrates that increasing the trailing heave amplitude leads to increased system performance. We can identify three reasons for this benefit. Firstly, the higher values of $h_{tr}$
sample higher momentum fluid (figure 5
a). Secondly, larger heave amplitudes provide easier LEV avoidance, similar to that discussed in connection to figure 10. Lastly, the larger trailing heave amplitude does provide new mechanisms for constructive wake interactions. For example, figure 9(a) shows a dramatic increase in system performance for an enlarged trailing heave due to a small shift in the wake phase,
$h_{tr}$
sample higher momentum fluid (figure 5
a). Secondly, larger heave amplitudes provide easier LEV avoidance, similar to that discussed in connection to figure 10. Lastly, the larger trailing heave amplitude does provide new mechanisms for constructive wake interactions. For example, figure 9(a) shows a dramatic increase in system performance for an enlarged trailing heave due to a small shift in the wake phase, $\varPhi$
(cyan and pink triangles). These two cases are discussed in this section, and are illustrated in figure 11.
$\varPhi$
(cyan and pink triangles). These two cases are discussed in this section, and are illustrated in figure 11.
Snapshots of dynamic pressure $q^*=(|\textbf {u}|/U_\infty )^2$
, with instantaneous streamlines of wake–foil interactions for
$q^*=(|\textbf {u}|/U_\infty )^2$
, with instantaneous streamlines of wake–foil interactions for $S_x=4c$
,
$S_x=4c$
, $\alpha _{T/4,{le}}=0.68$
,
$\alpha _{T/4,{le}}=0.68$
, $\theta _{0,{\textit{tr}}}=75^{\circ}$
and
$\theta _{0,{\textit{tr}}}=75^{\circ}$
and $h_{0,{\textit{tr}}}=1.4c$
. Isolines of
$h_{0,{\textit{tr}}}=1.4c$
. Isolines of $Q(c/U_\infty )^2=1.5$
are shown to visualise primary vortices. Cases shown are for two values of inter-foil phase: (a)
$Q(c/U_\infty )^2=1.5$
are shown to visualise primary vortices. Cases shown are for two values of inter-foil phase: (a) $\psi _{1-2}=-110^{\circ}$
for the constructive case and (b)
$\psi _{1-2}=-110^{\circ}$
for the constructive case and (b) $\psi _{1-2}=180^{\circ}$
for the destructive case. Also shown are non-dimensional (c) lift, (d) torque, (e) effective angle of attack and (f) power over half of an oscillation cycle. Also shown in (f) are the power contributions from lift and torque.
$\psi _{1-2}=180^{\circ}$
for the destructive case. Also shown are non-dimensional (c) lift, (d) torque, (e) effective angle of attack and (f) power over half of an oscillation cycle. Also shown in (f) are the power contributions from lift and torque.

In both the constructive and destructive cases (figure11 a,b), the trailing foil can reach the outer extent of the instantaneous wake region and take advantage of the accelerated velocity. Note that both cases display direct collisions with wake vortices. By looking closely at the position of the vortex relative to the trailing foil we can observe that both cases initially see reduced dynamic pressure near the foil due to the wake vortex (figure 11 a,b, A–B), evident in the lower-magnitude region near the trailing foil’s leading edge. However, further in the cycle the constructive case demonstrates a significant increase in dynamic pressure as the trailing foil collides with the vortex, evident by observing the region near the upper surface of the foil at the leading edge (figure 11 a, C). This is in contrast with the destructive case that, due to this vortex encounter happening at an earlier time in the cycle, displays decreased dynamic pressure at the same instant (figure 11 b, C).
It is also clear that the two cases have approximately equal performance at the points in the cycle with high heave velocity, $\dot {h}$
(figure 11, A,D). This is likely due to flow being dominated by the attached LEV during this phase of the cycle. The differences occur during the stroke reversal part of the oscillation (snapshots B–C). In snapshot B of the constructive case (figure 11
a), as the foil reaches its maximum heave amplitude, it begins to shed its attached LEV and loses its lift,
$\dot {h}$
(figure 11, A,D). This is likely due to flow being dominated by the attached LEV during this phase of the cycle. The differences occur during the stroke reversal part of the oscillation (snapshots B–C). In snapshot B of the constructive case (figure 11
a), as the foil reaches its maximum heave amplitude, it begins to shed its attached LEV and loses its lift, $C_L$
(figure 11
c, B). After this shedding occurs, the foil collides with the primary LEV in the wake (snapshot C) and gains
$C_L$
(figure 11
c, B). After this shedding occurs, the foil collides with the primary LEV in the wake (snapshot C) and gains $C_L$
in alignment with its heaving direction, generating positive power,
$C_L$
in alignment with its heaving direction, generating positive power, $C_P$
(figure 11
c,f, C). During the same part of the cycle, the destructive case sees the trailing foil go around the primary wake LEV and seemingly delay the shedding of its own attached LEV (figure 11
b, B). Crucially, snapshot C in figure 11(b) shows that the foil develops a second LEV, absent in the constructive case (although it can also be seen in the earlier configurations discussed in figure 10
a,b). The effect of this secondary LEV is reflected in the lift (figure 11
c, C), which becomes more negative, and can be correlated to the increase of dynamic pressure near the trailing foil’s leading edge. This increase in
$C_P$
(figure 11
c,f, C). During the same part of the cycle, the destructive case sees the trailing foil go around the primary wake LEV and seemingly delay the shedding of its own attached LEV (figure 11
b, B). Crucially, snapshot C in figure 11(b) shows that the foil develops a second LEV, absent in the constructive case (although it can also be seen in the earlier configurations discussed in figure 10
a,b). The effect of this secondary LEV is reflected in the lift (figure 11
c, C), which becomes more negative, and can be correlated to the increase of dynamic pressure near the trailing foil’s leading edge. This increase in $C_L$
results in negative
$C_L$
results in negative $C_P$
being generated because the foil is heaving in the opposite direction at this time (figure 11
f, C).
$C_P$
being generated because the foil is heaving in the opposite direction at this time (figure 11
f, C).
The $C_M$
performance is also affected by the presence or absence of the secondary LEV. Figure 11(e) shows how, while the destructive case experiences positive
$C_M$
performance is also affected by the presence or absence of the secondary LEV. Figure 11(e) shows how, while the destructive case experiences positive $C_M$
during the stroke reversal (snapshots B and C), the constructive case
$C_M$
during the stroke reversal (snapshots B and C), the constructive case $C_M$
becomes slightly negative. The effect is amplified by the high angular velocity at this time.
$C_M$
becomes slightly negative. The effect is amplified by the high angular velocity at this time.
The result of the small difference in inter-foil phase $\psi _{1-2}$
(and consequently wake phase
$\psi _{1-2}$
(and consequently wake phase $\varPhi$
) is that in the constructive case the foil experiences positive power throughout the cycle. Although this shows how the trailing foil can benefit greatly from vortex–foil interactions, the slight difference in
$\varPhi$
) is that in the constructive case the foil experiences positive power throughout the cycle. Although this shows how the trailing foil can benefit greatly from vortex–foil interactions, the slight difference in $\psi _{1-2}$
between the constructive and destructive cases demonstrates how the trailing foil’s performance is highly sensitive to small changes in kinematics when pursuing strong vortex–foil interactions. This echoes the result from Ma et al. (Reference Ma, Wang, Xie, Han, Sun and Zhang2019) who, in their semi-passive tandem foil system, noted that although favourable wake–foil interactions can yield significantly improved performance, it is more desirable to avoid negative wake–foil interactions than to pursue favourable ones.
$\psi _{1-2}$
between the constructive and destructive cases demonstrates how the trailing foil’s performance is highly sensitive to small changes in kinematics when pursuing strong vortex–foil interactions. This echoes the result from Ma et al. (Reference Ma, Wang, Xie, Han, Sun and Zhang2019) who, in their semi-passive tandem foil system, noted that although favourable wake–foil interactions can yield significantly improved performance, it is more desirable to avoid negative wake–foil interactions than to pursue favourable ones.
These cases exhibit complex vortex dynamics, such as vortex annihilation and enhancement, impacting foil performance. For instance, in the constructive case, the trailing foil’s secondary LEV is suppressed by its interaction with the wake LEV. As discussed earlier (figures 10
a,b and 11
b), a secondary LEV forms on the trailing foil during the stroke reversal. In the constructive case, the collision with the primary wake LEV causes the flow to reorient around the trailing foil’s leading edge, keeping the flow attached to its lower side (supported by a positive $\alpha _{\textit{eff}}$
value at instance C in figure 11
d). This also explains the formation of the small LEV on the foil’s upper side at this time. In the destructive case, the wake–LEV collision likely enhances the secondary LEV. However, due to the messiness of the wake resulting from these collisions it is not clear what occurs during this interaction, or if there is an additional collision of the trailing foil with the secondary wake LEV (present in figure 11
a but not in figure 11
b during snapshots C and D). Additionally, vortex dynamics affecting torque performance (figure 11
e) is not as obvious. A detailed analysis separating vortex-induced forces from other flow contributions would provide more insight. Previous studies focused primarily on vortex dynamics (Menon & Mittal Reference Menon and Mittal2021; Gao et al. Reference Gao, Cantwell, Son and Sherwin2023; Zhu et al. Reference Zhu, Lee, Kumar, Menon, Mittal and Breuer2023) utilised the force and moment partitioning method (Quartapelle & Napolitano Reference Quartapelle and Napolitano1983) to analyse vortex-induced forces on aerofoils. While this analysis could provide valuable insight into the vortex–foil interactions presented in this work, this is outside the scope of this study and warrants future exploration.
$\alpha _{\textit{eff}}$
value at instance C in figure 11
d). This also explains the formation of the small LEV on the foil’s upper side at this time. In the destructive case, the wake–LEV collision likely enhances the secondary LEV. However, due to the messiness of the wake resulting from these collisions it is not clear what occurs during this interaction, or if there is an additional collision of the trailing foil with the secondary wake LEV (present in figure 11
a but not in figure 11
b during snapshots C and D). Additionally, vortex dynamics affecting torque performance (figure 11
e) is not as obvious. A detailed analysis separating vortex-induced forces from other flow contributions would provide more insight. Previous studies focused primarily on vortex dynamics (Menon & Mittal Reference Menon and Mittal2021; Gao et al. Reference Gao, Cantwell, Son and Sherwin2023; Zhu et al. Reference Zhu, Lee, Kumar, Menon, Mittal and Breuer2023) utilised the force and moment partitioning method (Quartapelle & Napolitano Reference Quartapelle and Napolitano1983) to analyse vortex-induced forces on aerofoils. While this analysis could provide valuable insight into the vortex–foil interactions presented in this work, this is outside the scope of this study and warrants future exploration.
These results also offer insight into different array configurations. While tandem foil configurations can improve performance in an optimal setting, downstream foils are always affected by the decrease in flow momentum due to the leading foil. Several studies (Nishino & Willden Reference Nishino and Willden2012; Draper & Nishino Reference Draper and Nishino2014; Gebreslassie, Tabor & Belmont Reference Gebreslassie, Tabor and Belmont2015; Nuernberg & Tao Reference Nuernberg and Tao2018; Chen, Lin & Liang Reference Chen, Lin and Liang2023) have investigated alternative array configurations like tidal fences and staggered arrays. Based on linear actuator disk theory, Draper & Nishino (Reference Draper and Nishino2014) studied the performances of staggered and centred (tandem) configurations, and showed that in a staggered array downstream turbines take advantage of the accelerated bypass flow from the leading turbine’s wake (recall from figure 5) to increase their power output. Draper & Nishino (Reference Draper and Nishino2014) also found that performance in staggered arrays improves when the leading turbine operates with higher flow resistance due to this increased bypass flow available for downstream turbines. This can be applied to oscillating foils in a mean sense, where a trailing foil positioned off-centre could use the accelerated flow during its up- and downstrokes to reach higher peak power. However, it is unclear what the performance losses would look like during the stroke reversal due to these mechanisms, as it is the part in the cycle where the most power is lost. A staggered configuration could also lead to higher power variability within the cycle and more complex vortex–foil interactions. Wake topology becomes critical in multi-turbine configurations, especially with close spacings as those explored in this study. While symmetric shedding patterns occur behind the leading foil, downstream turbine interference creates more complex wake patterns like those observed in studies on oscillating foils within propulsive regimes (Verma & Hemmati Reference Verma and Hemmati2021; Wei et al. Reference Wei, Hu, Li and Shi2023). Therefore, if vortex–foil interactions can be minimised (as in the constructive case of figure 10
a), a staggered array could allow the leading foil to operate in a higher $\alpha _{T/4}$
regime to improve its performance and increase the bypass flow’s magnitude, which can be harnessed by downstream foils.
$\alpha _{T/4}$
regime to improve its performance and increase the bypass flow’s magnitude, which can be harnessed by downstream foils.
4. Conclusions
The optimal kinematics and the role of wake–foil interactions in a tandem hydrofoil array’s performance for energy harvesting were studied experimentally. Distinct from previous such studies, we have chosen three operating regimes for the leading foil – the shear-layer, LEV and LEV + TEV regimes. For each of these regimes, we allow the trailing foil to have different kinematics (heave, pitch and phase) from the leading foil. Special attention was paid to the effect that the wake structure prescribed by the leading foil has on the trailing foil. The role of the wake vortices produced by the leading foil in the trailing-foil performance was also analysed in detail.
The strongest effects from wake–foil interactions were observed in the LEV + TEV regime due to the primary vortices being stronger than the main LEV in the intermediate $\alpha _{T/4}$
regime. Modifying the kinematics of the trailing foil, notably increasing the heaving amplitude, led to constructive wake–foil interactions previously not observed in the literature. In this regime, the performance of the trailing foil is highly sensitive to the phase,
$\alpha _{T/4}$
regime. Modifying the kinematics of the trailing foil, notably increasing the heaving amplitude, led to constructive wake–foil interactions previously not observed in the literature. In this regime, the performance of the trailing foil is highly sensitive to the phase, $\psi _{\mathrm{1-2}}$
, between the leading and trailing foils, and we find that dramatically improved or reduced performance can result due to constructive or destructive wake vortex–foil interactions.
$\psi _{\mathrm{1-2}}$
, between the leading and trailing foils, and we find that dramatically improved or reduced performance can result due to constructive or destructive wake vortex–foil interactions.
The highest system performance observed in the parameter space explored was when the leading foil operated within the LEV regime, different from the single-foil optimum, which is in the LEV + TEV regime. In the LEV regime, the trailing foil does not see its performance affected as dramatically by wake–foil interactions, and the wake deficit encountered is not as strong as in the LEV + TEV regime. This results in the interesting conclusion that for the tandem array to perform optimally, neither foil should operate at its single-foil optimal kinematics. It was also found that although the primary vortices in the LEV and LEV + TEV regimes initially follow different paths after being shed by the leading foil, their trajectories converge as they travel downstream. This results in the primary vortex approaching the trailing foil with the same $y$
location across wake regimes. As observed by previous literature the inter-foil phase directly affects the timing of wake–foil interactions, but we additionally find that the heaving amplitude of the trailing foil has a significant impact on the type of interactions that occurred, and consequently the harvesting performance.
$y$
location across wake regimes. As observed by previous literature the inter-foil phase directly affects the timing of wake–foil interactions, but we additionally find that the heaving amplitude of the trailing foil has a significant impact on the type of interactions that occurred, and consequently the harvesting performance.
As has been previously noted, and is studied in some detail here, when the leading and trailing heave amplitudes are matched, constructive interactions are observed for cases that avoid wake structures, while destructive interactions occur when the trailing foil collides with the leading-foil LEV. However, a second kind of constructive interaction is also identified when the trailing foil has heave amplitude larger than that of the leading foil. In this case, the LEV does interact with the trailing foil, but acts to enhance its energy extraction.
This study provides experimental results that support the available literature on OFTs, and expands it by evaluating the performance of a tandem array where both foils have very different kinematics. By highlighting configurations that lead to dramatic performance improvements through wake–foil interactions, these findings illustrate the complex flow features found in interactions that lead to improved energy-harvesting performance. Models that predict array performance, such as that proposed by Ribeiro & Franck (Reference Ribeiro and Franck2024), can be enhanced through these findings, especially within the highly unsteady wake regimes highlighted in this study. These results also reinforce the appeal of oscillating flow turbines. While the power coefficient of the individual turbines is lower than, for example, a single horizontal axes turbine, due to the ability to locate tandem turbines in close proximity, the system power density is far higher than that of a conventional turbine array. This operational advantage, combined with other features of OFTs, such as their insensitivity to specific blade design (Kim et al. Reference Kim, Strom, Mandre and Breuer2017), may lead to greater adoption in renewable energy-harvesting applications.
Acknowledgements
The authors are most grateful to J. Franck and B. Ribeiro for many fruitful discussions.
Funding
This work was supported by the National Science Foundation, Grant 1921359 and AFOSR Grant FA9550-23-1-0478. Y.Z. was supported by AFOSR Grant FA9550-21-1-0462.
Declaration of interests
The authors report no conflict of interest.


 Open access