

Introduction
Glacier response to climate change is important for evaluating the effects on other environment components such as sea-level change. Meier (1994) showed that the contribution from the melting of small glaciers (mainly valley glaciers) produces a significant effect on global sea level. Moreover, such changes occur over shorter time periods than the resulting output from ice sheets, since the response time of small glaciers is shorter than that of ice caps and ice sheets. However, to accurately assess the effects of climate change on glaciers, several processes must be assembled to form a functioning model. Firstly, a coupling between climate and glacier mass balance must be accomplished. Secondly, the coupling between mass balance and glacier geometry must be described. Thirdly, the change in glacier geometry must be translated into the sea-level change.
The first point was attempted by feeding the output of a global circulation model (GCM) experiment into a temperature-radiation-index melt model (Reference SchneebergerSchneeberger, 1998). This model was developed and tested for Storglaciären by Reference HockHock (1998,Reference Hock1999).
The second point is the core of this paper in which a three-dimensional time-evolving ice-flow model is presented. The model is validated by comparing computed and surveyed glacier geometries after the model was forced by the observed present mass balance.
The glacier model was developed by Reference AlbrechtAlbrecht (1999) and is based on Reference BlatterBlatter’s (1995) mechanical model. The innovations of this model compared to Blatter’s algorithm are a routine which allows for the computation of the evolution of the glacier geometry, and an improved numerical scheme to guarantee numerical stability Preliminary studies with Blatter’s algorithm (Reference Hubbard, Blatter, Nienow, Mair and HubbardHubbard and others, 1998) yielded promising results.
In order to validate the model, a well-studied glacier is required where testing of the model against measured quantities and experiments designed to constrain processes can be performed. Storglaciären was chosen because it has long and detailed historical records for a large number of variables including mass balance, surface evolution and surface velocity.
In this paper, the first results from the model are presented and compared with the measured surface evolution of Storglaciären between 1959 and 1990.
Storglaciären
Physical description
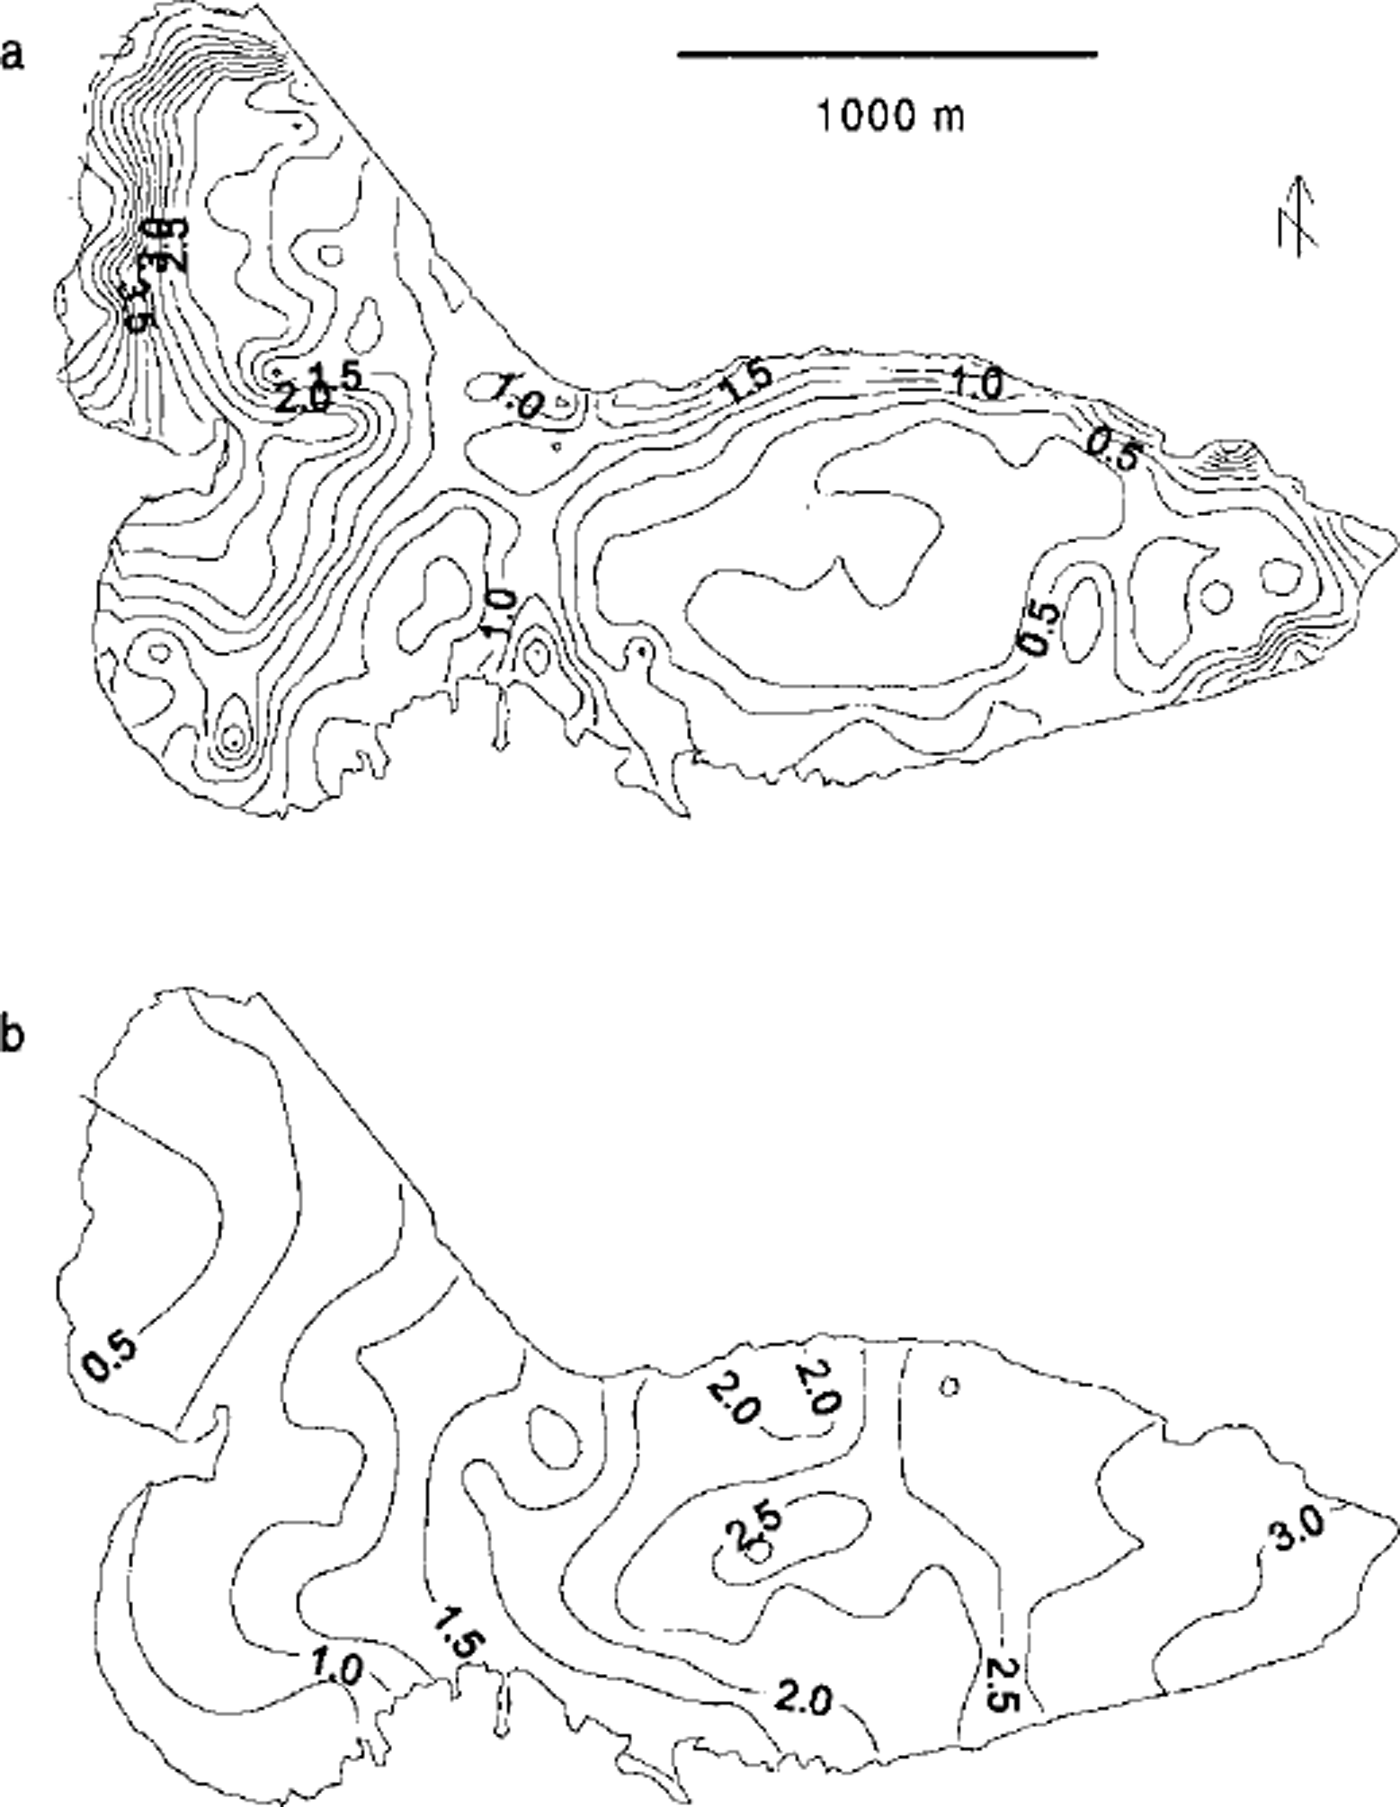
Storglaciären (67°55’N, 18°35’E) is a polythermal glacier in northern Sweden. Work on Storglaciären was undertaken in 1945 by Schytt, following the suggestion of Ahlmann (Reference SchyttSchytt, 1947, Reference Schytt1959; Reference AhlmannAhlmann, 1951). Since then, a wealth of data has been recorded on Storglaciären (see overviews provided in, e.g., Reference Holmlund, Karlen and GruddHolmlund and others, 1996; Reference JanssonJansson, 1996). Five topographic maps of the glacier surface have been produced, four of which are used in this study (Fig. la-d): 1959 (Reference HolmlundHolmlund, 1996), 1969 (Reference SchyttSchytt, 1973), 1980 (Reference HolmlundHolmlund, 1987) and 1990 (Reference HolmlundHolmlund, 1996). These maps were constructed from vertical aerial photographs. The map for the bed topography was produced by Reference Herzfeld, Eriksson and HolmlundHerzfeld and others (1993), based on geo-radar surveys and borehole drilling on the glacier (Fig. le).
Maps of surface topography of Storglaciären: (a) 1959 (Reference HolmlundHolmlund, 1996); (b) 1969 (Reference SchyttSchytt, 1973); ( c) 1980 (Reference HolmlundHolmlund, 1987); (d) 1990 (Reference HolmlundHolmlund, 1996); and (e) bedrock topography (Reference Herzfeld, Eriksson and HolmlundHerrjeld and others, 1993). Contour interval is 20 m

Mass-balance data and model input
Long-term mass-balance measurements have been carried out annually since the 1945/46 mass-balance year (e.g. Reference JanssonJansson, 1999) for winter and summer balances. The winter balance has been measured in a 100 m × 100 m square grid covering the entire glacier since 1966 Reference JanssonJansson, 1999). This square net-work captures the high variability in the accumulation pattern on Storglaciären (Fig. 2) which results from wind-driven erosion and deposition caused by small-scale variabilities in the ice-surface topography. Before 1966, the measurements were made with a set of profiles across the glacier. The density of measurements during this early period remained high, but it is likely that the early maps capture fewer details of the winter balance pattern.
Maps showing the complexity in distribution of (a) winter and (b) summer mass balance. Contour-line labels have been omitted for clarity. Contour interval is 0.25 m w.e.
The summer balance on Storglaciären is determined by traditional stake measurements. Approximately 40–50 stakes are used each year. These stakes are located in order to cover the glacier evenly. The network is modified from year to year depending on problems caused by field conditions such as the burial of stakes during winter. The summer mass balances from the stakes generate a distributed summer balance map. The lower sampling density of summer balance can be justified by the lower spatial variability of melt compared to snow accumulation (Fig. 2).
In this study, all surface topography maps, as well as the subglacial topography, have been digitized together with maps of both winter and summer balance for the period from the 1960/61 mass-balance year up to 1990/91. The maps were digitized and converted into 10 m × 10 m grids by using the kriging routines in the commercially available SURFERTM software package. In order to reproduce the original topographic and mass-balance maps it was necessary to find an optimal point spacing along lines. Through trial and error, it was found that 75 m along-line distance yielded, on average, the best results. A dense grid (10 m) was chosen such that a subset of the data grid could be used for different model grids.
The bed-topography map was combined with the surrounding topography to produce a drainage-basin topography (Fig. le). From a comparison of the surveyed ice thickness and the ice thickness determined from borehole drilling, an error of ± 5 m can be estimated (Reference Herzfeld, Eriksson and HolmlundHerzfeld and others, 1993). The drainage-basin map was converted to a grid similar to that used for the surface topography.
The mass-balance maps for individual years show strong high-frequency spatial variability as shown in Figure 2. Averaging the digitized and converted mass-balance maps over the 30 years significantly smooths the pattern (Fig. 3), which indicates that the spatial variations vary from year to year.
Averaged mass-balance maps of (a) annual, (b) summer and (c) winter mass balances for the period 1960–90.
Comparisons of the interpolated and the original, hand-drawn mass-balance maps reveal that the largest differences are 0.25–0.50 mw.e.. Reference JanssonJansson (1999) suggests errors in the measured mass balance of approximately 0.1 mw.e., which translates to an uncertainty in the volume of 0.3 × 10⁶ m3 for the entire glacier, or roughly 0.1 % of the glacier volume.
The Numerical Model
The model experiments were carried out using the glacier model of Reference AlbrechtAlbrecht (1999), which consists of two sections dealing with glacier mechanics and surface evolution.
In the mechanics part, discussed in detail by Reference BlatterBlatter (1995), velocity and stress fields are computed from the glacier geometry by solving the force balance:
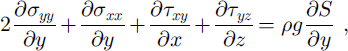
and using a stress-strain-rate relation of the form:
where D is the strain-rate tensor, ∑ is the deviatoric stress tensor and III its second invariant, ˚tr" denotes the mathematical operator trace, σti are the deviatoric normal stress components, τij are the shear-stress components, x, y and z are the Cartesian coordinates, p is density, g is gravity, A is the rate factor, t0 is proportional to the fluidity for vanishing effective stress and F is the creep response function.
The integration of the obtained set of ordinary differential equations starts with prescribed zero-sliding velocities and an initial guess of the shear traction at the glacier base. Using a Runge-Kutta scheme, the differential equations were integrated vertically. If the surface boundary condition (vanishing surface shear traction) is not met, the basal shear traction is corrected and the integration is repeated. In order to avoid numerical instabilities, an asymmetrical finite-difference scheme (Reference Colinge and BlatterColinge and Blatter, 1998) was used to determine horizontal derivatives instead of central differences, as used by Reference BlatterBlatter (1995).
In the present study both approximations, the first-order approximation taking account of longitudinal stress gradients, and the shallow-ice approximation (Reference HutterHutter, 1983) omitting these stress gradients, were applied for comparisons.
In the second section of the model, the evolution of the glacier surface is computed with respect to a given mass balance and the divergence of the velocity field by the following equation:
where S is surface elevation, t is time, mb is the local accumulation/ablation rate, H is ice thickness and
![]() and
and
![]() are the depth-averaged components of the horizontal velocity field. Time integration of this equation has been achieved by using an explicit numerical scheme (Reference AlbrechtAlbrecht, 1999).
are the depth-averaged components of the horizontal velocity field. Time integration of this equation has been achieved by using an explicit numerical scheme (Reference AlbrechtAlbrecht, 1999).
Model Experiments and Results
The following three experiments were carried out:
-
Experiment 1: The annual mass balance is prescribed as a function of elevation and time. The data utilized for this model run are the same as those used by Reference StroevenStroeven (1996) and are based on stake measurements for the period 1963–93. Since no mass-balance data were available for the period 1960–63, mass-balance maps were imposed on the model for these years.
-
Experiment 2: For each year, from winter 1960/61 to summer 1990, corresponding winter and summer mass-balance maps have been imposed on the glacier model at corresponding half-year time-steps.
-
Experiment 3: As for experiment 2, but with annual mean mass-balance maps input at half-year time-steps.
In all experiments, the volume change is expressed in mw.e. and the glacier is considered to consist entirely of ice. Although this is not the case in reality since a glacier consists partly of firn, pending results from work in progress on the firn of Storglaciären by T. Schneider (personal communication, 1999) show that granted an additional error in the calculation, this shortcoming can be accepted. The effect of these assumptions is to produce slightly different slopes. However, it must be remembered that the slope is the first derivative of elevation, which means that small corrections in elevation produce second-order changes in slope which may not significantly affect the calculation. The entire ice volume is considered temperate, so any potential effects of the relatively thin cold surface layer on Storglaciären are neglected.
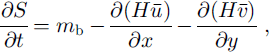
At this point, it is not feasible to formulate a prognostic sliding law which takes into account the variations of sliding in space and time, as well as all the related physical processes such as water drainage, water pressure and decoupling of the glacier base. Furthermore, comparison of measured (Reference Hooke, Calla, Holmlund, Nilsson and StroevenHooke and others, 1989) and modelled (Fig. 4) surface velocities shows a very good agreement in terms of velocity pattern and relative magnitude without sliding. Thus, sliding is not considered in the model runs.
Map view of the combined surface velocity field for two steady-state runs for the 1990 glacier topography. The picture is a composite of the two runs, each with 100 m grid resolution, but with grids shifted relative to each other by 50 m in both coordinate directions, to show the coherence between the runs.
All model experiments were carried out with a grid spacing of 150 m and were integrated in time from winter 1960/ 61 to summer 1990. Because no topographic map of 1960 was available, the model runs began with the unsmoothed 1959 map, and no spin-up procedure was applied. For summer 1990, integrations were stopped and model results were compared with the topographic map of 1990.
With a rate factor of 22.2 × 10⁻¹⁶ s–1 kPa–3––––––6 6 the best agreement was reached between simulated and observed glacier evolution and for computed and measured surface velocities. This value is close to that found by Reference Hubbard, Blatter, Nienow, Mair and HubbardHubbard and others (1998) for Haut Glacier d’Arolla, Switzerland (20.0 × 10⁻¹⁶s–1kPa–3 ), and also close to the value used by Reference GudmundssonGudmundsson (1999) for the computation of Unteraargletscher, Switzerland (23.7 × 10⁻¹⁶s–1KPa–3).
Figure 5 shows the measured ice thickness in 1990 (Fig. 5a) with 20 m contour intervals, together with the differences between the measured and computed ice thicknesses with 5 m contour intervals for experiments 1 (Fig. 5c) and 2 (Fig. 5b). Figure 5d shows the result for an additional experiment, in which winter and summer balances were imposed on a shallow-ice approximation model. Because the normal stress gradients do not occur in the effective stress of the shallow-ice approximation, the ice is harder. To obtain results comparable to the first-order approximation model, the rate factor was increased to 28.54 × 10⁻¹⁶s–1 kPa–3. The results of the third model experiment are not shown as they are almost identical to those of experiment 2. In the dark shaded regions, modelled ice thickness is 0–10 m lower than measured, while in the light shaded area, ice thickness is overestimated by the same magnitude.
Results from model experiments 1 and 2 (see text for details), (a) 1990 ice thickness from measured surface and bed topography, ( b) Difference between measured and modelled ice thickness for 1990 from model experiment 2 ( c) Same as ( b) using the elevation-dependent mass-balance input of experiment! (d) Same as for experiment 2 using a shallow-ice approximation model.

The model has produced results close to the observed surface shape of 1990, except for two gridpoints in the upper boundary area. The difference plots (Fig. 5b and c) show that the two types of input for experiments 1 and 2 generate similar results. It is evident that the weakness of the elevation-dependent mass-balance input in experiment 1 results in larger errors than in experiments 2 and 3, particularly in regions where the observed balance distribution shows large lateral variations (e.g. in the lower left area of the plots). In this region, the computed ice thickness is underestimated in all model experiments. This is because the mass-balance measurements were not recorded there every year, since this area is steep and the danger of avalanches exists. The mass-balance values in these areas are a result of interpolation and extrapolation. This area is on the west side of a ridge, which can cause locally increased accumulation due to the lee-effect snowdrift. This introduces some uncertainty in the accuracy of the calculated mass balance of the area. Such effects are more prominent in experiment 1, in which information on spatial distributions of the mass balance is entirely lost due to a simple elevation-dependent mass-balance input. Figure 5d reveals a significantly larger error in the central part of the glacier if the shallow-ice approximation is applied.
The measured difference in the surface elevation between 1990 and 1959 is shown in Figure 6a, and the computed one for experiment 2 in Figure 6b. In the past 30 years the glacier has lost mass in the lower regions, whereas the ice thickness has increased in the higher regions. The general pattern of the modelled changes in the ablation and accumulation zones is close to that of the observed changes, except for a narrow stripe in the central part of the glacier. In general, the modelled magnitude and spatial variability is somewhat larger than observed.
Difference of the glacier surface elevation between 1990 and 1959: (a) measured; ( b) computed from experiment 2.

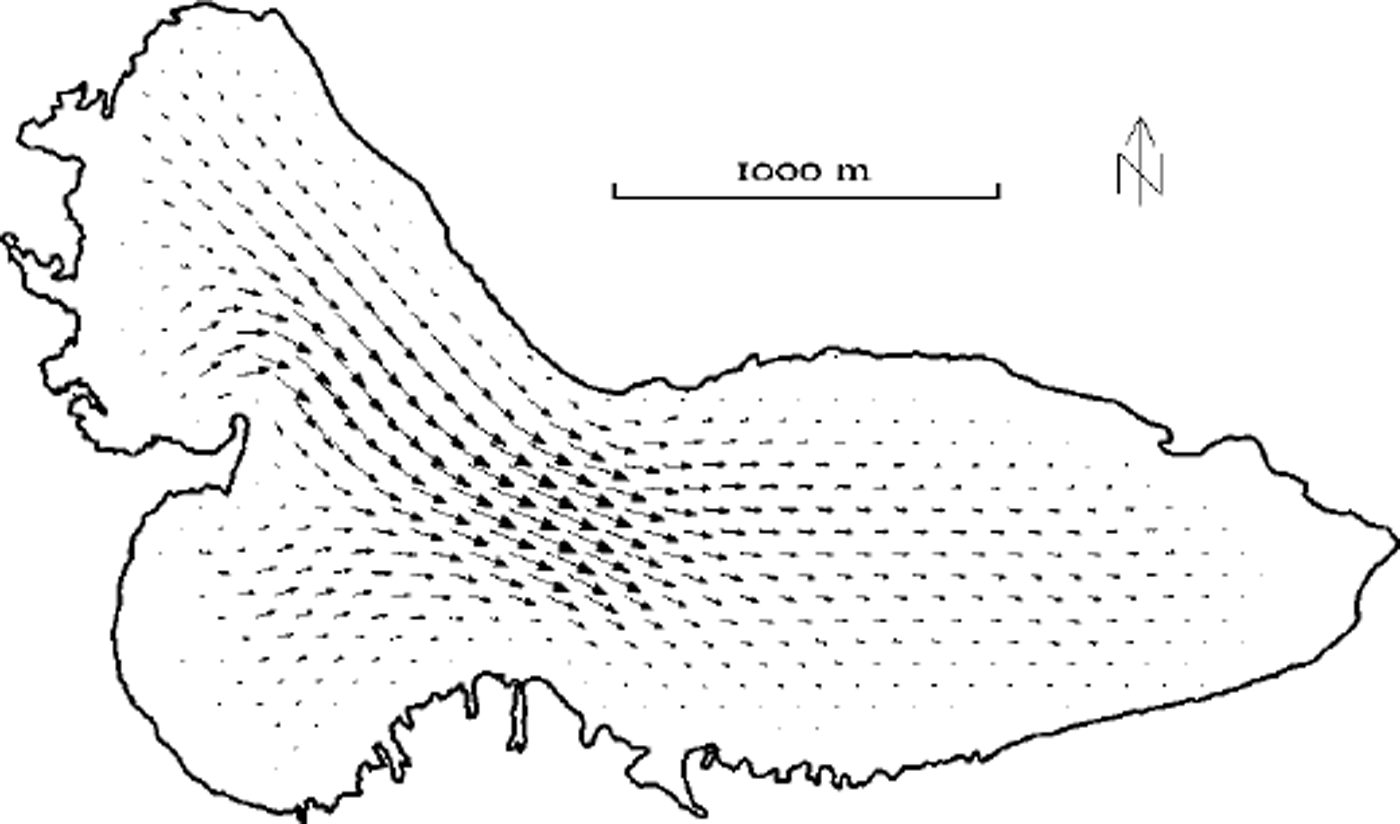
In Figure 7, evolution of the ice volume is shown for the three model experiments. Since the difference between model experiments 2 and 3 is that experiment 2 is driven by alternating winter and summer balances and experiment 3 is driven by the annual balance for both winter and summer time-steps, the resulting curves in Figure 7 coincide once each mass-balance year. The perfect agreement of both curves after each year for the entire time integration convincingly demonstrates that the seasonal variations in the mass balance are negligible. The model result using the elevation-dependent mass balances produces considerable deviations from the distributed balance-model runs.
Ice-volume variations of Storglaciären, 1959–90: experiments 1 ( dottedline), 2 ( solidline) and3 (dashed line). Asterisks show ice volumes obtained from digital elevation maps of corresponding surface and bed topographies.
The simulated volume change can be compared with the volumes evaluated from the digital surface topography and the bed topography (henceforth referred to as measured volume). The measured volume generally agrees well with the volume computed from the mass-balance input except for the 1980 map (Fig. 7). However, the accumulated mass balance indicates that very little change can be expected during the periods 1969–80 and 1980–90. It seems reasonable to assume that the 1980 map is inaccurate by a systematic underestimation of surface elevation by 5–10 m.
Conclusions
The aim of the present study was to investigate the coupling between mass balance and glacier evolution. With the use of digitized gridded winter and summer mass-balance maps for the period between mass-balance years 1960/61 and 1990/91, we examined the two-dimensional effect of the mass-balance distribution on the glacier evolution. Three model experiments were carried out by forcing the first-order-approximation model with (1) an elevation-dependent mass balance; (2) winter and summer mass-balance maps in a half-year time-step; and (3) annual mass-balance maps which have been computed from the winter and summer mass balances.
Avery good agreement was obtained between the model result and the observed topography of Storglaciären for 1990. The estimated error is generally ≤ 10m (Fig. 5b and c). No difference is visible between model experiments 2 and 3, which indicates the negligible effect of mass-balance variations on time-scales of seasons. Model experiment 1, in which an elevation-dependent mass balance forced the model, generally yields good results (Fig. 5c). However, the discrepancies between the model computation and observations are larger, especially in the southeastern part of Storglaciären. This is due to the use of an elevation-dependent mass balance which neglects the topographic effects on the spatial distribution of mass balance. In addition, the evolution of the glacier volume for experiment 1 deviates from the others (Fig. 7). This suggests that modelling of glacier evolution with elevation-dependent mass-balance input may yield larger deviations from the observations, especially for long-term (≥ 50 year) integrations.
The combination of the high density of available mass-balance data and the numerical model makes it possible to validate both the model and the data (e.g. the increased accumulation due to a lee effect in the southeastern part of the glacier, or the error in the 1980 topographic map can be identified). It is also possible to obtain a characteristic distribution pattern for the mass balance, which can be used to generate a simulated distributed balance if only elevation-dependent mass balance is available. The work by Schneeberger and others (in press), in which a GCM is used as input to an energy-balance model of the glacier (Reference HockHock, 1998), can be improved with the observed characteristic balance distributions. Such an approach will allow computations of both historical and future scenarios of mass-balance variations and their effects on the glacier volume.
Acknowledgements
This study has, in part, been made possible through the European Ice-Sheet Modelling Initiative (EISMINT) exchange grant account No. 9704 for P.J. to visit H.B. and O.A. A similar travel grant to P.J. from the Margit Ahltins fund of the Royal Swedish Academy of Sciences provided further opportunities for exchange. The work of O.A. was financed through ETH grant No. 0–20–102–95. We also acknowledge A.P. Stroeven for supplying the elevation-dependent mass-balance data.


