


High-resolution digital surface datasets have become widely available to archaeologists over the last several decades. Archaeologists have responded by developing methods to locate archaeological sites in these data at a landscape scale. These methods include training deep learning (DL) models to automatically detect archaeological features.
Although rapidly locating archaeological sites at a landscape scale has implications for research and cultural resource management (CRM), limited training dataset availability can hinder large-scale model deployment. Training DL models on procedurally generated objects could eliminate this bottleneck. Procedural generation—algorithms that quickly generate content—can automate archaeological object creation, eliminating the need for time-consuming training dataset development. We used a structure type located during review of lidar-derived visualizations in the Kisatchie National Forest in Louisiana to test this approach. These structures look like historic tar kilns but have an unusual form and thus could not be detected using models trained on existing datasets. We implemented two procedural generation workflows for creating simulated structures and used these datasets to train DL models. We assessed these trained models’ ability to detect the possible tar kilns and used the predictions to test our hypothesis about their function.
In this article, we use DL terminology to refer to key parts of our detection procedure. In archaeology, “feature” commonly refers to structural/nonportable components of archaeological sites. However, in DL contexts, the term “object” refers to detected items, whereas “feature” refers to an image/object’s characteristics (e.g., an edge) that a DL model may use as part of its object recognition workflow. Therefore, in this study, object refers to the archaeological “features” we hope to detect. Other DL terms are defined at first use. A glossary is also included in Supplementary Material 1.
Background
Archaeological Deep Learning with Neural Networks
DL is a form of machine learning, an approach that uses algorithms to make predictions about datasets. DL models can be supervised, using information gained from training datasets to make more accurate predictions. Supervised machine learning is not new—for example, linear regression is a form of supervised machine learning—but “deep” learning models are unique because they use neural networks. Neural networks are models composed of many layers of interconnected “neurons” that theoretically mimic the structure of a human brain. As data are fed through a neural network’s layers, specific features within the data activate specific neurons, which in turn activate neurons in the layers to which they are connected. This training procedure produces “weights,” numbers that tell a neural network how to interpret new data. Neural networks can perform tasks like object recognition and classification that were historically difficult for computers, making them valuable for complex archaeological tasks (e.g., Fetaya et al. Reference Fetaya, Lifshitz, Aaron and Gordin2020; Navarro et al. Reference Navarro, Cintas, Lucena, Manuel Fuertes, Segura, Delrieux and González-José2022), including the aim of this study: locating archaeological sites in lidar data.
Archaeologists have used neural networks to successfully detect diverse archaeological object types across geographic settings; for example, agricultural terraces in Sāmoa (Quintus et al. Reference Quintus, Davis and Cochrane2023), buildings in the Maya region (Somrak et al. Reference Somrak, Džeroski and Kokalj2020), and barrows in the Netherlands (Verschoof-van der Vaart et al. Reference Verschoof-van der Vaart, Lambers, Kowalczyk and Bourgeois2020). Many recent lidar-focused archaeological DL implementations use some form of convolutional neural network (CNN; see Bonhage et al. Reference Bonhage, Eltaher, Raab, Breuß, Raab and Schneider2021; Bundzel et al. Reference Bundzel, Jaščur, Kováč, Lieskovský, Sinčák and Tkáčik2020; Carter et al. Reference Carter, Blackadar and Conner2021; Character et al. Reference Character, Beach, Inomata, Garrison, Sheryl Luzzadder-Beach, Cambranes, Pinzón and Ranchos2024; Küçükdemirci et al. Reference Küçükdemirci, Landeschi, Ohlsson and Dell’Unto2023; Somrak et al. Reference Somrak, Džeroski and Kokalj2020; Suh and Ouimet Reference Suh and Ouimet2023; Suh et al. Reference Suh, Anderson, Ouimet, Johnson and Witharana2021; Verschoof‐van der Vaart et al. Reference Verschoof‐van der Vaart, Bonhage, Schneider, Ouimet and Raab2023). This model structure uses filtering layers called convolution layers to emphasize image components (e.g., Karamitrou et al. Reference Karamitrou, Sturt, Bogiatzis and Beresford-Jones2022:Figure 1) and help the model learn which features characterize the object of interest. Therefore, CNNs are a good choice for detecting archaeological features in lidar data.
Training Datasets for Archaeological Deep Learning Models
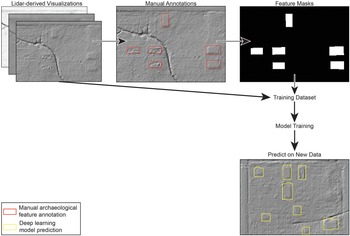
Training a neural network to detect archaeological objects requires a training dataset of images of the object of interest (Figure 1, “lidar-derived visualizations”) and complementary raster images indicating which parts of an image include an object and which parts do not (Figure 1, “feature masks”). When a neural network is shown a set of images capturing the variation within an object class—that is, the type of object—the trained model will have sufficient information to make a correct prediction when shown a new image of an object in that same class.
Idealized DL workflow with historic foundations as an example object.

Figure 1 Long description
The diagram illustrates a deep learning workflow for detecting archaeological features. It begins with 'Lidar-derived Visualizations' showing multiple layered images. An arrow points to 'Manual Annotations' where specific features are marked with rectangles. Another arrow leads to 'Feature Masks', a black image with white shapes indicating annotated features. This is followed by a downward arrow labeled 'Training Dataset', leading to 'Model Training' and then to 'Predict on New Data'. The final image shows predictions with yellow rectangles. A legend indicates red rectangles for manual annotations and yellow for deep learning predictions.
Comprehensive training dataset development requires a significant time investment. Archaeologists using DL for object detection often start by manually annotating—for example, drawing a shape around the archaeological object boundary—remote sensing data (Anttiroiko et al. Reference Anttiroiko, Groesz, Ikäheimo, Kelloniemi, Nurmi, Rostad and Seitsonen2023; Bonhage et al. Reference Bonhage, Eltaher, Raab, Breuß, Raab and Schneider2021; Canedo et al. Reference Canedo, Fonte, Dias, do Pereiro, Gonçalves‐Seco, Vázquez, Georgieva and Neves2024; Carter et al. Reference Carter, Blackadar and Conner2021; Fiorucci et al. Reference Fiorucci, Verschoof-van der Vaart, Soleni, Saux and Traviglia2022; Karamitrou et al. Reference Karamitrou, Sturt, Bogiatzis and Beresford-Jones2022; Somrak et al. Reference Somrak, Džeroski and Kokalj2020; Soroush et al. Reference Soroush, Mehrtash, Khazraee and Ur2020; Verschoof-van der Vaart Reference Verschoof-van der Vaart2022; Verschoof-van der Vaart and Lambers Reference Verschoof-van der Vaart and Lambers2019; Verschoof-van der Vaart et al. Reference Verschoof-van der Vaart, Lambers, Kowalczyk and Bourgeois2020) to create training datasets consisting of hundreds or thousands of “masked” archaeological object images. Other projects use existing archaeological site data from state/national cultural heritage databases or prior research projects (Banasiak et al. Reference Banasiak, Berezowski, Zapłata, Mielcarek, Duraj and Stereńczak2022; Casini et al. Reference Casini, Marchetti, Montanucci, Orrù and Roccetti2023; Quintus et al. Reference Quintus, Davis and Cochrane2023; Sobotkova et al. Reference Sobotkova, Kristensen-McLachlan, Mallon and Ross2024; Suh and Ouimet Reference Suh and Ouimet2023; Trier et al. Reference Trier, Reksten and Løseth2021). However, even where databases of previously documented archaeological sites exist, transforming geospatial data into training data requires additional preparation (e.g., Casini et al. Reference Casini, Marchetti, Montanucci, Orrù and Roccetti2023). Further, certain archaeological objects may be so underdocumented or uncommon that large, comprehensive training datasets are impossible to create.
Small Training Datasets Complicate DL
In general, using large training datasets increases model performance, at least to a point (see Gravel-Miguel et al. Reference Gravel-Miguel, Snitker, Hirniak, Peck and Fetterhoff2025). Small training datasets can lead to overfitting, an outcome in which models learn to detect objects in the training datasets but cannot detect objects outside that dataset. One common approach to avoid overfitting is data augmentation, a series of image manipulations—for example, flipping, stretching, or blurring—applied to introduce variation in and increase the size of a training dataset. Data augmentation can improve performance on relatively small training datasets (e.g., Character et al. Reference Character, Ortiz, Beach and Luzzadder-Beach2021; Somrak et al. Reference Somrak, Džeroski and Kokalj2020). However, this method is insufficient to capture the diversity required to train a well-performing model when it is applied on very small—fewer than 100—training datasets.
Some archaeologists use other approaches to creatively address the training dataset bottleneck; Meng (Reference Meng2023) cropped Neolithic rondel images and placed them into new topographic settings, Gallwey and colleagues (Reference Gallwey, Eyre, Tonkins and Coggan2019) used lunar surface craters as a training dataset for a historical mining pit detection model, and Vadineanu and colleagues (Reference Vadineanu, Kalayci, Pelt and Batenburg2024) proposed a rapid annotation workflow using a trained CNN to generate object masks. Outside archaeology, simulated sonar data are sometimes used for training underwater object detection models (e.g., Sung et al. Reference Sung, Kim, Lee, Kim, Kim, Kim and Son-Cheol2020). To our knowledge, however, no one has yet attempted to train a DL model with a procedurally generated training dataset for terrestrial archaeological applications.
Procedural Generation
Procedural generation techniques create content, such as video game assets (see the discussion in Togelius et al. Reference Togelius, Shaker, Nelson, Togelius, Shaker and Nelson2016). These techniques rely on different algorithms depending on the desired output content; in a video game context, for instance, a random number generator can create simple obstacles for a player to encounter (Brewer Reference Brewer2017:Figure 3), whereas noise generation algorithms can build extensive simulated landscapes (Parberry Reference Parberry2014; Smelik et al. Reference Smelik, De Kraker, Tutenel, Bidarra, Groenewegen, Egges, Hürst and Veltkamp2009).
Togelius and colleagues (Reference Togelius, Shaker, Nelson, Togelius, Shaker and Nelson2016) note several characteristics of ideal procedural generation. Their concepts of speed, reliability, and controllability are especially relevant. Creating a procedurally generated training dataset should be quicker than manual annotation of a similar number of real archaeological objects. Further, the output dataset needs to be reliable (realistic enough) because an unrealistic object form or placement may introduce variation into the final model that is not present in real objects, increasing noise in its predictions. Finally, users need to control the generated data to tune the final training dataset to their needs. For instance, users might adjust the final simulated object size or size range so the output dataset matches the object of interest. A procedural generation algorithm with these characteristics could produce a sufficient DL model training dataset.
Case Study
Study Area
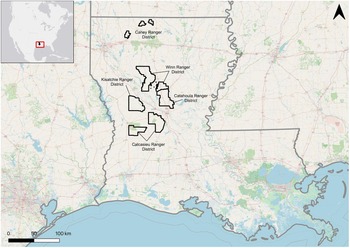
The Kisatchie National Forest (KNF) was established in 1930 on former logging company lands (Burns et al. Reference Burns, Couch and Region1994) and covers more than 600,000 acres (approximately 243,000 ha) in north-central Louisiana (Figure 2). Its five ranger districts are located across the Tertiary / Southern Tertiary Uplands ecoregion, characterized by hilly, dissected terrain with a mix of forest and wetland plant communities (Daigle et al. Reference Daigle, Griffith, Omernik, Faulkner, McCulloch, Handley, Smith and Chapman2006). Decades of archaeological survey and excavation on the KNF show a long history of human occupation, from Paleoindian/Archaic use of the landscape’s lithic resources to the dramatic landscape changes associated with the late nineteenth- and early twentieth-century lumber industries (Anderson and Smith Reference Anderson and Smith2003:15–20, 349–365, 437–451).
Map of KNF ranger districts, Louisiana (Basemaps: Open Street Map, ESRI).

Figure 2 Long description
The map of Louisiana displays the locations of five ranger districts within the Kisatchie National Forest (KNF). These districts are labeled as Caney Ranger District, Winn Ranger District, Catahoula Ranger District, Kisatchie Ranger District and Calcasieu Ranger District. Each district is outlined with distinct boundaries. The map includes a scale bar indicating distances of 0, 50 and 100 kilometers. A small inset map in the top left corner shows the location of Louisiana within North America, highlighted by a red box. The map features various geographical elements such as rivers, roads and urban areas, providing context to the ranger districts' locations.
Unknown Archaeological Objects in the KNF
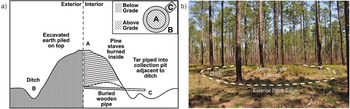
While examining a lidar dataset in the KNF’s Catahoula Ranger District, we identified 12 structures in the vicinity of Camp Livingston, a World War II–era military installation, that are visually similar to historic tar kilns. Tar kilns are circular, earthen structures used to extract tar, pitch, and resin from pine trees for industrial and domestic uses. Commonly used from the eighteenth to the early twentieth centuries (Southerlin et al. Reference Southerlin, Brilliant, Moser, Snitker and Stewart2021), tar kilns (Figure 3) consisted of stacked pine staves covered with earth excavated from a surrounding trench. The pine was burned in a low-oxygen environment to extract tar that was then piped to a barrel in a nearby collection pit. When located archaeologically, the only remaining tar kiln components are typically a below-grade ditch surrounding an above-grade interior and sometimes a visible collection pit on the trench exterior (Snitker et al. Reference Snitker, Moser, Southerlin and Stewart2022).
(a) Typical tar kiln cross section (based on Combes Reference Combes1974); (b) archaeological tar kiln (Snitker et al. Reference Snitker, Moser, Southerlin and Stewart2022).

Figure 3 Long description
The image A shows a schematic of a typical tar kiln cross section. On the left side, labeled 'Exterior,' there is a ditch marked 'B' with excavated earth piled on top. The right side, labeled 'Interior,' features pine staves burned inside, with tar piped into a collection pit adjacent to the ditch. A buried wooden pipe is indicated at the bottom, marked 'C.' The inset diagram at the top right illustrates the kiln's structure, differentiating between below-grade and above-grade areas, labeled 'A' and 'B' respectively. The image B shows an archaeological tar kiln site in a forested area. A dashed line outlines the ditch and above-grade interior, with labels indicating 'Ditch,' 'Above-Grade Interior,' and 'Exterior Ditch Edge.' Tall pine trees surround the site, providing context to the historical use of the area for tar extraction.
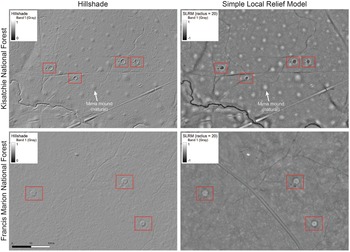
The objects identified in the KNF are circular objects with an adjacent pit and thus share morphological attributes with documented tar kilns (Figure 4). However, these objects have an above-grade berm surrounding a below-grade interior (Figure 4, bottom), whereas elsewhere in the US Southeast (Figure 4, top) tar kilns have an above-grade interior surface surrounded by a ditch (Snitker et al. Reference Snitker, Moser, Southerlin and Stewart2022). Tar kilns have not yet been documented archaeologically in Louisiana (Charles McGimsey, personal communication 2024), but they are referenced in historical accounts (Forbes Reference Forbes and Gamble1921; Touchstone Reference Touchstone1985) and have been documented elsewhere in the Southeast (Combes Reference Combes1974; Hart Reference Hart1986; Herbert et al. Reference Herbert, Carnes-McNaughton, Feltz, Parsons and Schleier2018; Southerlin et al. Reference Southerlin, Brilliant, Moser, Snitker and Stewart2021). Therefore, if the objects are tar kilns, they represent a new research and resource management opportunity.
(Top) Unknown archaeological objects in the KNF, Louisiana, surrounded by mima mounds; (bottom) tar kilns in the FMNF, South Carolina.

Figure 4 Long description
The image consists of four maps displaying hillshade and Simple Local Relief Model (SLRM) analyses of Kisatchie and Francis Marion National Forests. Top left: Hillshade map of Kisatchie National Forest with mima mounds marked in red boxes. The legend indicates a gray scale from 0 to 1. Top right: SLRM map of Kisatchie National Forest with mima mounds highlighted. The legend shows a gray scale from -1 to 1, with a radius of 20. Bottom left: Hillshade map of Francis Marion National Forest, featuring mima mounds in red boxes. The scale bar ranges from 0 to 100 meters. Bottom right: SLRM map of Francis Marion National Forest, with mima mounds marked. The legend uses a gray scale from -1 to 1, with a radius of 20. Each map highlights natural mima mounds, with red boxes indicating their locations. The maps provide a visual comparison of terrain features using different relief models.
Given the forest’s size, automatic object detection with DL is an appropriate approach for locating other similar features. However, the small number of possible tar kilns (hereafter referred to as “targets”) and their unique morphological characteristics complicate our ability to train and apply a DL model. Using data augmentation techniques alone on this small training dataset (n = 12) would create a model subject to overfitting. Although tar kilns are common enough in the Southeast that regional archaeological tar kiln datasets exist (Harrup Reference Harrup2013; Snitker et al. Reference Snitker, Moser, Southerlin and Stewart2022; Southerlin et al. Reference Southerlin, Brilliant, Moser, Snitker and Stewart2021), applying a model trained on southeastern tar kilns to the KNF does not work because of the targets’ distinctive shape. Therefore, to train a model to detect objects like these targets, we need many more images of objects with the same form.
Data and Methods
Overview
We developed two methods for creating simulated training datasets and their associated annotation masks, both of which use procedural generation to modify real lidar-derived digital elevation models (DEMs; henceforth, Methods 1 and 2). Because of the targets’ unique form, we did not have a training dataset of real objects against which to compare models trained on procedurally generated objects. As a baseline, we also trained a model on real tar kilns from the Francis Marion National Forest (FMNF) in South Carolina. To make this training dataset better match the targets, we inverted the DEM (henceforth, Method 3) before training. We then used these three datasets to train DL (Mask R-CNN) models with the same model parameters and training dataset size. To test the trained models’ performance, we applied them to the section of the KNF containing the 12 targets. Model performance was assessed with common machine learning metrics. We then used these predictions to ground-truth the objects in the field and test our hypothesis about the objects’ function.
Lidar-Derived DEMs
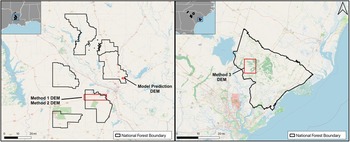
For the Method 1 and 2 datasets, we downloaded and merged 0.5 m2 resolution lidar-derived DEMs covering the entire KNF (US Geological Survey 2021) from the USGS National Map data downloader. We picked a ranger district within the KNF with similar topography to our prediction area, visually verified that it did not contain any objects resembling the targets, and selected a ∼45,000-acre area (180 km2) within the district (Method 1 DEM and Method 2 DEM; Figure 5). For the Method 3 training dataset, we used the NOAA Digital Coast Data Access Viewer to download a ∼22,500 acre (90 km2) 1 m2 resolution DEM (Method 3 DEM; Figure 5) from the FMNF (OCM Partners 2017) containing 379 known tar kilns.
(Left) Training data for Methods 1 and 2 in the KNF; (right) training data for Method 3, FMNF (Basemap: Open Street Map).

Figure 5 Long description
A two-part thematic map layout comparing DEM areas by method. A) Left map. Several separate National Forest Boundary outlines are shown as thick closed shapes. Inside and near these outlines are multiple small filled blocks and one long rectangular outline. Text labels identify “Method 1 DEM” and “Method 2 DEM” with leader lines pointing to the long rectangular outline. Another label reads “Model Prediction DEM” with a leader line pointing to a small rectangular area. A scale bar at the lower left shows 0, 10 and 20 mi. A legend box at the lower right reads “National Forest Boundary” next to a sample outline symbol. An inset locator map appears in the upper left. B) Right map. One large National Forest Boundary outline is shown as a single closed shape. A label reads “Method 3 DEM” with a leader line pointing to a square outline. A north arrow is shown near the upper right, indicating north is up. A scale bar at the lower left shows 0, 10 and 20 mi. A legend box at the lower right reads “National Forest Boundary” next to a sample outline symbol. An inset locator map appears in the upper left.
Model performance was assessed by applying the trained models to a lidar-derived DEM (Model Prediction DEM; Figure 5) covering the area where the targets were first located. We downloaded this 1,010-acre (approximately 4 km2) Model Prediction DEM from the USGS National Map Data Downloader in the original project resolution of 0.5 m2. This raster includes the 12 targets, as well as a small section of Camp Livingston. The area around Camp Livingston has many anthropogenic (e.g., historic structure foundations) and natural (e.g., mima mounds) objects, providing an opportunity to assess trained model performance in areas with a high number of potential false positives. To ensure all training datasets had similar attributes, we resampled all 0.5 m2 resolution maps to a 1 m2 resolution to match the dataset used for Method 3. The approach described later can be applied on higher-resolution lidar; however, 1 m2 resolution lidar is accessible for much of the United States, allowing this workflow to be reproducible across different study areas.
Creating Simulated Objects
We developed three methods to create our training datasets:
1. Method 1: Create a training dataset comprising fully simulated targets (matching the objects depicted in Figure 4).
2. Method 2: Create a training dataset comprising “simple” targets (fully simulated circular berms without an adjacent pit).
3. Method 3: Invert an existing DEM featuring confirmed tar kilns (n = 379) to create a training dataset of “real” data.
Methods 1 and 2 are procedural generation approaches that create simulated training datasets. Python code for these methods can be found in the project code repository (see the Data Availability Statement) with detailed instructions on installation and usage. Method 3 uses real tar kiln visualizations and can be implemented in GIS software. These approaches are described in detail later. Specific parameters, such as original object sizes and procedurally generated object component size ranges, can be found in Supplementary Materials 2 and 3.
Method 1: Fully Simulated Tar Kilns
This workflow requires four inputs: a DEM, a vector drainage file covering the DEM, the desired number of objects to add to the DEM (n), and a desired output object radius (r). The script then adds that number of simulated objects to the DEM using the following procedure.
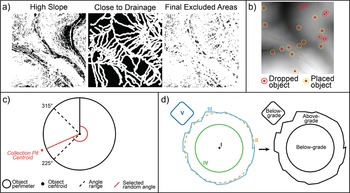
Create an Exclusion Model. First, the script creates an exclusion model to determine object placement. Tar kilns are not found in drainages or on very steep slopes (see, e.g., Snitker et al. Reference Snitker, Moser, Southerlin and Stewart2022), nor are the documented targets. Therefore, our exclusion model (Figure 6a) removes areas of the DEM with high slope (>10%). The model also removes areas within drainages or within the vicinity of drainages.
(a) Simulated object placement exclusion model on a 256 × 256-pixel tile (black areas represent suitable object placement locations); (b) simulated object placement in a 256 × 256-pixel tile; objects too close together are dropped; (c) collection pit placement rules; (d) the script generates a tar kiln perimeter (II) around each placed point (I) as a circular buffer, modifies it with random noise (III), and then generates the tar kiln interior (IV) and collection pit (V).

Figure 6 Long description
The image A showing three square raster-style maps arranged left to right. The first map has the heading High Slope. The second map has the heading Close to Drainage. The third map has the heading Final Excluded Areas. The image B showing a square map area with multiple circular markers placed across it. Below the map is a key with two labelled marker types. The labels read Dropped object and Placed object. The image C showing a circular rule diagram with a large circle and a smaller circle near the centre. A dashed line forms an angle wedge and a solid line extends from the centre toward the lower left. Text near the circle reads Collection Pit Centroid. Angle labels around the circle read 315 degree and 225 degree. A key below the diagram lists four items: Object perimeter, Object centroid, Angle range, Selected random angle. The image D showing a schematic with a central point and multiple surrounding outlines. Roman numeral labels appear around the outlines: I, II, III, IV, V. An arrow points from the left schematic to a ring-shaped outline on the right. Text on the right schematic reads Below-grade, Above-grade and Below-grade.
Generate Centroids. Within the suitable areas identified by the exclusion model, the script selects n random points representing the future simulated target centroids. The script then removes any point within the r value provided by the user (Figure 6b) to avoid creating unrealistically overlapping simulated objects. If this process results in a final number of centroids less than n, the script selects a new set of random points until it finds a set of n points that do not overlap.
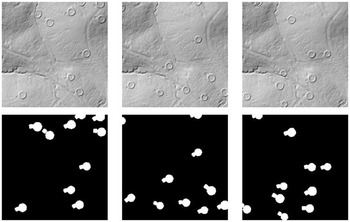
Create an Object around Each Centroid. Around each generated point (“I” in Figure 6d), the script creates several vector shapes. To form the tar kiln and the tar collection pit, the script creates a circular buffer around the generated point, defining the object’s perimeter (“II” in Figure 6d). The script then generates random noise and applies it to the perimeter to create an imperfect exterior line, simulating postdepositional processes (“III” in Figure 6d). Then, the script creates a smaller circular buffer (“IV” in Figure 6d). These two shapes define the tar kiln’s exterior berm (“III” in Figure 6d) and the below-grade interior’s perimeter (“IV” in Figure 6d), respectively. The script then creates a collection pit next to each tar kiln by selecting a randomly offset pit centroid within a range of azimuths observed in the target objects (Supplementary Material 2:Table 1). These vector shapes are used to add or subtract elevation from the DEM to create the simulated object. The output is a real DEM in which simulated tar kilns have been embedded (Figure 7, top). Throughout this process, the script uses the object’s vector shapes to create an annotation shapefile and turns that vector annotation into an annotation raster (Figure 7, bottom), eliminating the need for manual annotation.
(Top) Different iterations of procedurally generated targets on the same 256 × 256-pixel tile; (bottom) their associated generated annotation masks.

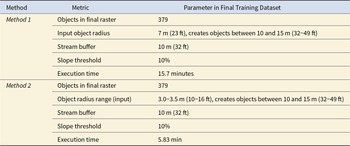
To create this study’s training dataset, we ran the script with n = 379, to match the training dataset used in Method 3. This allowed us to ascertain whether the performance of each trained model varied based on the type of training data (real vs. simulated) rather than the number of objects in the training dataset (see Table 1 for all parameters).
Final Training Dataset Metrics for Methods 1 and 2.

Table 1 Long description
The table is intended to report final training dataset metrics for two approaches labeled Method 1 and Method 2. No rows, columns, metric names, or numeric values are included, so specific results, comparisons, or trends cannot be described. Without the underlying data, it is not possible to state which method performs better, how large any differences are, or whether changes are meaningful. Provide the table entries, including metric labels, units, and values for each method, to generate accurate WCAG-compliant .
Method 2: Simple Tar Kilns
Method 1 followed the assumption that a simulated training dataset would be most effective when it closely matched the object of interest. To test this assumption, we also developed a workflow for “simple” objects: circular objects with an above-grade exterior berm and no adjacent pit.
This procedure uses Method 1’s exclusion process to define object centroids. Then, using a user-provided minimum–maximum range, the script creates the berm and interior for each centroid following the Method 1 procedure. These vector shapes are then used to add and subtract height from the underlying DEM. As with Method 1, we ran the script with n = 379 (see Table 1).
Method 3: Inverted DEM
The FMNF contains hundreds of tar kilns that are characterized by a ditch surrounding an above-grade center (Snitker et al. Reference Snitker, Moser, Southerlin and Stewart2022). Because the Kisatchie targets are “inverted” compared to the FMNF tar kilns, we hypothesized that inverting the lidar-derived DEM of FMNF tar kilns might be sufficient to train a target detection model. Therefore, we inverted the raster using a raster calculator tool (available in most GIS software), ensuring that the resulting raster retained its original range of values. The inverted tar kilns’ profiles demonstrate that they more closely resemble the targets (Figure 8).
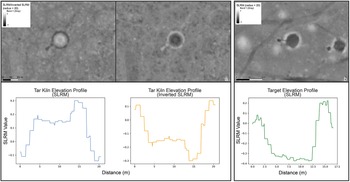
(a) SLRM (top, left) from the FMNF and inverted SLRM (top, right) with shared scale and legend, featuring a “standard” southeastern tar kiln at center. Also shown is the elevation profile of a tar kiln in SLRM (bottom left) and SLRM after DEM inversion (bottom right); (b) SLRM (top) and elevation profile (bottom) showing unmodified possible tar kilns from the KNF.

Figure 8 Long description
The image A showing three raster map views with small legend boxes and scale bars labeled 0, 10, 20 m. A) Raster map view labeled SLRM Inverted SLRM (radius equals 20) and Band 1 (Gray). A single circular ring feature is visible. The ring encloses a lighter circular center. B) Raster map view showing a single circular ring feature. The ring encloses a darker circular center. C) Raster map view labeled SLRM (radius equals 20) and Band 1 (Gray). Multiple circular features are visible, including one larger circular ring feature and several smaller circular features. The image B showing three line graphs. All three graphs use x-axis label Distance (m) and y-axis label SLRM Value. A) Line graph title: Tar Kiln Elevation Profile (SLRM). The x-axis range is 0 to 20. The y-axis tick labels shown are negative 0.1, 0.0, 0.1, 0.2, 0.3. The plotted line starts near negative 0.1 at distance 0, rises to about 0.0 by about distance 2, rises to about 0.17 near distance 4, stays around 0.14 to 0.16 from about distance 5 to 12, rises to about 0.30 around distance 14 to 16, then drops to about 0.0 near distance 18 and to about negative 0.1 near distance 20. B) Line graph title: Tar Kiln Elevation Profile (Inverted SLRM). The x-axis range is 0 to 20. The y-axis tick labels shown are 0.1, 0.0, negative 0.1, negative 0.2, negative 0.3. The plotted line starts near 0.1 at distance 0, drops to about negative 0.2 by about distance 4, stays around negative 0.15 from about distance 5 to 12, drops to about negative 0.30 around distance 14 to 16, then rises to about 0.1 near distance 20. C) Line graph title: Target Elevation Profile (SLRM). The x-axis range is 0.0 to 17.5 with tick labels 0.0, 2.5, 5.0, 7.5, 10.0, 12.5, 15.0, 17.5. The y-axis tick labels shown are 0.2, 0.1, 0.0, negative 0.1, negative 0.2, negative 0.3, negative 0.4. The plotted line starts near 0.0 at distance 0.0, drops to about negative 0.3 by about distance 4.0, stays around negative 0.33 to negative 0.36 from about distance 5.0 to 12.5, rises to about 0.2 around distance 14.5 to 16.0, then drops to about 0.0 by about distance 17.5.
Model Training
Training Data. Training datasets consist of both image data and annotation masks that label each object. The Method 1 and 2 scripts automatically generate an annotation mask raster in which each object is represented by pixels of a unique integer. For Method 3 we created a 20 m buffer around tar kiln centroids (identified by Snitker et al. Reference Snitker, Moser, Southerlin and Stewart2022) that was wide enough to capture the tar kiln and collection pit, if present. We then converted these vector shapes to a raster, with each individual object represented by pixels of a unique integer.
To create the training images, we used the Relief Visualization Toolbox (Kokalj and Somrak Reference Kokalj and Somrak2019; Zakšek et al. Reference Zakšek, Oštir and Kokalj2011) to create a series of visualizations—hillshade, local dominance, negative openness, positive openness, slope, simple local relief model (SLRM) with a 20-pixel radius, and sky-view factor—for all DEMs. These visualizations were chosen based on prior work visualizing archaeological sites in lidar data (Guyot et al. Reference Guyot, Lennon and Hubert-Moy2021). For all methods, we tiled the visualizations and masks into 256 × 256 pixel tiles and scaled the pixel values in each image to values between 0 and 1 using code developed by Gravel-Miguel and colleagues (Reference Gravel-Miguel, Snitker, Hirniak, Peck and Fetterhoff2025). This method creates a set of overlapping tiles (offset by 128 pixels) to double the number of training tiles and ensure that partial objects can still contribute to model training.
Model Development. All models were trained on an NVIDIA RTX A4000 GPU (16 GB of RAM) using PyTorch (Ansel et al. Reference Ansel, Yang, Horace, Gimelshein, Jain, Voznesensky and Bao2024) in a workflow and Mask R-CNN model implementation developed by our team. Mask R-CNN (He et al. Reference He, Georgia, Piotr and Ross2017) is a DL model framework that can perform instance segmentation: when the model makes a prediction, it segments (i.e., divides) an image by giving a unique integer value to all the pixels belonging to a specific object within a class.
The model training workflow follows the one described in Gravel-Miguel and colleagues (Reference Gravel-Miguel, Snitker, Hirniak, Peck and Fetterhoff2025), with slight modifications to fit the Mask R-CNN model requirements. The Python script first identifies appropriate training tiles (containing at least x pixels of the object of interest, based on a user-defined threshold). The script then separates the selected tiles into training, validation, and testing datasets (80%, 10%, and 10%, respectively). The script then preprocesses the tiles by combining three one-band visualizations into a three-band image by stacking them along a third dimension. Then, the script adds augmentations—for example, flipping, stretching, or blurring—to the training tiles and their respective masks; see Gravel-Miguel and colleagues (Reference Gravel-Miguel, Snitker, Hirniak, Peck and Fetterhoff2025) for the list of augmentations applied along with their probabilities. It also computes the coordinates of a bounding box around each separate mask, a rectangular box that fully surrounds the object mask (required for Mask R-CNN model training). Training tiles, their masks, and bounding boxes are fed to the model in small batches until the model has seen them all and adjusted its neurons’ weights accordingly at the end of one epoch (i.e., model training iteration) based on performance on the training dataset. The other datasets allow the user to assess the degree of overfitting (validation) and test the trained model’s performance after all epochs (testing).
All models used “pretrained” weights; before training on this simulated archaeological dataset, the model backbone—the specific number and ordering of layers within a neural network; in this case, ResNet50—had already been pretrained on the ImageNet training dataset, a database of several million labeled images (Russakovsky et al. Reference Russakovsky, Deng, Hao, Krause, Satheesh, Sean and Huang2015). All models used a variable learning rate—how quickly the model adjusts its parameters after performance is calculated during an epoch—and the AdamW optimizer, the algorithm that helps the model change its parameters to reduce loss. All models were trained with a batch size—the number of images shown to the model at the same time—of eight.
Learning is assessed based on precision, recall, F1, and loss and is calculated after each epoch. These metrics are commonly used to assess DL model performance and are calculated based on the proportions of true positives, false positives, and false negatives. A true positive is a real object that the model correctly predicted. A false negative is an object that exists but that the model did not detect. A false positive is an object predicted by the model but that does not belong to the predicted class. Precision is the percentage of total predictions representing actual objects, whereas recall is the percentage of actual objects that are correctly predicted. A model can have high precision and low recall, meaning that although most objects it identified are real (i.e., few false positives), it also missed many real objects (i.e., many false negatives). In contrast, a model can have a high recall (i.e., detected most of the true positives) and low precision, meaning many of its predictions were incorrect (i.e., many false positives). F1 is the harmonic mean of precision and recall and is a common way of summarizing those metrics. During training, these metrics are calculated pixel by pixel: each pixel in the prediction mask that overlaps with a real object’s pixel in the annotation mask is a true positive.
Loss is the final metric used to evaluate model performance during training. Loss describes the average inaccuracy of predictions during model training. Therefore, it is positively correlated with the number of incorrect predictions. After each epoch, the model weights are adjusted to minimize loss. Loss can be calculated using different functions; in this study, we use the procedure hard-coded into the PyTorch Mask R-CNN implementation (Ansel et al. Reference Ansel, Yang, Horace, Gimelshein, Jain, Voznesensky and Bao2024), which follows the procedure in the original Mask R-CNN publication (He et al. Reference He, Georgia, Piotr and Ross2017) to calculate loss after each training epoch. That value is a sum of five different loss functions applied on the mask, the bounding box, and the label assigned to each prediction. All models were trained for 15 epochs, at which point metrics plateaued.
We primarily tested different visualization combinations across model trainings. To find the visualization parameters that created the best model, we followed an iterative process. Starting with the Method 3 data (the inverted DEM model), we trained a model with each unique combination of available visualizations. We then determined which model had the best F1 when calculated on the model’s testing dataset. We found that a model trained on all tiles visualized to show local dominance produced the best metrics. All subsequent models were then trained on local dominance tiles.
Postprocessing
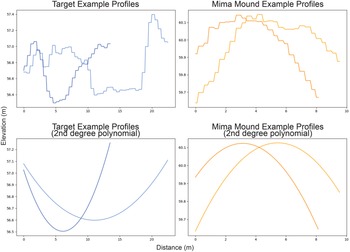
We developed a postprocessing procedure to clean model predictions after observing common false positives in initial model outputs. Most of the observed false positives were mima mounds, a natural mound prevalent in low-relief areas of the KNF (an example is labeled in Figure 4) and elsewhere in North America (see, e.g., discussion in Washburn Reference Washburn1988). Although both are circular, the elevation profile of a mima mound is distinct from the profile of our targets; the former are dome-like (convex), whereas the latter are pit-like (concave). Their profiles reflect this difference in form.
To remove mima mounds from the models’ predictions, the postprocessing script calculated the major and minor axes for each object and sampled the underlying DEM every 10 cm, producing two profiles for each object (Figure 9, top). The script then used a linear regression to smooth the profiles and calculated their second derivatives (Figure 9, bottom), which indicate the direction of the curve. A profile with a negative second derivative indicates a dome-like object that is likely not a target. Conversely, a function with a positive second derivative indicates a pit-like object that is more likely to be a target. Using this information, the script classified all objects based on the sign of both of their profiles’ second derivatives: an object with two positive second derivatives was classified as a likely target, an object with two negative second derivatives was classified as a likely mima mound, and an object with one positive and one negative second derivative was classified as ambiguous. For this project, we used this procedure to classify all objects predicted by each model and to remove likely mima mounds from the prediction dataset.
Perpendicular profiles from a single target (left) and mima mound (right) before (top) and after (bottom) smoothing.

Figure 9 Long description
The image contains four multi-line graphs comparing target and mima mound profiles. The first graph, titled 'Target Example Profiles,' has the vertical axis labeled 'Elevation (m)' ranging from 56.4 to 57.4 and the horizontal axis labeled 'Distance (m)' ranging from 0 to 23. It shows two lines with step-like variability, one rising sharply near 20 meters. The second graph, titled 'Mima Mound Example Profiles,' has the vertical axis labeled 'Elevation (m)' ranging from 59.7 to 60.1 and the horizontal axis labeled 'Distance (m)' ranging from 0 to 10. It displays two lines forming mound-shaped peaks around 3 to 6 meters. The third graph, titled 'Target Example Profiles (2nd degree polynomial),' has the same axes as the first graph. It shows polynomial fits smoothing the data into U-shaped curves. The fourth graph, titled 'Mima Mound Example Profiles (2nd degree polynomial),' shares the axes with the second graph and shows inverted-U curves. The graphs illustrate how target profiles exhibit step-like changes, while mima mound profiles form distinct peaks, with polynomial fits providing smoother representations.
To further improve prediction denoising, we dropped all very small objects (less than 30 m2) from the dataset. Finally, because many of the observed false positives were drainage meanders, we also dropped all objects that intersected, were within 15 m of a drainage (determined using a stream extraction procedure on a 10 m resolution DEM with an initiation threshold of 1,000 pixels), or both. These denoising procedures were applied to all model predictions.
After postprocessing, we systematically examined the hillshaded lidar-derived DEM and labeled each remaining object based on its likely function. Supplementary Material 4 records the distribution of predictions across each class.
Ground-Truthing
After systematic review, we merged each unique “possible” target into a GeoPackage with the original 12 targets. We assigned each new possible target a confidence rating based on its appearance and proximity to the original targets. Eleven of the 12 original targets were visited in the field, photographed, and visually evaluated for their potential as historic tar kilns. A subset of the original targets (n = 2) was measured, mapped, and augered to evaluate for subsurface attributes unique to tar kilns such as charcoal-rich sediments, charred pine billets, a buried wooden tar pipe, or a hard-pan clay floor. A subsample of “high confidence” targets (n = 2) was also visited to evaluate their potential as tar kilns. Access to all targets was not possible because of the dense understory vegetation. The remaining unvisited targets were evaluated remotely using lidar-derived visualizations and satellite imagery in consultation with archaeologists from the KNF Heritage Program.
Results
Prediction Methods
Method 1: Procedurally Generated Tar Kilns. The simulated tar kiln model predicted 183 objects in the Model Prediction DEM. Postprocessing automatically removed 41 objects, leaving 142 predictions to assess manually. This model (Supplementary Material 4:Figure 1) located nine of the 12 targets and six additional objects that, on review, were close enough in appearance to the targets to warrant future ground-truthing.
The remaining objects (n = 127) did not appear to be tar kilns. These false positives included a range of natural and anthropogenic objects (Figure 10). The majority (n = 91) of the false positives were reservoirs (e.g., stock tanks/ponds) that have a similar form to the targets.
(Top) New possible targets located by all methods; (bottom) the two most common false-positive categories across each method. All images share the same scale.

Figure 10 Long description
The image consists of nine satellite images arranged in a grid, divided into two main categories: 'Possible Tar Kilns' and 'Common False Positives.' Each category is further divided into three columns labeled 'Method 1,' 'Method 2,' and 'Method 3.' In the 'Possible Tar Kilns' row, each image shows a landscape with a red outline indicating a specific area of interest. In the 'Common False Positives' row, each image similarly highlights areas with red outlines, indicating features that may be mistaken for tar kilns. A scale bar at the bottom left indicates distances from 0 to 50 meters. The images are grayscale, focusing on topographical features and potential targets identified by each method.
Method 2: Procedurally Generated “Simple” Tar Kilns. The Method 2 model predicted 2,032 objects in the Model Prediction DEM. Postprocessing removed 1,323 objects, leaving 709 objects for systematic review. This model (Supplementary Material 4:Figure 2) located all 12 targets and 11 additional objects warranting future ground-truthing. The remaining 686 objects were all false positives, most commonly drainages (n = 132), reservoirs (n = 111), or indistinct objects that could not be assigned to a specific class (n = 123).
Method 3: Inverted DEM. The Method 3 model predicted 1,858 objects in the Model Prediction DEM. Postprocessing removed 1,482 objects, leaving 376 objects for systematic review. This model (Supplementary Material 4:Figure 3) located 11 out of the 12 targets and seven additional objects warranting future ground-truthing. In total, this model had 369 false positives, primarily reservoirs (n = 108) and drainages (n = 67).
Ground-Truthing
In the field, the targets (Supplementary Material 4:Figure 4) appeared similar to tar kilns. However, auger tests in two of the original 12 targets revealed no concentrations of charcoal, billets, or wooden tar pipes nor a hard-pan clay floor. Natural undisturbed clays were encountered at approximately 30 cm (12 inches) below the surface of each potential kiln. All overlying deposits were interpreted as recently accumulated fill on top of the undisturbed clays. Given the proximity of these objects to a historic military base, combined with the absence of all diagnostic attributes of a tar kiln, we concluded that they are most likely associated with military training exercises. Review of a World War II–era military training manual (United States War Department 1944) suggests the features may be howitzer emplacements (Figure 11). Additional historical research and comparison with other, similar sites will be needed to draw a firm conclusion about object function. Based on these field observations and interpretations, we determined that all remaining unvisited “high confidence” targets near the historic military base were not tar kilns (Figure 10, top).
Howitzer emplacement (illustration modified from Figure 38 in Corps of Engineers Field Fortifications manual FM 5-15; United States War Department 1944:79).

Discussion
Model Performance
Comparing all methods to each other (Table 2) based on their F1 scores, the simulated tar kilns model (Method 1) performed the best, and the “simple” tar kilns model (Method 2) performed the worst. Although Method 1 failed to locate three of the targets, it had substantially fewer false positives overall, meaning its predictions were technically the most precise. However, despite Method 1’s higher F1 score, Method 2 had the highest recall. All models located additional possible targets, a total of 12 unique objects across all models (Figure 10).
Object-by-Object Metrics for All Models When Applied to the Testing Area.

Table 2 Long description
The table is intended to compare object-by-object performance metrics across multiple models on a testing area. It would normally list each target object and report one or more evaluation metrics for each model, allowing side-by-side comparison. The best value in each metric column is indicated with special formatting, which helps identify the top-performing model per metric. Because the table data itself is missing, no specific metric values, rankings, or trends can be described. Any interpretation should also consider that the metrics are computed against a fixed set of original targets, which may limit how broadly the results generalize beyond those targets.
Notes: Metrics are calculated against the 12 original targets. The best metrics in each column are underlined.
These results suggest that a procedurally generated training dataset can train a neural network to detect archaeological objects. Depending on the performance metric that the user wishes to maximize (precision vs. recall), a model trained in this way can perform better than a model trained on modified real data. The difference between the Method 1 and 2 metrics suggests that the more closely the procedurally generated object matches the target object (i.e., Method 1), the higher the precision. However, a training dataset comprising more “general” procedurally generated objects (i.e., Method 2) will increase recall.
Deep Learning in Archaeological Workflows
DL predictions on lidar-derived DEMs have the potential to contribute to CRM and archaeological research. Lidar data alone enable the identification of subtle archaeological landscape modifications, such as tar kilns, paths, tramways, homesteads, and roads in heavily forested environments, amplifying pedestrian archaeological surveys in which these features are often not visible to the naked eye. Incorporating DL predictions into visual lidar prospection can reduce the mental load and time associated with locating sites in these data. Resource managers can then use these predictions to develop targeted survey strategies and predictive models within land management areas. As land management shifts toward larger landscape-level restoration, having high-resolution, landscape-level archaeological data may feed directly into these project goals from an integrated resource management perspective. Lidar analysis is also frequently used in landscape archaeology research in the US Southeast (e.g., Davis et al. Reference Davis, DiNapoli, Sanger and Lipo2020, Reference Davis, Caspari, Lipo and Sanger2021; Roberts Thompson and Finch Reference Roberts, Amanda and Finch2023), and DL predictions could aid in understanding site relationships at a landscape scale.
To use DL predictions in these management and research goals, reliable trained models must be available for a range of archaeological objects. This study demonstrates that archaeologists can use procedural generation to create datasets, ready for model training, of rare objects. These datasets are generated in minutes, substantially reducing the workload needed to train a model to generate predictions. Reviewed predictions can then streamline pre-field research, planning, and fieldwork. Although these predictions alone cannot contribute to assessment of eligibility for the National Register of Historic Places, which is key in the United States for evaluating adverse impacts of federal undertakings in a project area, they could help define areas of potential effect or target subsurface sampling before conducting Phase I or Phase II archaeological investigations. In a research project where a 100% inventory may be less important than locating specific site types, training models on procedurally generated datasets could produce predictions that allow researchers to target field reconnaissance, as was the case in this study. Here, we used our reviewed predictions to target field investigations in a limited geographic area and on a smaller number of objects. This fieldwork then allowed us to reject our hypothesis that these objects are historic tar kilns. Future fieldwork and review of the historical record could then inform conclusions on object function and contribute to a broader understanding of military landscape use in Camp Livingston and the surrounding area.
Although these model predictions were demonstrably useful, model metrics are lower than other recent archaeological DL case studies (Table 2; see Verschoof‐van der Vaart et al. [Reference Verschoof‐van der Vaart, Bonhage, Schneider, Ouimet and Raab2023] for results on a similar object type). However, we suggest that low-precision models may still be valuable detection tools. For our case study (and other projects attempting to locate objects with a unique form in a new study area), a high-recall and low-precision model like Method 2 is acceptable; our team found it straightforward to remove/label most model false positives and create the final fieldwork dataset. However, high false-positive rates have implications for integrating this approach into a management or research workflow. Because the outputs require manual cleaning, some effort is shifted from field survey to pre-field preparation. Although we found that the effort/time commitment needed to clean DL predictions was less than that required to complete a pedestrian survey of the same area, further model development would likely improve detection precision. Here, all models were trained on what is still a relatively small training dataset (<400) to ensure comparable results across all methods. This same procedural generation workflow could create a much larger (thousands of objects) training dataset in a short time, likely increasing performance.
Along the same lines, this study demonstrates the value of postprocessing and training dataset manipulation in increasing DL model reliability. If false positives can be excluded through automatic denoising, manually cleaning outputs will take less time. The Method 2 and 3 outputs, for instance, included many (>1,500) false positives; however, we were able to quickly and effectively exclude those with a predictable form (mima mounds) using automated postprocessing. We believe this approach could be useful for other automated archaeological object detection workflows. Further, although Model 3 generally performed worse than the models trained on procedurally generated data, it still located 11 of 12 targets. Even though it is not a procedural generation approach, this result suggests that modifying existing training data may be another useful approach for overcoming the training dataset bottleneck.
Finally, our approach focused on a specific object type. Given the success of this approach for identifying and ground-truthing these historic military objects, we suggest this method could be applicable for other archaeological object types, such as historic infrastructure, visible in lidar-derived DEMs. However, the procedural generation approach described here would need to be modified according to the attributes of the object of interest. Building foundations, for instance, could also be simulated by selecting object locations with an exclusion model and building a geometric shape around those points, whereas reticulate objects like railroad grades require a different approach. For those objects, researchers could draw on existing procedural generation algorithms—for example, for road networks, as discussed by Kelly and McCabe (Reference Kelly and McCabe2006)—to embed realistic networks in lidar-derived DEMs.
Conclusion
We developed two methods for creating simulated archaeological objects and assessed their efficacy for training DL models compared to modified real archaeological object data. We found that our models trained on fully simulated archaeological training datasets could detect the targets, although metrics varied between the two models. Our DL predictions increased fieldwork efficiency and allowed us to determine that our targets had a different function than initially hypothesized. Therefore, we suggest that a simulated object model could be a useful “first pass” before conducting more in-depth archaeological object annotation or archaeological survey in areas where structural archaeological sites are expected. Given the successful application for this object type, procedural generation could likely be applied to other archaeological objects visible in lidar data.
Automated archaeological object detection has implications for CRM and archaeological research at local and national scales. However, training dataset availability remains a bottleneck for incorporating archaeological DL at these scales. The creative use of procedurally generated objects represents one way to expand our ability to quickly locate archaeological objects in lidar-derived visualizations, providing useful data for archaeological survey and testing.
Acknowledgments
We would like to thank John Mayer, Velicia Bergstrom, Steve Treloar, and Lisa Lewis of the Kisatchie National Forest, as well as members of the US Fish and Wildlife Service aerial lidar data collection team, for their support and subject matter expertise during the duration of this project.
Funding Statement
This material is based on work supported by the US Department of Agriculture, Forest Service cooperative agreement #22-PA-11080600-228. Any opinions, findings, and conclusions or recommendations expressed here are those of the authors and do not necessarily reflect the views of the USDA Forest Service. This institution is an equal opportunity provider.
Data Availability Statement
Lidar data are available through the USGS National Map Data Downloader (https://apps.nationalmap.gov/downloader/) and the NOAA Data Access Viewer (https://coast.noaa.gov/dataviewer/). All code used in this study is available in a public GitHub repository (https://github.com/NMC-CRS/simulated-training-data-for-archaeological-site-detection) or via the following DOI: https://doi.org/10.5281/zenodo.17082763.
Competing Interests
The authors declare none.
Supplementary Material
The supplementary material for this article can be found at https://doi.org/10.1017/aap.2025.10130.
Supplementary Material 1. Glossary of Deep Learning Terms (text and table).
Supplementary Material 2. Target Measurements (text and table).
Supplementary Material 3. Method 1–3 Parameters (text).
Supplementary Material 4. Systematic Review of Model Predictions (text, table, and figures).


 Open access