


Hyperlipidaemia (HLP) is recognised as a systemic disorder of lipid metabolism caused by abnormal LDL-cholesterol, HDL-cholesterol, TAG and total cholesterol (TC) in plasma due to dietary habits, living environment and personal physical fitness(Reference Song, Wang and Wang1,Reference Jia, Zhang and Muheyati2) . The fast-paced lifestyle has changed people’s diet structure, and the excessive intake of high-fat sterols in diet or the lack of exercise has made the incidence rate of hyperlipidaemia increasing(Reference Luo, Li and Pu3). The liver, as an important organ of body metabolism, participates in the synthesis and transport of lipids, which can secrete bile and promote the digestion and absorption of fat and has a preventive or therapeutic effect on dietary hepatic lipidaemia(Reference Tietge4). The dynamic loss of lipid metabolism and excessive deposition of fat in hepatocytes may lead to degeneration, which is an important risk factor for non-alcoholic fatty liver disease(Reference Mukai, Egawa and Takeuchi5), hyperlipidaemia, CHD, diabetes, thrombosis and atherosclerosis(Reference Cegla, France and Neely6,Reference Yao, Zhang and Huang7) . Clinically, common drugs such as statins and beta drugs are used to reduce cholesterol and triglycerides, but they are prone to hepatotoxicity, dose-dependent and other potential side effects(Reference Deng, Ma and Song8), which makes these drugs have certain limitations in the treatment of metabolic diseases such as HLP.
Tea, as the most widely consumed beverage after water in the world, has attracted people’s attention because of its beneficial effects(Reference Teng, Li and Guruvaiah9). Tea is rich in polyphenols, tea pigments, tea polysaccharides and other substances, which have been recognised as being provided with the effect of lowering lipid and losing body weight(Reference Yang, Zhang and Zhang10–Reference Sun, Xu and Ye13). Several reports suggested that tea represented strong activity in reducing plasma cholesterol and TG concentration, promoting cholesterol reverse transport and activating lipid catabolism in liver(Reference Huang and Lin14). Some research evidence found that long-term and reasonable consumption of tea could effectively inhibit HLP and the diseases caused by obesity, arteriosclerosis and high cholesterol and reduce the risk of suffering from CVD(Reference Yung, Leung and Wong15). In addition, the catechins in tea combine with bile acid (BA) to promote the continuous conversion of cholesterol, thereby achieving the purpose of lowering blood lipids(Reference Wang, Ge and Yang16). Similarly, there were a variety of ingredients in dark tea that could activate farnesoid X receptor, promote the synthesis of BA and reduce blood cholesterol levels(Reference Song, Huang and Liu17). Furthermore, the compound tea was able to improve the indicators of oxidative stress, inhibit the exessive uptake of glucose, decrease the content of HDL-cholesterol and increase the level of insulin; besides that, it also functioned as an important role in anti-obesity, anti-inflammatory and anti-oxidant(Reference Song18).
Metabonomic, as a high-throughput, high-sensitive and high-resolution technique, is usually used to analyse the whole composition of endogenous metabolites in cells, tissues and other biological samples. This approach has been widely used in medicine, toxicology, food nutrition science and areas closely related to human diseases, especially in the research of drug treatment of hyperlipidaemia animal models(Reference Barroso, Adriane and Lycia19). In our study, Duyun compound green tea (DCGT), a famous traditional Chinese medicine formula that was capable of treating hyperlipidaemia and anti-obesity, consisting of five Chinese herbs: Duyun ancient tea plant, Duyun broad-leaf Kuding(Reference Wu, Yang and Liu20), Duyun original tree sweet tea(Reference Zhou, Huang and Liu21,Reference Wang, Hou and Zhou22) , lotus leaf(Reference Ding, Pu and Kan23,Reference Du, You and Zhao24) , wild mint and honeysuckle(Reference Yoon-Seok, Se-Kwang and Jong-Kyu25,Reference Zhu, Zeng and Li26) , some of which have been reported with the abilities to regulate blood lipid balance and lipid metabolism disorders. However, the lipid-lowering mechanism of DCGT is still not well clear. Therefore, metabolomics approach and conventional serum physiological analysis were applied to inspect biochemical characteristics and differences of BA metabolites in the liver tissues of mice collected from different treatment groups. The aim of this study is to investigate the lipid-lowering mechanism of DCGT and provide some reference for its development and utilisation.
Material and methods
Preparation of Duyun compound green tea
DCGT was made from Duyun ancient tea (Camellia sinensis) plant (green tea), Duyun broad-leaf Kuding (Ilex latifolia Thunb.), Duyun original tree sweet tea (Hydrangea strigosa Rehd.), lotus leaf (Nelumbo nucifera Gaertn.), wild mint (Mentha canadensis L.) and honeysuckle (Lonicera acuminata Wall.), all of which were purchased from Guizhou Bishu Technology Co., Ltd. The mixture of all the above crude herbs at the weight ratio of 2, 1, 1, 1, 1, 1 was extracted twice in boiling distilled water (1:10, w/v) for 30 min each time. The tea infusion was cooled at room temperature, then filtered with two layers of filtration fabric and finally obtained powder (yield: 30 %) by vacuum freeze-dried. Subsequently, the dry powder was collected and stored at −20°C for standby. The reagents including acetonitrile, ethanol and methanol were of analytical grade (Merck).
Animal experiment
The experiment method was operated according to that of Zhou et al. (Reference Zhou, Zhou and Wen27,Reference Zhou, Zhou and Wen28) . All animals and experimental procedures were strictly operated in accordance with the Guidelines for Animal Experiment of Qiannan Medical College for Nationalities (Duyun, China; Approval number: LSK 2021 No. 2128). Forty healthy male KM mice with a body weight of 22 ± 2 g (license No. SCXK (Xiang) 2019–0014) were provided by Tianqin Biotechnology Co., Ltd.. After a week of adaptive feeding, the mice were randomly divided into four groups: model control group (NK), positive control group (YK), normal control group (CK) and compound green tea treatment group (DH), with ten mice in each group. They were kept in an SPF-grade laboratory animal room with a controlled environment (22–25°C temperature, 45–60 % humidity, 12-hour light/dark cycle) and were allowed free access to diet and water. In CK group, the animals were fed with basic diet (bran 26·0 %, flour 20·0 %, soybean 20·0 %, corn 20·0 %, rice flour 10·0 %, fishmeal 2·0 % and bonemeal 2·0 %) and distilled water for 4 weeks. Meanwhile, mice in NK, YK and DH groups were treated with HFD (lard 10·0 %, egg yolk powder 5·0 %, cholesterol 1·5 %, bile salt 0·5 % and basic diet 83·0 %), and received distilled water, positive drug Xuezhikang (91 mg/kg), and DCGT extract (840 mg/kg), respectively.
Sample collection and preparation
At the end of experiment, mice were killed after fasting for 12 h. Immediately, blood was collected in heparinised tubes for analysis of serum TAG, TC, LDL-cholesterol and HDL-cholesterol by using commercial kits (Nanjing Jiancheng Bio-technology Co., Ltd) according to the manufacturer’s instructions. Subsequently, the harvested liver tissues were cleaned with sodium chloride. 50 mg of liver tissue was homogenised by 1000 μl of ice-cold methanol/water (70 %, v/v). Then, cold steel balls were added to the mixture and homogenised at 30 Hz for 3 min. After that, the mixture was whirled for 1 min, and then centrifuged at 12 000 g for 10 min at 4°C. The collected supernatant would be used for LC-MS/MS analysis.
HPLC conditions
The sample extracts were analysed using an LC-ESI-MS/MS system (UPLC, Shim-pack UFLC SHIMADZU CBM A system, https://www.shimadzu.com/; MS, QTRAP® 6500 + System, https://sciex.com/). The analytical conditions were as follows: the UPLC column, Waters ACQUITY UPLC HSS T3 C18 (1·8 µm, 2·1 mm × 100 mm); column temperature, 40°C; solvent system, water (0·04 % acetic acid): acetonitrile (0·04 % acetic acid); gradient program was shown in Table 1.
Ultra performance liquid chromatography tandem ion trap time-of-flight MS (UPLC/ESI-IT-TOF/MS) elution gradient
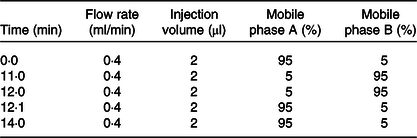
CK, normal control group; DH, compound green tea treatment group; NK, model control group; YK, positive control group.
Mass spectrometry was performed by a triple quadrupole-linear ion trap mass spectrometer (QTRAP), QTRAP® 6500 + LC-MS/MS System, operating in positive and negative ion mode and controlled by Analyst 1·6·3 software (Sciex). The ion spray voltage was set at 5500V (positive) and −4500V (negative), respectively. The ion source gas I was 55 psi, the gas II was 60 psi, the curtain gas was 25 psi and electrospray ionisation source temperature was 500°C.
Data processing and analysis
Qualitative analysis was carried out according to the retention time, ion pair information and secondary spectrum data based on the MWDB (MetWare Biological Science and Technology Company, Ltd.). The quantification of metabolites is accomplished by multiple reaction monitoring mode analysis using triple quadrupole mass spectrometry. All processed data sets were analysed and corrected by orthogonal partial least squares-discriminant analysis (OPLS-DA) model. The different variables were screened by removing irrelevant differences, and the R2X, R2Y and Q2 prediction parameters were used to evaluate the effectiveness of the model. Differentially expressed metabolites were screened by combining log2(fold change) ≥ 2 and log2(fold change) ≤ 0·5, as well as the variable importance in projection ≥ 1. Kyoto Encyclopedia of Genes and Genomes database was further used for functional annotation of differentially expressed metabolites to determine the metabolic pathways that were most highly associated with DCGT prevention of hyperlipidaemia. Data were expressed as the mean ± sd. Statistical significance between groups was subjected to one-way ANOVA followed by the Duncan’s test using IBM SPSS statistics 22 software (IBM). P < 0·05 was considered to be statistically significant.
Results
Duyun compound green tea regulated body weight and serum biochemical indexes in HLP mice
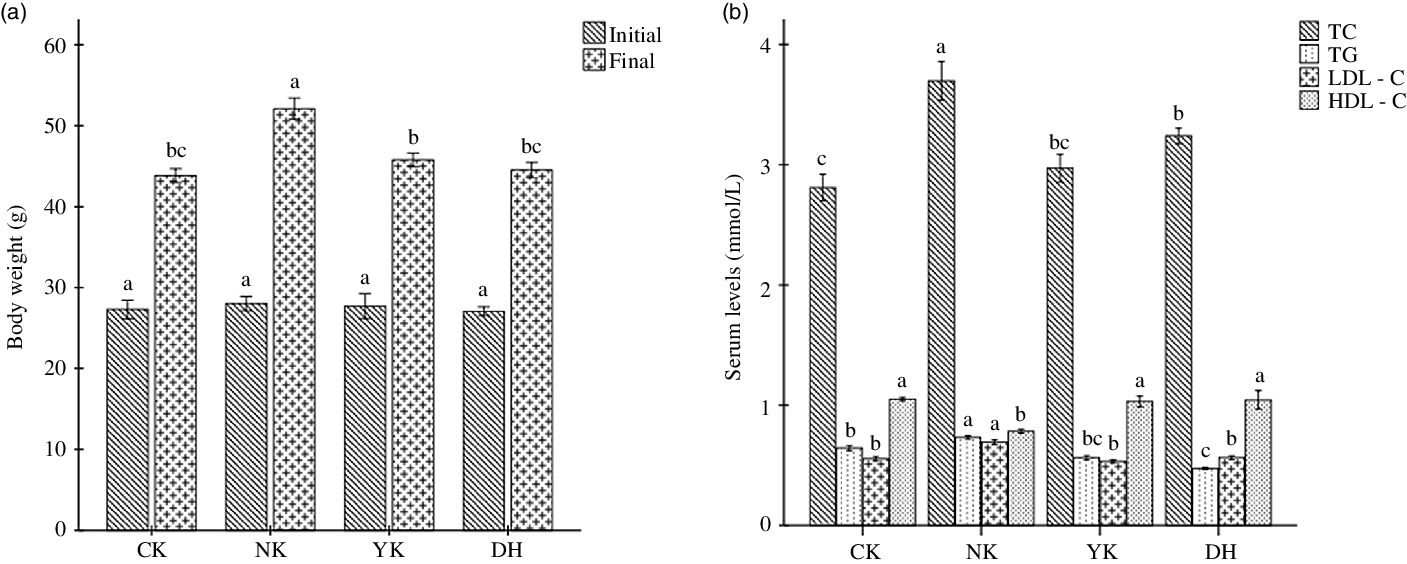
To explore the preventive effect of DCGT consumption on hyperlipidaemia induced by HFD in mice, male KM mice were given HFD and were treated with 840 mg/kg/d of DCGT extract as well as 91 mg/kg/d of positive drug Xuezhikang for four consecutive weeks. Compared with CK group, mice were fed HFD for 28 d in NK group resulted in a significant increase in weight gain (P < 0·05); while both DCGT and Xuezhikang treatments were able to markedly prevent body weight gain in mice (P < 0·05) (Fig. 1(a)). In addition, the levels of serum TC, TAG and LDL-cholesterol were remarkably higher after HFD induction compared with those of the mice fed with a basic diet in CK group (P < 0·05); as predicted, DCGT and Xuezhikang intervention had the ability to significantly inhibit.
Effects of DCGT intervention on (a) body weight and (b) serum biochemical indexes including TC, TAG, LDL-cholesterol and HDL-cholesterol levels in high-fat diet-induced hyperlipidaemia mice. All values present means ± sd for n 8, and one-way ANOVA followed by Duncan’s test was used to evaluate the statistical significance. The different lowercase letters represent significant differences among groups (P < 0·05). DCGT, Duyun compound green tea, TC, total cholesterol.
Qualitative and quantitative analysis of metabolites
The software Analyst 1.6.3 (https://sciex.com/products/software/analyst-software, AB Sciex) was used to process the mass spectrum data. Qualitative and quantitative analysis of the metabolites of the samples was performed based on the local metabolic database. The repeatability of metabolite extraction and detection could be judged by overlapping the total ion current diagram of different QC samples. Multiple reaction monitoring mode of metabolite detection showed the substances that could be detected in the sample and the chromatographic peaks of different colours represented the different metabolites detected. The total ion current diagram of the QC samples and multiple reaction monitoring mode of metabolite detection showed that the curve overlap of total ion current was higher, and the retain time as well as peak intensity were consistent, indicating that the signal was relatively stable when the same sample was performed by mass spectrometry at different periods (online Supplementary Fig. S1).
Principal component analysis (PCA) of metabolites
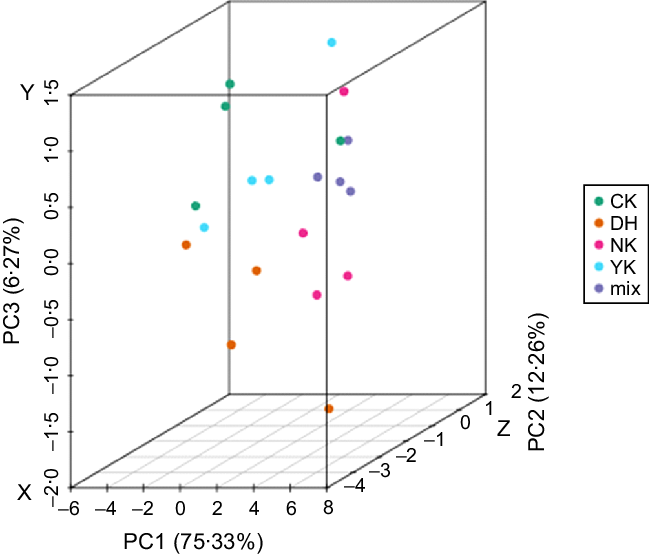
PCA was performed on samples (including quality control samples) to comprehend the overall metabolic differences between samples and variation within the group(Reference Chen, Zhang and Song29). PCA results showed that the quality control (QC) samples and different treatments were significantly separated, with 75·33 %, 12·26 % and 6·27 % variation explained by the three (PC1, PC2 and PC3) principal components, respectively, indicating that the hyperlipidaemia model was successfully established (Fig. 2). Simultaneously, an obvious result showed that the samples from NK and DH group could be remarkably separated, suggesting that DCGT treatment had a significant effect on the metabolism of mice-induced HFD. In addition, the separation trend of CK, DH, and YK groups was not significantly obvious, and they could not be completely gathered together to form an independent area, which suggested that there might be similar metabolites between these three treatments. While these three groups were partially separated from NK group, indicating that there were some differences in metabolites between NK group v. CK group, DH group v. YK group.
Principal component analysis (PCA) score plots in mass spectrum data from the four groups and QC samples. The X, Y and Z axes represent the first principal component (PC1), the second principal component (PC2) and the third principal component (PC3), respectively.
Orthogonal Partial Least Squares-Discriminant Analysis
Orthogonal partial least squares-discriminant analysis (OPLS-DA) is a multivariate statistical analysis method with supervised pattern recognition, which extracts the components in the independent variable X and the dependent variable Y, respectively, and then calculates the correlation between the components. Compared with PCA, OPLS-DA can maximise the distinction between groups, which is conducive to finding different metabolites. The data were subjected to 200 random permutation and combination experiments by this model. In general, the model is the best when P < 0·05. In addition, the S-plot variable importance in projection value of OPLS-DA was used to represent the correlation coefficient between principal components and metabolites.
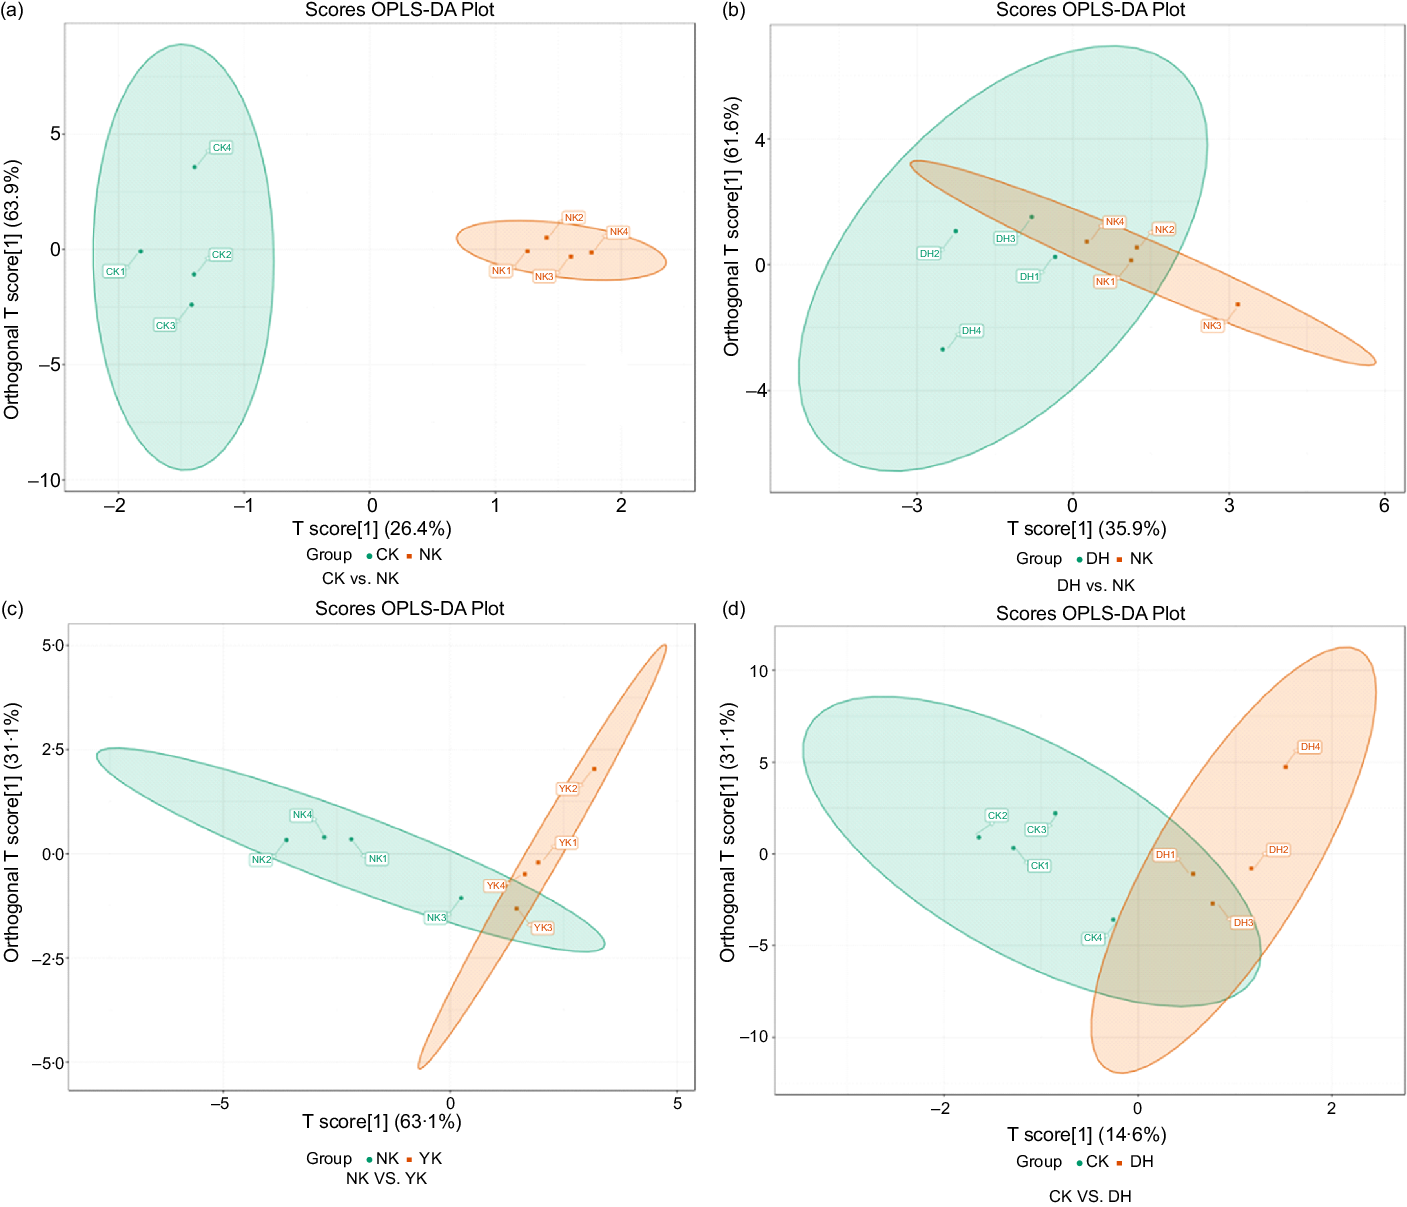
Firstly, to explore the effect of HFD on liver metabolism in mice, we compared the changes in metabolites between CK and NK groups with OPLS-DA plot. Obviously, OPLS-DA plot revealed that a trend of separation was observed in the comparison of CK group and NK group, indicating that significant changes in metabolites were induced by HFD (Fig. 3(a)). In addition, the samples of these two groups were significantly separated in the S-plot, and their metabolites were more concentrated near the upper right corner, and one metabolite was distributed in the lower left corner, which suggested that there were significant differences between these two groups (online Supplementary Fig. S2a). Then, comparison of samples between NK group and DH group showed that they could form partial separation, which might be related to individual differences (Fig. 3(b)). The S-plot diagram indicated that there was a marked difference in metabolites (online Supplementary Fig. S2b). These findings illustrated the treatment of DCGT caused abnormal metabolites in mice on a high-fat diet (HFD), which could be inferred that the hypolipidaemic effect of tea extract on mice was to change its related metabolites. Furthermore, a similar situation was also found in NK group v. YK group, manifesting that the positive drug Xuezhikang had the same lipid-lowering effect as DCGT (Fig. 3(c), online Supplementary Fig. S2c). What’s more, the samples from CK group v. DH group were partly clustered together, and the S-plot chart showed that there was only one differential metabolite in the upper right corner, indicating that the differential metabolite between these two groups was not significant (Fig. 3(d), online Supplementary Fig. S2d).
Orthogonal partial least squares - discriminant analysis (OPLS-DA) score plots of data from (a) CK group v. NK group, (b) NK group v. DH group, (c) NK group v. YK group and (d) CK group v. DH group. The abscissa of OPLS-DA represents the accuracy of the model, and the ordinate is the frequency of model classification effect. CK, normal control group; DH, compound green tea treatment group; NK, model control group; YK, positive control group.
Screening and statistical analysis of differential metabolites
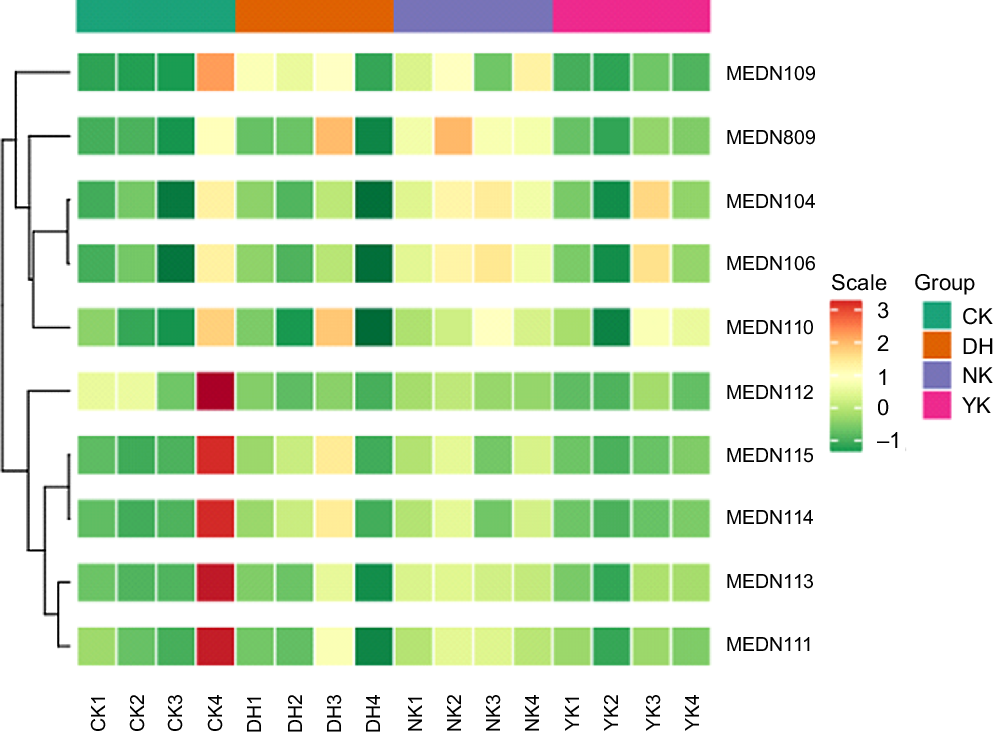
Hierarchical cluster analysis was used to evaluate the characteristic differences in the accumulation of BA metabolites in the liver of mice induced by HFD as a result of DCGT treatment, including homogeneity within the same category and heterogeneity between categories. A total of ten metabolites were obtained in four treatments, as shown in the heatmap visualisation of hierarchical cluster analysis, which exhibited the apparent hierarchical clustering among groups (Fig. 4). The metabolites with fold change ≥ 2 or ≤ 0·5 and variable importance in projection ≥ 1 were selected as significantly different metabolites. Subsequently, the UPLC-MS/MS detection platform, Metware database and multivariate statistical analysis were combined to detect these all ten BA metabolites (Table 2). Compared with the CK group, the contents of taurochenodeoxycholic acid (TCDCA) and sodium taurodeoxycholic acid in the NK group were up-regulated, while the glycocholic acid (GCA) content of DH and YK groups were both down-regulated. There were three different metabolites in the CK and YK groups: hyodeoxycholic acid, deoxycholic acid and chenodeoxycholic acid (CDCA) were up-regulated. Compared with NK group, the levels of GCA, TCDCA and tauroursodeoxycholic acid in CK group were remarkably decreased; while GCA was significantly down-regulated in DH group and YK group. Compared with YK group, DCGT treatment was able to increase the contents of hyodeoxycholic acid, DCA and CDCA. These results revealed detailed changes in metabolites caused by HFD and associated with DCGT and positive drug treatments.
Hierarchical cluster analysis (HCA) of the metabolites from different group. Each metabolite content is standardised to accomplish linkage hierarchical clustering. Each example is visualised in a single column, and each metabolite is manifested by a single row. Red represents high abundance, while low relative metabolites are displayed in green.
Metabolites with significant changes were identified by LC-MS in mice liver induced by high-fat diet
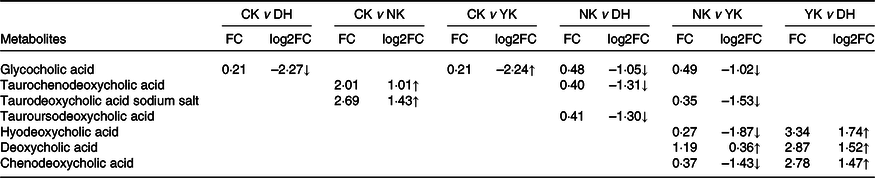
CK, normal control group; DH, compound green tea treatment group; NK, model control group; YK, positive control group; FC, fold change.
‘↑/↓’ represents up-regulation and down-regulation of metabolites between the pairwise comparison groups. The metabolites with fold change ≥ 2 or ≤ 0·5 and variable importance in projection ≥ 1 were selected as significantly different metabolites.
Enrichment analysis and functional annotation of differential metabolites
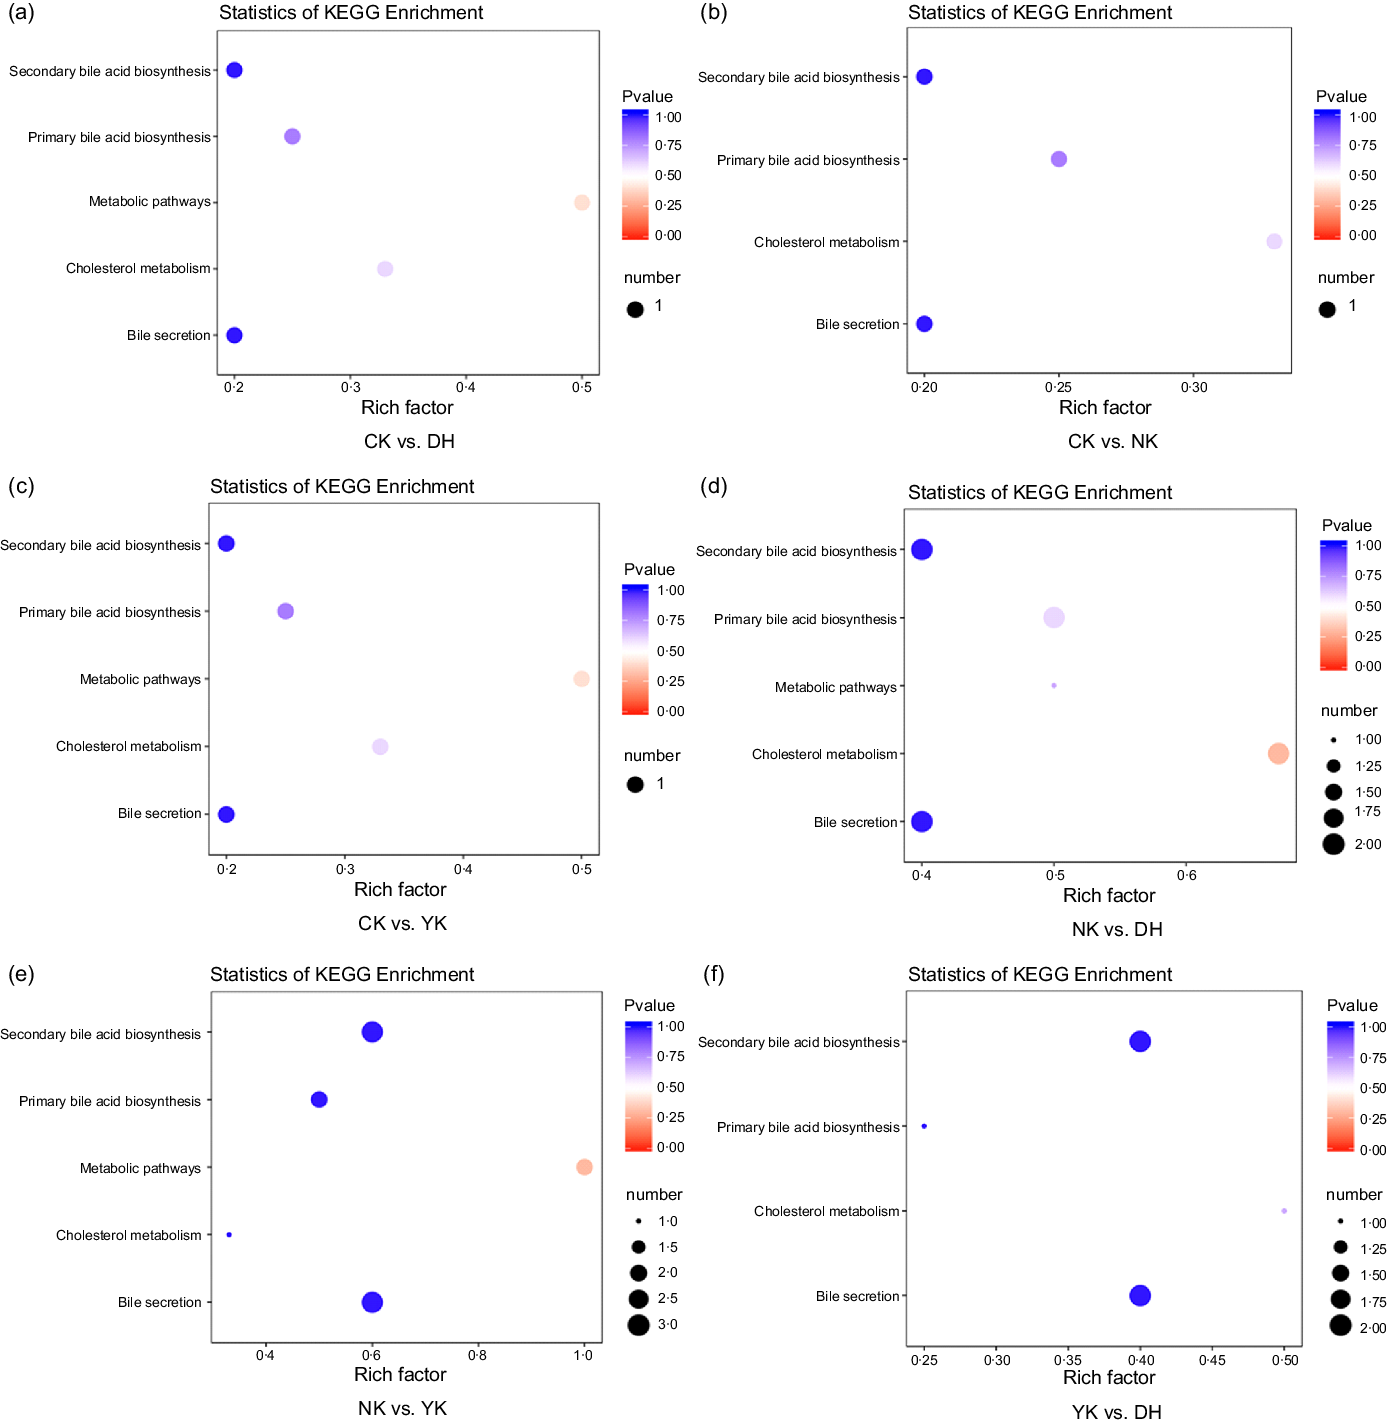
The differential metabolites were located in the corresponding metabolic pathways by pathway attribution analysis. According to the different substances and their interactions in the organism, we have annotated the Kyoto Encyclopedia of Genes and Genomes database, searched for different metabolic pathways and constructed metabolic profiles for BA metabolism. The enrichment analysis and functional annotation of Kyoto Encyclopedia of Genes and Genomes showed that there were different metabolites such as GCA, TCDCA and sodium taurodeoxycholic acid among the treatments, and changes in their content might be related to the cholesterol metabolic pathway (Fig. 5).
Kyoto Encyclopedia of Genes and Genomes enrichment pathway of differentially expressed metabolites in (a) CK group v. DH group, (b) CK group v. NK group, (c) CK group v. YK group, (d) NK group v. DH group, (e) NK group v. YK group and (f) YK group v. DH group. Rich factor represents the ratio of the number of differentially expressed metabolites in the corresponding pathway to the total number of metabolites detected and annotated in the pathway. The colour of the dots represents p-value, and the redder indicates the more significant the enrichment. The size of the dots represents the number of differentially expressed metabolites enriched. CK, normal control group; DH, compound green tea treatment group; NK, model control group; YK, positive control group.
Discussion
Pathways related to lipid metabolism include BA biosynthesis, fatty acid biosynthesis, glucose metabolism, lipid metabolism and saturated fatty acid oxidation(Reference Zhai, Wan and Huang30,Reference Cai, Zhao and Guan31) . The protein targets such as PLD2, PI3K (s) and PLA2G (s) of lipids in the metabolic profile were regulated, which could regulate the levels of cholesterol esters, diglycerides, phosphatidylethanolamine, phosphatidylcholine and sphingomyelin, reverse the trend of abnormal lipid changes in hyperlipidaemia mice and improve the levels of TC, TG, HDL-cholesterol and LDL-cholesterol in serum and liver. In the present study, DCGT treatment was known to significantly inhibit body weight gain and ameliorate the serum lipid profile, remarkably reducing TC, TG and LDL-cholesterol as well as increasing HDL-cholesterol (Fig. 1), thereby contributing to suppress the formation of atherosclerosis and hyperlipidaemia.
BA is the final product of cholesterol metabolism in the liver and the main way for the human body to remove cholesterol. Therefore, the synthesis, transport and excretion of BA are essential for maintaining cholesterol homeostasis. Previous studies have reported that cholic acid supplementation in the diet of atherosclerotic mice induced by HFD was able to decrease the level of plasma TG(Reference Kast, Nguyen and Sinal32). In addition, dyslipidaemia could also lead to the changes in BA. In the HFD mouse model, the expression of BA 7α-hydroxylase (CYP7A1) in the mice liver after HFD intervention remained unchanged, the concentration of total BA was inclined to decrease, but the concentration of blood-binding BA accumulated; while when the diet changed from HFD to a normal diet, the decreased expression of CYP7A1 was observed, and BA components were reversed to a great extent(Reference La, Hernandez-Carretero and Weber33). The above findings suggested that BA was an important endogenous metabolic molecule involved in lipid metabolism. Ilex kudingcha is widely used as a famous medicinal plant for the treatment of hyperlipidaemia(Reference Chen, Xie and Dai34,Reference Shi, Jin and Xiang35) . Compound tea prepared with green tea and Kuding tea as the main ingredients was capable of inhibiting fatty acid synthase activity and increasing the excretion of BA, thereby regulating the glucose and lipid metabolism disorder caused by HFD in mice(Reference Zhang, Gu and Wang36). As one of the liver indicators, GCA continued to increase when the function of liver intake and excretion were subjected to obstruct(Reference Liu37). In this study, the intervention of compound tea prepared from green tea and Kuding tea (DCGT) to evaluate its effect on dyslipidaemia and liver BA metabolism disorder in hyperlipidaemia mice induced by HFD, a commonly used modeling method to perform related experiments to investigate lipid metabolism disorders and accurately reflect the clinical symptoms of hyperlipidaemia. PCA and OPLS-DA model analysis found that DCGT was responsible for the effects of liver metabolism in mice with HFD-induced obesity and played a crucial role in reducing fat and losing weight in this work. The up-regulated contents of TCDCA and sodium taurodeoxycholic acid from NK group were observed, while GCA, TCDCA and tauroursodeoxycholic acid were significantly down-regulated after DCGT treatment. Furthermore, we also found that DCGT and positive drug Xuezhikang treatment were capable of reducing the content of GCA (Table 2). This might be attributed to its combination with the functional components of tea and circulation through the liver and intestines, which was conducive to the digestion and absorption of lipids. In the meantime, it could also continuously decompose cholesterol, thereby reducing the level of cholesterol in the body.
Numerous studies have shown that BA not only functions as energy source in the body, but also participates in glucose and lipid metabolism, energy metabolism and inflammation regulation in enterohepatic circulatory system and peripheral organs as an important signaling molecules in the regulation of metabolic reactions by activating different signal transduction pathways(Reference Mitsuhiro, Houten and Mataki38). Previously, TCDCA has been reported to stimulate the cortisol secretion, extracellular signal regulated kinase phosphorylation and the expression of genes related to steroid production in human adrenal cortex H295R cells(Reference Liu, Panzitt and Racedo39). Cholesterol in the liver is decomposed into CDCA, 3α, 7α- dihydroxy-5β-choleglycan-24-oleic acid. CDCA forms glycol-CDCA and tauro-CDCA with glycine or taurine, which are stored in the gallbladder and then released into the intestine for further metabolism to produce ursodeoxycholic acid or dehydrogenation to produce lithocholic acid; thus, fat is formed into micelles to assist digestion and absorption of lipid(Reference Stefano and Eleonora40). Similar study also demonstrated that the reabsorption of ursodeoxycholic acid, CDCA, DCA in the treatment group and the level of TC decreased, as well as the uncoupling of taurine conjugated BA (tauroyl-DCA, tauroyl-CA and 3-keto-tauroyl-CA) and the excretion of BA increased(Reference Genangeli, Heijens and Rustichelli41). Our results showed that DCGT and positive drug treatment prevented lipid disorders and metabolic abnormality caused by HFD, which may inhibit the expression of CYP7A1 protein and effectively combine GCA and TCDCA with BA(Reference Delgado, Krämer and Scharnagl42–Reference Yamasaki, Minesaki and Iwakiri44). Clinically, statins such as atorvastatin are commonly used for the treatment of hyperlipidaemia, but they have relatively large side effects and result in damage to liver and other organs. At present, we have not found any adverse effects of DCGT on hyperlipidaemia mice. Consequently, it may be developed as a potentially safe and effective formula for the treatment of hyperlipidaemia and diseases associated with lipid metabolism disorders.
Conclusion
To sum up, conventional serum biochemistry analysis approach and widely targeted metabolome technology of UPLC-MS/MS detection platform were applied in this study to evaluate the differences in liver metabolism of mice treated with DCGT. From the perspective of omics, the metabolic reaction of blood lipids in the liver of mice was comprehensively analysed, which provided an important theoretical basis for understanding the function of tea and reducing lipids and body weight.
Acknowledgements
This work was supported by Project of Guizhou Province Education Department, grant number qianjiaohe KY Zi [2020]070, qianjiaohe gaofa [2015]337, qianjiaohe KY Zi [2020]193, Qianxueweihe ZDXK[2016]23 and qianjiaohe KY Zi [2019]001; The Department of Health of Guizhou Province, grant number [gzwkj2012–2–017]; Qiannan Normal University for Nationalities project, grant number QNSYKYPT2018004, QNYSKYTD2018004 and qnsy2018001; Guizhou science and Technology Department Project, grant number qianjiaohe support [2019] No.2377.
Supervision and validation: X. M.; investigation and data analysis: C. W.; resources: Y. S.; writing of the original draft: Y. L.; software and formal analysis: R. M.; funding acquisition and project administration: C. Z.; writing–reviewing and editing: X. Z. All authors have read and agreed to the published version of the manuscript.
The authors declare that they have no conflict of interest.


