Introduction
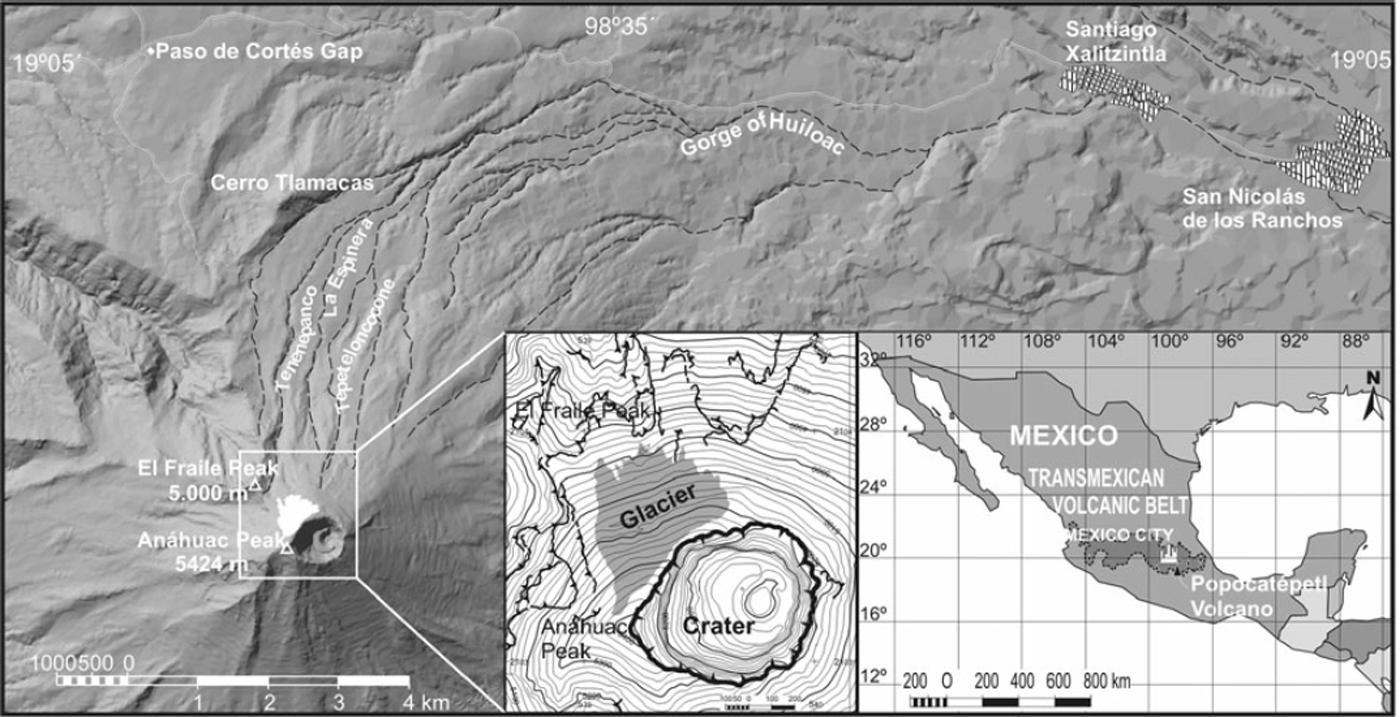
Popocatépetl is a large stratovolcano (5472 m) located in the centre of the Transmexican Volcanic Belt (198020 N, 988620 W), approximately 70 km southeast of Mexico City (Fig. 1).
Location of the Popocatépetl Glacier.

The volcanic morphology of Popocatépetl’s present cone dates from 1200–1100 yr BP (Reference RobinRobin, 1984) after the last plinian and effusive eruption (Reference MacíasMacías, 2005). In the 16th century, Spanish explorers reported the existence of a glacier (Reference RojasRojas, 1984) on the north face. Volcanic activity occurred from the mid 17th century to the early 18th century (Reference GuzmánGuzmán, 1968). Morainic deposits indicate that at maximum extension, the glacier reached an altitude of 4150m (Reference WhiteWhite, 1981). At the end of the 19th century, travellers noted that the glacier ice was directly pushing these moraines (Reference PalaciosPalacios, 1996). In 1906, the glacier terminus was located at 4250 m (from interpretation of photograph by Reference AndersonAnderson, 1917). Eruptive activity resumed in 1919 continuing until 1927 (Reference MurilloMurillo, 1939). A 1945 aerial photograph (World Data Center, USA), shows the terminus at 4650 m, but at the end of the 1950s the glacier terminus had moved 40m upslope (Reference LorenzoLorenzo, 1964). From 1968–78, the glacier advanced about 100m (Reference DelgadoDelgado, 1997). During the 1980s the glacier retreated: the glacial snout in 1983 was at 4630m and in 1989 at 4680m (according to aerial photographs from Mexico State). In February 1994, the terminus was situated at 4702m (Reference PalaciosPalacios, 1996; Reference Palacios, Zamorano and ParrillaPalacios and Marcos, 1998).
Since the beginning of the present eruptive period (21 December 1994), the glacier has thinned and continued to recede (Reference Palacios and MarcosPalacios and Marcos, 1998; Reference Palacios, Zamorano and ParrillaPalacios and others, 1998; Reference Palacios, Zamorano and GómezPalacios and others, 2001; Reference Huggel, Delgado, Hegg and MühllHuggel and Delgado, 2000; Julio and Delgado, 2003; Julio and others, 2005; Tanarro and others, 2005) (Fig. 2). Volcanic activity, which created and destroyed a dome inside the crater, was clearly the cause of glacial ablation (Valdés and others, 2003). Following the explosive phase of dome formation, pyroclasts and incandescent material partially covered the glacier. The water that was subsequently released mixed with sediments and moved through three proglacial gorges (Capra and others, 2004): Tenenepanco, La Espinera and Tepeteloncocone, and converged in Huiloac Gorge to form a single flow (Fig. 1). These lahars transported blocks measuring >2m in diameter and travelled to distances of up to 21 km before reaching the towns of Santiago Xalitzintla and San Nicolás de los Ranchos. The most powerful lahars formed in July 1997 and January 2001 (Reference Palacios and MarcosPalacios and others, 1998, Reference Palacios, Zamorano and Gómez2001; Capra and others, 2004).
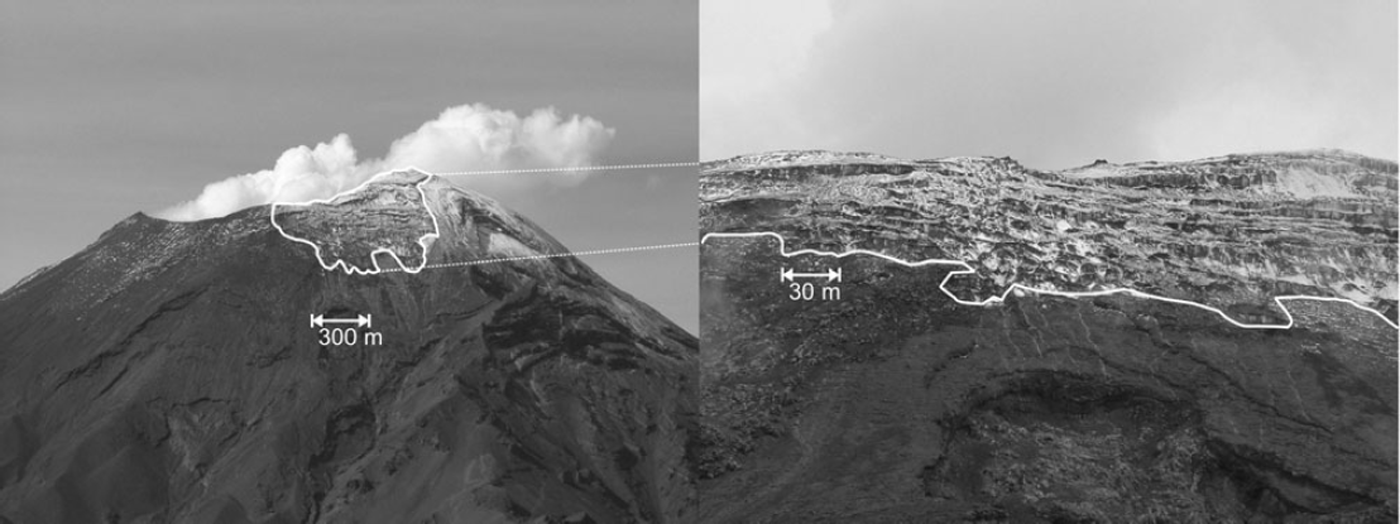
North face of the Popocatépetl volcano in July 2002: the glacier is still visible close to the crater.

Throughout the eruptive period, the occurrence of lahars posed a constant danger to settlements in the vicinity of the volcano, and populations were evacuated for short periods. At the time, no one was able to determine the magnitude of a possible lahar if the glacier ice were to suddenly melt, so decisions to evacuate were based solely on intuition. The research team, of which the authors of this article are members, conducted simulations of the 1997 and 2001 lahars on Popocatépetl, using models such as the LaharZ (Reference SchillingSchilling, 1998); Titan 2D (Reference Pitman, Nichita, Patra, Bauer, Sheridan and BursikPitman and others, 2003; Reference Sheridan, Stinton, Patra, Pitman, Bauer and NichitaSheridan and others, 2005) and Geoflow (Reference Pastor, Quecedo, Merodo, Herreros, González and MiraPastor and others, 2002; Reference Quecedo, Pastor, Herreros and MerodoQuecedo and others, 2004). The results from these models were used to simulate the area affected by the 1997 and 2001 lahars and determine other parameters such as speed and impact force (Reference Sheridan, Renschler, Mamikawua, Muñoz and PalaciosSheridan and others, 2004; Muñoz-Salinas, 2006). The use of this technique in predicting future large-scale events is conditioned by the degree of accuracy in determining the amount of water that may be released from the melting glacier.
There is a void in scientific literature regarding the recommended methods for determining the amount of water available during an eruptive period on a volcano covered by glaciers. For this reason it is important to develop and validate methods that should be accurate and reasonably affordable to civil defence agencies with limited budgets. Mexico’s CENAPRED (Centro Nacional de Prevención de Desastres – National Hazard Prevention Centre) commissioned the Secretariat of Communications and Transport (SCT) of the Mexican government to carry out monthly photogrammetric reconnaissance flights over Popocatépetl during its most active phases to monitor activity inside the crater. This was the only information available to us on the conditions of the glacier, since access to the volcano by land was prohibited.
The objective of this study is to apply a quick and inexpensive photogrammetric method to obtain information on the amount of glacial ice available on an active volcano during an eruptive stage. If the application of the method were to yield positive results, it would enable civil defence authorities to determine the magnitude of a lahar at any given time and to adopt the corresponding safety measures. In our study, we used aerial photographs of Popocatépetl from 1995 to 2002, which were commissioned by CENAPRED. Also included in this period are photos taken prior to the eruptive stage.
Other researchers have applied photogrammetric methods to Popocatépetl glacier using different types of instruments and techniques, but with the same objective (Reference Huggel, Delgado, Hegg and MühllHuggel and Delgado, 2000; Julio and Delgado, 2003; Julio and others, 2005; Reference Tanarro, Zamorano and PalaciosTanarro and others, 2005) and their results were also inconclusive. The present study seeks more useful results by increasing the range of dates for the analyses and enhancing imagery.
Methodology
The first difficulty we encountered in using photogrammetric techniques to determine the glacier ice mass was that we had no knowledge of the topography of the glacial bedrock or of the approximate thickness of the glacier during the pre-eruptive stage. Most of the INEGI’s (Instituto Nacional de Estadística, Geografía e Informática – National Institute for Statistics, Geography and Informatics) geodesic control points near the volcano had been lost or destroyed, and for most of the eruptive period, the Mexican army had blocked access to the upper cone even for scientific expeditions. Only occasionally were restrictions to other areas lifted, and during one of these periods we obtained permission to access the glacier where we recorded GPS points, measured the density and thickness of the ice and confirmed the boundaries of the glacier covered by ash.
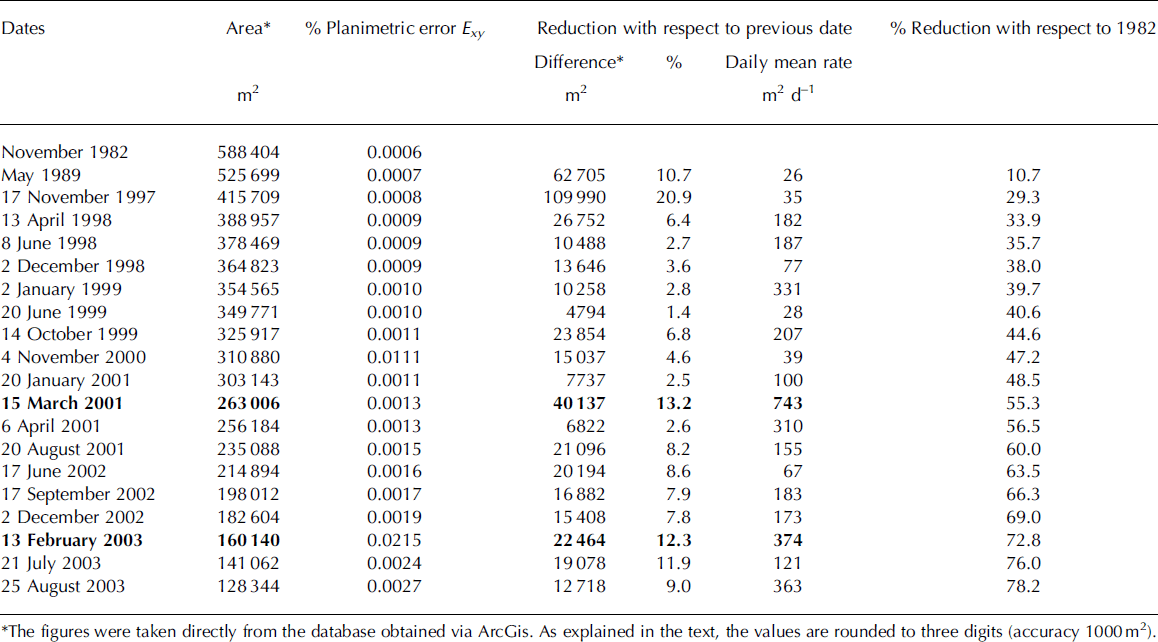
Twenty pairs of aerial photographs taken from November 1982 to August 2003, which included shots before and after the major volcanic events, were used for the photogrammetric work (Table 1). Traditional aerial photograph interpretation provided a method for delimiting the glacier although this was complicated by the fact that the surface was covered by a thick mantle of pyroclasts and the most recent glacier photographs displayed a ruiniform morphology similar to that of the surrounding rocky areas. These conditions made it necessary to conduct onsite observations and obtain oblique photographs of the escarpments and crevasses that were free of ash.
Evolution of the glacial area from November 1982 to August 2003

ArcGis-ArcInfo georeferencing tool was used to geometrically rectify the photographs and maps. Thirteen UTM control points were selected from existing topographic maps (INEGI, 2000), and several of these points had been GPS georeferenced based on geodesic markers from the Mexican National Network. During the georeferencing process, the control points marked on the photographs were matched to their corresponding UTM coordinates. The geometric transformation was accomplished using a third order polynomial function. Following geometric rectification, the area of the glaciers was calculated for each date.
Accurate DEMs had to be generated before calculating the variation in the volume of the glacier. Only 7 of the 20 pairs of aerial photographs were suitable for photogrammetric restitution, which has the following requirements: good clarity and contrast, similar groundcover, scale and flight altitude and complete technical data such as camera certification, fiducial marks and focal length, etc. The 7 dates selected were 17 November 1997; 2 December 1998; 20 June 1999; 2 November 2000; 15 March 2001; 17 June 2002 and 22 December 2002.
The photographs were scanned using Vexcel UltraScan 5000 (21 mm) and digitally rectified with Photopol software. The same 13 control points selected for the ArcGis geometric transformation were used.
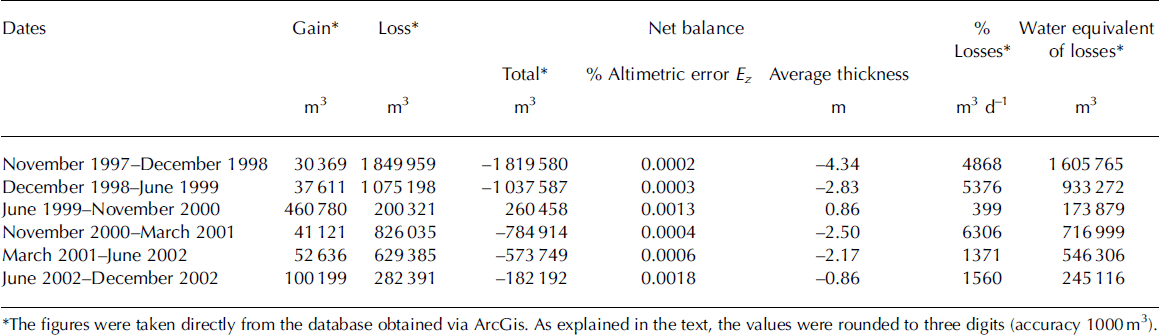
The DEM obtained by digital restitution (topographic cartography to 1:5000 scale, with 10 m equidistant contour lines) and the glacier boundary measurements were used to calculate the change in volume for each pair of dates. Two different software applications and methods were used to compare the results and detect possible errors. The first step was to calculate the differences between two layers of altitudinal data using AutoCad and three distinct methods: (1) altitudinal difference between two layers in grid format; (2) differences between two TIN grids and (3) differences between transversal profiles drawn along a defined axis on two compared DEMs.
In the second step we employed the Cut/Fill tool of ArcGis-ArcInfo to calculate the differences in volume between two layers in raster format. The final results were derived from the mean values of the estimates obtained from both procedures.
The volume of water released by glacier (water equivalent) was determined by multiplying the volume of ice lost by 868 kgm–3. This value is the average of the densities calculated for several samples obtained from the authors’ fieldwork.
Three types of errors were considered in the methodology: planimetric, altimetric and errors associated with the delineation of the glacier perimeter. Planimetric error Exy is the function of two independent errors: absolute orientation used in photogrammetric procedures E 1 (±2.5 m) and georeferencing error associated with the photographs and the glacier perimeter E 2, which in turn is a function of:
E 3, error in photo acquisition determined by the quality of the photo resolution. 7100 lines cm–1 is equivalent to 0.007 mm (0.035m terrain scale).
E 4, error in digitization. Photographs were scanned at 300 dpi (=118 points cm–1), which translates to 0.04 mm (0.2m terrain scale).
E 5, error in the geometric rectification of the photographs and the glacier perimeter. The average of the RMSEs processed using ArcGis is ±2.34 m. A minimum of 12 control points was consistently used to obtain proper adjustment.
Thus, the georeferencing error can be calculated as follows:

The total planimetric error is derived from:

The maximum estimated planimetric error is ±3.44m (Table 1).
The altimetric error Ez is interpreted as the maximum possible and takes into account the irregular terrain and the abrupt changes in scale for each photograph. Based on the work scale (1/5000) used in the study, the maximum error is Ez = ±3.3m (Table 2).
Evolution of the volume of the glacier from November 1997 to December 2002

The error associated with the delineation of the glacier perimeter was minimized in accordance with recommendations established by Reference Bolstad, Gessler and LillesandBolstad and others (1990). The perimeter was digitized at least 7 times for each date. The error between boundary differences never exceeded ±0.01% of the total glacier surface, so the accuracy in determining these measurements was considered adequate for the study.
Results
Glacial recession
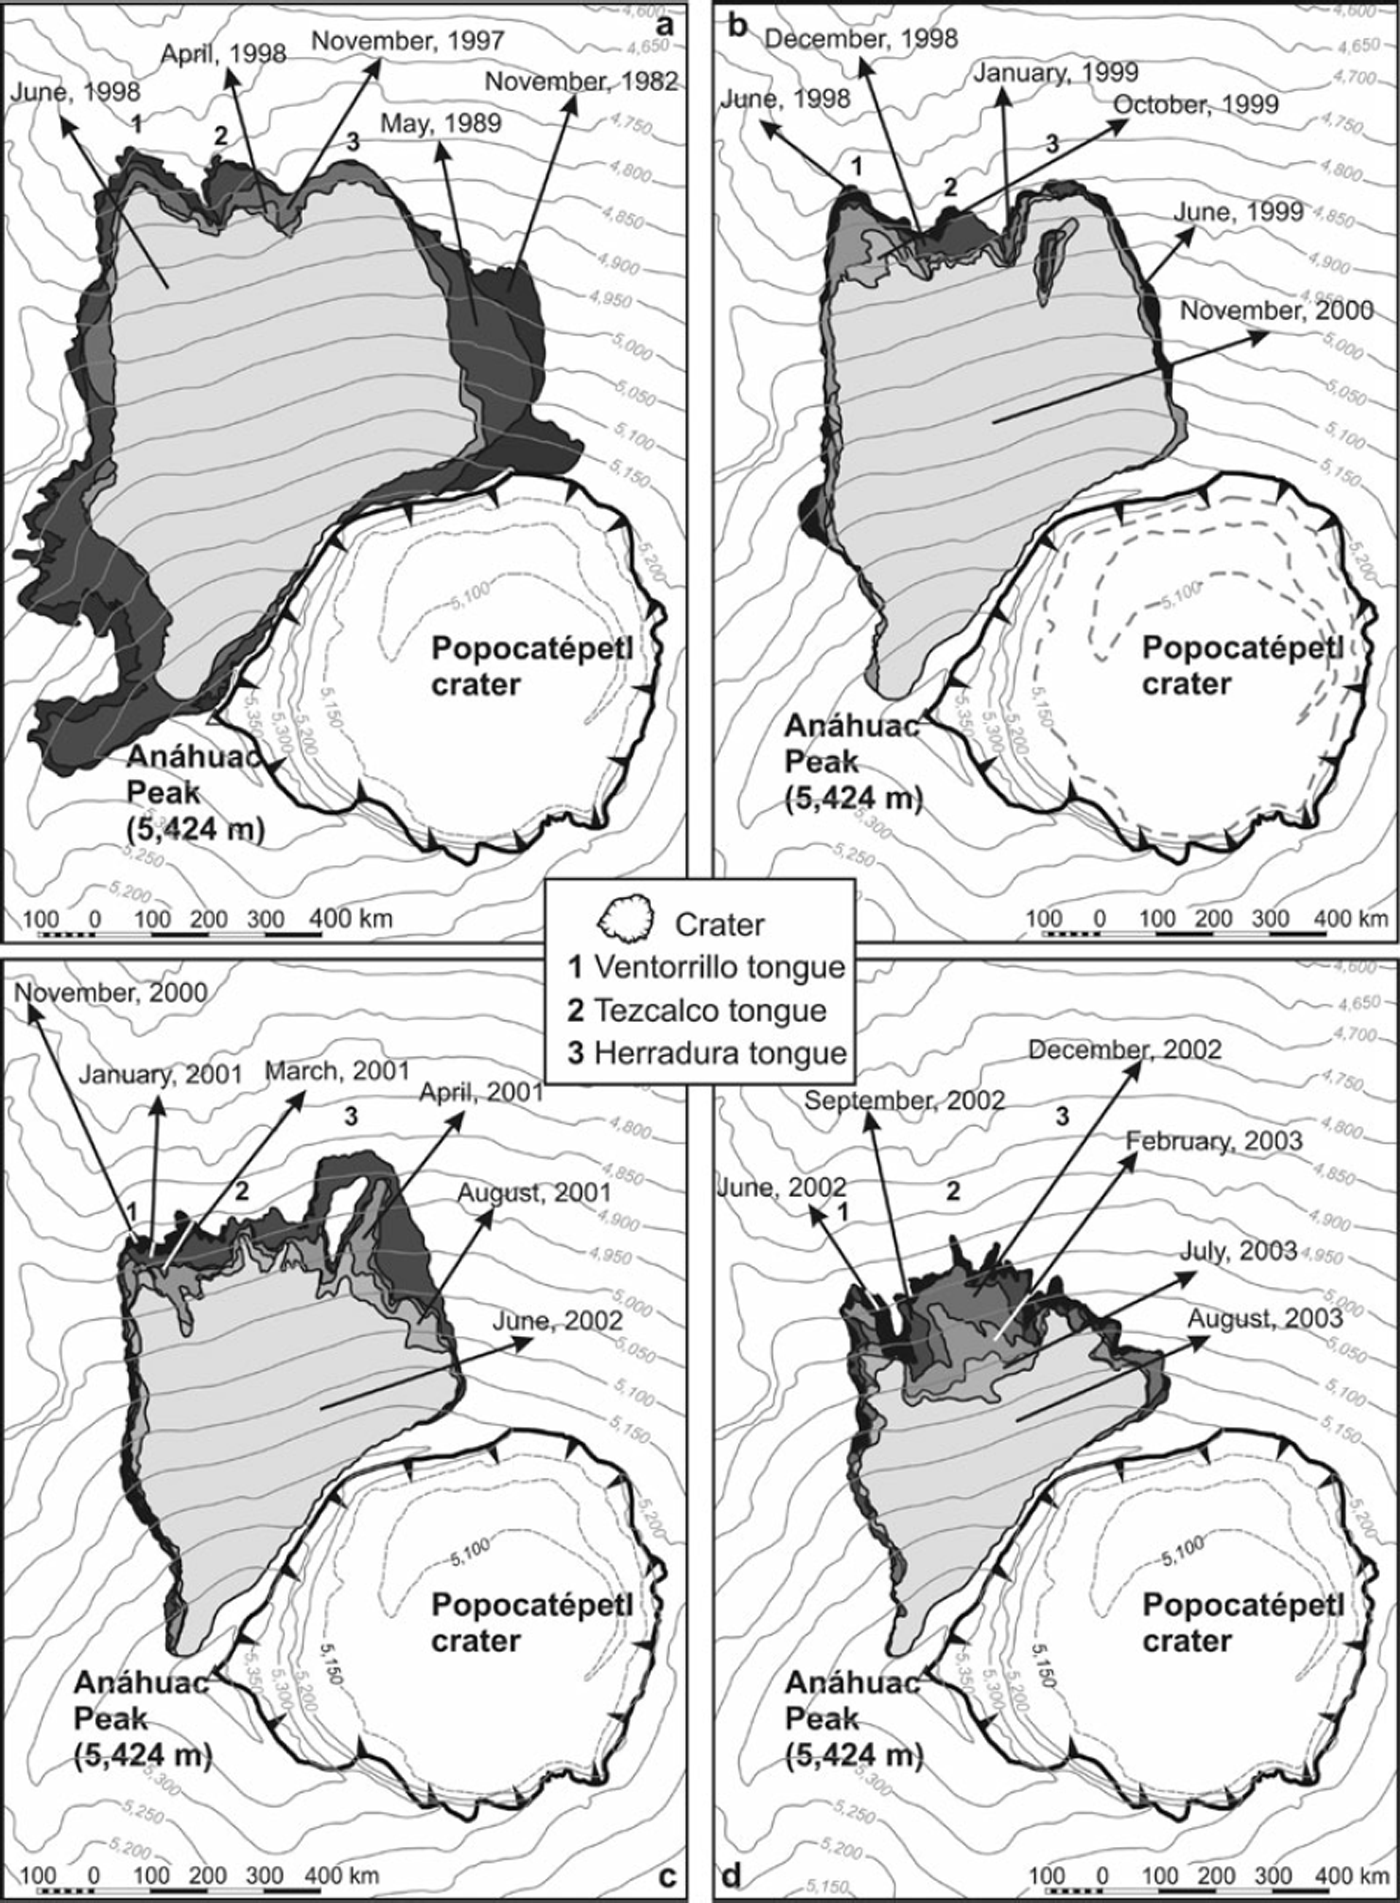
Once the area analysis of the 20 aerial photographs was completed, we quantified the decrease in glacial surface area (Table 1). According to the results, the area shrank from 588 000m2 in November 1982 to 128 000m2 by the end of August 2003, representing a loss of 78.2%. The most spectacular reduction occurred in less than 6 years from April 1998 (389 000m2) to August 2003, and produced a 66.7% decrease in surface area (Figure 3 and Table 1).
Evolution of the surface of Popocatépetl glacier during present eruptive period. The arrows indicate the date of the aerial photograph used in mapping the glacier perimeter (a) from November 1982 to June 1998; (b) from June 1998 to November 2000; (c) from November 2000 to June 2002; (d) from June 2002 to August 2003.

Variation in glacial volume
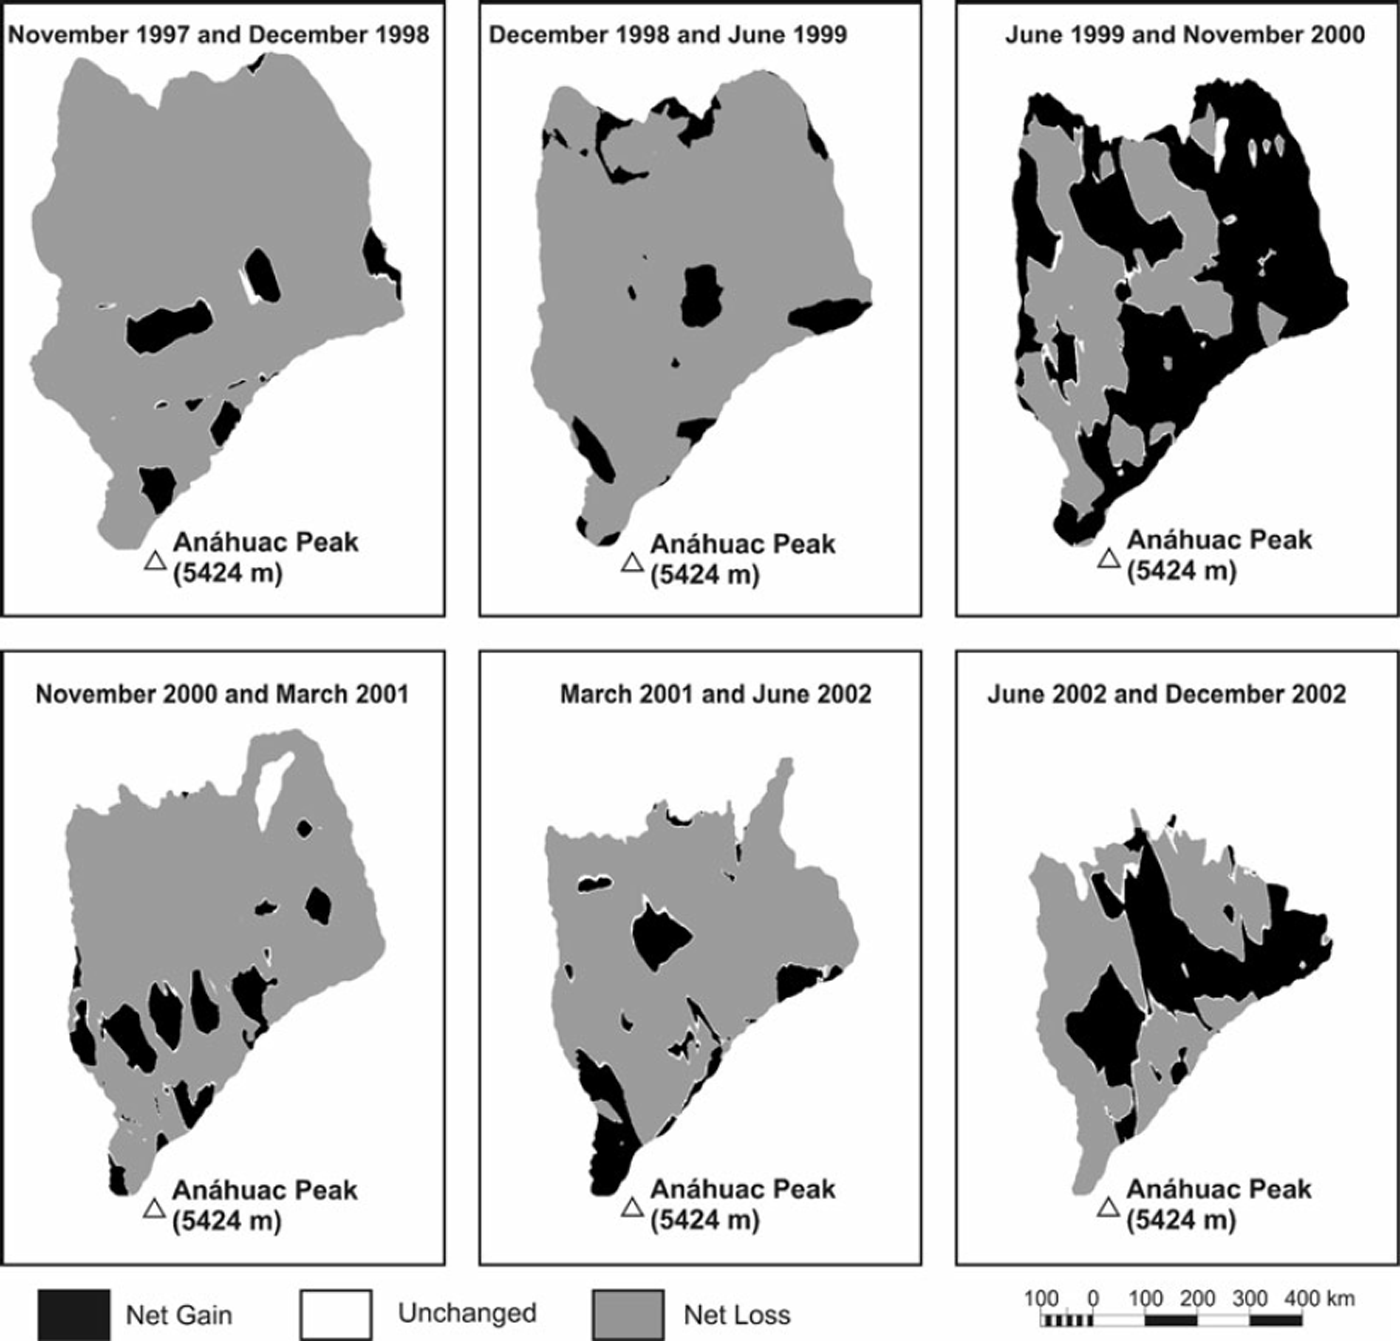
The difference between the November 1977 and December 2002 DEMs indicates that the glacier lost 4 570 000m3, equivalent to a thickness of 11.2m and gained 4000 m3 near the crater during isolated incidents. If we assume that all the losses were attributed to meltwater, then the equivalent volume in water would be 3 967 000m3. The comparisons between the 7 DEMs (Figure 4 and Table 2) provide a more detailed explanation of the changes in the glacier during this period. The greatest losses (1 850 000 m3) occurred from November 1997 to December 1998. During the 13 month period, the thickness of the glacier was reduced by an average of 4.34 m. The highest daily rate of loss (6000m3 d–1) coincides with the period from November 2000 to March 2001, during which time the thickness of the ice was reduced by an average of 2.50 m.
Evolution of the volume of the Popocatépetl glacier during present eruptive period.

The mass balance was positive from June 1999 to November 2000, and the thickness increased by an average of 0.86 m. The rate of loss was at its lowest during this period (400m3).
The sum of all the glacial mass lost for each of the periods studied totals 4 863 000m3 (4 211 000m3 liquid water). The difference in mass between this data and that derived from a comparison of the most recent (December 2002) and oldest (November 1998) DEMs was caused by large accumulations of pyroclasts that occurred throughout the period.
Impact of volcanic activity on glacial recession
Volcanic activity resumed in December 1994, although some small explosions took place on 25 February 1993. The glacier losses from November 1982 to May 1989 were therefore not due to volcanic activity, but to climatic causes as was true of other glaciers in Mexico (Lozano-García and Vázquez-Selem, 2005; Reference Lachniet and Vázquez-SelemLachniet and Vázquez-Selem, 2005). This tendency continued until the definitive start of volcanic activity in 1994 (Reference PalaciosPalacios, 1996; Reference Palacios and MarcosPalacios and Marcos, 1998).
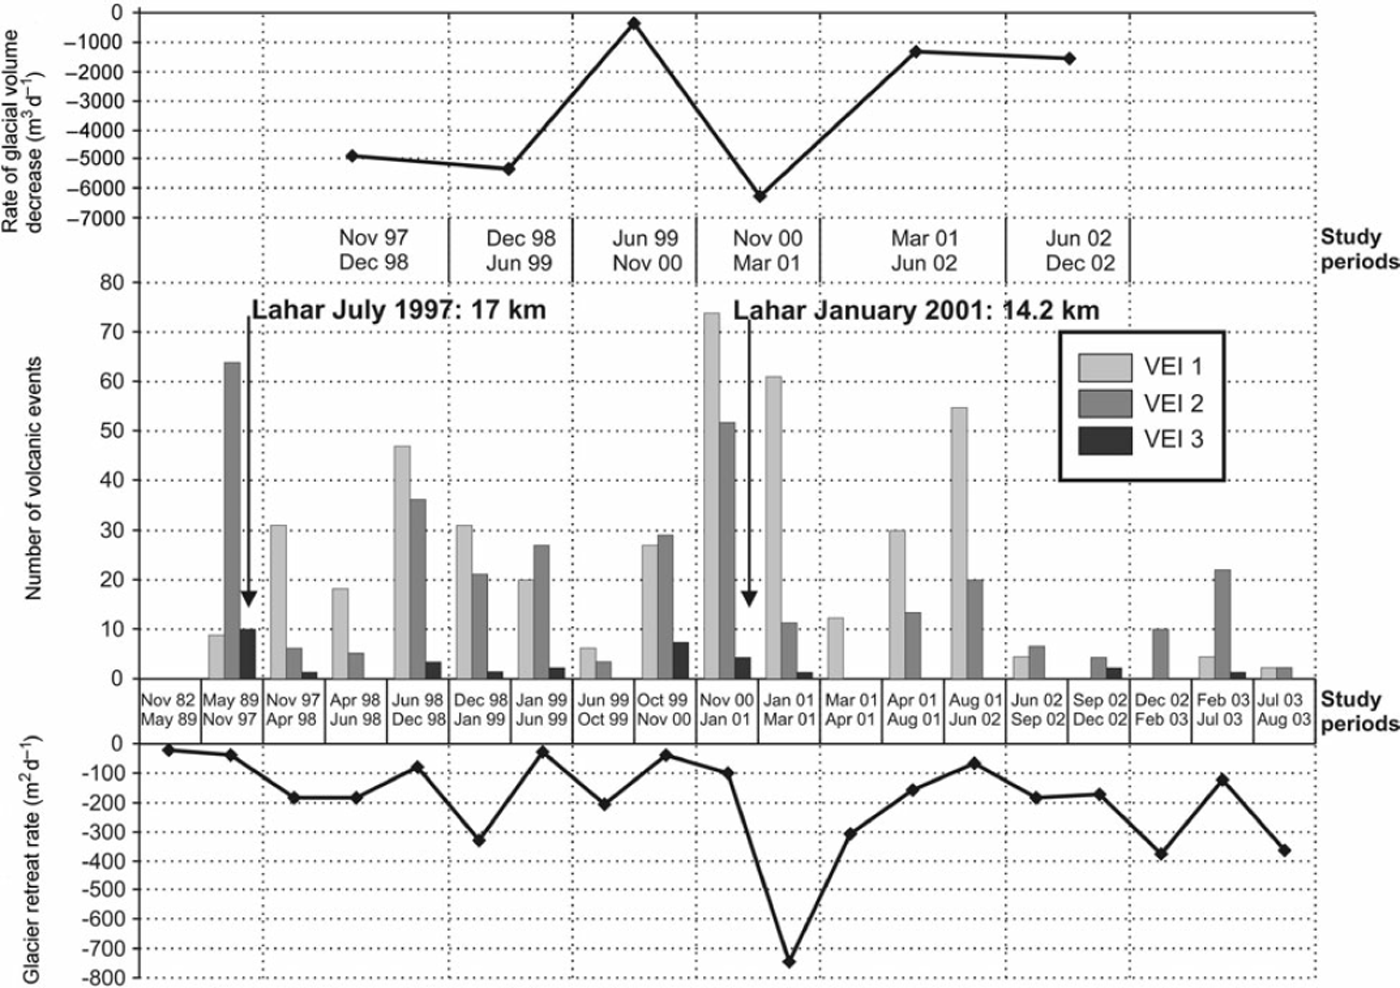
A comparison of the information on volcanic activity provided by CENAPRED (Valdés and others, 2003) and the results of our study reveal how this activity interfered with the evolution of the glacier (Fig. 5).
Relationship between volcanic activity and glacier evolution. VEI =Volcanic Explosivity Index, developed by Reference Newhall and SelfNewhall and Self (1982).

Unfortunately, restitution from a DEM was impossible for the period from the start of activity and to the formation of the largest recent lahar that occurred on Popocatépetl on 1 July 1997. This flow travelled 21km through the Huiloac Gorge and the authors, members of our lahar research team, estimated that 185 000 m3 of material were displaced (Muñoz-Salinas and others, in press). According to Reference Capra, Poblete and AlvaradoCapra and others (2004), the lahar behaved like a hyperconcentrated flow as it travelled over gradients of up to 6.58, but as the gradient increased to 118 it changed to a debris flow. On slopes steeper than 118, the lahar transformed to a hyperconcentrated flow. If hyperconcentrated flows are composed of 50% water and debris flows comprise 30% water (Reference Beverage and CuthbertsonBeverage and Cuthbertson, 1964; Reference Pierson and ScottPierson and Scott, 1985; Reference Pierson, Costa, Costa and WieczorekPierson and Costa, 1987; Reference Thouret, Lavigne and MontenatThouret and Lavigne, 2000), then the lahar would have displaced 150 000m3 of water (Reference Muñoz-SalinasMuñoz-Salinas, 2007). However, the area lost from May 1989 to November 1997, although substantial, is not significant if we consider the time elapsed and the influence of climatic tendencies. The diminished thickness of the ice for this period had to be significant, especially after the great explosion of 30 June 1997.
Volcanic activity from November 1997 to December 1998 (Tables 1 and 2) was characterized by the construction of a great dome in December 1997, and its ultimate destruction during the great explosions of January and March 1998. Several small lahars were detected at the time of these events. A period of calm began in June, but was interrupted by violent events that took place in November and December 1998. On 2 December, the glacial mass balance was negative in comparison to November 1997 (Table 2). The retreating glacier uncovered a large area particularly during the first half of the year. The northwest tongue disappeared (Fig. 3a) and the glacier thickness was reduced by 15 m. The tongue in the central sector receded and lost 20 m of thickness. By April of 1998, the glacier had radically transformed and rapid melting was occurring in the crevasses.
From 2 December 1998 and 20 June 1999 (Tables 1 and 2), volcanic activity consisted of great explosions in December accompanied by the formation of small lahars. Low intensity explosive activity occurred at the beginning of 1999, and by March and April, it had increased (Fig. 5). Small lahars formed in May and June. The 2 January 1999 photo reveals the destructive effects of the previous month’s activity. The rate of recession is the third highest found in this study, and the glacier appears to be completely covered by ash. The June 1999 DEM indicates a negative glacier mass with respect to December. The photo shows that the glacier has lost much of its covering of pyroclasts. The DEMs reveal a significant loss in thickness of >10m in the upper central sector of the glacier, near the crater. This was probably caused by abrasion from the December 1998 pyroclastic explosions.
Volcanic activity from 20 June 1999 and 4 November 2000 (Tables 1 and 2) was weak but continuous. The October 1999 photograph shows the extent to which the glacier had retreated. The crevasses are wide open and the body of the glacier is divided into steps that are almost all separated. The November 2000 photograph depicts the glacier having retreated only slightly more than in October of the previous year. The glacier is completely blanketed by pyroclasts. The DEM for this date indicates a positive balance with respect to June 1999 (Table 2). The continuous but weak volcanic activity produced a deep layer of pyroclasts that covered the glacier and protected it from melting. The largest accumulations of pyroclasts are found near the crater in the eastern half of the glacier. The increase in volume also occurred in areas where the glacier had disappeared. The average increase in glacier thickness was 0.86 m although the far western sector registered losses of nearly 11 m. Throughout the period, the only lahars detected were those associated with rains from tropical storms.
Activity from 4 November 2000 to 15 March 2001 (Tables 1 and 2) included the most intense and prolonged series of explosions that took place in December 2000, and were associated with the formation and destruction of a great dome. Following a few weeks of calm, on 22 January 2001 a major pyroclastic flow travelled over the glacier and triggered a large lahar that flowed 14.2 km through Huiloac Gorge (Fig. 5). The volume of deposition has been estimated at 160 000 m3 (Reference Muñoz-Salinas, Renschler and PalaciosMuñoz-Salinas and others, in press). According to Reference Capra, Poblete and AlvaradoCapra and others (2004), this lahar was characterized as a debris flow. If debris flows are composed of 30% water, the lahar would have displaced 68 000 m3 of water (Muñoz-Salinas, 2007). Although the amount of water transported was much less than that moved by the 1997 lahar, the glacial recession was enormous. We maintain that the reason for this was not the December 2000 explosion, but the pyroclastic flow that occurred on 22 January, as evidenced by the rate of area recession reflected in the 20 January 2001 photo. The loss in volume from November 2000 to March 2001 was also the most significant of all of the stages analyzed. The largest losses in thickness of up to 9m occurred in the central sector of the glacier. Near the crater, however, the balance was positive. The March 2001 photo clearly shows the abrasion furrows excavated by the pyroclastic flow in the central sector of the glacier.
From 15 March 2001 to 17 June 2002 (Tables 1 and 2), volcanic activity declined considerably. The period is also linked with the creation and destruction of domes, and small but frequent explosions. Thick layers of incandescent pyroclasts covered the glacier. Despite the absence of great explosions, both the area and volume of the glacier diminished to the extent that the central sector lost up to 8.28 m of thickness, and the western sector was reduced to a narrow ledge. The June 2001 photo shows a very decayed glacier. The crevasses had widened so much that some areas of ice were isolated.
From 17 June to 2 December 2002 (Tables 1 and 2), volcanic activity declined but the recession area and the loss of volume, although diminished proportionally, were still substantial. Although the glacier was reduced in thickness by 0.83 m, there are sectors in the lower central area that were reduced by as much as 9.79 m. The widening spaces between the separating steps altered the look of the glacier, transforming it into a tumble of blocks rather than a stream of ice.
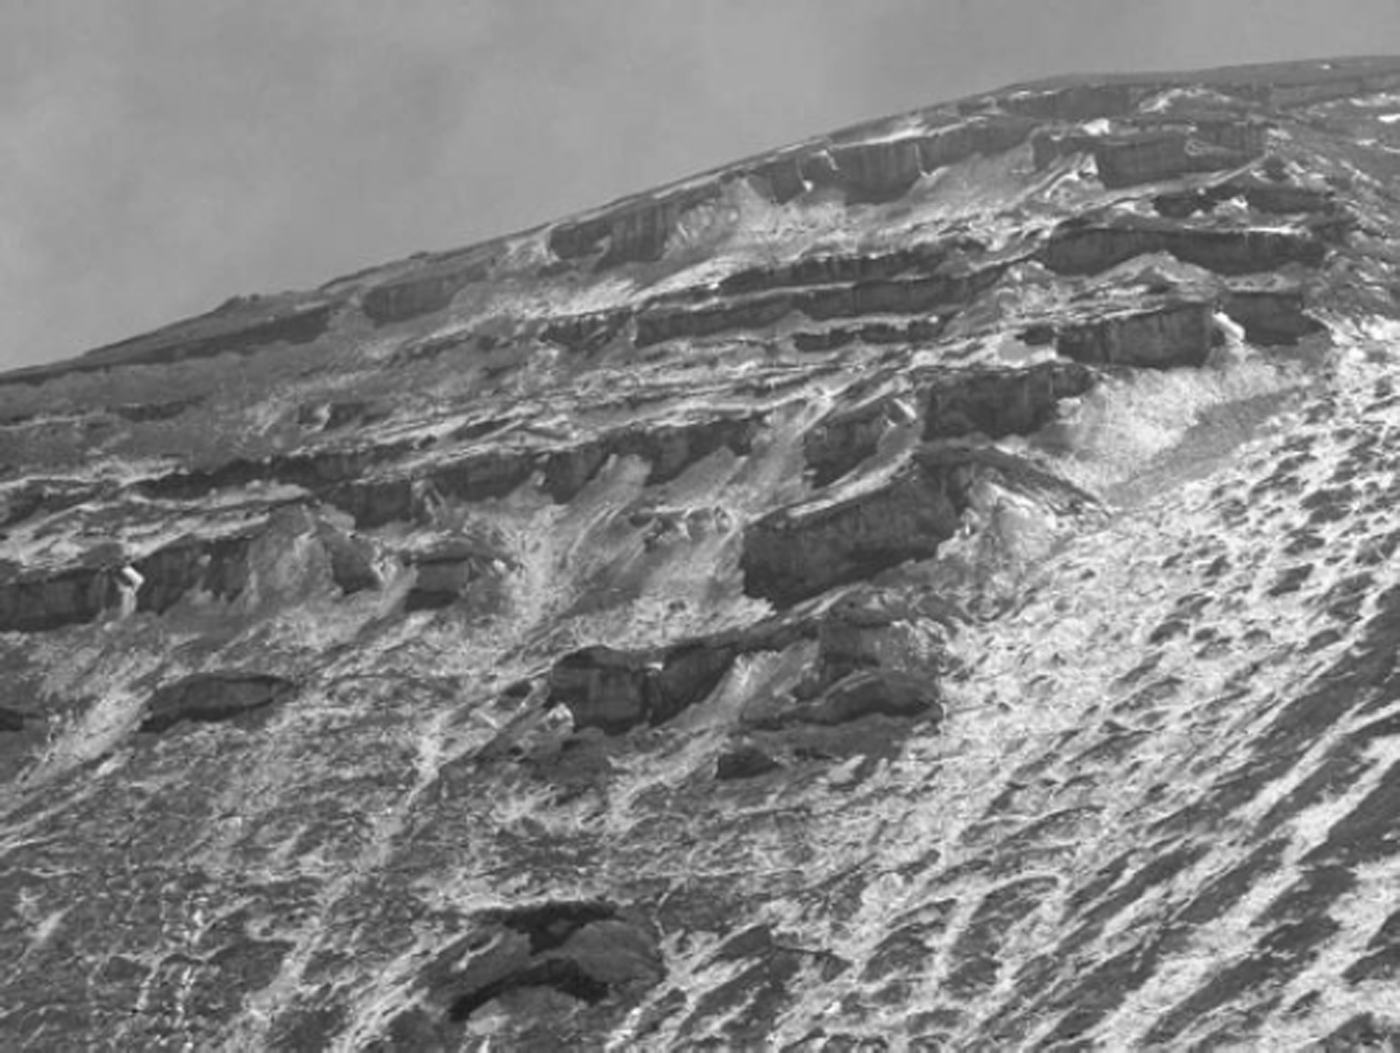
Eruptive activity renewed during December 2002 and February, April and July 2003. The 13 February 2003 photo shows more recession and abrasion furrows that erased the central sector of the glacier. In the 25 August 2003 photo the glacier has converted to a series of isolated ice steps located in the upper sector of what was once the pre-eruptive glacier. Since this period, there has been no significant volcanic activity and the glacier has remained practically stable until the present (Fig. 6).
Popocatépetl Glacier on 17 February 2006. The morphology shown in this photograph has remained stable since August 2003.

Discussion
Authors and experts on hazards in high mountain areas, such as Reference KääbKääb (2000) and Reference KääbKääb and others (2005), agree that DEMs provide essential information for quantifying natural hazards and mapping sensitive areas for emergency response plans. In environments that are inaccessible or dangerous, DEMs are the only source of information. In our study, DEMs enabled us to determine changes in glacier volume during a period of time, although they did not distinguish between types of material (ice or pyroclasts) or indicate the actual amount of ice volume lost in instances when some of the ice volume was later recovered. Due to these restrictions, we were unable to accurately calculate the volume of glacial meltwater. Furthermore, the quality of the photographs and the difficulties in delimiting the boundaries of the glacier through photo-interpretation may have produced serious errors in the data. As a result, our findings differed from those of other authors.
Julio and Delgado (2003) used photogrammetric techniques to determine the glacial area for 16 December 2000, and calculated the planimetric area to be 209 138m2. In contrast, our study yielded higher areas: 311 000m2 for 4 November 2000 and 303 000 m2 for 20 January 2001. These calculations were for a larger area of the glacier (48.6– 44.9% more than the area used by Julio and Delgado). The discrepancy in the results is probably due to very different methods of photo-interpretation. For example, the 16 December 2000 photo shows the glacier and the entire north slope of Popocatépetl covered by a thick layer of pryroclasts that had fallen a few days before the photo was taken (Valdés and others, 2003). Such widespread deposition makes it very difficult to delimit the boundaries of the glacier. The above authors recorded the real area to be 255 310m2 for 16 December 2000 using 358 mean slope, while our measurements yielded 383 000 m2 for November 2000 which represents 50.1% more surface. Our mean slope according to ArcInfo was 36.068.
Julio and others (2005) calculated the volume of water released for the formation of the largest lahar to occur on Popocatépetl during the most recent eruptive period (22 January 2001), by comparing the area and the volume of the glacier from 20 January 2001 to 21 February 2001. According to these authors, the area of the glacier was 280 357m2 on the first day of the period and 252 262 m2 on the last, for a total glacial mass loss of 1 109 800 m3. The article does not clarify if these are planimetric or real areas. If they are planimetric areas, then the results are similar to ours. Calculations for our study for 20 January 2001 are only 8% higher. We chose 15 March 2001 rather than 21 February 2002 for the second date, and the value for surface area was somewhat greater (4.2%). If the authors refer to the real area, our results for 15 March would be 29.9% higher than their areas for 21 February. In terms of volume, we calculated a loss of 826 000 m3 for the period 4 November 2000 to March 2001, which is 284 000 m3 less than the other study’s results for the period 20 January to 21 February 2001. The disparity in the findings is difficult to explain, even after taking into account differences in scanning resolutions and software.
Reference Tanarro, Zamorano and PalaciosTanarro and others (2005) used photogrammetric techniques and traditional photo-interpretation of photographs that had been geometrically rectified with CAD MicroStation (Descartes model) to calculate the glacier surface for only 10 dates. Even though the dates of most of the photos were different from those of the 20 pairs used in this study, there is little discrepancy between our results and theirs. In fact, although our data shows 4800 m2 more glacial area for November 1982 and June 1999 and 3300 m2 less for April 1998, the results differ by only ±38m2 for the other dates. From these results, it would appear that using different software (MicroStation and ArcGis-ArcInfo) did not create discrepancies in the area calculations.
It is impossible to calculate the total volume of the glacier at any given time without prior knowledge of the topography of the glacial bedrock. Julio and Delgado (2003) estimate that the average thickness of the glacier in December 2000 was 15 m. If we were to use this data to calculate the volume of the glacier in November 2000 and increase or decrease it depending on the average thicknesses obtained by GIS for earlier and later dates, the results would not coincide with the balances obtained through DEMs. At various times throughout the study we took field measurements at several locations on the glacier to determine its average thickness, but despite our careful sampling, the step-like of the bedrock and ruiniform morphology of the glacier were real obstacles to obtaining accurate results.
Conclusions
It is essential to know how much water is released by the glacier to quantify inputs for lahar flow simulation models. Volcanic activity makes it very difficult to obtain data for this parameter, however, because access to areas for onsite measurements is impossible. To avoid this problem, our study of Popocatépetl used Digital Terrain Models based on aerial photographs and detailed topographic maps and accurately tracked the evolution of the glacier using control points. These useful tools enabled us to minimize calculation errors in our methodology by using precision DEMs, precise geometric rectifications and powerful software (AutoCad and ArcGis). Despite this, errors are inevitable. Our estimates for changes in volume refer to the overall area contained within the glacier boundaries, and do not discriminate between snow, ice and pyroclasts. When converting the loss in volume to loss of water, a certain amount of volcanic material is mixed with the ice that is released on the slope and this contributes to an overestimation of water loss. In contrast, the values for the volume of melted ice may be underestimated, because pyroclasts accumulated during a given period may have replaced some of the ice. It is possible that these errors may compensate for each other.
Another problem is that the thickness and surface of the glacier does not change uniformly as the ice recedes. In fact, the greatest melting takes place in the crevasses and seracs. The glacier tends to separate into islets of ice as the crevasses widen. Occasionally, however, large amounts of pyroclasts will accumulate inside the crevasses thus compensating for the loss of ice until it is removed by ice melt or a pyroclastic flow. These processes are detectable through detailed photo and fieldwork interpretation but not through DEMs, and they are almost impossible to quantify.
Despite the errors, the results clearly show that variations in the volume of the glacier for each period are linked to the type of volcanic activity occurring at the time. Pyroclasts from moderate columns do not have an aggressive effect on the glacier and, in some cases, may protect it and produce an apparent increase in mass. In contrast, small exhalations are very aggressive, because the ejecta are still hot when they descend on the glacier. They also only partially cover the surface, which lowers albedo. Pyroclastic flows that cross the glacier are, by far, the volcanic mechanism most capable of abrading the glacier and triggering powerful lahars.
The most significant piece of data obtained was the volume of water released from November 1997 to December 2002: 3 967 000 m3. Although the period spans five years, the melting occurred in a short interval after important volcanic events such as the pyroclastic flow that took place on 22 January 2001. If events of this type had occurred consecutively and at short intervals, the amount of water released would have triggered enormous lahars. It is reasonable to assume that such circumstances would constitute an extreme situation and therefore could be considered a worst-case scenario in predicting a major laharic event. If there had been a good network of control points for geoferencing and prior knowledge of the topography of the glacial bedrock, it would have been possible to quickly and inexpensively determine the amount of water released for every pair of photos and dates. For future reference and for volcanoes in other locations, we recommend that this kind of information be obtained before eruptions occur.
Acknowledgements
The research was funded by a grant from the Spanish Ministry of Education and Science (REN 2003–06388). The authors thank the Instituto de Geografia, Universidad Nacional Autónoma de México, for financing the fieldwork and for its institutional support. Special thanks go to the Instituto’s grantees whose research assistance was fundamental to the study. The authors also thank G. Sánchez Bocanegro, engineer, and the Departamento de Fotogrametría, Dirección General de Carreteras, Secretaría de Comunicaciones y Transporte of Mexico for providing aerial photographs and CENAPRED for additional aerial photographs and valuable field information. The authors thank S. Schilling, C. Huggel, J. Walder, G. Clark and an anonymous referee for reviewing the manuscript and suggesting fundamental improvements. Finally, our appreciation is extended to A. Ferrero for the English translation of this text.