


Measurement of body composition in children is increasingly important in both research and clinical settings, since body composition early in life is a predictor of obesity and risk of cardiometabolic diseases later in life(Reference Ekelund, Ong and Linne1–Reference Ibanez, Ong and Dunger3). There are a number of different methods for measurement of body composition. The four-component method is considered the most accurate in infants(Reference Demerath and Fields4). However, it is not feasible in many settings, as it needs measurements of body mass using a scale, of body water using isotope dilution, of bone mineral mass using dual-energy X-ray absorptiometry and of total body volume with either air displacement plethysmography (ADP) or under-water weighing(Reference Demerath and Fields4). As a result, two-component methods, which only measure fat mass and fat-free mass, are easier to apply in most research and clinical settings, especially in young children. These methods include bioelectrical impedance analysis (BIA) and ADP.
BIA is based on measurement of the body’s resistance to a small electric current and together with measures of height and weight, can be used to estimate total body water, fat mass and fat-free mass(Reference Duren, Sherwood and Czerwinski5,Reference Wells and Fewtrell6) when an appropriate prediction equation is applied. This method is suitable for children as it is fast, non-invasive, painless and requires little cooperation from the child(Reference Schaefer, Georgi and Zieger7).
ADP is also fast and non-invasive and involves no radiation exposure(Reference Lee and Gallagher8). Body volume is measured indirectly by measuring the volume of air displaced inside an enclosed chamber(Reference Fields, Goran and McCrory9). The ADP technique is now widely used for measurement of body composition in infants using the PEA POD (COSMED USA, Inc.) which can measure body volume and body mass and derive fat mass in infants <6 months of age or <8 kg body weight(Reference Lee and Gallagher8). ADP is limited by lack of portability and the fact that some infants do not tolerate the measurement(Reference Ellis, Yao and Shypailo10).
In situations where BIA or ADP are not available, skinfold thickness measurements are the only practical alternative. This approach is based on the assumption that the subcutaneous fat is representative of whole-body fat mass(Reference Fosbol and Zerahn11). It is popular as it is an inexpensive, easy to perform, non-invasive method, which can be used in non-clinical community settings. However, high intra- and inter-observer variations have been reported(Reference Nagy, Vicente-Rodriguez and Manios12), and conversion of anthropometry and skinfold thickness data to fat mass relies on published equations. Each of these many equations has been standardised on a different reference population of different ethnic composition and age. As a result, not all equations are accurate for fat mass prediction in all populations. This may have important implications for research involving multi-ethnic study populations, including those found in New Zealand. Further, there are few equations published for children younger than 2 years. Our aim was to find out if anthropometric and skinfold thickness measurements can be used as to accurately predict fat mass compared with BIA or ADP in multi-ethnic cohorts of very young New Zealand children.
Methods
In this study, we used three different cohorts, in which anthropometry and skinfold measurements had been performed according to a common protocol based on the WHO’s Multicentre Growth Reference Study of infants and children(Reference de Onis13) and the standards of the International Society for the Advancement of Kinanthropometry(Reference Stewart, Marfell-Jones and Norton14). All assessors were trained by a single paediatrician (C. J. D. M.) with experience in body composition assessment and a nutritionist with International Society for the Advancement of Kinanthropometry level 2 accreditation. Skinfold thickness was measured twice at each site and the mean used for analysis. If the difference between the two measurements was >0·4 mm, a third measurement was recorded and the median used for analysis.
Ethnicity of the child was identified by the mother/caregiver and prioritised according to the New Zealand health sector protocol(15).
The first cohort comprised participants in the pre-hPOD (hypoglycaemia Prevention with Oral Dextrose) study which was a randomised trial of different doses of dextrose gel for preventing neonatal hypoglycaemia(Reference Hegarty, Harding and Gamble16). Participants were born at risk of hypoglycaemia (infants of diabetic mothers, small (birth weight < 10th centile on population or customised birth weight charts or <2·5 kg) or large (birth weight > 90th centile on population or customised birth weight charts or >4·5 kg) or late preterm (from 34 to 36 weeks’ gestation)). At 2 years’ corrected age, children underwent measurement of body composition with BIA and triceps and sub-scapular skinfold thickness by one of the four assessors. Bioimpedance was measured at 50 kHz with an ImpediMed Imp SFB7 device (MediMark Europe Sarl). Current electrodes were placed on the distal portion of the second metatarsal and metacarpal and sensing electrodes at the anterior ankle and posterior wrist. Fat mass and fat-free mass were calculated according to the manufacturer’s formula(17).
The second cohort comprised infants born to mothers who participated in the Healthy Mums and Babies (HUMBA) trial(Reference Okesene-Gafa, Li and Mckinlay18). Women with a singleton pregnancy and BMI of ≥30 kg/m2 were randomised to receive a dietary intervention or routine dietary advice, and either an oral probiotic or a placebo capsule from 12 to 17 weeks of pregnancy. At 5 months of age, infants underwent measurement of body composition by ADP and triceps, sub-scapular and supra-iliac skinfold thickness by one of the two assessors(Reference Okesene-Gafa, Li and Mckinlay18). Fat mass and fat-free mass were calculated by ADP according to the manufacturer’s instructions using reference data of Fomon et al. (Reference Fomon, Haschke and Ziegler19).
The third cohort comprised participants in the DIfferent Approaches to MOderate & late preterm Nutrition (DIAMOND) trial, in which preterm infants born between 32 and 35 weeks’ gestation were randomised to a combination of nutrition interventions in the first 24 h after birth(Reference Bloomfield, Harding and Meyer20). Infants underwent measurement of body composition at 4 months’ corrected age using ADP and triceps, sub-scapular, supra-iliac, abdominal, thigh and biceps skinfold thickness by one assessor.
Ethics approval was obtained from the Health and Disability Ethics Committees of New Zealand for all three cohorts (13/NTA/8, 14/STH/205 and 16/NTA/90). All procedures were in accordance with the ethical standards of these committees and with the 1964 Helsinki Declaration and its later amendments. Written informed consent was obtained from parents or legal guardians of all participants.
To identify equations to convert anthropometric data and skinfold measurements to measures of body composition, we used skinfold as a keyword to search Medline, Embase, Biosis, Scopus and Web of Science databases. The search located 102 equations validated using different standards in different age groups. However, only twenty equations were validated for children younger than 5 years of age, and only nine for children younger than 2 years.
For cohort 1, seven body composition equations validated for pre-pubescent children based on triceps and sub-scapular skinfold measurements were assessed, although only one of these was validated for an age range that included 2-year-old children(Reference Shaikh and Mahalanabis21) (Table 1).
Published equations potentially applicable to the three study cohorts

ADP, air displacement plethysmography; DEXA, dual-energy X-ray absorptiometry.
For cohort 2, three equations for children younger than 2 years of age and requiring only triceps, sub-scapular and supra-iliac skinfolds were assessed(Reference Aris, Soh and Tint22–Reference Lingwood, van Leeuwen and Carberry24). For cohort 3, all seven equations for infants younger than 1 year based on triceps, sub-scapular, supra-iliac, biceps, thigh and abdominal skinfolds were assessed, of which only one was validated against dual-energy X-ray absorptiometry for 4-month-old infants(Reference Schmelzle and Fusch25).
Analysis
We used Bland–Altman plots to compare agreement of skinfold body composition equations against the reference two-compartment method (BIA for cohort 1, ADP for cohorts 2 and 3). We also tabulated the proportion of children in the same tertile for fat or fat-free mass calculated by each equation and by the reference method. In order to determine if using tertiles of site-specific skinfold thickness rather than body composition equations would prove adequate for ranking children within the cohort for research purposes, we also calculated the proportion of participants in the same tertile for the reference method and (i) each skinfold site and (ii) sum of the skinfold thickness. Data are presented as the proportion of children in the same tertile for each skinfold or sum of skinfolds and fat mass, as assessed by the reference method.
Results
Data were available for 217 participants in cohort 1 at mean age of 24·1 (sd 0·9) months, seventy-nine participants in cohort 2 at mean age of 20·9 (sd 3·9) weeks and seventy-three participants in cohort 3 at mean age of 16·1 (sd 1·2) weeks. In all cohorts, boys were generally heavier and taller than girls, with larger head circumferences, and greater fat-free mass; there were few differences in skinfold thicknesses between the sexes. All cohorts were of mixed ethnicity, including Asian, Māori and Pacific as well as European children, although the proportion varied among cohorts (Table 2).
Characteristics of girls and boys in each of the three study cohorts*
(Mean values and standard deviations; medians and ranges; numbers and percentages)

N/A, not available for this cohort.
* P values are for comparison between girls and boys in the same cohort.
Bland–Altman plots were plotted for fat mass, fat-free mass and percentage fat derived from BIA as the reference method for cohort 1 and ADP as reference method for cohorts 2 and 3 (Figs. 1–3).
Bland–Altman plots comparing each equation with the standard (bioelectrical impedance analysis (BIA)) for cohort 1. (a) Shaikh & Mahalanabis(Reference Hegarty, Harding and Gamble16). Girls: mean difference (MD) 0·42 %; 95 % limits of agreement (LOA) –12·17 , 13·02 %. Boys: MD 1·06 %; 95 % LOA –11·57, 13·71 %. (b) Wendel et al. (Reference Lingwood, van Leeuwen and Carberry24). Girls: MD 14·61 %; 95 % LOA 1·44 , 27·79 %. Boys: MD 10·04 %; 95 % LOA –2·64, 22·73 %. (c) Ellis et al. (Reference Schmelzle and Fusch25); Ellis(Reference Deierlein, Thornton and Hull26). Girls: MD 3·10 kg; 95 % LOA 1·23 , 4·98 kg. Boys: MD 4·60 kg; 95 % LOA 2·17, 7·04 kg. (d) Goran et al. (Reference Sen, Bose and Shaikh27). Girls: MD –0·55 kg; 95 % LOA –2·47 , 1·36 kg. Boys: MD –0·68 kg; 95 % LOA –2·42, 1·05 kg. (e) Dezenberg et al. (Reference Weststrate and Deurenberg28). Girls: MD 0·49 kg; 95 % LOA –1·95, 2·93 kg. Boys: MD –0·04 kg; 95 % LOA –2·11, 2·01 kg. (f) Wickramasinghe et al. (Reference Wendel, Weber and Leonard29). Girls: MD 0·04 kg; 95 % LOA –2·32, 2·41 kg. Boys: MD –1·96 kg; 95 % LOA –4·07, 0·13 kg. (g) Slaughter et al. (Reference Ellis, Abrams and Wong30). Girls: MD 12· 42 kg; 95 % LOA 6·61, 18·22 kg. Boys: MD 11·59 kg; 95 % LOA 6·18, 17·00 kg.

Bland–Altman plots comparing each equation with the standard (PEA POD) for cohort 2. (a) Lingwood et al. (Reference Fomon, Haschke and Ziegler19) Girls: mean difference (MD) −0·25 kg; 95 % limits of agreement (LOA) −1·00 , 0·50 kg. Boys: MD −0·09 kg; 95 % LOA −0·87, 0·67 kg. (b) Catalano et al. (Reference Okesene-Gafa, Li and Mckinlay18) Girls: MD 0·94 kg; 95 % LOA 0·21, 1·67 kg. Boys: MD 0·94 kg; 95 % LOA 0·17, 1·71 kg. (c) Aris et al. (17). Girls: MD −0·14 kg; 95 % LOA −0·83, 0·53 kg. Boys: MD −0·36 kg; 95 % LOA −1·01, 0·47 kg.

Bland–Altman plots comparing each equation with the standard (PEA POD) for cohort 3. (a) Lingwood et al. (Reference Fomon, Haschke and Ziegler19) Girls: mean difference (MD) −0·09 kg; 95 % limits of agreement (LOA) −0·56 , 0·37 kg. Boys: MD −0·09 kg; 95 % LOA −0·68, 0·48 kg. (b) Catalano et al. (Reference Okesene-Gafa, Li and Mckinlay18). Girls: MD 0·74 kg; 95 % LOA 0·29, 1·20 kg. Boys: MD 0·85 kg; 95 % LOA 0·30, 1·41 kg. (c) Deierlein et al. (Reference Shaikh and Mahalanabis21). Girls: MD 3·06 kg; 95 % LOA 2·36, 3·76 kg. Boys: MD 3·12 kg; 95 % LOA 2·37, 3·87 kg. (d) Aris et al. (17). Girls: MD −0·13 kg; 95 % LOA −0·58, 0·31 kg. Boys: MD −0·17 kg; 95 % LOA −0·74, 0·38 kg. (e) Schmelzle & Fusch(Reference Bloomfield, Harding and Meyer20). Girls: MD 1·06 kg; 95 % LOA −0·24, 2·36 kg. Boys: MD 0·93 kg; 95 % LOA −0·58, 2·45 kg. (f) Sen et al. (Reference Aris, Soh and Tint22). Girls: MD −9·96 %; 95 % LOA −38·58, 18·65 %. Boys: MD 19·10 %; 95 % LOA −5·91, 44·13 %. (g) Weststrate & Deurenberg(Reference Catalano, Thomas and Avallone23). Girls: MD −24·35 %; 95 % LOA −37·46, −11·23 %. Boys: MD −26·78 %; 95 % LOA −49·22, −4·33 %.

In cohort 1, the equation by Wickramasinghe et al. (Reference Wickramasinghe, Lamabadusuriya and Cleghorn34) best predicted fat mass in girls, as there was no significant bias (mean difference 0·04 kg; 95 % CI −0·19, 0·27 kg; 95 % limits of agreement (LOA) −2·32, 2·41 kg) (Fig. 1). However, the most useful equation in boys was given by Dezenberg et al. (Reference Dezenberg, Nagy and Gower33) (mean difference −0·04 kg; 95 % CI −0·24, 0·14 kg; 95 % LOA −2·11, 2·01 kg). As this equation also predicted fat mass in girls with smaller mean difference (0·49 kg) than that by Wickramasinghe et al. (Reference Dezenberg, Nagy and Gower33) in boys (1·96 kg), it could be considered as the best single prediction equation for both sexes in this cohort. For the least useful equation(Reference Slaughter, Lohman and Boileau35), there was significant bias and wide LOA between calculated fat mass and fat mass measured by BIA in both sexes (12·42 kg; 95 % CI 11·85, 12·99 kg; 95 % LOA 6·61, 18·22 kg in girls and 11·59 kg; 95 % CI 11·07, 12·11 kg; 95 % LOA 6·18, 17·00 kg in boys).
In cohort 2, the equation by Lingwood et al. (Reference Lingwood, van Leeuwen and Carberry24) best predicted fat-free mass in both sexes as there was no significant mean difference between fat-free mass calculated by this method and by ADP, 95 % CI and 95 % LOA were narrow (mean difference −0·25 kg, 95 % CI −0·37, −0·12 kg, 95 % LOA −1·00, 0·50 kg in girls and mean difference −0·09 kg, 95 % CI −0·22, 0·02 kg, 95 % LOA −0·87, 0·67 kg in boys) (Fig. 2). The least useful equation in this cohort was that by Catalano et al. (Reference Catalano, Thomas and Avallone23) (mean difference 0·94 kg; 95 % CI 0·82, 1·06 kg; 95 % LOA 0·21, 1·67 kg in girls and mean difference 0·94 kg; 95 % CI 0·81, 1·06 kg; 95 % LOA 0·17, 1·71 kg in boys). The range of the 95 % LOA for this equation was the equivalent of the mean measured fat mass in girls (1·8 kg) and 85 % of the mean measured fat mass in boys.
In cohort 3, the equation by Lingwood et al. (Reference Lingwood, van Leeuwen and Carberry24) again best predicted fat-free mass in both sexes, since the mean difference between measured and calculated fat-free mass was small, and 95 % LOA were narrower than for other equations (mean difference −0·09 kg, 95 % CI −0·18, 0·00 kg, 95 % LOA −0·56, 0·37 kg in girls and mean difference −0·09 kg, 95 % CI −0·18, 0·00 kg, 95 % LOA −0·68, 0·48 kg in boys) (Fig. 3). For this cohort, the equation by Weststrate & Deurenberg(Reference Weststrate and Deurenberg28) was the least useful for prediction of percentage fat, since the mean difference was large and the 95 % LOA were wide (mean difference −24·35 %, 95 % CI −26·78, −21·92 %, 95 % LOA −37·46, −11·23 % in girls and mean difference −26·78 %, 95 % CI −30·15, −23·41 %, 95 % LOA −49·22, −4·33 % in boys).
The proportion of children in the same tertile of fat or fat-free mass calculated from each equation and measured with the reference method ranged from 30·1 to 52·2 % in cohort 1, 51·2 to 69·2 % in cohort 2, and 18·1 to 68·1 % in cohort 3 (Table 3).
Proportion of children in the same tertiles for fat mass (cohorts 1, 2 and 3) or fat-free mass (cohorts 2 and 3) measured with skinfold equations and the standard method for each cohort
(Percentages)

Using tertiles of absolute skinfold thickness or sum of skinfold thickness rather than equations yielded similar results (Table 4). For cohort 1, sub-scapular skinfold thickness had better agreement with fat mass measured by BIA in both sexes than triceps skinfold thickness (47·1 % of girls and 51·3 % of boys in the same tertile). For cohort 2, sub-scapular skinfold thickness also had better agreement with fat mass measured by ADP in girls, but triceps skinfold thickness had better agreement with fat mass in boys. For cohort 3, the best agreement with fat mass was for sub-scapular skinfold thickness in girls and sum of the skinfolds in boys (Table 4).
Proportion of children in the same tertile for skinfold thicknesses and fat mass from the standard method for each cohort
(Percentages)
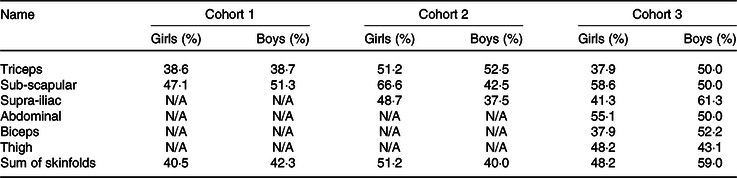
N/A, not available.
Discussion
Although there is considerable interest in measurement of body composition in young children, many of the available methods cannot be used outside research settings. Measurement of skinfold thickness and estimation of whole-body fat using published equations are frequently used as an alternative approach, as it is inexpensive and portable. However, we found that none of the available published skinfold thickness equations provided estimates of body composition that sufficiently agreed with two-compartment reference methods to be acceptable for research purposes in three multi-ethnic cohorts of very young New Zealand children.
In these three cohorts, the relevant published equations predicted body composition variably. Some overestimated, while some underestimated the measured fat or fat-free mass, although only a few showed bias at higher or lower fat or fat-free mass. However, even the best equation for each cohort was not sufficiently accurate for research or clinical purposes. Although the mean difference between calculated and measured fat or fat-free mass was small, the 95 % LOA were wide: approximately twice the mean measured fat mass of children in cohort 1, and 25 % of the mean measured fat-free mass in cohorts 2 and 3. Other studies in Spanish adolescents(Reference Rodriguez, Moreno and Blay36) and in school age Indian children(Reference Kehoe, Krishnaveni and Lubree37) have also reported wide LOA when comparing published skinfold thickness equations with percentage fat mass measured by dual-energy X-ray absorptiometry, suggesting that this problem is not confined to very young children or the specific ethnicities of our cohorts. Rather, the wide LOA are likely to limit the utility of skinfold thickness measurements in detecting anything other than very large differences in whole-body fat mass between groups in research settings.
Three equations(Reference Aris, Soh and Tint22–Reference Lingwood, van Leeuwen and Carberry24) were assessed for both cohorts 2 and 3 against the same standard method but performed differently in the two cohorts. For example, the mean difference in fat mass from the standard method for the equation by Lingwood et al. (Reference Lingwood, van Leeuwen and Carberry24) in girls was smaller for cohort 2 than for cohort 3, and in both sexes, the 95 % LOA were wider for cohort 2 than cohort 3. Further, the equation by Aris et al. (Reference Aris, Soh and Tint22) underestimated the fat mass in both sexes for both cohorts but was biased only for cohort 3 and the 95 % LOA were larger for cohort 2 than cohort 3.
These differences may in part be the result of differences in ages of participants at the time of assessment and differences in ethnic composition. Cohort 3 children were slightly younger than cohort 2 (4 v. 5 months), and since all three equations were standardised on newborns, this may have contributed to the smaller mean differences between calculated and measured fat or fat-free mass seen for cohort 3.
Further, the populations in which these equations were derived were less ethnically diverse than our cohorts, which included Māori, Pacific Island and Asian children. Most published equations were developed in American populations comprising white, African American and Hispanic children, but there were few children of these ethnicities in our cohorts. Among New Zealand children, Māori and Pacific Island children are known to have different body compositions from European children, with lower body fat and higher lean mass for a given BMI, whereas Indian children have a higher fat mass(Reference Buksh, Hegarty and Griffith38,Reference Rush, Obolonkin and Battin39) . Pacific and Māori children also have more central subcutaneous and less appendicular fat than European children, that is, a higher sub-scapular:triceps skinfold ratio(Reference Rush, Scragg and Schaaf40). Thus, equations which are derived in different populations do not appear to be suitable for New Zealand populations.
Another possible reason for the lack of agreement between calculated and measured fat or fat-free mass may be related to the methods used to standardise the equations. Only one of the equations used for cohort 1 was referenced to BIA, as used in our study. However, even for this equation, the agreement between tertiles of calculated and measured fat mass was still poor (30·1 % of girls and 41·4 % of boys assigned to same tertile). Similarly, among the available equations for cohorts 2 and 3, the proportion of children in the same tertiles was higher for those referenced to ADP than for those not referenced to ADP but was still poor (51 to 69 %).
Further, the participants of all three cohorts could be considered ‘at risk’ children. Participants of cohort 1 were born at risk of hypoglycaemia (infants of diabetics, late preterm or low or high birth weight), and these groups have different body composition from infants not meeting these criteria. Small-for-gestational-age infants have been reported to have less fat mass than appropriate-for-gestational-age infants at 5 months’ corrected age(Reference Roggero, Giannì and Liotto41), and infants of diabetic mothers, irrespective of whether they were macrosomic, have greater fat mass compared with infants of non-diabetic mothers(Reference Catalano, Thomas and Huston-Presley42,Reference Ogata43) . Participants of cohort 2 were born of overweight mothers and may therefore have had greater fat mass and lesser fat-free mass than infants born to mothers with normal BMI(Reference Hull, Dinger and Knehans44). Participants of cohort 3 were born moderate- to late-preterm, a group that has also been reported to have greater fat mass than term infants once term-corrected age is reached(Reference Giannì, Roggero and Liotto45). Most published equations were validated in healthy term infants, and the characteristics of our cohorts may have contributed to the poor predictive value of the equations in this study. However, it is often at-risk children who are of most interest in studies of growth and body composition, and thus our findings are particularly relevant.
Although for most equations, sex is included as part of the calculation, not all the equations performed the same way in both sexes even within the same cohort. For equations in which sex is not included as an independent factor, these differences partly could be the result of differences in compressibility of skinfolds in different sexes, which can affect the inter-observer and intra-observer error(Reference McRae46) or differences in fat distribution between sexes(Reference He, Horlick and Thornton47,Reference Blouin, Boivin and Tchernof48) . In general, females tend to store fat in the gluteal–femoral region (gynoid fat distribution), while males accumulate fat in the abdominal region (android fat distribution)(Reference Blouin, Boivin and Tchernof48). Moreover, abdominal adipose tissue is accumulated less in the visceral area in women than in men(Reference He, Horlick and Thornton47). In a study of term and preterm Spanish infants, girls tended to store more sub-cutaneous fat centrally than boys(Reference Rodríguez, Samper and Ventura49), while in pre-pubescent American children, girls had greater extremity and gynoid fat deposits than boys(Reference He, Horlick and Thornton47). Consistent with the findings in the American cohort, we found in cohort 1 that mean triceps skinfold thickness, thought to reflect peripheral (extremities) fat depots(Reference de Andrade Goncalves, Nunes and Silva50), was larger in girls than boys. However, mean sub-scapular skinfolds, thought to reflect central fat depots(Reference Snijder, Van Dam and Visser51), was smaller in girls than boys in cohort 2, but larger in girls in cohort 3. Although these two cohorts were of similar age, they were of different ethnic composition, so it is possible that this apparent sex differences in subcutaneous fat distribution reflects at least in part the different body composition of different ethnicities(Reference Buksh, Hegarty and Griffith38,Reference Rush, Obolonkin and Battin39) .
Since the majority of fat mass is subcutaneous in children(Reference Duren, Sherwood and Czerwinski5), we also explored whether, even if published equations were not very predictive of measured body composition, we could use tertiles of absolute skinfold thicknesses to indicate relative adiposity within the cohort. Sub-scapular skinfolds, which are an indicator of central fat distribution(Reference Snijder, Van Dam and Visser51), had better agreement with fat mass tertiles in both sexes in cohort 1 and for girls in both cohorts 2 and 3. In boys in cohorts 2 and 3, triceps skinfold and sum of skinfolds had better agreement with fat mass tertiles. However, even the highest agreement, which was for sum of skinfolds in boys of cohort 3, was only 59·0 %, suggesting that this approach is also not likely to be useful in a research setting.
One of the strengths of our study was that we analysed the data for three different cohorts, assessed at different ages, and reflecting the multi-ethnic composition of New Zealand children. However, one of the weaknesses of the study was that the skinfolds were assessed at six different sites only in the third cohort. As a result, we were not able to assess all the available equations for the relevant age groups. Furthermore, the inter-observer reliability of skinfold thickness measurement has been reported to be 48–99 % for different sites(Reference Ulijaszek and Kerr52). In our study, skinfold thickness was measured by four assessors in the first cohort and two assessors in the second cohort, which may have contributed to inter-observer error in measurement and hence to the limited agreement between measurements. However, even in cohort 3, in which all skinfold thicknesses were measured by a single assessor, neither the equations nor the absolute skinfolds showed more than moderate agreement with measurement of fat mass using ADP. Another possible weakness of our study is the use of BIA as the reference method for cohort 1. Although there is limited evidence of accuracy and reliability of this method in very young children(Reference Demerath and Fields53,Reference Kyle, Earthman and Pichard54) , it is widely used for this purpose(Reference Pecoraro, Guida and Caroli55), has been validated against different methods(Reference Collins, Reid and Makrides56,Reference Horlick, Arpadi and Bethel57) and has been used as a reference method for validation of some of the published equations that we assessed(Reference Shaikh and Mahalanabis21). Thus, use of BIA rather than ADP as the reference in cohort 1 is unlikely to impact significantly on our findings.
We conclude that none of the available published skinfold thickness equations provides good prediction of body composition in very young multi-ethnic cohorts of New Zealand children with different birth history and growth patterns. New equations will need to be developed and validated for different ethnicities if skinfold thickness is to be used for assessing body composition in research studies in New Zealand and elsewhere around the world.
Acknowledgements
The pre-hPOD study team are: Steering group: J. E. H. (Chair, Liggins Institute, University of Auckland), Jane M. Alsweiler (Department of Paediatrics: Child and Youth Health, University of Auckland), Richard Edlin (School of Population Health, University of Auckland), Greg Gamble (Liggins Institute, University of Auckland), Joanne Hegarty (Newborn Services, National Women’s Health, Auckland City Hospital), C. J. D. M. K. (Liggins Institute, University of Auckland), Benjamin Thompson (Optometry and Vision Science, University of Waterloo) and Trecia A. Wouldes (Department of Psychological Medicine, University of Auckland). Study team: Coila Bevan, Grace McKnight, Jess Wilson, Karen Frost, Kate Sommers, Matthew Signal, Safayet Hossin, Raquel O. Rodrigues, Andrew Meisner, Anna Glasgow, Bethan Jones, Claire O’Beirne, Ellen Campbell, J. Geoffrey Chase, John Malcolm, Maggie Sadlier, Robyn Wilkinson, Dianne Allan, Jenny A. Rogers, Nikeshni Lal, Iona Breinhorst, Jodi Guthrie-Mart, Claire Keesing, Paula Moore-Harre, Caroline A. Crowther, Jessica Brosnahan, Jutta van den Boom, Frank Bloomfield, Katie Groom, Carl Kuschel, Malcolm Battin, Lindsay Mildenhall, Lynn Sadler, Kelly Fredell, Karina Craine, Marian Wordsworth, Oliver Grupp, Mel Spooner, Deborah L. Harris, Alana Cumberpatch, Carla Saunders, Maree Young, Susan Law, Paul Tomlison, Ransford Addo, Wendy Taylor, Sarah Philipsen, Pat Ashwood, Anuradha Kochar, Kerry Curtin, Matthew Glasgow, Isaac Marshall, Laura Eastwood, Jacinta M. Tobin, Robyn May, Dimitria Simatos, Alice Fang, Keith Badloo, Annemarie Lawrence, Kym Krobath, Rachel Ladd, Stephanie Williams, Celia Grigg, Nitin Rajput, Lurena Smith, Melissa Blake, Rachael Cusworth, Sabine Huth, Bithi Roy, T. Sakhaei-Ghardiri, Susan Heath, James Marceau, Heather Stewart, Rebecca Griffith, Alena Vasilenko, Nina Slabkevich, Anushika Kendaragama, Tiffany Tran, Shankari Ganeshan, Mariam Jan Buksh, Nataliia Burakevych, Jason Turuwhenua, Rashedul Hasan, Sharin Asadi, Rajesh Kumar Shah and Jocelyn Ledger. The HUMBA study team are: Steering group: Karaponi Okesene-Gafa (Department of Obstetrics and Gynaecology, University of Auckland); Minglan LI (Department of Obstetrics and Gynaecology, University of Auckland); Christopher McKinlay (Liggins Institute, University of Auckland); Rennae Taylor (Department of Obstetrics & Gynaecology, University of Auckland); Elaine Rush (Faculty of Health and Environmental Science, Auckland University of Technology); Clare Wall (Department of Nutrition, University of Auckland); John Thompson (Department of Paediatrics, Child and Youth Health, and Obstetrics and Gynaecology, University of Auckland); Caroline Crowther (Liggins Institute, University of Auckland); Rinki Murphy (Department of Medicine, University of Auckland); Rachael Taylor (Department of Medicine, University of Otago); Lesley McCowan (Department of Obstetrics and Gynaecology, University of Auckland). Study team: Cecile O’Driscoll, Sarah Va’afusuaga, Susan Ross-Heard, Annette Hallaran; Megan McCowan; Eseta Nicholls, Kristine Day, Mele Fakaosilea; Deirdre Nielsen; Shireen Chua, Noleen van Zyl; Rebecca Pullon; Jess Wilson. The DIAMOND study team are: Steering group: F. H. B. (Chair, Liggins Institute, University of Auckland), J. M. A. (Department of Paediatrics: Child and Youth Health, University of Auckland), J. E. H. (Liggins Institute, University of Auckland), Clare R. Wall (Department of Nutrition, Faculty of Medical and Health Sciences, University of Auckland), T. A. (Liggins Institute, University of Auckland), Yannan Jiang (Department of Statistics, Faculty of Science, University of Auckland), Michael P. Meyer (Neonatal Unit, Kidz First, Middlemore Hospital). Study team: Laura Galante, Clara Chong Yieh Lin, Mariana Muelbert, S. A., Amber Milan, Coila Bevan, David Cameron-Smith, Jenny Rogers, Justin O’Sullivan, Karien Mannering, Marcia Santiago, Nao Nakano, Jutta van den Boom. The authors would like to thank all the children and their families who took part in this study.
The Pre-hPOD study has been funded by the A+ trust (no. 5696), Auckand Medical Research Foundation (1 113 012), Cure Kids (3537), Lottery Health (241266) and philanthropic donations to the University of Auckland (F-ILG-LRSR). The Pre-hPOD study has been funded by the Health Research Council of New Zealand (13-131) and Waikato Research Foundation (no. 283). The hPOD 2YR study has been funded by the Health Research Council of New Zealand (15-216), Gravida (December 2014), Cure Kids (3561), Lottery Health (241266), philanthropic donations to the University of Auckland (F-ILG-LRSR) and the Eunice Kennedy Shriver National Institute of Child Health & Human Development of the National Institutes of Health under award number R01HD091075. The content is solely the responsibility of the authors and does not necessarily represent the official views of the National Institutes of Health. The HUMBA trial received financial and in-kind support from the following sources: financial support from Cure Kids (Child Health Research Charity); Lottery Health Research Grants; Faculty Research Development Fund, University of Auckland; Counties Manukau Health, South Auckland; Mercia Barnes Trust (administered by the New Zealand Committee of the Royal Australian and New Zealand College of Obstetricians and Gynaecologists); Nurture Foundation; and the Heart Foundation of New Zealand. In-kind support: Roche Diagnostics International Ltd provided the Cobas b 101 point-of-care system for measuring Hb A1c and lipids and Christian Hansen (Chr. Hansen A/S, Horsholm, Denmark) provided the probiotic/placebo capsules free of charge. The DIAMOND study has been funded by Te Rangahau Puawai, Counties Manukau Health (150) and the Health Research Council of New Zealand (HRC) (16-605). S. A. was funded by a Boyd Clarke Liggins PhD Scholarship. The funding sources had no involvement in the trial design; collection, analysis, and interpretation of the data; in the writing of this report; and the decision to submit the article for publication.
J. E. H. conceived, planned and designed the pre-hPOD dosing study and the 2-year follow-up study and secured funding for the study, conceived and planned this study, contributed to data analysis and interpretation and edited all drafts of the manuscript. S. A. performed the data analysis, contributed to data interpretation and wrote the first and all subsequent drafts of the manuscript. C. M. K. and E. C. R. conceived, planned and designed the HUMBA follow-up study, secured funding for the study and contributed to data analysis and interpretation of this study. F. H. B. and J. E. H. designed the DIAMOND Study and the DIAMOND follow-up study and secured funding. All authors contributed to editing of the manuscript and have reviewed and approved the final manuscript for submission.
The authors declare that there are no conflicts of interest.


