


Cardiovascular morbidity and mortality have increasingly been linked to added sugars in our diets( Reference Yang, Zhang and Gregg 1 – Reference Te Morenga, Howatson and Jones 3 ). In the American diet, sugar-sweetened beverages (SSB) are the primary source of added sugars( Reference Malik and Hu 4 , Reference Sanchez-Pimienta, Batis and Lutter 5 ). Low-income communities have the highest consumption of SSB and are at greatest risk for related cardiovascular sequelae( Reference Ogden, Carroll and Kit 6 , Reference Ogden, Kit and Carroll 7 ), contributing to health inequities.
Many jurisdictions are enacting various public health interventions to reduce SSB consumption, including SSB taxes. Early evidence demonstrates the effectiveness of SSB taxes in the USA( Reference Falbe, Thompson and Becker 8 – Reference Zhong, Auchincloss and Lee 10 ). However, discrepancies exist in the magnitude of effect sizes reported in studies to date, which likely reflect disparate approaches to assessing SSB consumption. For example, in the first year of an SSB tax in Berkeley, California, a study using a beverage frequency questionnaire found a reduction of 21 % in SSB consumption (times/d)( Reference Falbe, Thompson and Becker 8 ); while a study using retail scanner data from grocery chains found a 9·6 % decline in SSB purchases (oz/transaction)( Reference Silver, Ng and Ryan-Ibarra 9 ). Self-report data are prone to social desirability bias and recall bias. However, sources of more objective data, such as retail scanner data or data based on home scanners, may also have important limitations when assessing the impact of SSB taxes. For example, retail scanner data are unavailable from smaller and non-chain stores, many of which are located in low-income communities, an important venue in which to study the impact of SSB taxes. Additionally, the products most frequently missing from home scanner data are small consumables, like beverages and snacks( Reference Einav, Leibtag and Nevo 11 ). If SSB purchasing patterns vary by community, relying on a single source of data may incompletely and inaccurately represent tax effects.
Unfortunately, very little is known about where people typically purchase SSB. Two studies drawing on data from the National Health and Nutrition Examination Survey (NHANES) have shown that the source of SSB is more likely to be stores than restaurants( Reference An and Maurer 12 , Reference Drewnowski and Rehm 13 ). However, it is unclear which type of stores account for the bulk of SSB purchasing; NHANES data suggest more kilojoules from SSB come from grocery stores than other store types (including convenience stores)( Reference An and Maurer 12 ), while a study done among an exclusively low-income, African-American population found that participants who shopped primarily at corner stores purchased far more SSB than those who typically patronized grocery stores( Reference D’Angelo, Suratkar and Song 14 ).
Given disproportionate advertising of SSB and other unhealthy products in low-income neighbourhoods( Reference Cassady, Liaw and Miller 15 – Reference Yancey, Cole and Brown 18 ) and associated higher prevalence of SSB consumption( Reference Lesser, Zimmerman and Cohen 19 ), the impact of taxes in low-income communities is of particular interest. Additional data are needed on sources of SSB purchases in low-income neighbourhoods. We sought to determine the store types from which people in low-income, urban communities purchase most of their SSB, and whether or not purchasing location was associated with demographic characteristics, including frequency of SSB consumption.
Methods
The current cross-sectional study used data from street-intercept surveys administered in 2016 in the urban California cities of Berkeley, San Francisco, Oakland and Richmond. Compared with the USA as a whole, the cities had higher median household incomes in 2016 (average of $US 68 245 v. $US 55 322), but the sample neighbourhoods had lower incomes (average of $US 48 880) and twice the proportion of people below the federal poverty level (22 v. 11 %). Details on the initial selection of neighbourhoods have been published previously( Reference Falbe, Thompson and Becker 8 ). In short, the two neighbourhoods in San Francisco and Berkeley with the highest proportion of Latino and African-American residents were identified using 2010 census data, and neighbourhoods in Oakland were selected to closely match those characteristics. Subsequently, 2014 census tract data were used to identify two neighbourhoods in Richmond that best matched the sample from the first three cities.
Researchers stationed at intersections with the heaviest foot traffic in each of the selected neighbourhoods asked passers-by if they would be willing to participate in a brief survey, for which they would receive a reusable grocery bag. The survey included a modified beverage frequency questionnaire (frequency and typical size of various beverages consumed) and the question, ‘In the last month, from what store did you buy the most sugary drinks like soda, punch, lemonade, energy and sports drinks?’ Researchers asked for the store name and the type of the store, with the following options (names in parentheses were given to participants as examples): drugstore, chain grocery, discount grocery (like FoodMaxx or Grocery Outlet), specialty store (like Whole Foods or Trader Joe’s), gas station or convenience store, liquor store, corner store/small grocery, box store (like Walmart or Costco), or other store type. Surveys also assessed age, race/ethnicity, gender and educational attainment.
Among 1604 participants completing surveys, 229 (14 %) reported drinking no SSB and were excluded from analyses. Participants who did not provide store type and for whom store name was missing (n 184; 11 %) or not recognized (n 8), participants purchasing from stores categorized as ‘other’ (n 37; 2 %) and those missing demographic data (n 14) were also excluded from analyses. Those dropped from analyses were more educated (47 % college graduates v. 28 %), more likely to be White (26 v. 17 %), more likely to come from Berkeley (26 v. 19 %) and to consume SSB less frequently (1·2 v. 1·9 times/d) than those remaining. When store type was missing but the store name was recognizable (n 44), stores were classified based on the research team’s knowledge of local stores, with verification via the Internet as needed. Similarly, if some participants classified a given store differently from the majority of other participants, researchers reclassified those stores (n 141). Drugstores, chain convenience stores and gas stations were classified as such, and fast-food establishments, delis and coffee shops were classified as restaurants. Researchers classified stores with a single cash register as corner stores (or liquor stores if ‘liquor’, ‘smoke’ or ‘cigarette’ was in the store name). Stores with more than one cash register were classified based on store advertising and customer perceptions: 85 % of participants identified two local chains as discount grocery chains, both of which are known for offering ‘grocery savings’ (all mentions of these stores were classified as ‘discount grocery’); 90 % classified two local chains as ‘chain grocery’ (other mentions were similarly reclassified); other grocery stores were classified as ‘other grocery’. Store types were further broken down to isolate those with data available directly from two major retail scanner data suppliers (based on 2018 release notes): chain groceries, discount groceries, drugstores and convenience stores (only some gas stations are available). The box store most often mentioned by participants was not available in retail scanner data, but other box stores were. The dollar store category includes dollar and 99-cent stores (none of which were available in retail scanner data), as well as stores selling discount, overstocked and closeout products.
We used multinomial logistic regression to identify characteristics associated with the type of store from which participants purchased most sugary beverages, expressing the odds ratios as relative risks. For parsimony, dollar stores were combined with drugstores, and corner stores were combined with liquor stores in regression models, based on preliminary analyses showing no meaningful differences between these store types. Because the presence of stores varied by neighbourhood, all models adjusted for neighbourhood (n 8). Participants who had not completed high school made up the smallest category for education; therefore, college educated was the reference group for more robust comparisons. We varied the reference group in the model (using the ‘base’ option in Stata) for analyses involving race. Fully adjusted models included education, race, age and sex. All analyses were performed in the statistical software package Stata SE version 15.1.
Results
Respondents (n 1132) were diverse, with 41 % identifying as African-American, 29 % as Latino, 17 % as White and 6 % as Asian (8 % declined to respond or stated another race/ethnicity). Age ranged from 18 to 88 years, with a mean age of 42 years. As shown in Table 1, 13 % of respondents had less than a high-school education and 30 % had completed high school but no college (2 % declined to give their education level).
Characteristics of the sample of low-income adults aged 18–88 years (n 1132) from eight neighbourhoods in four Bay Area cities (Berkeley, San Francisco, Oakland and Richmond), California, USA, 2016

IQR, interquartile range; GED, General Educational Development.
Median frequency of SSB consumption was 0·9 times/d and was highly right-skewed (mean=1·9 (sd 3·1) times/d). Figure 1 shows the distribution of stores from which participants most frequently purchased SSB. Corner stores were reported as the primary location from which most SSB were purchased (28 % of respondents), followed by discount grocery stores (18 %) and grocery chains (16 %). Across all store types, the single store mentioned most frequently (n 152) was a chain grocery store (13 % of respondents), followed by a discount grocery chain (n 150); all other unique stores or chains were mentioned by less than 5 % of participants. Overall, 42 % of participants purchased SSB most frequently from stores available in large retail scanner data sets (discount and chain groceries; drugstores; available box stores), with an additional 8 % purchasing from stores that may be available in retail scanner data (convenience stores (4·3 %); gas stations (3·3 %)).
Store types from which consumers purchased most sugar-sweetened beverages in the sample of low-income adults aged 18–88 years (n 1132) from eight neighbourhoods in four Bay Area cities (Berkeley, San Francisco, Oakland and Richmond), California, USA, 2016 ( ,
,  ,
,  , solid shading represents a single store (or chain);
  ,
,  , hatched shading represents multiple stores within a category (no single store mentioned more than nine times); A, liquor stores; B, gas stations)
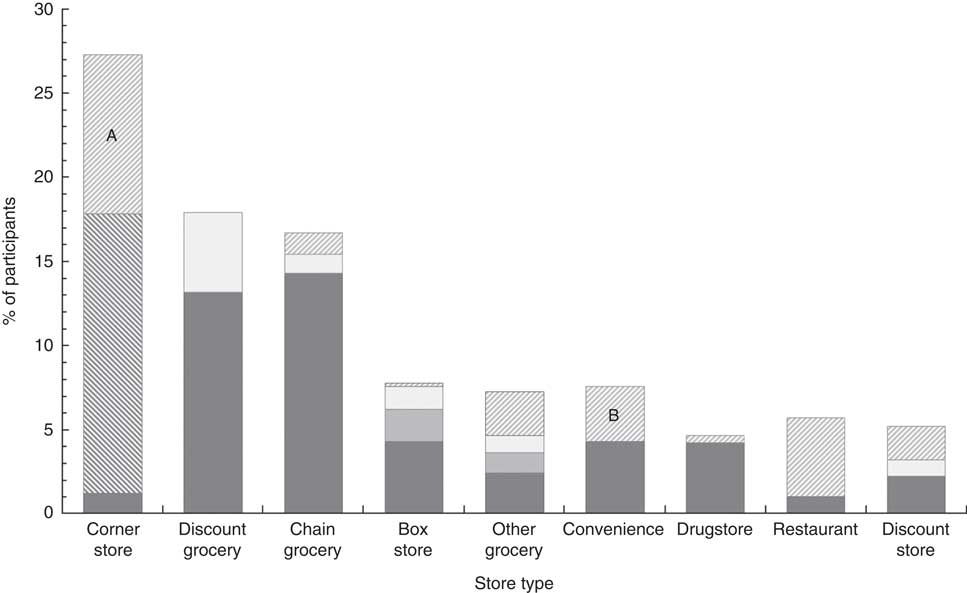
Table 2 reports relative risk ratios (RRR) for purchasing SSB from different store types, adjusted for education, race, age, sex, SSB consumption and the neighbourhood in which interviews took place. RRR are interpreted in terms of the reference store type and the reference category for the characteristic of interest. For example, when ‘Corner store’ is the reference store type, the RRR of 0·4 for category 1 of education (‘<High school’) under ‘Chain grocery’ signifies that compared with respondents who had completed college (reference group), those with less than a high-school education were 40 % as likely to purchase from a chain grocery as a corner store; conversely, this could be stated as those having a college education being 2·5 times more likely to purchase from chain groceries than corner stores compared with those not completing high school. Groups with lower levels of education were also more likely to purchase from corner stores than other groceries or box stores, and more likely to purchase from discount groceries than all other store types. Compared with White respondents, African-Americans were less likely to purchase from other grocery stores, convenience stores and restaurants than from corner, discount or chain grocery stores. Latinos were more likely than Whites to purchase from discount groceries than all other store types except box stores.
Fully adjusted relative risk ratios for location where most sugar-sweetened beverages were purchased, by participant characteristics (values shown for statistically significant relationships only), in the sample of low-income adults aged 18–88 years (n 1132) from eight neighbourhoods in four Bay Area cities (Berkeley, San Francisco, Oakland and Richmond), California, USA, 2016

Relative risk ratios (RRR), which are adjusted for all variables shown in the table as well as for the neighbourhood in which the interview took place, are interpreted in terms of the reference store type and the reference category (ref.) for the characteristic of interest. For example, when ‘Corner store’ is the reference store type, the RRR of 0·4 for category 1 of education (‘<High school’) under ‘Chain grocery’ signifies that compared with respondents who had completed college (reference group), those with less than a high-school education were 40 % as likely to purchase from a chain grocery as a corner store.
Only statistically significant relationships are shown (see online supplementary material, Supplemental Table 1 for all RRR and 95 % CI).
*P<0·05, **P<0·01, ***P<0·001.
† For categorical variables, ‘Category’ indicates the category being compared with the reference group.
In separate models with Latinos as the reference groups (data not shown in Table 2), African-Americans were more likely than Latinos to purchase at corner stores than at discount groceries (RRR=2·1, P=0·003), dollar/drug stores (RRR=2·1, P=0·020), box stores (RRR=3·5, P<0·001) or other grocery stores (RRR=2·6, P=0·14), and more likely to purchase at chain groceries than discount groceries (RRR=1·8, P=0·043) or box stores (RRR=2·9, P=0·002). Age and sex were also significantly associated with purchasing patterns, with women and older age groups being less likely to shop at corner stores and convenience stores than men and those in the youngest age group.
The only association noted for SSB consumption was that more frequent consumers of SSB were less likely to purchase from restaurants than dollar/drug stores (RRR=0·8, P=0·045). In sensitivity analyses that excluded outliers for SSB consumption (5·6 % of respondents with SSB consumption above the median plus three times the interquartile range, or 6·49 times/d), with each additional daily serving of SSB, participants were less likely to purchase from restaurants than all stores except box and other grocery stores (restaurant v. corner store, RRR=0·5, P=0·001; v. discount grocery, RRR=0·6, P=0·001; v. chain grocery, RRR=0·6, P=0·006; v. dollar/drug store, RRR=0·6, P=0·012; v. convenience store, RRR=0·6, P=0·021).
Discussion
The present study is the first to examine the locations from which a diverse and low-income urban population purchases most SSB. We found that 41 % of participants purchased most of their SSB from grocery stores (including discount, large chain and other grocery stores) and 28 % purchased from corner stores, with significant differences in purchasing location based on participant demographics. Notably, half of stores from which participants purchased most SSB would not be available in retail scanner data.
The large proportion of SSB being purchased from grocery stores in the present study (41 %) is not dissimilar to findings based on NHANES 24 h dietary recall data( Reference An and Maurer 12 ), where 52 % of SSB kilojoules came from supermarkets or grocery stores. While corner stores were the main source of SSB for 28 % of participants in the present study, NHANES data, which do not include a category for corner stores, do not provide information on corner store purchases. Studies with more expansive response options, including home scanner data, have found that low-income shoppers are more likely to purchase SSB from stores other than supermarkets( Reference Gustafson 20 , Reference Stern, Ng and Popkin 21 ), particularly corner stores( Reference D’Angelo, Suratkar and Song 14 ). Elucidating the source of SSB purchases from a greater variety of store types, particularly for urban areas where corner stores are ubiquitous, will provide greater clarity around actual SSB purchasing patterns.
In the present study, compared with those with a college education, participants who had not graduated from high school were more than twice as likely to purchase most SSB at corner stores than at grocery chains or other grocery or box stores, and more likely to purchase SSB at discount grocery stores than at all other store types except corner stores. Prior research has also demonstrated differences by socio-economic status in the types of stores patronized( Reference Minaker, Olstad and Thompson 22 – Reference Stern, Robinson and Ng 24 ), which may reflect proximity to store types in different neighbourhoods as well as perceptions of the affordability of various stores( Reference D’Angelo, Suratkar and Song 14 , Reference Powell, Slater and Mirtcheva 23 ). While we adjusted for neighbourhood in all models (controlling for the presence of store type to some extent), proximity to stores has been demonstrated repeatedly to be a driver of store choice( Reference Gustafson 20 , Reference Minaker, Olstad and Thompson 22 , Reference Ver Ploeg, Mancino and Todd 25 ), particularly among those who do not own cars( Reference D’Angelo, Suratkar and Song 14 , Reference White 26 – Reference Villas-Boas and Taylor 28 ).
Compared with White participants, African-American and Latino participants were less likely to purchase most SSB at restaurants, similar to findings of Drewnowski and Rehm( Reference Drewnowski and Rehm 29 ). However, the overall prevalence of purchasing most SSB from restaurants in the present study (6 %) was low relative to NHANES-based studies, which found that 17–24 % of SSB energy in adults’ diets came from restaurants( Reference An and Maurer 12 , Reference Drewnowski and Rehm 29 ). This likely reflects differences in population samples, as both NHANES samples, which are nationally representative, were >60 % non-Hispanic White; while Whites made up only 17 % of participants in the present study. In our sensitivity analyses, those who purchased most SSB from restaurants had the lowest consumption of SSB, likely capturing the habits of people who only consume soda when they go out, as opposed to those for whom SSB consumption is part of their daily routine.
Our study’s primary implications relate to methods used when studying the impact of SSB taxes or other community interventions to reduce consumption of unhealthy foods and beverages. While our question for assessing the source of most SSB would be improved with greater clarity (as asked, responses could be based on the store individuals patronized most frequently or the store from which they purchased the greatest quantity of SSB), we found that only 50 % of the stores that participants named were available in large retail scanner data sets. Although retail scanner data are an important and objective source for tracking SSB purchasing, relying exclusively on retail scanner data may inaccurately represent consumption, particularly in low-income neighbourhoods. As discussed above, the present study and others find that where individuals shop varies by socio-economic status( Reference Minaker, Olstad and Thompson 22 – Reference Stern, Robinson and Ng 24 ). If the source of most SSB purchasing for a given demographic group is not available in retail scanner data, we could miss differential effects of an intervention targeting SSB purchasing. Scanner data from corner, other grocery and non-chain dollar-type stores is unlikely to become available in the near future, given the complexity of contracting with a large number of small stores (v. existing contracts with large store chains) and the fact that many small ‘mom & pop’ stores in low-income neighbourhoods do not use electronic point-of-sale tracking( Reference Young, DeNomie and Sabir 30 , Reference Young and Clark 31 ).
Two additional sources of purchasing data, the US Department of Agriculture’s National Household Food Acquisition and Purchase Survey (FoodAPS)( 32 ) and the Nielsen’s National Consumer Panel( 33 ), provide households with a scanner and ask that participants record shopping trips they make and scan the barcodes of all products purchased. These data sets, which provide participant demographics, represent a combination of objective data (scanned products are identified via universal product codes) and self-report data (consumers must scan or record all items purchased). Our findings contrast with those of Gustafson( Reference Gustafson 20 ) who documented that low-income (Supplemental Nutrition Assistance Program) households in the FoodAPS data set were no more likely to purchase SSB from convenience stores than from box stores or grocery stores. While the FoodAPS’ methodology aims to capture all food and beverage purchases (unlike the single question posed in the current study), error and bias can occur in the FoodAPS and Nielsen data sets as well. In a validation study of Nielsen’s Homescan data, over half (53 %) of shopping trips were not recorded by participants, with smaller trips being missed more frequently; thus, a run to a store for beverages or snacks could be under-recorded. Furthermore, among recorded shopping trips, consumables like beverages and snacks were least likely to be scanned( Reference Einav, Leibtag and Nevo 11 ). To the extent that SSB (or other product) purchases go unrecorded, home scanner data could be underpowered to detect significant changes in consumption. These limitations underscore the difficulty of accurately determining purchasing patterns and highlight the need to incorporate multiple sources of data, particularly when studying consumption of SSB and other potentially unhealthy snack foods.
Studies to date suggest that concerns for under-representing SSB purchases are most important in urban and low-income areas, where corner stores are ubiquitous and frequently the most accessible, or in low-income areas where discount grocery stores that are not available in retail scanner data may be patronized frequently. Purchasing patterns among higher-income populations are likely well represented in chain grocery store purchases. Homescan has the advantage of including individual demographics, and FoodAPS specifically includes the availability of food stores within 1·6 km (1 mile) of each household, as well as distance travelled for foods purchased from more distant locations.
Methodological approaches to improve the generalizability and validity of SSB-consumption research include supplementing retail and household scanner data with combinations of self-reported beverage frequency or 24 h recalls, receipt collection or observations of purchases at small stores, and supporting small stores in adopting electronic point-of-sale systems and partnering with them to examine changes in purchase data. Combined methodologies when evaluating efforts to curb SSB consumption will likely be important not just in the USA, but internationally as well. Studies in Mexico and France have both relied on home scanner data( Reference Colchero, Rivera-Dommarco and Popkin 34 , Reference Capacci, Allais and Bonnet 35 ) and while differential effects of Mexico’s SSB tax were seen by income( Reference Colchero, Rivera-Dommarco and Popkin 34 ), the magnitude of consumption change within strata may vary based on assessment approach.
It is important to interpret study findings of SSB taxes in light of the stores currently represented in retail scanner data. Given the expense of purchasing retail scanner data sets (even for a single jurisdiction), some early studies have relied on scanner data from a few stores or chains. In the present study, no single chain of stores represented more than 14 % of all purchases, and combining the three most frequently cited chains accounted for only 32 % of participants. While a recent study of the impact of Berkeley’s SSB tax reported minimal changes in SSB purchasing( Reference Bollinger and Sexton 36 ), that study relied on data from drugstores and a single supermarket chain. Among the urban population in the present study, all drugstores combined were the source of less than 5 % of most SSB purchases and the largest grocery chain was the source of only 13 % of purchases. Thus, results from a sample of drugstores and a single grocery chain are unlikely to be representative of the impacts of the SSB tax, and certainly not representative of effects in low-income neighbourhoods.
Frequency of SSB consumption was not associated with purchase location in the present study. However, given the ambiguity of the question, ‘In the last month, from what store did you buy the most sugary drinks?’, participants may have responded based on their daily routine, despite purchasing soda in bulk (infrequently but in larger quantities) from box stores. Research that investigates the volume purchased across a broad set of store types would guide future work on the impact of efforts to reduce consumption.
In addition to limitations mentioned above about our method of assessing the source of most SSB, asking for the top three stores would provide greater information on purchasing patterns. Our street-intercept surveys constitute a convenience sample, which may not be representative of purchasing patterns among all residents in low-income neighbourhoods. Our study relied entirely on self-reported data, which are prone to multiple biases that could affect our estimates of purchase locations; however, a recent study suggests self-reported food expenditures are highly correlated with objective purchasing data( Reference Tang, Aggarwal and Liu 37 ). We could not classify store type for 15 % of participants who, compared with the remaining participants, were more educated, more likely to be White and consumed SSB less frequently; thus, our estimates likely under-represent purchasing patterns of this group. While findings from the present study in the San Francisco Bay Area may not generalize to other low-income urban areas, wide economic disparities exist within cities in the Bay Area and the overall level of education in our sample from low-income neighbourhoods was similar to that in the country as a whole (data not shown).
We found that a diverse population in low-income neighbourhoods purchased most SSB from corner stores and discount grocery stores, followed closely by chain grocery stores. Our results suggest that purchasing patterns vary by education, race, sex and age, and that retail scanner data likely present an incomplete picture of the impact of SSB taxes in urban and low-income populations. Future studies of SSB taxes and other public health approaches to improving dietary habits will need to expand their data sources to capture the full range of responses to such interventions.
Acknowledgements
Acknowledgements: The authors extend their thanks to all of the students who worked on this project over time. Financial support: This work was supported by The Global Obesity Prevention Center, Johns Hopkins University (National Institutes of Health/Eunice Kennedy Shriver National Institute of Child Health and Human Development and the Office of the Director award number U54HD070725); the Community Health Equity and Promotion Branch, San Francisco Department of Public Health; and a University of California Office of the President Multi-Campus Research Initiative grant (Principal Investigator: E. Epel). J.F.’s work was supported in part by the American Heart Association (grant number 14POST20140055) and the National Institute of Diabetes and Digestive and Kidney Diseases of the National Institutes of Health (grant number #1K01DK113068-01A1). The content is solely the responsibility of the authors and does not necessarily represent the official views of the National Institutes of Health. The funders had no role in the design, analysis or writing of this article. Conflict of interest: None. Authorship: K.A.M. and J.F. participated significantly in the conception and design of this work, as well as in the analysis and interpretation of the data and writing of the manuscript. G.O. provided significant contribution in data analysis and interpretation as well as writing of the manuscript. A.I.-C. and N.R. significantly contributed in carrying out the study as well as writing the manuscript. Ethics of human subject participation: This study was conducted according to the guidelines laid down in the Declaration of Helsinki. This study was deemed not to involve human research by the University of California, Berkeley’s Committee for the Protection of Human Subjects.
Supplementary material
To view supplementary material for this article, please visit https://doi.org/10.1017/S1368980019000375



