


In the last few decades, the prevalence of obesity has increased significantly throughout the world including low- and middle-income countries (LMIC), as well as high-income countries(Reference Ng, Fleming and Robinson1,2) . According to recent epidemiological data from the WHO, the prevalence of obesity in the world has nearly tripled since 1975(Reference Ng, Fleming and Robinson1,2) . In LMIC, although the rate of obesity is rising, nutritional deficiencies are still frequent(Reference Freire, Silva-Jaramillo and Ramirez-Luzuriaga3,Reference Hawkes, Demaio and Branca4) , increasing the risk of growth faltering and stunting in children(Reference Hawkes, Demaio and Branca4,Reference Stevens, Finucane and Paciorek5) . Whilst nutritional deficiencies increase the risk of infection(Reference Caulfield, de Onis and Blossner6), obesity is often associated with chronic metabolic diseases including diabetes and CVD(Reference Aballay, Eynard and Diaz Mdel7,Reference Orces, Montalvan and Tettamanti8) . Consequently, while LMIC continue to deal with the problems of undernutrition and infectious diseases, they are also experiencing a rapid upsurge in obesity and chronic metabolic diseases(Reference Freire, Silva-Jaramillo and Ramirez-Luzuriaga3). This uncommon coexistence of undernutrition and obesity creates a ‘double burden’ situation that increases social and economic stress in countries with limited resources(Reference Freire, Silva-Jaramillo and Ramirez-Luzuriaga3,Reference Stevens, Finucane and Paciorek5) .
Ecuador is a South American Andean middle-income country with about 16·5 million population, of which about 60 % live in urban areas. Its population is heterogeneous with the majority (about 72 %) is represented by the descendants of inter-ethnic unions (commonly called Mestizos). Minorities are represented mostly by Afro-Ecuadorians, the descendants of Black Africans (about 7·2 %); Native Ecuadorians, the descendants of native Indigenous inhabitants (about 7 %); and White Caucasians, the descendant of European immigrants (about 6·1 %). Geographically, Indigenous populations are located mostly in remote regions in the Amazon forest and highlands, which often have less access to healthcare facilities(Reference Robalino, Balladares and Guerendiain9,Reference Fotso10) . Because of the geographic and economic disparities, minorities are more vulnerable to nutritional deficiencies and diseases(Reference Fotso10–Reference Katuli, Natto and Beeson12). At the same time, rapid economic and demographic changes in Ecuador are altering the balance of dietary intake and promoting the replacement of low-energy plant-based diet with high-energy diet rich in fat predominantly from animal sources(Reference Galicia, Grajeda and de Romana11,Reference Ochoa-Aviles, Verstraeten and Lachat13) . With this change, which is mostly located in urban areas, the occurrence of obesity and metabolic diseases is rapidly increasing. Independent studies were conducted to determine the importance of obesity and undernutrition in different locations in Ecuador, but the trend of occurrence and disparity in Ecuadorian population is still unclear. The objective of this study was to conduct a systematic literature review to evaluate the prevalence of stunting and obesity in Ecuador and assess the magnitude of these problems in relation to age, gender, ethnicity and geographical location. The findings of this search could provide valuable information needed to elaborate preventive interventions.
Methods
Search strategy and study eligibility
This systematic review was conducted in accordance with the Cochrane Collaboration’s systematic review framework and Preferred Reporting Items for Systematic Reviews and Meta Analyses (PRISMA) guidelines and reporting checklist(Reference Moher, Liberati and Tetzlaff14) (Table S1-Checklist). To identify all studies relevant to stunting and obesity in Ecuador, a comprehensive search of major electronic databases was conducted up to February 2018, with no start date restriction. The following databases were searched: Medline/PubMed (http://www.ncbi.nlm.nih.gov/pubmed), Web of Science (https://www.webofknowledge.com), Cumulative Index of Nursing and Allied Health Literature (CINAHL) (https://web.a.ebscohost.com), Cochrane Database of Systematic Reviews (http://www.thecochranelibrary.com) and Ibero-America (Scielo and Redalyc) (https://scielo.conicyt.cl, https://www.redalyc.org). The search strategy was constructed using medical subject headings and the following keywords: ‘obesity’, ‘overweight’, ‘stunting’, ‘underweight’, ‘growth retardation’ or ‘nutritional deficiency’ and ‘Ecuador’. All publication types were searched without language restriction or age limitation, and relevant studies were extracted and manually cross-referenced. In this selection, we included only records that involved human subjects of any age and presented anthropometric indices reflecting body weight status according to standard definitions. We excluded studies that were based on animal models and/or in vitro experiments, or pertaining to patients diagnosed with a disease and undergoing treatments. Short communications, articles and meta-analysis reviews were included. Editorials, letters to the editor, meeting abstracts and literature reviews were excluded.
Anthropometric indices and definition of outcomes
Anthropometric indices used in selected studies were based on internationally known standards including WHO and International Diabetes Federation(Reference de Onis, Onyango and Borghi15,Reference Aschner, Buendia and Brajkovich16) . In preschoolers (age < 5 years), school-age children (5–11 years) and adolescents (age: 12–18 years), anthropometric indices used to assess physical growth and body weight were weight-for-age, length/height-for-age, weight-for-length/height and BMI-for-age. All of these indices were expressed as z scores calculated according to WHO standards(Reference de Onis, Onyango and Borghi15,Reference de Onis, Onyango and Borghi17) and in comparison with international reference values that provide an assessment of optimal growth(Reference de Onis, Onyango and Borghi17). Preschoolers, school-age children and adolescents were classified as stunted if their length/height-for-age z scores were ≤2 sd, and underweight if their weight-for-age z score ≤2 sd. Overweight and obesity were determined for preschoolers as well as other children by z scores between >1 sd and ≤ 2 sd and > 2 sd in BMI-for-age, respectively. Additionally, some studies classified preschoolers as overweight if their weight-for-height (WHZ) was >2 sd. For adults (age ≥ 19 years), BMI (kg/m2) was used to classify overweight and obese according to the following cut-offs: ≥25 and <30 for overweight and ≥30 for obesity(Reference de Onis, Onyango and Borghi15,Reference de Onis, Onyango and Borghi17) . To assess abdominal obesity, some studies adopted the criteria of the International Diabetes Federation based on the measurements of waist circumference and define abdominal obesity when waist circumference (WC) is ≥94 cm for men and ≥88 cm for women(Reference Aschner, Buendia and Brajkovich16).
Study selection and data extraction
Using the inclusion and exclusion criteria, three authors (T.H., V.A.A. and L.C.) reviewed independently identified references in a two-phase process: based on reading of titles and abstracts, and then of full text. Data extraction from selected studies was reported independently by the authors using a pre-established data extraction and assessment template. The following information was independently extracted from each article by the investigators using a standardised form: study design, geographic location, years of survey, sample size, age, gender and ethnicity of participants, outcome definition (i.e. specific diagnostic criteria or cut-off of selected outcomes) and reported prevalence of stunting, underweight, overweight and/or obesity. Discrepancies in the evaluation of the studies were resolved through discussion and unanimous agreement.
Publication heterogeneity and data analysis
Statistical heterogeneity was assessed using the DerSimonian and Laird’s Q and I 2 tests(Reference DerSimonian and Laird18). The Q test provides information about the presence or the absence of heterogeneity between studies, whereas the I 2 statistic quantifies the degree of heterogeneity(Reference Higgins, Thompson and Deeks19,Reference Neyeloff, Fuchs and Moreira20) . Values of I 2 of 25, 50 and 75 % were considered low, medium and high heterogeneity, respectively(Reference Higgins, Thompson and Deeks19). To develop a summary of measures in the overall population, we plotted computed results for the prevalence of stunting and obesity in separate Forest plots according to the method of Neyloff et al. (Reference Neyeloff, Fuchs and Moreira20). Since there was heterogeneity among studies, the random effects model of DerSimonian-Laird was applied to compute pooled prevalence(Reference DerSimonian and Laird18,Reference Neyeloff, Fuchs and Moreira20) . Random effects model is more conservative than fixed effects model and takes into account any heterogeneity inherent in the meta-analysis, in addition to the weight of each study in the analysis according to the sample size. Therefore, study variance impact on study weight is considerably diminished and so is the influence of individual studies’ weights to the model as a whole. All point estimates of analyses and their 95 % CI, used in the forest plot, were calculated using the random effects models as reported by Neyeloff et al. (Reference Neyeloff, Fuchs and Moreira20).
Quality assessment and risk of bias
The methodological quality of included studies was evaluated independently by two authors (V.A. and L.C.), using the Newcastle–Ottawa Scale(Reference Wells, Shea and Paterson21) modified by Nansseu et al. (Reference Nansseu, Noubiap and Mengnjo22). The Newcastle–Ottawa Scale was designed to assess the quality of non-randomised studies in meta-analyses. This scale was formulated by a star distribution system, assigning a maximum of ten stars for the risk of bias in three areas: selection of study groups (4 stars), comparability of groups (2 stars) and ascertainment of the outcome of interest (3 stars). Total scale range was zero to ten, with higher score indicating better study quality. A score equal to or higher than seven was considered to indicate high study quality, a score between four to six was moderate quality, and a score equal to or under three was considered low quality. Discrepancies of quality assessment rating were resolved through discussion with the third member of the study (T.H.) and unanimous agreement.
Results
Search results and studies’ characteristics
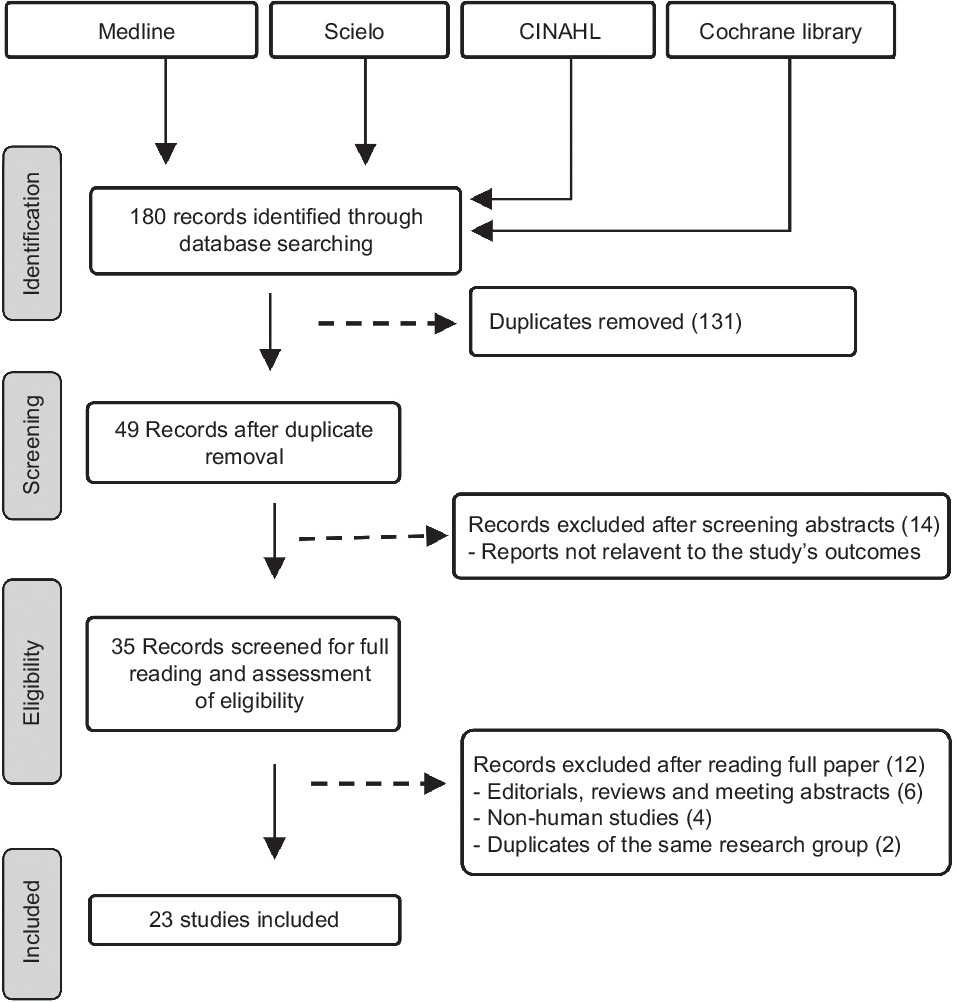
The screening process and results of database search are presented in the PRISMA flow diagram (Fig. 1). A total of 180 papers were initially retrieved using the search format described in the Methods section. Among this first selection, 131 studies were excluded because of duplication between databases and the remaining forty-nine studies were selected for initial identification. Of these, fourteen studies were excluded because they were not related to Ecuador population or focused on obesity-related diseases which were clearly not relevant to the prevalence of stunting and/or obesity. The remaining thirty-five studies were further studied by careful reading of the full text. After the full review, twelve studies were excluded because they were (i) reviews, editorials or meeting abstracts (6); (ii) Non-human studies (4) and (iii) duplicates (2). Ultimately, twenty-three studies were included in the final selection and presented in this review. In general, these studies covered several regions in Ecuador, among which two studies were based on nationwide surveys(Reference Freire, Silva-Jaramillo and Ramirez-Luzuriaga3,23) . Most studies were conducted in urban areas often in and around big cities such as Cuenca, Quito and Guayaquil. Only few studies took place in rural regions and in Amazon forest communities. While several studies examined the prevalence of stunting and/or obesity with age and gender, a limited number reported the distribution among ethnicities(Reference Freire, Silva-Jaramillo and Ramirez-Luzuriaga3,Reference Orces, Montalvan and Tettamanti8,Reference Ortiz, Van Camp and Wijaya24) or between rural and urban regions(23,Reference Cambizaca, Sanabria and Morocho25,Reference Flor-Garrido, Romo and Abril-Ulloa26) . The sample size of studies ranges from twenty subjects in a study conducted in Galapagos Islands(Reference Waldrop, Page and Bentley27) to a maximum of 1 294 372 subjects reported in a nationwide survey(23). The quality assessment indicated that all studies failed to provide the response rate and characterise the non-respondents in comparison with the respondents; likewise, reporting and/or controlling for important factors was unsatisfactory. In general, two studies were with high-quality evidence(Reference Freire, Silva-Jaramillo and Ramirez-Luzuriaga3,Reference Orces, Montalvan and Tettamanti8) and the others were of moderate quality (Table S2). Because age could impact the prevalence of stunting and/or obesity, we subdivided the studies in four groups according to the age: preschoolers (age <5 years), school-age children ≥5 years and ≤ 11 years (5–11 years), adolescents ≥12 years and ≤18 years (12–18 years) and adults (≥19 years).
Preferred Reporting Items for Systematic Reviews and Meta-Analyses (PRISMA) flow chart illustrating the selection of the studies included in the systematic review
Prevalence of stunting and obesity in children and adolescents
The characteristics of the studies relevant to preschoolers, school-age children and adolescents are represented in Tables 1–3, respectively. According to these subdivisions, there were nine(Reference Freire, Silva-Jaramillo and Ramirez-Luzuriaga3,23,Reference Ortiz, Van Camp and Wijaya24,Reference Waldrop, Page and Bentley27–Reference Handal, Lozoff and Breilh32) , four(Reference Freire, Silva-Jaramillo and Ramirez-Luzuriaga3,Reference Robalino, Balladares and Guerendiain9,Reference Oleas33,Reference Ramos, Carpio and Delagado34) and seven studies(Reference Freire, Silva-Jaramillo and Ramirez-Luzuriaga3,Reference Cambizaca, Sanabria and Morocho25,Reference Flor-Garrido, Romo and Abril-Ulloa26,Reference Ramos, Carpio and Delagado34–Reference Casapulla, Howe and Mora37) , respectively. While the obesity rate was reported in most studies of these subdivisions, only few described the prevalence of stunting in school-age children and adolescents. Because of these differences, random effects model analysis of stunting data was performed only for preschoolers, while obesity data were computed for the three subdivisions. The resulting forest plots are presented in Figs. 2 and 3, respectively.
Characteristics of studies relevant to stunting and obesity in infants (age < 5 years)*
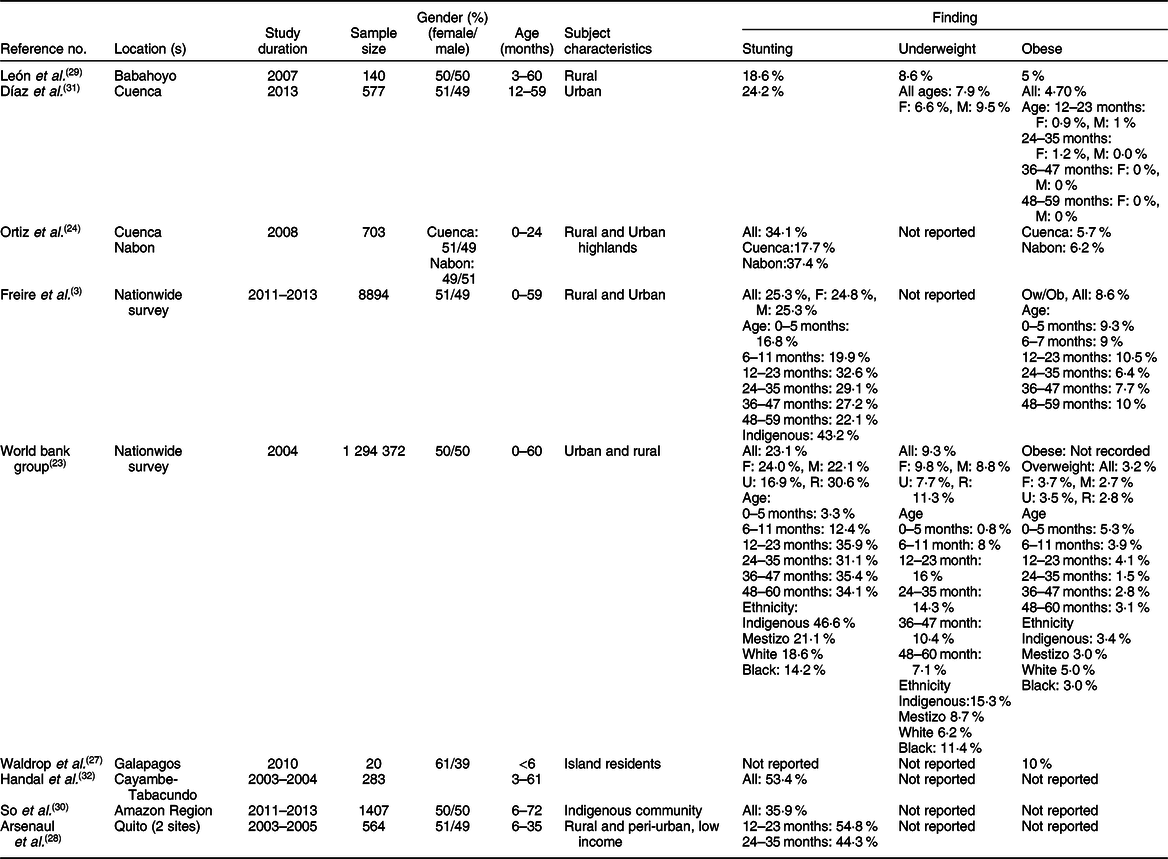
F, female; M, male; U, urban; R, rural; Indigenous, native Ecuadorians; Mestizo, descendants of mixed marriage; Montubio, mestizo people living in countryside of coastal Ecuador; Ow, overweight; Ob, obesity.
* All studies adopted the WHO z scores.
Characteristics of studies relevant to school-age children (5–11 years)*
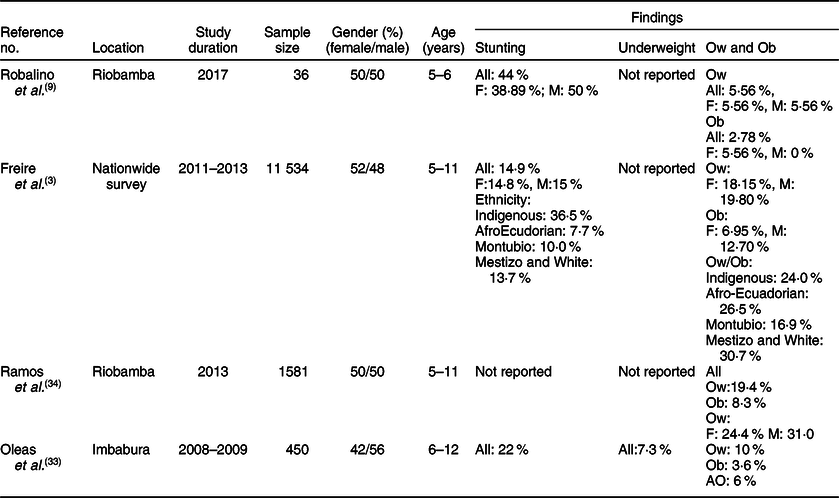
F, female; M, male; Indigenous, native Ecuadorians; Mestizo, descendants of mixed marriage; Montubio, mestizo people living in countryside of coastal Ecuador; White, descendants of European Caucasians; Ow, overweight; Ob, obesity; AO, abdominal obesity.
* All studies adopted the WHO z scores.
Characteristics of studies relevant to stunting and obesity in adolescents (12–18 years)*
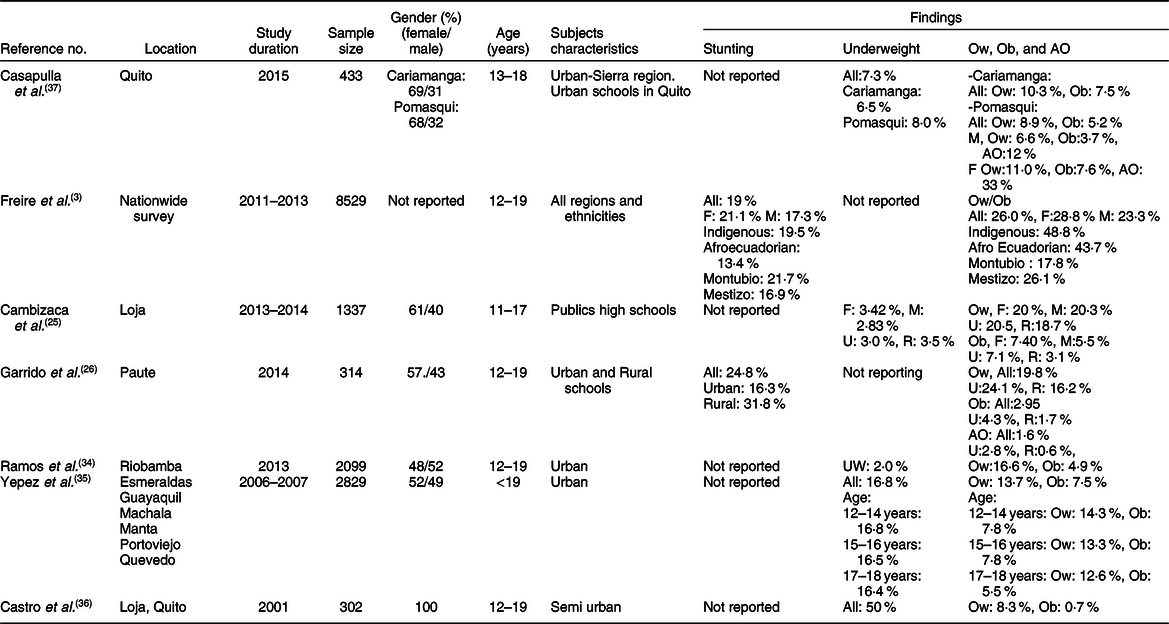
F, female; M, male; Ow, overweight; Ob, obesity; AO, abdominal obesity; U, urban; R, rural; Indigenous, native Ecuadorians; Mestizo, descendants of mixed marriage; Mulatto, descendants of mixed white and black ancestries; Montubio, mestizo people living in countryside of coastal Ecuador.
* All studies adopted the WHO z scores.
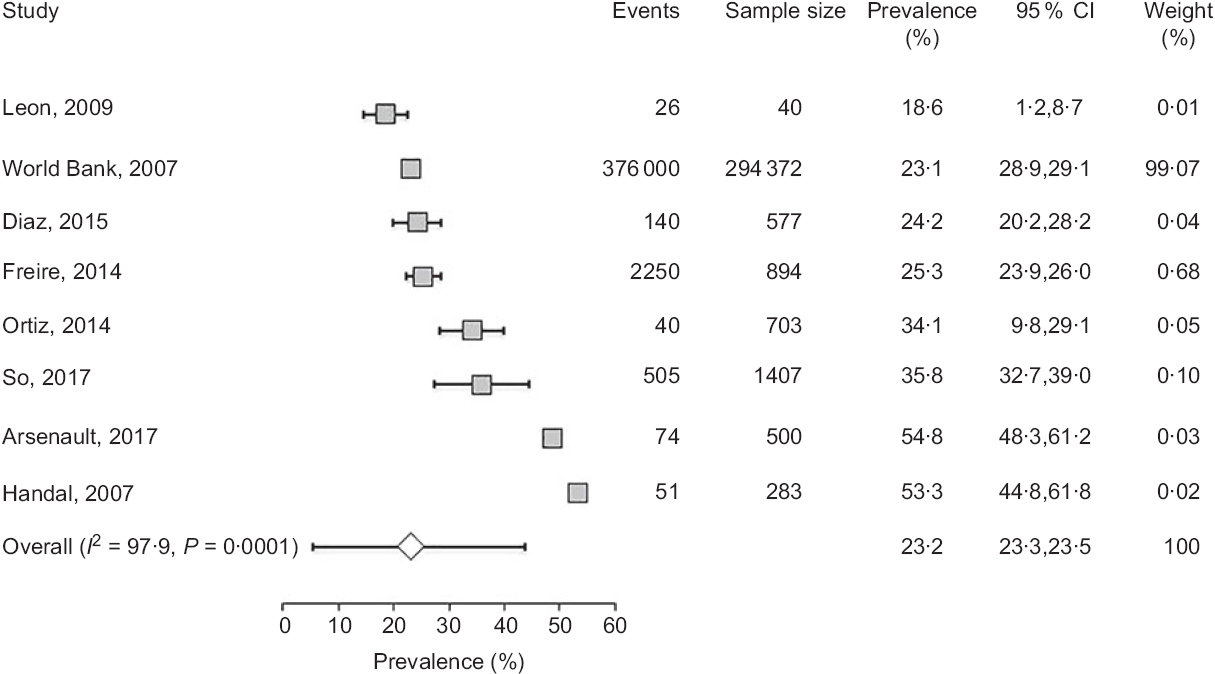
Forest plot of a random effects meta-analysis of the prevalence of stunting in preschoolers (age <5 years). Values are standardised mean differences (95 % CI). The shaded squares represent the point estimate for each individual study, and the horizontal line extending from each square represents the upper and lower limits of 95 % CI. The characteristics of each study include number of events, sample size, prevalence, 95 % CI and study weight. The white diamonds represent the overall estimate of pooled prevalence
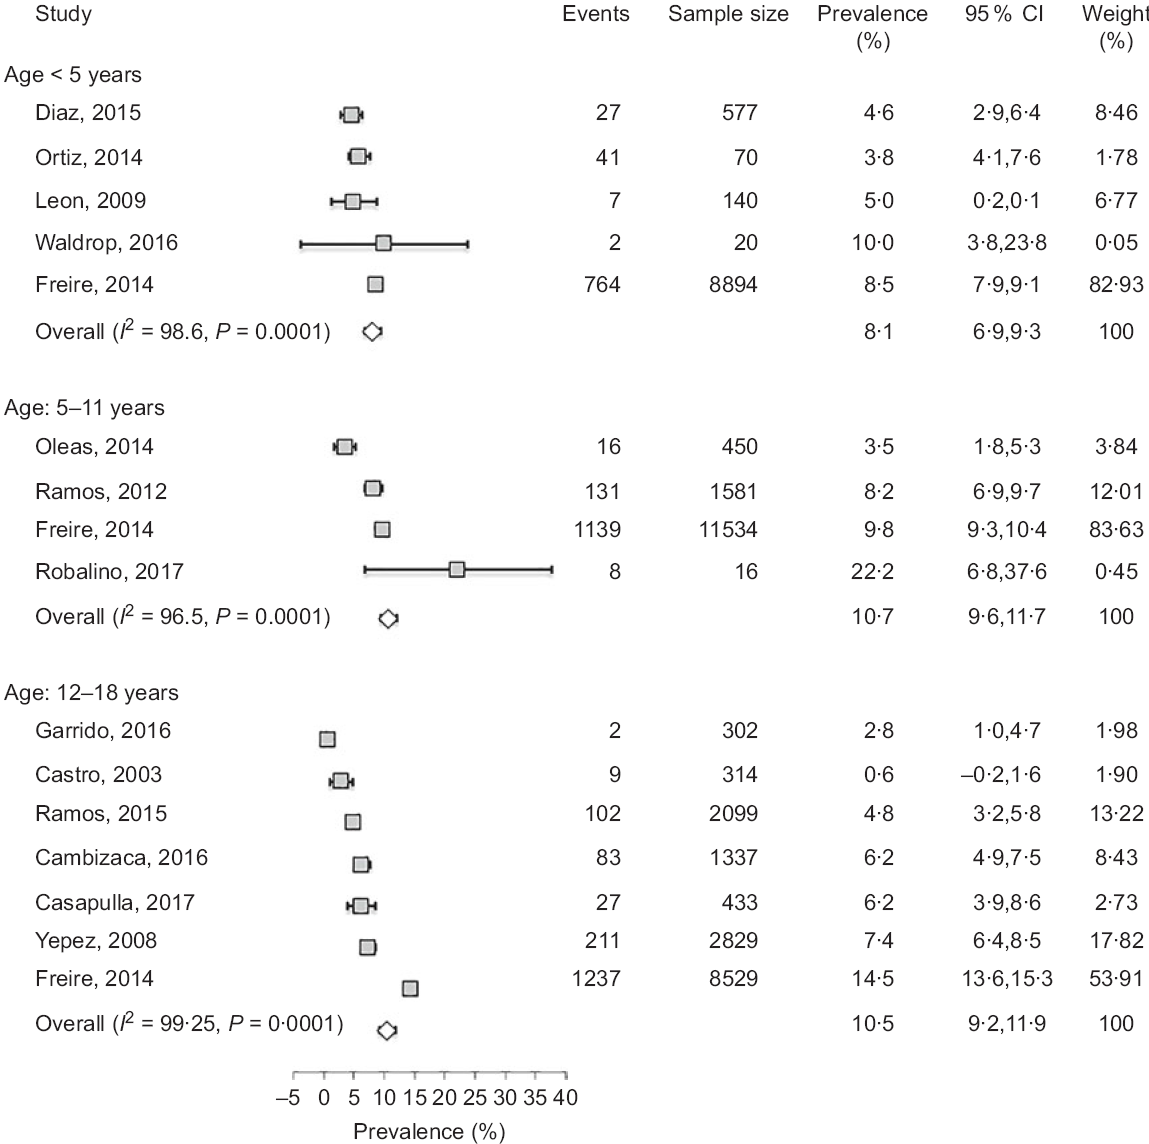
Forest plot of a random effects meta-analysis of the prevalence of obesity in preschoolers (age < 5 years), school-age children (age: 5–11 years) and adolescents (age: 12–18 years). Values are standardised mean differences (95 % CI). The shaded squares represent the point estimate for each individual study, and the horizontal line extending from each square represents the upper and lower limits of the 95 % CI. The white diamonds represent the overall estimate of pooled prevalence in percent
In preschoolers, the overall pooled estimate of stunting was 23·2% (95 % CI 23·3, 23·5) (Fig. 2). There was, however, a high level of heterogeneity among these studies (I 2 = 97·9) which could be related to variations of age, ethnicity and/or geographic location. Interestingly, a large data collection from a nationwide survey(23) indicated that the prevalence of underweight and stunting was relatively low (0·8 and 3·3 %, respectively) in newborns (age: 0–5 months), but increased in the following months to reach markedly high proportions (7·1 and 34·1 %, respectively) at the age of 48–60 months. This progressive age-associated increase was also corroborated by the study of Freire et al. (Reference Freire, Silva-Jaramillo and Ramirez-Luzuriaga3) based on a later survey(Reference Freire, Ramirez and Belmont38). Another important finding was the disparity of prevalence among ethnicities(Reference Freire, Silva-Jaramillo and Ramirez-Luzuriaga3,23) . A study based on an early national survey (ENDEMAIN 2004) reported an alarming rate of stunting exceeding 46·6 % in Indigenous preschoolers, while this rate varied from 14·2 to 21·1 % in children of other ethnicities(23). The same study also reported a markedly higher occurrence of stunting in rural than urban areas(23). Similarly, another study conducted in low-income rural and peri-urban areas of Quito indicated that the rate of stunting was markedly higher than average pooled estimate, reaching 54·8 %(Reference Handal, Lozoff and Breilh32).
Few investigations examined the rate of stunting in school-age children and adolescents as shown in Tables 2 and 3. While three studies(Reference Freire, Silva-Jaramillo and Ramirez-Luzuriaga3,Reference Robalino, Balladares and Guerendiain9,Reference Oleas33) reported a wide range (14·9–44 %) of prevalence in school-age children, two other investigations(Reference Freire, Silva-Jaramillo and Ramirez-Luzuriaga3,Reference Flor-Garrido, Romo and Abril-Ulloa26) indicated that the rate of stunting in adolescents varied between 19 and 24·8 %(Reference Freire, Silva-Jaramillo and Ramirez-Luzuriaga3,Reference Flor-Garrido, Romo and Abril-Ulloa26) . There was no clear difference between males and females in both age-school children and adolescents, but once again there was significant disparity among ethnicities with markedly high rates in Indigenous school-age children (36·5 %)(Reference Freire, Silva-Jaramillo and Ramirez-Luzuriaga3). Furthermore, a study conducted in the Paute region by Garrido et al. (Reference Flor-Garrido, Romo and Abril-Ulloa26) indicated that stunting was clearly higher in rural (31·8 %) than urban areas (16·3 %) (Table 3).
The studies that examined the prevalence of obesity in preschoolers, school-age children and adolescents are listed in Tables 1–3, respectively. In general, the prevalence of obesity was relatively low in early childhood (preschoolers) and did not show a clear change in school-age children and adolescents; estimates of pooled prevalence were 8·1 % (95 % CI 6·9, 9·3), 10·7 % (95 % CI 9·6, 11·7) and 10·5 % (95 % CI 9·2, 11·8), respectively (Fig. 3). Although age subdivisions were created to narrow potential differences among studies, a high level of heterogeneity persisted in each of these subdivisions as indicated by an I 2 > 75 %. While obesity rate was comparable between males and females in each subdivision, there were clear differences between ethnicities(Reference Freire, Silva-Jaramillo and Ramirez-Luzuriaga3), and between rural and urban locations(Reference Cambizaca, Sanabria and Morocho25,Reference Flor-Garrido, Romo and Abril-Ulloa26) . As indicated above, while stunting was prevalent in Indigenous communities, the proportions of overweight/obese in school-age children and adolescent were also noticeably high in these communities reaching 24 and 48·8 %, respectively(Reference Freire, Silva-Jaramillo and Ramirez-Luzuriaga3). Taken together, these findings indicate that obesity and stunting co-exist in Indigenous communities, possibly affecting children at different age ranges.
Prevalence of obesity in adults
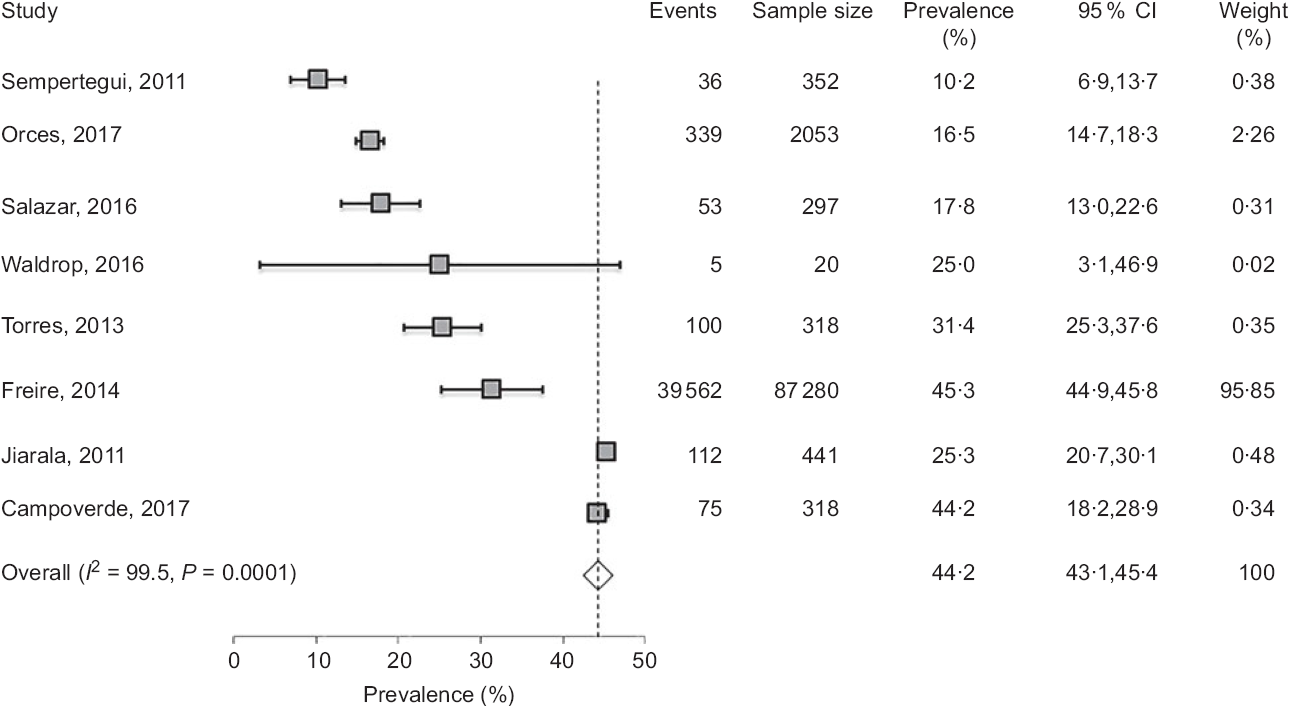
The prevalence of overweight and obesity in adults has been reported in eight studies(Reference Freire, Silva-Jaramillo and Ramirez-Luzuriaga3,Reference Orces, Montalvan and Tettamanti8,Reference Waldrop, Page and Bentley27,Reference Campoverde, Anez and Salazar39–Reference Torres, Siguenza and Ortiz43) (Table 4), six of which reported the distribution among genders(Reference Freire, Silva-Jaramillo and Ramirez-Luzuriaga3,Reference Orces, Montalvan and Tettamanti8,Reference Jairala, Aveiga Parra and Orus40–Reference Torres, Siguenza and Ortiz43) . While four studies examined the rate of abdominal obesity(Reference Orces, Montalvan and Tettamanti8,Reference Campoverde, Anez and Salazar39,Reference Sempertegui, Estrella and Tucker41,Reference Lugo, Saavedra and Noboa42) , only one study compared the disparity between ethnicities, and between rural and urban areas(Reference Orces, Montalvan and Tettamanti8). In general, the results showed a markedly high prevalence of overweight and obese subjects reaching 45 and 25 %, respectively(Reference Waldrop, Page and Bentley27). Pooled estimate of the prevalence of obesity, analysed by the random effects model, was 44·2 % (95 % CI 43·1, 45·4) (Fig. 4). There was, however, high level of heterogeneity (I 2 = 99·5 %) which could be linked to multiple factors including age, ethnicity and geographic location. In line with this, several studies indicated that the prevalence of obesity (assessed by BMI) was higher in females (ranging from 13·7 to 28 %) than males (ranging from 3·3 to 18·4 %)(Reference Freire, Silva-Jaramillo and Ramirez-Luzuriaga3,Reference Orces, Montalvan and Tettamanti8,Reference Sempertegui, Estrella and Tucker41) . In addition, although two studies reported that abdominal obesity was higher in females than males(Reference Orces, Montalvan and Tettamanti8,Reference Sempertegui, Estrella and Tucker41) , two others reported comparable rates in both genders(Reference Lugo, Saavedra and Noboa42,Reference Torres, Siguenza and Ortiz43) . The impact of age was reported in the study of Campoverde et al. (Reference Campoverde, Anez and Salazar39) showing that obesity increased progressively with age reaching almost 35 % in older subjects (age > 60 years). There was also clear disparity between rural and urban populations with markedly higher rates in urban locations(Reference Orces, Montalvan and Tettamanti8). Although comparative studies among ethnicities were sparse, one study reported that Afro-Ecuadorians had the highest prevalence of abdominal obesity (77·7 and 26·1 % for females and males, respectively)(Reference Orces, Montalvan and Tettamanti8).
Characteristics of studies relevant to adults (age ⩾ 19 years)
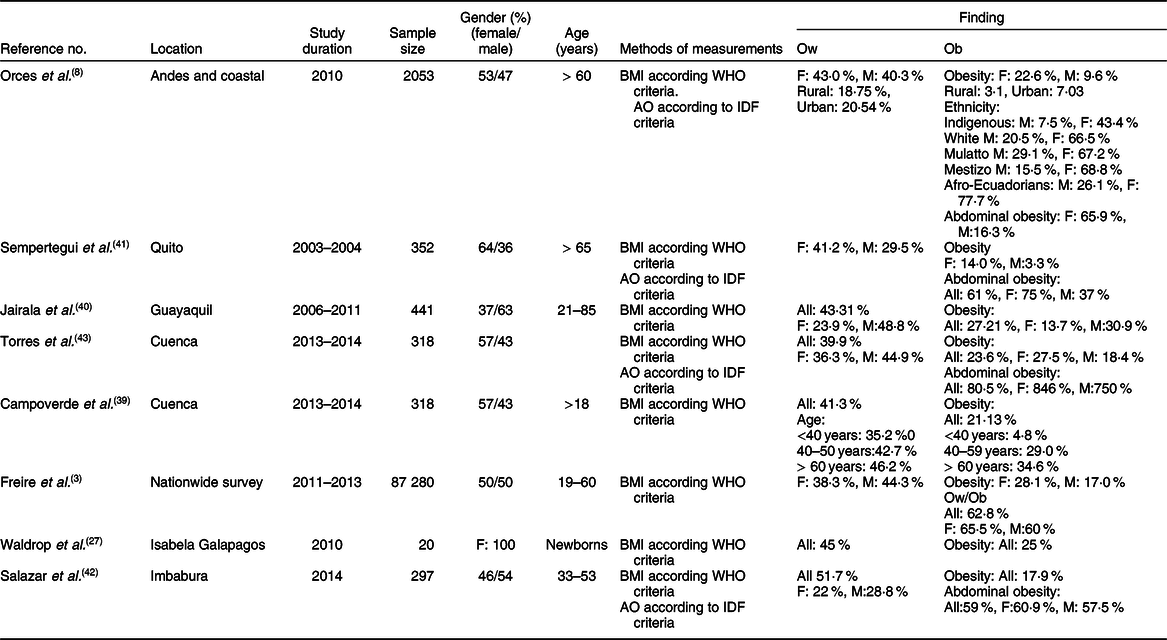
IDF, International Diabetes Federation; F, female; M, male; Mestizo, descendants of mixed marriage; Mulatto, descendants of mixed white and black ancestries; Montubio, mestizo people living in countryside of coastal Ecuador; AO, abdominal obesity.
Forest plot of a random effects meta-analysis of the prevalence of obesity in adults (age ≥ 19 years). Values are standardised mean differences (95 % CI). The shaded squares represent the point estimate for each individual study, and the horizontal line extending from each square represents the upper and lower limits of the 95 % CI. The white diamonds represent the overall estimate of pooled prevalence in percentage
Discussion
This review sought to assess the prevalence of stunting and obesity in Ecuador and to provide a summary of available evidence on this topic. Overall, this study reports several key observations. First, stunting is markedly high among children and adolescent nationwide, but is mostly prevalent in low-income population including Indigenous and rural communities. Second, stunting co-exists with excess weight and obesity mostly in Indigenous communities, suggesting a possible causal relationship. Third, the prevalence of obesity is sensibly high in adults and is not equally distributed among ethnicities and rural–urban locations.
The present review emphasises the high prevalence of stunting in Ecuador and its heterogeneous distribution among ethnicities and geographical regions. In preschoolers, while average prevalence was about 23 %, it was markedly higher in Indigenous populations and rural regions reaching an alarming rate of 50 %. In comparison with surrounding countries, average estimate of stunting in Ecuador is relatively lower than Bolivia (41·6 %) and Guatemala (54·5 %), but remains relatively higher than Argentina (12·8 %) and Brazil (10·5 %)(Reference Black, Victora and Walker44). Despite these variations, shared observation among these countries indicates that deprived subpopulations are the most affected by stunting(Reference Ortiz, Van Camp and Wijaya24,Reference Freire, Ramirez and Belmont38,Reference Morales, Aguilar and Calzadilla45,Reference Gragnolati and Marini46) . In Ecuador, most Indigenous populations are dispersed in remote locations in the Amazon forest and highland regions with poor access to food sources and healthcare facilities(Reference Robalino, Balladares and Guerendiain9). The disparity of the occurrence of stunting is deeply rooted in differences of the socio-economic status with poverty and deprivation affecting mainly populations residing in rural remote areas such as Amazon forest and highlands of Andes Mountains(Reference Robalino, Balladares and Guerendiain9,Reference Katuli, Natto and Beeson12) or impoverished neighbourhoods surrounding major cities with high unemployment(Reference Arsenault and Brown28,Reference Freire, Ramirez and Belmont38,Reference Freire, Belmont and Lopez-Cevallos47) .
Although several factors may contribute collectively to the manifestation of stunting, chronic undernutrition remains the most determinant cause of children development and health status(Reference Fotso10,Reference Black, Victora and Walker44,Reference Morales, Aguilar and Calzadilla45,Reference Jehn and Brewis48) . In Ecuador, several studies have reported the existence of severe nutritional deficiencies which could explain the high occurrence of stunting(Reference Freire, Silva-Jaramillo and Ramirez-Luzuriaga3,Reference Handal, Lozoff and Breilh32,Reference Sempertegui, Estrella and Tucker41,Reference Freire, Belmont and Lopez-Cevallos47) . In line with this, nutritional deficiencies, such as Fe and Zn deficiency, have been detected in stunted children as well as mothers(Reference Freire, Silva-Jaramillo and Ramirez-Luzuriaga3,Reference Black, Victora and Walker44) . Similarly, other nutritional deficiencies exemplified by vitamin D deficiency(Reference Robalino, Balladares and Guerendiain9) were also reported throughout the country but were mostly prevalent in rural and highland regions(Reference Robalino, Balladares and Guerendiain9). It is known that agricultures at high altitudes are often associated with poorer crop production(Reference Morales, Aguilar and Calzadilla45), lower nutritional value of food(Reference Gragnolati and Marini46,Reference Leonard, Dewalt and Stansbury49) and fewer income-generating options(Reference Morales, Aguilar and Calzadilla45). As a result, children residing in these regions may experience inadequate essential nutrient intake(Reference Gragnolati and Marini46,Reference Leonard, Dewalt and Stansbury49,Reference Berti, Leonard and Berti50) and less access to good-quality complementary foods(Reference Leonard, Dewalt and Stansbury49). The importance of growth-limiting nutrient deficiencies is highlighted by some studies showing that complementary foods significantly improved children growth in Indigenous and rural communities(Reference Iannotti, Lutter and Waters51,Reference Roy, Jolly and Shafique52) .
In Ecuador, age distribution of stunting in preschoolers indicates that the rate of stunting increased rapidly from 5 to 6 months onwards until about 24 months, an age when the rate of stunting reached 35·9 %(23). Similar patterns of accelerated growth faltering during the 6–24-month period were also reported in other countries(Reference Kroker-Lobos, Pedroza-Tobias and Pedraza53–Reference Roth, Krishna and Leung55). It is not clear why this growth faltering occurs mostly during the period 6–24 months. It is, however, noteworthy to indicate that this time coincides with a reduction or cessation of breast-feeding which may increase the risk of nutritional deficiencies, seriously compromising normal growth of children(Reference Flor-Garrido, Romo and Abril-Ulloa26). This suggests that poor feeding practices might play an important role in influencing the growth of children, mostly after 6 months of age. In Ecuador, children in low-income families are given common adult foods often with low nutritive value and hard to digest given the fragile digestive system at this age. These findings highlight a time frame for the development of childhood nutritional defects and could help to elaborate preventive interventions to curb the development of stunting at its early stages.
The high prevalence of stunting represents an important challenge in a country with limited resources like Ecuador. Stunting in childhood has short-term and long-term negative repercussions on human health and economic development(Reference McGovern, Krishna and Aguayo56). In addition to reduced physical growth and increased risks of morbidity and mortality(Reference Caulfield, de Onis and Blossner6,Reference Black, Victora and Walker44,Reference Ozaltin, Hill and Subramanian57) , stunting is also associated with diminished cognitive and motor development(Reference Casale, Desmond and Richter58,Reference Ramirez-Zea, Kroker-Lobos and Close-Fernandez59) which may lead to poor academic achievement and low economic productivity(Reference McGovern, Krishna and Aguayo56,Reference Pollitt, Gorman and Engle60) . In relation to this, the evidence from Ecuador has been presented in a study of over 3000 preschool-age children, showing that stunting is associated with significant inferior language skills(Reference Paxson and Schady61). In light of the results of this study, and knowing the lifetime cost of stunting, it is imperative that Ecuador elaborates and maintains a comprehensive strategy to address the root factors that lead to stunting. Such action is beneficial to human health as well as the country’s overall economic growth.
In addition to stunting, Ecuador is experiencing a high occurrence of obesity in adults. In general, the distribution of these conditions is defined mostly by economic inequality between communities, in that stunting is mostly affecting poor communities while obesity is encountered largely in economically advantaged urban residents(Reference Orces, Montalvan and Tettamanti8,Reference Yepez, Carrasco and Baldeon35) . This pattern of independent distribution does not, however, explain the fact that stunting and obesity co-exist within the same Indigenous communities in Ecuador(Reference Freire, Silva-Jaramillo and Ramirez-Luzuriaga3) and other countries(Reference Ramirez-Zea, Kroker-Lobos and Close-Fernandez59,Reference Vonaesch, Tondeur and Breurec62) . While this coexistence is unexpected, since stunting is caused by undernutrition and obesity is the result of over-nutrition, previous studies indicated that early life stunting is a risk factor for the development of obesity at later age(Reference Ramirez-Zea, Kroker-Lobos and Close-Fernandez59,Reference Vonaesch, Tondeur and Breurec62,Reference Sudfeld, McCoy and Danaei63) through a physiological adaptation mechanism referred to as ‘catch-up’ or ‘post-starvation obesity’(Reference Hoffman, Martins and Roberts64–Reference Savanur and Ghugre67). Because stunting and obesity, considered separately, each presents an important risk factor for the development of diseases, the co-existence of both conditions represents a double burden that increases tremendously public health concerns.
Although most studies reported in this review are recent and do not allow the assessment of the occurrence of obesity over time, there is a strong evidence that current rate of obesity is high among adult Ecuadorians. Moreover, the rate of obesity increases with age and is more prevalent in urban than rural regions. Similar heterogeneous trends were also reported in LMIC as well as high-income countries(Reference Ng, Fleming and Robinson1,Reference Lanas, Bazzano and Rubinstein68) – an indication that obesity is a common problem worldwide. Several factors could contribute to rural–urban disparity of obesity prevalence including diet composition and physical activity. In Ecuador, as is the case for most LMIC, obesity is associated with a fast trend of mechanisation and urbanisation which is also accompanied with important shifts in diet composition and physical activity. In the urban areas, reduced physical activity and increased consumption of ultra-processed energy-dense foods, to the detriment of traditional plant-based foods, contribute substantially to the development of obesity(Reference Freire, Silva-Jaramillo and Ramirez-Luzuriaga3,Reference Galicia, Grajeda and de Romana11,Reference Ochoa-Aviles, Verstraeten and Lachat13) . Because obesity is often associated with diabetes and CVD(Reference Aballay, Eynard and Diaz Mdel7,Reference Gharib, Kaul and LoCurto69) , it is possible that increased risks of CVD in Ecuador(Reference Hernandez-Hernandez, Silva and Velasco70–Reference Miranda, Herrera and Chirinos72) are linked to the rise of obesity(Reference Orces, Montalvan and Tettamanti8). Taken together, these findings indicate that national effort towards the prevention and treatment of obesity, as well as undernutrition, should be a public health priority in Ecuador to limit the risk of co-morbidities.
Strengths and limitations of the study
The strengths of this review include a comprehensive and rigorous systematic search using well-established PRISMA guidelines. In addition, this search included multiple and widely known databases as well as uniform and reproducible data extraction using a preset checklist so as to minimise errors and bias(Reference Moher, Liberati and Tetzlaff14). This review also included studies from different regions of the country. Like any systematic review, mainly from observational studies, this study has limitations. First, we included only studies published in international and peer-reviewed journals and may have missed important unpublished data or local/internal reports which is a common practice in some countries. Second, there was some variation and heterogeneity of sample size among studies which may have introduced some weakness in the meta-analysis. It is, however, important to indicate that our results are in agreement with other studies in South America and in other parts of the world(Reference Freire, Belmont and Lopez-Cevallos47,Reference Kroker-Lobos, Pedroza-Tobias and Pedraza53,Reference Casale, Desmond and Richter58) . Third, this review did not calculate the effect of specific factors on the study outcomes, such as ethnicity, age and geographic location. This was due to the fact that the number of studies considering these factors was very limited and did not allow statistical analysis. Therefore, we included all studies to calculate overall pooled estimates and described the impact of these factors narratively in the results citing references when available. Finally, because most studies were relatively recent and did not allow an assessment over time, this review does not provide information on the longitudinal evolution of the study outcomes.
Conclusions
The prevalence of stunting is markedly high nationwide, but is mostly prevalent in low-income population including Indigenous and rural communities. In addition, the prevalence of obesity is strikingly elevated in adults and is not equally distributed among ethnicities and rural–urban locations. The existence of this double burden – stunting and obesity – represents a major public health concern that requires further robust and sustained interventions.
Acknowledgements
Acknowledgements: The authors would like to thank Dr. Thomas Fungwe for helpful discussion. Financial support: This work was made possible by the generous support of Hackensack University Medical Center. Conflicts of interest: None. Authorship: The authors’ contribution is as follows: V.A.A. and L.C. conducted the initial search. V.A.A., L.C. and T.H. analysed the data, designed and wrote the manuscript. All authors (T.H., V.A.A. and L.C.) read and approved the manuscript. Ethics of human subject participation: Not applicable.
Supplementary material
For supplementary material accompanying this paper visit https://doi.org/10.1017/S1368980020002049.


