

The Mini Nutritional Assessment (MNA) was developed for assessing/screening the risk of malnutrition in older people approximately two decades ago( Reference Guigoz, Vellas, Garry, Vellas, Guigoz, Garry and Albarede 1 – Reference Vellas, Villars and Abellan 3 ). The full (or long-form, LF) MNA comprises eighteen items grouped into four rubrics: anthropometrics; global indicators; dietary intake status; self-view of health and nutritional status. The MNA also has a short form (SF), which was originally developed to allow the use of a two-step, screening and then assessment, process in low-risk populations. The MNA-SF was derived from the six key items in the full MNA, and its ability to predict undernutrition generally parallels that of the full MNA( Reference Rubenstein, Harker and Salva 4 ). Because of its high performance, the MNA-SF has been proposed to serve as a stand-alone unit( Reference Kaiser, Bauer and Ramsch 5 ). Recently, we have also shown that calf circumference (CC) can substitute BMI and improve the predictive ability of the scale( Reference Kaiser, Bauer and Ramsch 5 , Reference Tsai, Chang and Wang 6 ). Thus, the MNA has an alternative version, the CC-MNA.
The MNA was developed based on the clinical data of Caucasian populations. Due to anthropometric and cultural differences, we normalised and validated the respective versions for Taiwanese by adopting population-specific anthropometric cut-off points and dietary habits. The MNA-Taiwan version 1 (MNA-T1) and MNA-Taiwan version 2 (MNA-T2), which are equivalent to the original MNA and CC-MNA, respectively( Reference Tsai, Ho and Chang 7 , Reference Tsai, Ho and Chang 8 ), are two versions specifically normalised for Taiwanese.
The MNA has multifunctional properties. In addition to rating nutritional risk status, it also rates functional and cognitive status, or frailty, and it can predict subsequent functional and cognitive declines, the risk of falling, hospitalisation outcomes, length of hospital stay, and mortality( Reference Guigoz 9 , Reference Cereda, Valzolgher and Pedrolli 10 ). The fact that the MNA is able to predict subsequent functional and cognitive declines is of particular significance.
Populations around the world are ageing rapidly. Older people have an increased risk of malnutrition. Malnutrition can increase functional and cognitive impairments and difficulties in eating. Advanced ageing would almost eventually lead to frailty, a state of increased vulnerability resulting from multisystemic reduction of physiological capacities. Severe frailty will lead to dependency and increased care need.
We theorise that if the MNA is able to predict malnutrition and subsequent functional impairment, cognitive declines and frailty, then it should be able to predict care need. Thus, the present study was conducted to determine the ability of the MNA to predict care need. As our earlier studies have suggested that the MNA-SF is quite effective at predicting functional decline and the MNA-T2 (CC-MNA) is superior to the original MNA under most conditions( Reference Tsai, Chang and Wang 6 , Reference Tsai, Chang and Wang 11 ), we also compared the predictive abilities of these versions.
Methods
Source of data
In the present study, datasets of the ‘Taiwan Longitudinal Study on Aging’ (TLSA), a population-representative cohort study, were analysed( 12 ). The TLSA employed a multistage equal probability sampling process based on the national household registration comprising personal data and residential addresses of all citizens. Stage one involved random selection of administrative units (townships) to represent the population; stage two involved proportionate-to-size random selection of lins (groups of neighbouring household units as the basic administrative unit) from selected townships to serve as primary sampling units, and stage three involved systematic random selection of two eligible respondents from each of the selected lins. During this process, 4412 men and women aged ≥ 60 years were selected to serve as subjects, and among them, 4049 completed the initial interview in 1989.
In 1996, a second sample of 3041 subjects, 50–66 years, was drawn using the same process to extend the younger age range of the study cohort, and a total of 5131 subjects of the combined cohort completed the interview. The original or the combined cohort underwent a comprehensive in-home, face-to-face, structured questionnaire interview conducted by trained interviewers in 1989, 1993, 1996, 1999, 2003 and 2007. A flow chart of the TLSA has been presented previously( Reference Tsai and Chang 13 ). The 1999 survey, comprising nutritional assessment and the MNA items, was chosen as the baseline and the 2003 survey as the endpoint for the present study. The protocol of the surveys was reviewed and approved by government-appointed representatives. All participants gave informed consent, and the study was conducted according to the ethical standards set forth in the Declaration of Helsinki.
Study subjects
In the 1999 survey, 4440 of the 4915 subjects in the combined cohort completed the interview. Among them, 2890 subjects were aged ≥ 65 years, but 150 who had incomplete MNA data were excluded. The remaining 2740 subjects served as the subjects in the present study. For cross-sectional regression analysis, the model included all the 2740 subjects. From longitudinal analysis, 250 subjects who had care need at baseline and seventy-six subjects who were lost to follow-up were excluded. The remaining 2414 subjects included 1964 who completed the 2003 survey and 450 who died before the 2003 survey. Among the 1964 subjects who completed the 2003 survey, 1728 had no care need and 236 had new care need. Among the 450 subjects who died before the 2003 survey, 421 were judged to have care need and twenty-nine to have no care need (Fig. 1). The judgements were based on the TLSA records, the mortality records of the study subjects maintained by the Health Promotion Administration, and the Household Registration data.
Flow chart and care-need status of 2740 Taiwanese subjects aged ≥ 65 years. * Based on Taiwan Longitudinal Study on Aging (TLSA) data or information provided by the Health Promotion Administration or the Household Registration records.
Outcome measures
The outcome measure in the present study was new onset of care need, which was defined as that in those who started needing formal care (care provided by trained carers in long-term care institutions or at homes) or informal care (care provided by family members or non-professional personnel) or became Activities of Daily Living (ADL) dependent during the subsequent 4 years.
Nutritional status assessment
The nutritional status of each subject was rated with the LF and SF versions of the MNA-T1 and MNA-T2 at baseline. The MNA-T2 has been shown to perform slightly better than or at least equally to the MNA-T1( Reference Tsai, Chang and Wang 6 ). Data for all the items of the MNA, except fluid intake (1 point), were available in the datasets. Thus, the MNA scores in the present study were based on seventeen items for the MNA-T1 and sixteen items for the MNA-T2. However, the total scores were proportionately adjusted to the full 30-point basis. A total score ≥ 24 is considered as normal, 17–23·5 as at risk of malnutrition, and < 17 as malnourished. The MNA-SF, which was derived from a subset of the LF, has a score range of 0–14. A total score ≥ 12 is considered as normal, 8–11 as at risk of malnutrition, and ≤ 7 as malnourished.
Other variables
All other variables were derived from the 1999 datasets. Education level was classified into three categories: ≤ 6; 7–12; ≥ 13 years of formal education. BMI was calculated as weight divided by squared height in kg/m2. Living arrangement was defined as living alone or cohabitation. Routine physical activity was classified into three categories: exercising 0; ≤ 2; ≥ 3 d/week ( ≥ 30 min/d). Functional status was based on ADL dependency; cognitive status was based on the education-adjusted Short Portable Mental Status Questionnaire scale; and depression status was rated with the 10-item Center for Epidemiologic Studies Depression (CES-D) scale. ADL reflect six daily self-care abilities including bathing, dressing/undressing, self-feeding, functional transferring, ambulation and toileting( Reference Katz, Ford and Moskowitz 14 ). An activity that one could not perform at all or had great difficulty in getting it done was considered dependent for that activity. A person with any domain of ADL dependency was considered as ADL dependent. The Short Portable Mental Status Questionnaire consists of ten items covering short-term and long-term memory, orientation, knowledge of current events and mathematical tasks, and the maximum score is 10( Reference Pfeiffer 15 ). In the present study, the score was education adjusted. Those who scored < 6, < 7 and < 8 for 0, 1–6 and >6 years of formal education, respectively, were considered as cognitively impaired. The 10-item CES-D scale has been shown to preserve sensitivity and specificity as the 20-item original scale( Reference Kohout, Berkman and Evans 16 ) and to perform well in older Chinese( Reference Boey 17 ). The scale has a score range of 0–30, and a score ≥ 10 is considered as having depressive symptoms( Reference Andresen, Malmgren and Carter 18 ).
Statistical analyses
All statistical analyses were carried out with the Statistical Package for the Social Sciences (SPSS version 19.0; SPSS, Inc.). Binary logistic regression analyses were carried out to determine the cross-sectional and longitudinal association of the MNA-T1 and MNA-T2 with care-need status controlled for age, sex, education level, living arrangement and routine physical activity. OR and 95 % CI were estimated for groups that were rated as at risk of malnutrition or as malnourished compared with those who were rated normal. Taking the MNA score as a continuous predictor, receiver operating characteristic curves and the AUC( Reference Zweig and Campbell 19 ) were generated to compare the ability of the four MNA (as at risk of nutrition+malnourished v. normal) to predict care need. A larger value of the AUC (the maximum value is 1·0) suggests a better predictive ability of the predictor. All statistical analyses were weighting adjusted according to study design (sampling ratio). Statistical significance for all analyses was accepted at α= 0·05.
Results
Table 1 summarises the characteristics of the subjects at baseline and endpoint. At baseline, the MNA-T1-LF rated fifty-seven (2·1 %) subjects as malnourished, 373 (13·6 %) as at risk of malnutrition and 2310 (84·3 %) as normal; 14·2 % of the subjects had cognitive impairment and 30·8 % had depressive symptoms; at endpoint, the values were 17·0 and 28·0 %, respectively. At baseline, 9·1 % of the subjects had care need; at end point, 12·0 % had care need.
Characteristics of the 2740 Taiwanese subjects at baseline (≥65 years old) and at endpoint (Number of subjects and percentages, mean values and standard deviations; n 1964)
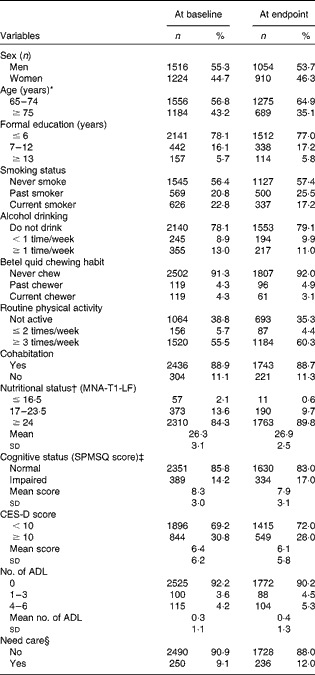
MNA-T1-LF, Mini Nutritional Assessment-Taiwan version 1-long form; SPMSQ, Short Portable Mental Status Questionnaire; CES-D, Center for Epidemiologic Studies Depression; ADL, Activities of Daily Living.
* 65 and 75 years of age correspond to birth years 1934 and 1924, respectively.
† All values were those of nutritional status rated with the MNA-T1-LF at baseline. The distributions of nutritional status rated with other MNA versions are given in Supplementary Appendix A (available online).
‡ Based on education-adjusted SPMSQ score: subjects who scored < 6, < 7 and < 8 for 0, 1–6 and >6 years of formal education, respectively, were considered as cognitively impaired.
§ Including those who needed formal care (care provided by trained carers) or informal care (care provided by non-professional persons including family members) or were ADL dependent.
Table 2 summarises the results of the univariate regression analysis of the association of care need with age, sex, education level, living arrangement, routine physical activity and nutritional status rated with the MNA at baseline and endpoint. Care need was strongly positively associated with age but negatively associated with education level. Poor nutrition greatly increased care need. The associations with sex and living arrangement were not significant.
Results of the univariate regression analysis of the associations of the independent variables with care need of a sample of Taiwanese subjects (n 2740, aged ≥65 years at baseline) and at endpoint (n 2414) (weighted) (β Coefficients, odds ratios and 95 % confidence intervals)
* Rated with the Mini Nutritional Assessment-Taiwan version 1.
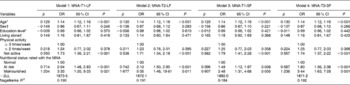
Table 3 summarises the cross-sectional associations of nutritional status rated with the MNA with care need in older Taiwanese. Using the respective nutritionally normal group as the reference, the OR for needing care in those who were rated as at risk of malnutrition or malnourished were 2·50 and 14·2 for the MNA-T1-LF, 3·38 and 18·3 for the MNA-T2-LF, 2·02 and 7·23 for the MNA-T1-SF, and 2·61 and 8·84 for the MNA-T2-SF (all P< 0·001), controlled for age, sex, education level, living arrangement and routine physical activity; the − 2 log likelihood values were 999·8, 989·7, 1010·8 and 1003·2 and the Nagelkerke R 2 values were 0·225, 0·235, 0·215 and 0·222, respectively.
Cross-sectional associations of nutritional status rated with the Mini Nutritional Assessment (MNA) or the short-form MNA with care need in 2740 Taiwanese subjects aged ≥65 years at baseline (weighted) (β Coefficients, odds ratios and 95 % confidence intervals)
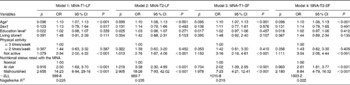
MNA-T1-LF, MNA-Taiwan version 1-long form; MNA-T2-LF, MNA-Taiwan version 2-long form; MNA-T1-SF, MNA-Taiwan version 1-short form; MNA-T2-SF, MNA-Taiwan version 2-short form; − 2LL, − 2 log likelihood.
* Age and education level were continuous variables.
† Male was used as reference for sex and cohabitation was used as reference for living arrangement.
Table 4 summarises the longitudinal associations of baseline nutritional status rated with the LF and SF versions of the MNA-T1 and MNA-T2 with care need 4 years later in older Taiwanese. Using the respective nutritionally normal group (at baseline) as the reference, the OR for needing care in those who were rated as at risk of malnutrition or malnourished were 2·04 and 3·33 for the MNA-T1-LF, 2·10 and 5·35 for the MNA-T2-LF, 1·49 and 2·48 for the MNA-T1-SF, and 1·80 and 3·44 for the MNA-T2-SF (all P< 0·05), controlled for the same variables as in the cross-sectional model; the − 2 log likelihood values were 1873·5, 1872·1, 1882·0 and 1871·2 and the Nagelkerke R 2 values were 0·190, 0·191, 0·184 and 0·192, respectively.
Longitudinal associations of the baseline Mini Nutritional Assessment (MNA) status with new care need 4 years later in 2414 Taiwanese subjects aged ≥65 years (weighted) (β Coefficients, odds ratios and 95 % confidence intervals)
MNA-T1-LF, MNA-Taiwan version 1-long form; MNA-T2-LF, MNA-Taiwan version 2-long form; MNA-T1-SF, MNA-Taiwan version 1-short form; MNA-T2-SF, MNA-Taiwan version 2-short form; − 2LL, − 2 log likelihood.
* Age and education level were continuous variables.
† Male was used as reference for sex and cohabitation was used as reference for living arrangement.
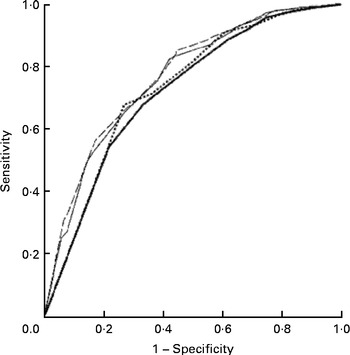
Fig. 2 shows the receiver operating characteristic curves generated for each of the MNA against care need at baseline. The AUC was 0·762 (95 % CI 0·730, 0·794) for the MNA-T1-LF, 0·771 (95 % CI 0·739, 0·802) for the MNA-T2-LF, 0·720 (95 % CI 0·685, 0·755) for the MNA-T1-SF, and 0·732 (95 % CI 0·697, 0·767) for the MNA-T2-SF (all P< 0·001). The scoring patterns and the nutritional status rated with the MNA versions are given in Supplementary Appendix A (available online).
Receiver operating characteristic curves generated for the Mini Nutritional Assessment-Taiwan version 1-long form (MNA-T1-LF; ![]() ), Mini Nutritional Assessment-Taiwan version 2-long form (MNA-T2-LF;
), Mini Nutritional Assessment-Taiwan version 2-long form (MNA-T2-LF; ![]() ), Mini Nutritional Assessment-Taiwan version 1-short form (MNA-T1-SF;
), Mini Nutritional Assessment-Taiwan version 1-short form (MNA-T1-SF; ![]() ) and Mini Nutritional Assessment-Taiwan version 2-short form (MNA-T2-SF;
) and Mini Nutritional Assessment-Taiwan version 2-short form (MNA-T2-SF; ![]() ), respectively, against care need at baseline in 2740 Taiwanese subjects aged ≥ 65 years. The AUC was 0·762 (95 % CI 0·730, 0·794) for the MNA-T1-LF, 0·771 (95 % CI 0·739, 0·802) for the MNA-T2-LF, 0·720 (95 % CI 0·685, 0·755) for the MNA-T1-SF, and 0·732 (95 % CI 0·697, 0·767) for the MNA-T2-SF (all P< 0·001).
), respectively, against care need at baseline in 2740 Taiwanese subjects aged ≥ 65 years. The AUC was 0·762 (95 % CI 0·730, 0·794) for the MNA-T1-LF, 0·771 (95 % CI 0·739, 0·802) for the MNA-T2-LF, 0·720 (95 % CI 0·685, 0·755) for the MNA-T1-SF, and 0·732 (95 % CI 0·697, 0·767) for the MNA-T2-SF (all P< 0·001).
Discussion
The results of the present study suggest that the MNA (both forms and both versions) can effectively predict concurrent and subsequent care need in older people. Those who were rated as at risk of malnutrition were found to have greater current need for care and have increased need for care during the subsequent 4 years. These results suggest that the MNA, whether LF or SF, might have a greater clinical value than previously recognised.
Cross-sectional and longitudinal associations
MNA scores usually reflect frailty in older people. Malnutrition rated with the MNA is associated with functional dependency, cognitive impairment, depression and difficulties in chewing and swallowing( Reference Guigoz 9 ). Older patients from the general practice found to be at risk of malnutrition rated with the MNA had higher need for meals-on-wheels and home care for shopping than those who were well nourished( Reference Beck, Ovesen and Schroll 20 ). Cereda et al. ( Reference Cereda, Valzolgher and Pedrolli 10 ) observed that the MNA was a good predictor of functional status in institutionalised older people at risk of malnutrition.
The MNA can also predict subsequent functional decline. Older patients from the general practice rated as at risk of malnutrition with the MNA at baseline had a higher tendency for non-participation and a higher prevalence of hospitalisation 6 months later( Reference Beck, Ovesen and Schroll 20 ). The MNA-SF was also found to be able to predict functional decline (defined as a loss of 10 % of the Barthel index score during 2-week hospitalisation) in patients admitted to acute care( Reference Salvi, Giorgi and Grilli 21 ). Those who were rated as at risk of malnutrition had worse clinical features, longer length of hospital stay and considerable functional decline. Studies carried out by our group have shown that both the MNA-LF and MNA-SF were associated with greater ADL or Instrumental ADL dependency at baseline and were able to predict functional decline (measured as increasing number of ADL or Instrumental ADL dependency) 4 years later in older Taiwanese. The longitudinal associations existed even among older people who were free of ADL or Instrumental ADL dependency at baseline( Reference Lee and Tsai 22 ). The MNA-T2 performed better than or at least equally to the MNA-T1( Reference Lee and Tsai 23 ) in predicting the decline. We also observed that the ADL complemented the MNA or the MNA-SF in predicting follow-up mortality risk in older people( Reference Tsai, Lee and Wang 24 ). These results suggest that the MNA is able to predict ADL or Instrumental ADL dependency, in addition to rating current nutritional status in older people. Poor nutrition rated with the MNA has also been observed to be associated with poorer concurrent cognitive status and higher subsequent cognitive decline in older Taiwanese( Reference Huang and Tsai 25 ).
Prediction of care need or higher level of care
Severe functional decline and cognitive impairment can lead to frailty and increasing dependency. In addition to being a good predictor of functional status in institutionalised older people at risk of malnutrition, the MNA was found to be reliable for identifying the at-risk institutionalised older people who needed higher-level care( Reference Cereda, Valzolgher and Pedrolli 10 ). The MNA-SF was among a list of scales that defined frailty and the need for care among community-dwelling older people in Sweden( Reference Bravell, Westerlind and Midlov 26 ). Dent et al. ( Reference Dent, Visvanathan and Piantadosi 27 ) have recently concluded in a review that nutritional status rated with nutrition screening tools, particularly the MNA-LF and MNA-SF, is associated with subsequent functional decline and need for higher-level care in older people. The present study has further shown that both the MNA-LF and MNA-SF of both T1 and T2 versions are effective at rating current care status and at predicting care need during the subsequent 4 years in older Taiwanese. Thus, in both Eastern and Western populations, the MNA-LF and MNA-SF have been shown to rate current functional and cognitive status and to predict subsequent functional and cognitive declines, the major determinants of care need, institutionalisation or need for higher-level care in older people( Reference Tsai and Lai 28 – Reference de Saint-Hubert, Schoevaerdts and Cornette 30 ). These studies suggest that the MNA is a tool that not only rates malnutrition risk, but can also predict subsequent functional decline, cognitive impairment and the need for care or higher-level care.
The short-form Mini Nutritional Assessment has advantages
Although the MNA-LF can predict subsequent care need with greater accuracy than the MNA-SF, the MNA-SF would still be a preferred tool in both clinical and community settings simply because it is much easier and time saving (5 v. 20–30 min) to use. The MNA-SF has much fewer items (6 v. 18) and it does not include the difficult and time-consuming items such as fluid and protein intakes. It appears worthwhile to trade a bit of accuracy for a large gain on usability. Simplicity and easy execution are important features of successful screening tools in both clinical and community settings.
The present results also reveal that the T2 versions performed slightly better than the T1 versions. Although the improvement in performance is only moderate, the improvement in utility is significant. The MNA-T2-SF substituted CC for BMI. Measuring CC is much easier than measuring weight and height, especially in people who have mobility limitations or disability. CC data could also be more accurate than BMI data in older people. Thus, the MNA-T2-SF is favoured over the MNA-T1-SF.
Implications
We have demonstrated with a large population-representative sample that the MNA not only can predict current care need but can also predict subsequent care need in older people. These results suggest that the MNA has the properties to serve as a tool for screening care need in older people. Given that most populations in the world are ageing rapidly, such tools are urgently needed. Of course, further improvements are needed before these tools can become acceptable care need-predicting scales. For example, it does not include socio-economic, cultural or healthcare system factors. However, the MNA-SF does possess the basic or major features for being used as a care need-predicting tool.
Limitations of the study
The present study has some limitations. (a) A major limitation is that interview surveys in the TLSA took place every 4 years. Therefore, the time of onset of care need could not be accurately pinpointed and analysed for its association with the MNA scores in the present study. (b) Attrition is an inherent issue in longitudinal studies involving older people. Whether these subjects are included in the statistical analyses can have a great impact on results. In the present study, we included those who died but not those (seventy-six subjects) who were lost to follow-up in the longitudinal analysis. For those who died, we used the care arrangement at the time of death recorded in the datasets or mortality records to judge their probable care need. However, there was no such information for those who were lost to follow-up. (c) Most data were self-reported. Self-reports generally have good accuracy, but errors due to incorrect recall of information or unwillingness to reveal personal information are unavoidable. (d) Functional condition and cognitive status were evaluated with scales not clinically diagnosed. Although the scales are well established, individual differences in answering the questions included in the scales are unavoidable. (e) Care need or care arrangement is influenced by many conditions. Culture, socio-economic factors and personal view/ideology may influence the onset of care need or care arrangement. These potential confounders could not be totally controlled. (f) Fluid intake (1 point) was not assessed in the surveys. However, the TLSA sample was drawn from the general population, not from institutionalised or frail older population, and we also proportionately adjusted to the full 30-point basis. The overall impact on study results should be minimal.
Conclusion
The MNA-LF and MNA-SF of both T1 and T2 versions, in addition to rating the risk of malnutrition, can also rate functional and cognitive status, predict functional and cognitive impairments, and predict subsequent care need in older people. Among the four MNA, the MNA-T2-SF appears to be most promising because of its performance, simplicity and efficiency. The MNA-T2-SF may have the basic features for being developed into a more complete tool for predicting care need, a tool urgently needed in this rapidly ageing world. Early detection is important to allow targeted interventions and should be a key factor in geriatric assessment.
Supplementary material
To view supplementary material for this article, please visit http://dx.doi.org/10.1017/S0007114514000142
Acknowledgements
The present study was based on data from the TLSA provided by the Health Promotion Administration (HPA), Department of Health, Taiwan. Descriptions or conclusions reported herein do not represent the viewpoint of the HPA.
The study did not receive financial support from any source.
The authors' contributions are as follows: A. C. T. conceived the study design and drafted the manuscript; W.-C. H. carried out the statistical analyses; J.-Y. W. helped with the statistical analyses and interpretation of the data. All authors reviewed and approved the manuscript.
None of the authors has any conflicts of interest to declare.


