
Introduction
The technologies of meat preservation – extraction, canning, and refrigeration – were crucial contributions to the process of trade expansion, price convergence, and market integration known as the ‘First Globalization’ (c.1870–1914). Albeit with different intensity, all these technologies required large supplies of energy, which before the development of hydropower and national electrical grids meant that they relied heavily on coal. Export-led growth in some of the so-called ‘settler economies’ was to a large extent made possible by these new technologies, and by steamship and railroad transportation, themselves coal-powered innovations.Footnote 1 This article compares the cases of New Zealand and Uruguay, two small agriculture-based settler economies of the southern hemisphere, showing how their late nineteenth-century export-led growth was similarly dependent on coal, but crucially differentiated by its price. While both societies became very prosperous by the standards of non-industrialized countries, New Zealand became significantly richer than Uruguay, and has remained ahead by much the same margin, more or less to the present day.
Trying to explain that gap, economic historians have often pointed to New Zealand’s precocity, and Uruguay’s tardiness, in adopting innovations in pastoral production, particularly in developing a dairy and refrigerated meat export trade.Footnote 2 Rather than this being only or fundamentally a result of different institutional contexts encouraging or stifling innovation in manufacturing, I argue that the complicated processes associated with the adoption of refrigeration were grounded in the different material realities of livestock production.Footnote 3 In particular, the different cost of energy in the two economies had important implications for the choices of technique by the respective producers.
New Zealand first exported frozen mutton in 1882, and soon after almost all of its meat exports were frozen or chilled, whereas Uruguay, which had larger livestock herds, only started exporting chilled meat twenty-five years later, and predominantly exported salted and cured beef until 1913. One could say that the difference was a matter of taste, but one with powerful economic consequences. European consumers preferred beef and mutton fresh, and the increasingly numerous working-class consumers of New Zealand and Uruguayan produce wanted meat as close to fresh as they could afford, unlike pork, which they particularly enjoyed salted or cured (as in bacon, ham, and sausages). Refrigerated beef and mutton were the superior products, and could command higher prices; in economic terms, they had a much higher income elasticity of demand than beef jerky or corned beef. In this context, a reciprocal comparison of the meat industries of New Zealand and Uruguay allows us to tell the story of two societies united by grass but separated by coal, which developed along different routes of specialization, despite having similar resources of agricultural land.
Offering new evidence on coal prices and firm-level coal use, this article considers the impact of fuel markets in the choice of meat preservation techniques in New Zealand and Uruguay before the First World War. The discussion will hopefully be relevant beyond the histories of these two small countries, and indeed the history of meat as a commodity, in at least three respects. First, on the question of energy and economic development set against the background of the Great Divergence in global economic history, the article provides a comparative study of coal’s part in differentiating two growth stories in the periphery. Second, regarding the debates on the impact of fossil fuel use on the energy balance of agriculture in environmental history, the New Zealand and Uruguayan experiences illustrate the importance of considering energy inputs beyond farms. Even if livestock raising remained an activity based on the traditional, renewable, energies at play in the grasslands, the processing of meat on the killing floor and beyond became increasingly dependent on fossil fuels, which had important economic and ecological consequences. Third, whereas most studies of the divergent fortunes of settler societies contrast the similarity of natural environments and resource constraints with the differences in social structures and institutional contexts, this article emphasizes the importance of considering the specificity of natural resources, and their impact on the economic costs and material realities of production. In so doing, it suggests that distinguishing between different kinds of natural resource, and considering their combinations in particular historical contexts as well, can prove more useful to economic and environmental historians than concentrating solely on aggregate measures of ‘natural capital’.
After this introduction, the first section reviews the arguments for and against coal as a key factor in the onset of modern economic growth, trying to transcend the divide between the debates centred on the industrialized West and cases in the global periphery. The second section frames the New Zealand/Uruguay comparison in a global context, and situates the present contribution in the comparative literature. The third section presents new estimates of coal supply and prices in both countries. The fourth section considers the relevance of coal-fuelled meat preservation in this period at the economy-wide level, while the fifth section compares the impact of coal prices on choices of techniques at a micro level, referring to individual companies in New Zealand and Uruguay.
Coal and modern economic growth in global economic history
Energy resources are a central part of many histories of the English Industrial Revolution. Large-scale use of coal was the common denominator of the innovations that signalled the beginning of industrialization in late eighteenth-century England, which was, as described by Wrigley and Cipolla, an energy transition that freed human societies from the constraints of an ‘organic economy’ by giving them control over machines worked by inanimate energy.Footnote 4 More recently, Allen has argued that the relative prices of energy and labour are the key reason behind the British origins of industrialization, as they induced labour-saving technological innovation.Footnote 5 Not only the origins but also the diffusion of industrialization can be traced by flows of energy: the expansion of the ‘British model’ of energy consumption was, according to Warde, a necessary condition for modern economic growth in Europe.Footnote 6 Going beyond the West, Pomeranz emphasized luck in coal location as a major reason behind Britain’s industrial precocity vis-à-vis the Chinese Yangzi delta, while Malanima argued that the specific ecological conditions of early modern Europe produced agrarian systems with an earlier and stronger need for fossil fuels than in China.Footnote 7
Of course, many other scholars reject the idea that energy endowments in general, and coal reserves in particular, were one of the keys to the British origins of the Industrial Revolution, and of the wider process of modern economic growth in the West. McCloskey argued that, just like any other input, coal can be (and indeed was) moved and imported, so not having domestic energy resources should not have been an impediment for industrialization or modern economic growth.Footnote 8 In the same vein, when criticizing Allen’s induced innovation hypothesis, Mokyr claimed that cheap coal was a consequence of the Industrial Revolution, rather than one of its causes.Footnote 9 In a recent cliometric effort to quantify the part played by coal in British industrialization, Clark and Jacks explored several counterfactual scenarios, and suggested that, if Britain had not had coal but had had access to it from nearby suppliers (in a world where the Netherlands or Ireland were coal-rich instead of Britain), the course of the Industrial Revolution would not have changed. Yet they admit the counterfactual speculation becomes much more difficult to pursue if we imagine that it was the whole of Europe which lacked coal, though they still argue against Wrigley’s and Pomeranz’s positions.Footnote 10
This debate has sparked a series of country studies, exploring the impact of coal (that is, of the relative ease or difficulty – translated into economic cost – of its provision) in different geographical and historical contexts, but mostly within Europe.Footnote 11 The comparison pursued here reaffirms the usefulness of an energy perspective, and the importance of King Coal for modern economic growth beyond his traditional realm of industrialization in the West, but it also offers an olive branch to the critics. Sheer availability of coal reserves does not by itself explain anything, and indeed coal could be (and was) imported into Uruguay, where a process of modern economic growth without domestic fossil fuels did take place at about the same time as in coal-plentiful New Zealand.
Yet, as the differences between Clark and Jack’s two counterfactual scenarios suggest for the British case, I argue that this story cannot be told without thinking about conditions of access to coal. Energy prices, which reflected those conditions, still matter for explaining why New Zealand consumed about four times as much coal as Uruguay per unit of output, and stayed about 50% richer in this period. The argument here is not that a lack of domestic energy resources necessarily hinders development, but that energy dependency, if and when it translates into high energy price levels and volatility, is a significant comparative drawback, particularly during times of fast and energy-intensive technological change. Despite the fact that there was no industrial revolution in New Zealand or in Uruguay, access to modern energy at low and stable prices made a difference: from the First Globalization onwards, rural capitalism in the peripheries also needed modern energy.
Tracing the comparison
By 1913, the average New Zealander or Uruguayan was 60% richer than his or her grandparents (far more so if those grandparents were, as was fairly likely, working-class Europeans), had more social and labour rights, and fewer children.Footnote 12 The landscape where she or he lived – for the first time in the history of these countries probably a city – had significantly changed, and that change was mainly due to human intervention. Ecological transformation was a result of the increased scale and scope of livestock production encouraged by foreign demand, but led by local entrepreneurs, as ruminants continued to dominate over ploughs. Even as cities and ports grew larger, which had crucial political consequences, New Zealand and Uruguay remained dependent on the livestock herds in their hinterlands to provide dynamic export commodities, which kept their balance of payments in equilibrium.
Among the world’s land-abundant economies, persistent pastoral specialization in New Zealand and Uruguay stands as an exception to the nineteenth- and early twentieth-century global pattern of grassland conversion, during which vast grazing areas were turned to cropland. This happened across the great plains of the US, the Canadian prairies, the Russian and Ukrainian steppe, the savannas of West Africa, and, indeed, in Uruguay’s and New Zealand’s larger neighbours, in the Argentine humid pampas and the temperate plains of south-eastern Australia.Footnote 13 In contrast, grass remained the dominant plant cover across Uruguay’s gently undulating landscape throughout the First Globalization and beyond, occupying more than 80% of productive lands. In New Zealand, grass cover doubled in size, expanding from the South Island to dominate the North Island as well, in a process of environmental transformation which followed the violent appropriation of Māori lands in the 1860s.Footnote 14
New Zealand and Uruguay: geography, population, and economy, c.1910

a I follow the thresholds used by primary sources and demographic historians to define towns for both countries, which unfortunately are not the same: 1,000 inhabitants for New Zealand, 2,000 for Uruguay.
b The first official census reporting urbanization rates for Uruguay is from 1963; demographers estimate, on the basis of district returns, that between 40.5% and 44.7% of the population lived in towns with more than 2,000 inhabitants by 1908.
c ‘Foreign-born’ here means anyone who was not born in New Zealand or Uruguay respectively (i.e. considering British or Commonwealth subjects born overseas as foreigners (unlike New Zealand censuses)).
d 100 = simple average of real GDP per capita of the four core Western economies (France, Germany, the UK, and the US).
Sources: climate: Markus Kottek etal., ‘World map of the Köppen-Geiger climate classification updated’, Meteorologische Zeitschrift, 15, 3, 2006, pp. 259–63. Temperature and rainfall in Auckland and Montevideo: New Zealand official year-book, 1913, Wellington, 1913; Anuario estadístico de la República Oriental del Uruguay, 1913–14, Montevideo : Dirección General de Estadística, 1915. Population: Gerard T. Bloomfield, New Zealand: a handbook of historical statistics, Boston, MA: Hall, 1984; Adela Pellegrino, La población de Uruguay, Montevideo: UNFPA, 2010. Urbanization: Campbell Gibson, ‘Urbanization in New Zealand: a comparative analysis’, Demography, 10, 1, 1973, pp. 71–84; Juan Rial and Jaime Klaczko, Uruguay: el país urbano, Montevideo: Banda Oriental, 1981. GDP: Bolt etal., ‘Rebasing “Maddison”’. Exports: Phil Briggs, Looking at the numbers: a view of New Zealand’s economic history, Wellington: New Zealand Institute of Economic Research, 2007; Nicolás Bonino-Gayoso, Antonio Tena-Junguito, and Henry Willebald, ‘Uruguay and the First Globalization: on the accuracy of export performance, 1870–1913’, Revista de Historia Económica, 33, 2, 2015, pp. 287–320; New Zealand Institute of Economic Research, Data1850, Wellington, 2019, data1850.nz (consulted 27 November 2019). Pastures and livestock: Jorge Álvarez, ‘Instituciones, cambio tecnológico y productividad en los sistemas agrarios de Nueva Zelanda y Uruguay: patrones y trayectorias de largo plazo’, PhD thesis, Universidad de la República (Uruguay), 2014.
Arising from their demographic, environmental, and economic similarities (Table 1), a broad-brush modern history of both countries can be told as variations on a common theme. Extremely peripheral from the perspective of the economic and political cores of the West, New Zealand and Uruguay were marginal regions in the world economy of the early nineteenth century. Though born from two different waves of European imperial expansion, a century apart, and under the aegis of two different metropoles, both countries were sparsely populated prior to European arrival, and were by no means the crowning jewel of their empires. Transport costs were so high that their production was not competitive in European markets, with the only exception being goods produced at extremely low cost (Uruguayan cattle hides), or those which had a remarkably high value-to-weight ratio (New Zealand gold).Footnote 15
Distance was challenged by coal, steam, and human ingenuity in the form of the late nineteenth-century transportation revolution. Benefiting from abundant agricultural land in relation to population, natural sea harbours, and favourable climates, in the two generations before the First World War, New Zealand and Uruguay became small but highly specialized livestock export economies that could feed many times their own populations, as the Londoners who developed a taste for Canterbury lamb or Fray Bentos beef extract could attest. Despite fast-growing meat production, wool remained the top export commodity for both countries, which were home to similarly large sheep herds. Crucially for New Zealand, its crossbreeds produced its top two staples (wool and mutton), whereas Uruguay needed two species to produce its top commodities (wool and beef), which created an upward pressure on stocking densities, with long-term environmental consequences that should be the subject of another article.Footnote 16
Both countries remained sparsely populated by global standards, and were soon characterized by slow rates of natural population increase, resulting from a very early (by southern hemisphere standards) demographic transition to lower birth and death rates.Footnote 17 European immigration (with a longer history in Uruguay than in New Zealand) was a major source of population growth, and was actively encouraged by both governments. Uruguay’s government created an increasingly large institutional framework for the reception of migrants from the 1880s, with the Migration Department publishing pamphlets describing the economic benefits of farming in the country.Footnote 18 Assisted migration schemes to New Zealand since 1870, in which the Agent-General’s recruitment agents in London played a major part, were highly successful. Nevertheless, as Hawke persuasively argued, the assisted passage schemes would not have been as popular without the underlying economic comparison between the prospects of farming in England and in New Zealand.Footnote 19
The highly productive cattle farms and sheep stations that attracted migrants also fuelled the growth of cities, as most of the employment in livestock production was in its downstream industries, which were spatially concentrated in towns. This contributed to urbanization rates in both countries becoming some of the highest in the southern hemisphere.Footnote 20 The strengthening of statehood, and the primacy of urban politics, were both conditions and results of the process of economic growth and integration to the world economy: provision of public goods was increasingly necessary, and the rapidly growing population and output per capita meant that the state had more trade to tax, more services to charge, and more resources to draw upon.
Changes in material life connected with political, cultural, and intellectual forces in both countries to produce reform agendas, which the contemporary press described as ‘state socialism’ and ‘Jacobinism’.Footnote 21 Mass immigration, comparatively high incomes, and rising state expenditure coalesced in these small-scale settings to produce progressive politics and active economic and social policies. In an increasingly global world, where telegraphs allowed information to travel fast enough to make local politics internationally known, both countries rapidly earned a reputation for being ‘social laboratories’.Footnote 22 The parliaments in Wellington and Montevideo passed legislation that was considered extremely bold, even in affluent Western democracies, such as women’s suffrage in New Zealand, or women’s unilateral and unconditional right to divorce in Uruguay. Governments expanded welfare provision, with progressively broad pension schemes and increased funding for public health and education. They also contemplated a larger role for the state in the economy, with the government developing infrastructure, and public companies providing key services, decisively reshaping the political landscape of both countries for decades to come.Footnote 23
Despite all these similarities, a significant income gap between New Zealand and Uruguay has remained unbridged for the last century and a half. If New Zealand was ‘born rich’ thanks to the mid-nineteenth-century gold rush, it managed to remain about 50% richer than Uruguay thereafter.Footnote 24 Explaining why, how, and when that gap became consolidated has motivated a comparative history literature since the 1970s, which has largely placed the interpretative emphasis on institutional trajectories as the forces behind the persistent gap.Footnote 25
The two most recent book-length works devoted to the comparison reflect this consensus. Jorge Álvarez developed a systematic comparison of the divergent institutional trajectories of the agrarian systems of New Zealand and Uruguay, which in his view decisively affected the aggregate performance of both economies, allowing New Zealand to avoid the pattern of high inequality and low returns per acre that came to characterize the Uruguayan landholding system.Footnote 26 Contrary to the ‘path dependence’ literature, Álvarez considered institutional evolution to be a fundamentally non-linear process, which, in the case of landownership structures in Uruguay and New Zealand, cannot be traced back to colonial policies, or explained by their legal legacies.Footnote 27 Andre Schlueter also produced an institutionalist analysis, but one much closer to the mainstream versions of new institutional economics, drawing in particular from the theoretical framework of North, Wallis, and Weingast.Footnote 28 Schlueter characterizes New Zealand as an ‘open access order’, and Uruguay as a ‘limited access order’, and argues for a positive relationship between relative prosperity and contract rights enforcement, although he finds that New Zealand’s ‘open access’ conditions were more recent and less effective for rapid growth than previously assumed. Importantly for the argument pursued here, he rejects differences in endowments as the main explanatory factor of the different fortunes of New Zealand and Uruguay, although he does admit that technology played a role ‘potentially’ more important than a framework such as that of North, Wallis, and Weingast would acknowledge.Footnote 29
This article does not deny the relevance of institutions in general (or colonial legacies in particular) in economic history, but it does try to balance an emphasis that, when excessive, can prove misleading, as Schlueter himself acknowledges.Footnote 30 Spanish and British colonizers, and the institutions that they brought with them, certainly shaped Uruguay and New Zealand, but the modern history of these countries should not be told simply as a tale of two small neo-Europes, but also as one of very southern and non-European environments.Footnote 31
In particular, conditions of access to coal, which translated into significant differences in energy prices, contributed to keeping the income gap between the two countries open during one of their periods of fastest growth, the commodity-led boom before the First World War. In emphasizing the material realities of agro-industrial production, and the specificities of the natural resources on which New Zealand and Uruguayan economic development was built, this article attempts to contribute to the reassessment of the part played by the environment, which has been taking place in the comparative literature.Footnote 32 Álvarez, Bértola, and Porcile pointed to the development of a large mining sector in New Zealand and Australia, as a key to understanding the origins of their greater prosperity relative to Uruguay and Argentina.Footnote 33 Furthermore, and closely related to the argument pursued here, Bertoni and Willebald showed that the similarities in natural endowments between New Zealand and Uruguay should be greatly qualified in terms of energy resources, and explored the impact of this difference in the long-term development of the two economies.Footnote 34 Their study therefore pioneered a more systematic analysis of the part played by energy in the specialist literature. In this article, I try to move the discussion forward by tracing the effects of these two different energy economies on the choices of techniques and material processes behind meat production for export in New Zealand and Uruguay before 1914.
This analysis should be framed as part of the larger history of food production in settler economies during the First Globalization. In particular, Jeremy Adelman’s comparative study of the mechanization of the wheatlands of Argentina and Canada offers valuable insights for understanding the complex factors surrounding the choice of techniques in such contexts.Footnote 35 In these settings characterized by land abundance, labour scarcity, and a comparative advantage in export agriculture, Adelman found that the choice between alternative methods of production was not merely the result of comparing abstract production functions, but that it was framed by its broader social and economic context. In particular, and relevant to our comparison, producers were biased in favour of known techniques, which, in the case of meat production for external markets, had a much longer history in Uruguay than in New Zealand. The interrelatedness of technology also meant that previous investments affected the decision to buy new machines, which in our case suggests that, if a factory was already set up to produce meat extract, the opportunity cost of overhauling the whole operation to produce frozen meat became much higher.
Finally, the politics and economics of empire are crucial to our two stories, and allow us to place them in the broader comparative economic history of their larger neighbours, Australia and Argentina. The First Globalization was both a ‘golden era of resource-based development’ and a time of ‘imperialism of free trade’.Footnote 36 Given that Australasia and the River Plate were prime examples of resource-based developing economies, and sat at opposite ends of the formal/informal empire continuum, the comparison should also move us to reflect on the interplay between empire and resource-intensive capitalist development in the periphery.Footnote 37 For present purposes, it is important to consider whether Australia and New Zealand benefited from British direct investment and associated technology transfer in a way that Argentina and Uruguay did not, and whether that can contribute to explaining the persistent income gap between these countries.
The economic historiography on empire suggests that formal imperialism worked quite well with settler capitalism. Indeed, British imperial rule resulted in greater economic benefit for the ‘neo-Britains’ of Australia, Canada, and New Zealand than for the metropolis, which would explain the lateness of their final political independence.Footnote 38 Thus, Australasia received very large inflows of British investment during this period. New Zealand alone received £84 million by 1913, which was more than any other colony in per capita terms.Footnote 39 However, the River Plate’s position within Britain’s informal empire meant that not being a dominion was not an obstacle for receiving capital and technology transfer.Footnote 40 By 1913, British investment in Uruguay alone reached £47 million, including railways, gas works, factories, and other technology-intensive sectors. This exceeded Britain’s investments in many of her colonies at the time.Footnote 41 And yet, as Denoon argued in his seminal work, imperial preference may have given New Zealand and Australia an advantage over Uruguay and Argentina, and it clearly did so in terms of market access after the Ottawa Conference in 1931.Footnote 42 I would argue, however, that during the First Globalization the closeness of economic ties with Britain was more a similarity than a difference between these southern settler economies.
Coal prices in New Zealand and Uruguay
The export era centred on pastoral commodities was fossil-fuelled in both countries, but to a much larger extent in New Zealand, whose coal intensity (measured as coal consumed in physical terms divided by GDP in constant prices) was about four times higher than Uruguay’s, where coal imports just about managed to keep pace with economic growth before 1914 (figure 1). The transition from animal draft power and firewood to coal and coal-fuelled electricity was, therefore, much more intense in New Zealand, empowering the rapid development of the dairy industry and refrigerated meat-packing. The impact of this early adoption of refrigeration on New Zealand’s long-term development has been explored in detail in the local historiography, from the perspective of both economic development and ecological change.Footnote 43 Conditions of market access to coal can help us to understand how New Zealand managed this transition, which was crucial in building its ‘protein bridge’ to Britain.Footnote 44
Coal intensity in New Zealand and Uruguay, 1890–1911 (kilos of coal per US$1,000, in 2011 US$). Apparent consumption of coal is estimated as domestic production + imports − exports. Sources: New Zealand coal figures, New Zealand official year-book, 1891–1912; British Parliamentary Papers, Coal tables, 1912 and 1924. Uruguay coal figures: Anuarios estadísticos, 1891–1912. GDP from Bolt etal., ‘Rebasing “Maddison”’.

New Zealand had substantial coal reserves, and since the mid nineteenth century several coalfields and mines had been opened across the country, taking advantage of the relatively even distribution of the resource in both the North Island and the South Island.Footnote 45 In the three decades before the First World War, at least 85% of the New Zealand demand for coal was consistently supplied by domestic production, the rest being imported from nearby Australia.Footnote 46 In the event of an unexpected increase in demand, the mines in New South Wales could be counted upon to provide even more cheap coal with low transportation costs. Uruguay lacks coal completely, and in this period the demand was supplied almost entirely (92% on average between 1890 and 1911) by imports from distant Britain.Footnote 47
This stark difference in domestic resources was first systematically analysed by Bertoni and Willebald, who underlined the importance of disaggregating natural resources when comparing settler economies, going beyond an aggregate, homogenous ‘natural capital’.Footnote 48 Following that principle, a note on coal varieties is necessary, before considering prices and incentives. Coal is not a homogenous commodity; its energy density (how much heat can be obtained per unit of volume) varies depending on its shares of moisture, trace elements, and incombustible ash: levels vary from as low as 8 MJ/kg for poor lignites to 36 MJ/kg for good anthracites, with bituminous coals producing around 25–9 MJ/kg.Footnote 49 Half of New Zealand’s proven reserves c.1920 were bituminous or semi-bituminous coal, the other half being brown coals and lignites, while imports from New South Wales were of bituminous coal. This makes average energy-density levels broadly comparable with Uruguayan imports of British ‘steam coal’, which produced around 20–5 MJ/kg, below that of standard bituminous coal (which represented c.60% of New Zealand supply) but higher than brown coal and lignites (which accounted for the remaining 40% of New Zealand supply).Footnote 50 To avoid the complexities resulting from the diverse kinds of coal available in each country at the time, the price series presented in this article refer only to New Zealand’s own bituminous and semi-bituminous coal and Uruguay’s imports of British ‘steam coal’, so they can be straightforwardly compared.
Figure 2 shows the evolution of coal prices in New Zealand and Uruguay before 1914. The data for New Zealand refers to the price at the pithead, officially reported for the dominion in the Coal tables presented to the House of Commons between 1894 and 1924. The Uruguayan series has been estimated by adding the different components of the price of coal at Montevideo’s harbour and including the custom duties (figure 3 provides details of the components). It is a lower-bound estimate, as it takes the cheapest annual value for the Atlantic transportation of coal from the UK to the River Plate, as registered by the Angier reports for each year. For two years (1910 and 1911), the managers’ half-yearly reports and the accounts of the Central Uruguay Railway Company of Monte Video (CUR) provide the price paid by the firm for wholesale coal in Montevideo, which broadly coincides with my estimate for the price at the port.Footnote 51 Hence, even if, owing to middlemen, the wholesale price paid by producers for New Zealand coal was likely somewhat higher than the price reported in the Coal tables, the estimated price at Montevideo’s harbour was a likely minimum for the Uruguayan economy as well. The retail prices in both cases were therefore higher than the one presented here, but there is no reason to think the gap between pithead or port price and retail price was notably different in two countries of similar scale such as New Zealand and Uruguay. A British and an Australian series have been added, as they were the main coal exporters to Uruguay and New Zealand respectively. Britain also serves as a lower-bound reference for global coal prices, as the UK was the largest world producer and consumer of coal in this period, and it consistently enjoyed very low prices by any standards.Footnote 52 Finally, a Danish series has been added for reference, as a European case of a small economy which built its progress on energy-intensive export agriculture with almost no domestic energy resources.Footnote 53
Coal prices: New Zealand and Uruguay in context, 1887–1913, three-year moving averages (shillings per ton). Sources: New Zealand, Australia, and the UK: British Parliamentary Papers, Coal tables, 1894–1924; Denmark: Sofia Teives Henriques and Paul Sharp, ‘The Danish agricultural revolution in an energy perspective: a case of development with few domestic energy sources’, Economic History Review, 69, 3, 2016, pp. 844–69; Uruguay: author’s calculations (see figure 3). Uruguayan and Danish series refer to wholesale price at the ports of Montevideo and Copenhagen. The Australian, British, and New Zealand series refer to price of coal at the pithead.

The price of coal in Montevideo was on average more than two and a half times higher than in New Zealand, and five times more volatile.Footnote 54 These disparities can contribute to explaining why New Zealand producers adopted the most energy-intensive of meat preservation technologies (refrigeration) and why Uruguayan production remained anchored in the more traditional beef jerky and in the less capital- and energy-intensive technologies of canning and meat extract. They also need to be explained themselves, as they are not a foregone conclusion of domestic energy endowments.
Coal prices in New Zealand were very low and stable, not only compared to Uruguay, but also by global standards, for three main reasons. First, coal reserves were favourably distributed almost evenly between the North Island and the South Island.Footnote 55 Second, domestic production was, unlike in Britain, almost completely used for domestic consumption. On average, only 11% of coal production was exported, most of which went to coal bunkers in New Zealand ports, preventing external demand from becoming a destabilizing force in coal price formation.Footnote 56 Third, when necessary, coal imports came from a nearby low-cost producer, Australia. As internal demand expanded consistently throughout the period, domestic production increased accordingly, and the share of imports remained below 15%. Even if New Zealand was a net coal importer, between its domestic production and the cheap and stable prices offered by neighbouring New South Wales, its energy security was guaranteed. The frequency of round trip maritime transport between the two territories was very consistent throughout the decades, with arrivals and departures coinciding almost exactly.Footnote 57 New Zealand was an important market for the New South Wales coal industry, being the destination on average of 19% of exports between 1871 and 1914.Footnote 58 It was also important qualitatively. As noted by Bukley, the New South Wales overseas coal trade developed ‘as a by-product of the operational needs of the British shipping industry’, with the one exception of exports to New Zealand.Footnote 59
High coal prices in Uruguay cannot be simply attributed to dependency on imported energy, or even particularly on British coal. Denmark depended on it as well, but coal prices there were far lower, even if price movements, as in Uruguay, echoed and amplified those in the UK. Of course, Denmark’s location was much more favourable in terms of access to energy: north-western Europe is a region extremely rich in coal, whereas South America is one of the poorest in the world.Footnote 60 Yet we would expect the price of coal in Uruguay to start to converge with Denmark’s, as the costs of international maritime transportation fell significantly during the period. To understand why that did not happen, we must follow the coal cargo from Cardiff to Montevideo (figure 3).
Composition of coal prices at the port of Montevideo, 1887–1913, three-year moving averages (shillings per ton). Sources: pithead price and transport to Cardiff: John Williams, Digest of Welsh historical statistics 1700–1914, vol. 5, Cardiff: Welsh Office, 1985, data now available at http://doi.org/10.5255/UKDA-SN-4097-1 (consulted 9 December 2019); Atlantic freight: E. A. V. Angier, Fifty years of freight, 1869–1919, London: Fairplay, 1920; Uruguayan tariff: Anuarios estadísticos, 1891–1912.

A major source of volatility, and the main difference with the price levels of other coal importers, was the price of Atlantic freight from Wales to the River Plate. This price reflected the complex dynamics of international transportation routes, in which Uruguay was a price taker, and which were not solely determined by the late nineteenth-century victory of technological change over geographical distance achieved through compound engines, steel hulls, and increasingly powerful boilers.Footnote 61 Expensive and changing freight rates, particularly for British coal being shipped to the River Plate region, caused uncertainty about future coal prices in Montevideo, encouraging pre-emptive rises in price. Thus, the annual peak value of the Cardiff–River Plate freight rate reliably predicts the price paid for coal in Montevideo in the following year throughout the period 1897–1913.Footnote 62 It was a case of particularly narrow energy dependence, compounded by an unlucky position in freight dynamics. Cardiff’s relevance for the Uruguayan economy can be traced beyond energy statistics: in 1910 it was second only to Buenos Aires as a port of origin for all steamships entering Montevideo.Footnote 63 Finally, Uruguay’s tariff policy, while effective for fiscal revenue, did not help its energy economy.Footnote 64 An ad valorem customs duty of 6% on imported coal, calculated over an extremely inflated fixed administrative value for coal (42.5 shillings per ton), was in practice a specific tariff of 2.5 shillings per ton, which did not respond to changes in price, and which made coal even more expensive.
Coal and meat production during the First Globalization
While (Uruguayan) beef and (New Zealand) mutton were two different meats, their economics were not fundamentally different, for the simple reason that, unlike pork, beef and mutton were both preferred as fresh as possible. Shipping meat halfway across the world, as producers in both countries needed to do in order to reach their European consumers, was a major logistical challenge, and it had far-reaching economic and environmental consequences, as Cronon has shown for the case of contemporary producers in Chicago. They faced a similar problem within their domestic market, as they tried to supply East Coast urban consumers with the by-products of the cattle herds of the Great West.Footnote 65 The diverse techniques for the preservation of beef and mutton available in the late nineteenth century had different factor biases, different energy intensities, and produced commodities that were at varying distances of quality from the superior product (fresh meat).Footnote 66 The closer they resembled it, the faster demand for those products would grow as a response to increases in consumers’ incomes.
The traditional method of meat preservation – curing and preserving with salt – was capital- and energy-saving, and resulted in strips of beef jerky (called tasajo or charqui in Latin America). This was Uruguay’s key export staple to the plantation economies of Brazil and Cuba for more than a century, but it was not suitable for the increasingly sophisticated international demand during the First Globalization. The main input, besides cattle, in the saladeros (meat-processing plants established from the late eighteenth century onwards) was salt. The infrastructure required, as well as the scale economies, was minimal.Footnote 67
Of the modern technologies, the production of beef extract, patented by Justus von Liebig in the 1860s, and produced on a large scale for the first time in Fray Bentos on the Uruguay river, was the most land-extensive, as it gave small yields per cow. Cattle flesh was pressed into a pulp with iron rollers, then dropped into hot water, and, after removing some of the fat, pressured into thick gravy, which was then packaged. About 3 kg of meat were necessary to make 100 g of extract.Footnote 68 Hailed in Britain as ‘the juice and essence of the strong oxen now feeding on the Pampas’, the beef extract marketed as OXO became a symbol of Uruguay’s global position in the industry.Footnote 69
The boiling down and pressing of cattle meat to produce tinned beef, such as the flagship Fray Bentos corned beef, was a much-improved version of Liebig’s method, resulting in a product with higher unit value and income elasticity of demand. Meat was chopped and tightly packed in characteristically rectangular-base cans, which would become a staple of British household larders and military rucksacks. Unlike tasajo, it required significant quantities of energy to boil down the flesh and to hermetically seal the cans, but the produce could then be easily and cheaply stored and transported, as it required no more than a cool dry place.
The most sophisticated method of meat preservation of the late nineteenth century marked a break from all the previous ones. Ammonia-cycle, steam-powered refrigeration had a fundamentally different factor bias, requiring large supplies of coal, not only to freeze the carcasses initially but also to keep them cold for twenty-four hours a day. It also needed sophisticated and expensive transportation, both to a port and across the ocean. In the 1900s, the specialized freight required by frozen meat was on average three times more costly per ton than the transport needed by corned beef, tasajo, and meat extract.Footnote 70 On the upside, chilled and frozen meat had a higher unit value, somewhat compensating for transportation costs, and a much higher income elasticity of demand, only second in the meat market to fresh beef and mutton, which were generally reserved for the upper classes in European cities.
In this technological context, where steam and coal still reigned supreme, the choice of technique differed greatly between New Zealand and Uruguay. Already by 1890, 87% of the total value of New Zealand meat exports were frozen, whereas in Uruguay that figure would remain under 10% until 1907 (figure 4). New Zealand’s rapid transition to refrigerated meat production was a deliberate response to the stiff competition it faced from agrarian producers that were much closer to Britain, and that offered comparatively shorter supply chains. Uruguay was only one of them, and by no means the most challenging. Argentina, Canada, and the United States benefited from scale economies in food production, which New Zealand pastoralism could never attain, while Denmark was ideally situated to supply Britain with farm products.
Frozen meat as a share of the total value of exported meat, 1882–1913, three-year moving averages (%). Sources: New Zealand: Gerard T. Bloomfield, New Zealand: a handbook of historical statistics, Boston, MA: Hall, 1984; Uruguay: Julio Millot and Magdalena Bertino, Historia económica del Uruguay, tomo II: 1860–1910, Montevideo: Fundación de Cultura Universitaria, 1996.

Geographical location strongly encouraged New Zealand producers to focus on high-unit-value commodities, which required freezing works and refrigerated transportation. Choosing quality over quantity, and stressing product differentiation, was perhaps the only viable export strategy for a small-scale agrarian producer subject to extremely high freight costs. Showing an insider’s knowledge of the market, in 1898 New Zealand’s Agent-General in London reported to his Minister of Agriculture after his first year in Britain:
Quality, and quality only, enables and will enable our meat to hold its own against its cheaper competitors. The main desiderata, then, are: (1) That the quality should be rigorously preserved; (2) that it should be advertised widely and perseveringly amongst the English middle classes; (3) that efforts should be made by which the wholesale dealers should supply New Zealand meat to retail butchers who will agree to buy no other foreign meat; (4) that all foreign meat should be marked not only as foreign but with the country of its origin.Footnote 71
His advice on marketing was followed by some tenants of the Smithfield Market, who asked the superintendent to have a sign reading ‘New Zealand meat producing companies’ on their shops.Footnote 72
In contrast, the lateness with which freezing works were established in Uruguay – the country with the highest ratio of cattle to people in the world then and nowFootnote 73 – cannot be explained away simply by a lack of capitalist ethos, nor by government policies (or lack thereof) stifling adoption of innovations. Indeed, Charles Tellier (the French père du froid) was funded by Uruguayan producers to develop refrigerated transport, and the first port at which the Frigorifique called south of the Equator was Montevideo, five years before the Dunedin made its famous journey from Port Chalmers to London, inaugurating the frozen mutton trade in 1882.Footnote 74 The Uruguayan government offered incentives to refrigeration as well. A law of 1885 guaranteed significant subsidies to firms that used modern procedures to export frozen meat.Footnote 75 Tax exemptions were also offered on a case-by-case basis to large factories. As early as 1872, Liebig’s Extract of Meat Company applied for, and was granted, permission to import machinery and coal duty-free for a decade, to encourage the renewal of its factory in Fray Bentos.Footnote 76 Despite these efforts, and even if the first frozen meat factory, Frigorífica Uruguaya, started production in Montevideo in late 1904,Footnote 77tasajo remained the main export staple of the Uruguayan meat industry until 1913, which made canned meat exports appear capital-intensive by comparison.Footnote 78 The first of the transnational meat-packing corporations to arrive in the country, Swift & Company, started producing frozen meat that year, but most of its output was still meat extract and canned beef.Footnote 79 The latter was the main beneficiary of the end of tasajo’s long reign, and continued to challenge the rise of frozen and chilled meats as the leading export staple until the Second World War.
Energy-intensive and energy-saving meat factories
Factor ratios in general, and access to coal in particular, hold a key part of the explanation both for New Zealand’s precocity and for Uruguay’s tardiness in adopting steam-powered refrigeration in meat exporting. The industry structure in New Zealand was not made in the large-scale image of the American Midwest. By 1913, there were twenty-eight freezing works in New Zealand, representing more than a third of all the meat-packing plants in the southern hemisphere, but they were comparatively small in size, and scattered throughout both islands.Footnote 80 Would these small and medium-sized freezing works have made a profit if they had been faced with the coal prices prevailing in Uruguay?
That counterfactual question can be approached at a micro level by relying on firm-level data on the two single largest meat-packing factories in the two countries: the Canterbury Frozen Meat Company’s plant in Belfast, near Christchurch, and Liebig’s Extract of Meat Company’s factory in Fray Bentos, 300 kilometres north-west of Montevideo. Both factories were surrounded by, and benefited from, a large pastoral hinterland (the Canterbury and Río Negro provinces), and had immediate access to a port suitable for long-distance shipping (Lyttleton on Pegasus Bay, and Fray Bentos on the Uruguay river), and thus led their respective countries’ meat export trade. The landowners, farmers, and ranch hands breeding the bullocks and lambs in those pastoral hinterlands were connected with the global economy, not only because they were the first to create the value of the commodities that were ultimately traded on a global scale, but also because they received news of the prices of those commodities in European markets through the local press. Río Negro’s La Campaña and Canterbury’s Star, which both reached rural areas, published not only the financial results and slaughter statistics of the factories, but also the telegrams with the most recent prices for pastoral commodities in Liverpool and London.Footnote 81
Work in cattle breeding and its main downstream industry, meat processing, was characterized by strong seasonality. I therefore compare slaughter seasons for Canterbury and Fray Bentos, which occurred between spring and autumn, when most of the plant personnel were on active duty. The scale of the factories was different, with Liebig’s employing more than four times as many workers during the slaughter season, but they were both representative of the meat-producing industries of their respective countries, as the single largest factory in terms of livestock slaughtered per year. The difference in the absolute numbers of animals processed points to the fact that New Zealand’s industry structure was far less concentrated than Uruguay’s. Source availability made it impossible to compare the operations during the same year, but, given that technologies in meat production, maritime freight costs, and factor ratios in the economies under study did not change significantly between our two benchmark years, the comparison is still plausible.Footnote 82 Comparing values also raises the issue, familiar to economic historians, of dealing with different price structures and levels. The comparison is still valid for at least two reasons. First, both countries were on the gold standard, which in the period before the First World War was characterized by low average inflation rates, which somewhat curbs the problem of changing price levels. Second, and more importantly, the key aspects in this firm-level comparison are relative to their own price structure rather than absolute price levels (the impact of the coal bill compared to wage costs, and the profit margin of each factory), and are therefore not affected by the problem of changing price levels.
I use the dataset for minimum wholesale coal prices (introduced in the second section) to estimate the coal bill of each factory (table 2). Given that in New Zealand the meat industry concentrated on mutton, whereas in Uruguay it focused on beef, I standardize the number of animals using livestock units (LUs), following the coefficients provided by Barnard and Nix.Footnote 83 In open-air grazing systems, as New Zealand’s and Uruguay’s, LUs calculated in this way usefully reflect the acreage of pastureland required to feed the bullocks and lambs destined for the killing floor, revealing the material realities of the production process as a whole, and allowing a better understanding of the factor biases in meat production.
Belfast works of the Canterbury Frozen Meat Company and Fray Bentos factory of the Liebig’s Extract of Meat Company, production results for the slaughter seasons of 1895 and 1908 respectively
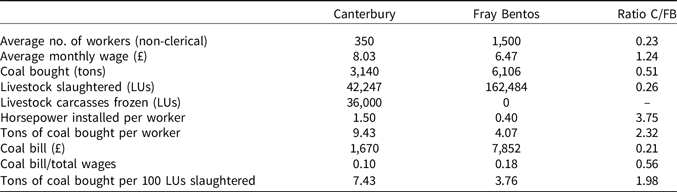
Notes: livestock slaughtered were almost invariably lambs and sheep in Canterbury and calves and cows in Fray Bentos. They have been converted to livestock units (LUs) according to their land requirements as per the coefficients in Christopher S. Barnard and John S. Nix, Farm planning and control, Cambridge: Cambridge University Press, 1980, pp. 345–6. An LU of 1 represents a mature dairy cow. Values in Uruguayan pesos were converted to sterling using the gold standard exchange rate prevailing at the time.
Sources. For Canterbury: ‘The Canterbury land district’, New Zealand Statistical Yearbook 1894; Star (Canterbury), issue 5237, 1 June 1895. For Fray Bentos: Dirección General de Estadística, Censo general de 1908, pp. 1191 and 1209; Anuario estadístico, 1909–10, p. LXXVIII; and ALA-CD, ‘Libro de importaciones, 1908–1912’. Coal bill calculated on the basis of the coal prices shown in figure 2.
The Canterbury freezing works were far more energy- and capital-intensive than the production of salted meat, canned beef, and beef extract that was carried out in Fray Bentos: installed capacity per worker was more than three times higher, and coal usage per worker was more than twice as high. Conversely, the Fray Bentos production was comparatively land-extensive and energy-saving: the ratio of tons of coal per LU slaughtered was about half of Belfast’s, LUs being a proxy for the pastoral land required to raise the livestock.Footnote 84 As a result of its workers being powered by less inanimate energy, the Fray Bentos factory also seems labour-intensive in the comparison. Finally, average wages were lower in Fray Bentos, by an almost identical margin to the GDP per capita differential separating the two countries.Footnote 85 All these ratios at the firm level bear similarities with those at the macro, economy-wide level. Uruguay had more pastoral land, more livestock, and a slightly larger population, but worse conditions of access to coal. Modern energy shows in this comparison its long-term characteristics: strong complementarity with capital and a bias towards saving labour and land.Footnote 86 Finally, it should be noted that the coal bill relative to the labour costs was much higher in Fray Bentos than in Canterbury, which suggests that, had coal been cheaper in Uruguay, Liebig’s could have used more energy-intensive technologies.
Arguments in history are often implicitly counterfactual, even if we do not always admit to it. In comparative history it is sometimes useful to turn implicit counterfactual statements into explicit questions: what would have happened if the Canterbury freezing works had faced the coal prices prevailing in Uruguay at the time? That is ultimately the only way to test hypotheses that argue that relative prices of inputs affected choices of techniques and the adoption of technology. In this sense, the critics of coal as a relevant factor behind the initial locations of modern economic growth have pointed out that showing coal price differentials is not enough, since producers cared about total costs, not individual input prices, and the energy bill represented a comparatively small share of costs.Footnote 87 Those arguments hold in part for the present case, as the minimum coal bill represented about 7% of the total costs at the Canterbury works in 1895.Footnote 88 Nevertheless, given the necessary nature of coal for frozen meat production in this period, and the fact that it could not feasibly be substituted by other energy carriers, a significant change in coal prices would have greatly affected dividends, since consuming less coal was not an option. According to its accounts, published in the contemporary press, the Canterbury Frozen Meat Company’s dividends in 1895 would, other things being equal, have decreased from about 8% to 1%, had it bought coal at the minimum estimated wholesale price in Uruguay (table 3).
Canterbury Frozen Meat Company’s cash flow in 1894 and counterfactual applying Uruguayan coal prices

Sources: Canterbury Frozen Meat Company’s annual accounts published in Press, issue 8748, 21 March 1894. Counterfactual constructed using Uruguayan coal prices presented in figure 2.
As the New Zealand–Uruguay comparison illustrates, when factor ratios and political conditions make wages comparatively high and inelastic, and geography and technology make transport costs expensive, an increase in the price of energy can render the whole operation unprofitable. Because of their scale, even if they were highly specialized in a handful of commodities, both economies can be considered ‘small countries’, in the sense that trade economists give to the term, so that they could not affect the international prices of their main export commodities. In such settings, profit margins and the incentive to innovate did depend on the conditions of access to coal, even if that access did not represent a quantitatively large part of total costs. In the Uruguayan case, it made sense for individual firms to continue to specialize in meat extract, canned meat, and beef jerky in the short term, even if this resulted in lost opportunities from an economy-wide and long-term perspective. Indeed, Liebig’s Extract of Meat Company had one of the best profit records of any British company in Latin America.Footnote 89
Thinking in terms of staple theory, from the perspective of economic development, specializing in frozen meat is not only better than specializing in canned beef because of its higher income elasticity of demand, but also because of its linkages and spill-over effects.Footnote 90 The relative lag of about three decades between the adoption of frozen meat as the leading export in the industry in Uruguay, compared to New Zealand, holds part of the key to the persistence of the income gap between these two small settler economies during the era of export-led growth in the late nineteenth and early twentieth centuries. In turn, coal prices contribute to explaining why New Zealand, a country with fewer livestock in absolute and relative terms, and less natural pasture, became a leader in the frozen meat trade, whereas Uruguay, the most cattle-abundant country in the world, was a latecomer to the industry.
Conclusion
Geographically distant, New Zealand and Uruguay were in some sense neighbours, as their agrarian produce shared and competed for ocean liners, market stalls, and pantry shelves. They were also linked through more direct, South–South, economic and environmental connections: Uruguayan grass seeds were grown in New Zealand, from where Corriedale sheep were shipped to the River Plate to produce ‘Montevideo wool’, using presses made in Wairarapa.Footnote 91 This kind of mutual intervention would render the comparison invalid if it were defined in terms of a ‘natural experiment’, because each ‘experiment’ should be wholly independent from the other. In history, however, societies are not confined to Petri dishes, so comparisons must sometimes be made in the context of connections. Indeed, as the literature on histoire croisée and ‘entangled histories’ argues, that is often the only way to do it.Footnote 92 When seen through such a lens, late nineteenth-century New Zealand and Uruguayan workers on the grazing range, as well as the killing floor, and the ruminants who made the journey between them, emerge as part of the same global history. Their part in that history was fundamentally shaped by grass, a feature of their landscapes that is sometimes taken for granted, but that was indisputably their main crop.Footnote 93
This article has argued that the conditions of access to coal contributed to shaping the way in which New Zealanders and Uruguayans worked their grass and their animals during the First Globalization, when terms of trade favoured temperate agricultural producers and, in so doing, fashioned production techniques, export structures, and development paths. Large-scale hydropower and national electrical grids would later make coal prices irrelevant for refrigerated meat production, but by then the tail winds of the First Globalization had turned, and the window of opportunity for peripheral agricultural export economies was closing.
Economic development in New Zealand and Uruguay during the First Globalization (and elsewhere in the periphery where a transition to modern economic growth developed through export agriculture) was not merely a mechanical response to increasing Western demand for foodstuffs. Nor was it a foregone conclusion of technological breakthroughs in the productive and transportation uses of steam power, necessary though these were to defeat the tyranny of distance.Footnote 94 By looking at the material reality of meat production and preservation in New Zealand and Uruguay, and comparing relative prices and costs in that context, this article has argued that the way in which supply responded to international demand was shaped in each country by its specific natural resources, and by their conditions of access to modern energy. Those responses, interacting with socially constructed institutions and constraints, led to different choices of productive technique, industry structures, and specialization patterns.
The results presented here will hopefully encourage more comparisons to further discuss the role of coal beyond Western industrialization, its traditional realm in economic historiography. Relating specifically to our two cases, if the estimates on coal supply and prices are reasonably good, they could spark further research into the ecological consequences of the development of rural capitalism in New Zealand and Uruguay, small countries where environmental change can arguably be more easily traced in the historical record. More generally, the results presented here suggest that nature’s role in past (and present) economic development is lost by reducing it to ‘natural capital’, as the environment’s economic contributions cannot always be tallied, aggregated, and compared with other assets. ‘Natural resource abundance’, or ‘land abundance’, does not mean any one thing, because resources are specific and interact with each other: coal and grass in New Zealand produced a different outcome than grass alone did in Uruguay.
Emiliano Travieso is a PhD candidate at King’s College, Cambridge and a member of the Cambridge Group for the History of Population and Social Structure (CAMPOP). He is interested in Latin American, comparative, and global economic history, focusing on agriculture and natural resources. His doctoral research centres on the relationships between economic development and the environment in Uruguay before 1914.


 Open access