

Introduction
Meltwater infiltration into sub-freezing snow can induce various percolation facies including melt–freeze crusts and ice layers within the snowpack which may act as stratigraphic barriers and impede the downward flow of water. Over non-temperate glaciers and in high-altitude snowpacks these impediments can significantly affect cold-snow hydrology, glaciation processes and snowpack characteristics. A long-standing experience on the onset of avalanches has revealed wet layers on the snow surface that thereafter freeze into crusts and may present bed surfaces for slab avalanches (Reference McClung and SchaererMcClung and Schaerer, 1993; Reference JamiesonJamieson, 2004). Impermeable buried ice layers and melt–freeze crusts within snowpacks are recognized as bed surfaces for growth of faceted grains (weak layer) and may affect snowpack stability and consequently the release of avalanches (Reference Adams and BrownAdams and Brown, 1983; Reference Jamieson and JohnstonJamieson and Johnston, 1997; Reference Colbeck and JamiesonColbeck and Jamieson, 2001).
A stratigraphic barrier within the snowpack can complicate and divert the flow patterns at individual layers and can affect the hydrological response and consequently the run-off from snow. The effect of stratigraphic layers on the flow of water through snow was described by Reference ColbeckColbeck (1975) who mentioned that significant distortion of the flow field can occur at coarse–fine–coarse textures of the snowpack. Reference Wankiewicz, Colbeck and RayWankiewicz (1979) found that the flow across any stratigraphic boundary can be retarded, accelerated or can be unaffected, depending on the snow textures. He reported that flow can be retarded at a fine-to-coarse transition due to stronger capillary effects in fine-grained snow than in coarsegrained snow. At fine-grained layer, water flow encounters reduced intrinsic permeability which reduces flow velocity (Reference ColbeckColbeck, 1973a). The formation of an ice layer at a fine-to-coarse transition was reported by Reference WakahamaWakahama (1968). In the numerical modelling of infiltration and refreezing of melt-water, Reference Pfeffer and HumphreyPfeffer and Humphrey (1998) investigated the significant factors behind the growth of stratigraphic ice layers, which include the initial temperature, water input rate, impermeable layer thickness and the grain-size and density contrast across the boundary. They showed that at a stratigraphic fine-to-coarse transition, a breakthrough can occur if the infiltration rate is larger than the refreezing rate, and conversely an ice layer may form if the refreezing rate is larger than the infiltration rate. Reference Pfeffer and HumphreyPfeffer and Humphrey (1996) described the mechanism for the formation of impermeable horizons in sub-freezing snow by calculating the internal energy production interpreted as latent heat of refreezing. Heterogeneous infiltration into snow can occur through complicated pathways, giving rise to various heterogeneous percolation facies under prevailing refreezing conditions. Reference Pfeffer and HumphreyPfeffer and Humphrey (1998) discussed the developments of three-dimensional (3-D) structure of ice layers, pipes and water pathway along the heterogeneous stratigraphic boundaries under heterogeneous infiltration and refreezing processes. The heterogeneous water flow through snow was discussed by Reference ColbeckColbeck (1979), highlighting the development of fingers at low liquid water saturation by many crusts and ice layers present within stratified snowpacks.
In a sub-freezing snowpack, subsurface melting can occur due to penetration of shortwave solar radiations to a certain depth. Using frequency-modulated continuous-wave (FM-CW) radar measurements, Reference Koh and JordanKoh and Jordan (1995) investigated subsurface melting within a sub-freezing snow-pack due to penetration of shortwave radiation. The presence of liquid water in snow may limit the penetration of solar radiation. In their numerical modelling Reference Pfeffer and HumphreyPfeffer and Humphrey (1996) assumed that solar radiation would only penetrate the top 10–20 cm of the snowfalls..
Grain clustering and growth of melt–freeze polycrystals (International Classification for Seasonal Snow on the Ground (ICSSG) class 6b; Reference ColbeckColbeck and others, 1990) are primarily caused by the presence of liquid water. Reference ColbeckColbeck (1973b) found that clustering among the grains can occur at low water saturation and grain clusters develop due to minimization of free surface energy (Reference ColbeckColbeck, 1986). At low liquid water content, the clustered grains are bonded together by ice-to-ice contacts, not predominately by capillary forces (Reference ColbeckColbeck, 1987a, Reference Colbeck1997). However, the liquid water is held by the capillaries or interstices between the grains, and the ice-to-ice bonds grow as soon as this water refreezes. Therefore, the clustered grains are well bonded together, giving them considerable strength (Reference KinositaKinosita, 1963; Reference ColbeckColbeck, 1979). Under multiple melt–freeze cycles, grain clusters transform into melt–freeze polycrystals (Reference ColbeckColbeck, 1987a) which may finally develop into crusts of considerable hardness. Figure 1 shows thin-section images of clustered rounded grains and melt–freeze polycrystals for snow (images collected using an optical microscope under transmission of polarized light).
Thin-section images of snow samples recorded by a MZ-16 optical microscope under polarized light: (a) clustered rounded grains; (b) melt–freeze polycrystals.

Impermeable horizons at fine-to-coarse transitions within a layered sub-freezing snowpack are evident from past investigations (Reference WakahamaWakahama, 1968; Reference ColbeckColbeck, 1973a; Reference Pfeffer and HumphreyPfeffer and Humphrey, 1996, Reference Pfeffer and Humphrey1998). In this work, an attempt was made to develop semi-permeable or permeable horizons within sub-freezing homogeneous snow under controlled laboratory conditions. Subsurface melting was caused by penetration of intense radiation generated by a sun simulator that can more or less imitate the natural solar cycles. Clustered rounded grains (class 6a) were grown from snow consisting of small rounded grains (class 3a). Subsequently, under multiple melt–freeze cycles, the clustered rounded grains transformed into melt–freeze polycrystals (class 6b), and finally into semi-permeable melt–freeze crusts. The mass distributions among the clustered rounded grains and the melt–freeze polycrystals were studied with respect to the melt–freeze cycles. As the growth of melt–freeze polycrystals depends on liquid water saturation and sub-freezing temperatures (Reference ColbeckColbeck 1986, Reference Colbeck1997), we studied the mass growth of melt–freeze polycrystals as a function of liquid water saturation at –6°C. The vertical distributions of water saturation within different stratified sub-layers were recorded with the help of a parallel-probe saturation profiler (PPSP) device, developed by Reference Kapil, Prasher, Chasmai and SatyawaliKapil and others (2009). The dependency of intrinsic permeability for stratified sub-layers of snow on collective saturation (cumulative saturation values) was studied to monitor the evolution of impermeable horizons within the snow. In repeated transects of the snow sample exposed to multiple melt–freeze cycles, the semipermeable and impermeable (ice-layer) horizons were manually identified through stratigraphic mapping of snow.
Experimental Methods
Heterogeneous textures can be introduced within subfreezing snow of homogeneous composition by subsurface melting due to absorption of shortwave radiation. The melt can enhance clustering and coarsening among the grains. With the growth, the void ratio of snow decreases, resulting in reduced permeability. The Reference ShimizuShimizu (1970) relation for intrinsic permeability (k) can be rewritten in terms of void ratio (V R) as follows:
where dm is mean grain size of snow, and ρ I and ρ W are the densities for ice and water, respectively. To estimate the void ratio for any snow sample, its microstructure was analysed. The microstructural images for snow samples, collected from different sub-layers corresponding to different melt–freeze cycles, can be grabbed through X-ray microtomography of individual samples. Thus, the intrinsic permeability can be calculated using Equation (1).
Sample preparation and extraction of the samples for X-ray microtomography
In order to monitor the evolution of impermeable horizons within the homogeneous snow, the experimental observations were recorded from a manually grown block of homogeneous snow. This sample was composed of small rounded grains (class 3a) with mean grain size <1.0mm, segregated from the old natural snow sample. These grains were gently deposited over the hard impermeable base of an insulated wooden box (60 cm × 40 cm × 50 cm), as shown in Figure 2. Environmental conditions were maintained at - 15°C during sample preparation, but at -6°C for the duration of the experiment. To grab the X-ray microtomography images from various snow sub-layers for each melt–freeze cycle, sampler tubes (diameter 11 mm, height 44 mm) were fixed within the snow during deposition of the grains inside the sampler box. Snow grains were classified according to Reference ColbeckColbeck and others (1990), i.e. small rounded grains (class 3a), clustered rounded grains (class 6a), melt–freeze polycrystals (class 6b) and melt–freeze crust (class 9e). Experimental work was carried out in an environmental cold chamber (+30 to -40°C (±1.0°C)) at SASE, Manali. After the initial aging of approximately 43 hours, the snow sample was sub-stratified into 12 equal proportions marked by labels S1, S2, … S12 (Fig. 2). During the course of the experiments, sublayer thicknesses were observed to vary approximately from 4 to 3 cm, due to densification and settlement processes within snow. To maintain sample thickness, the sub-layer thicknesses were considered fixed by dividing the total sample height into 12 equal parts, during each vertical sectioning of the sample. After every melt–freeze cycle, the snow sample was segmented vertically into approximately 8cm thick sections along its length (60 cm) for 7 days consecutively.
Sub-layer stratification within a homogeneous block of snow of small rounded grains (class 3a).

The effect of sublimation on mass loss was assumed negligible as compared to the total mass of the sample. This assumption is justified since wind activity in the cold chamber was very small. The fraction of clustered rounded grains decreased, and the fraction of melt–freeze polycrystals increased, within the snow mass for ongoing melt–freeze cycles. This is explained by the mass growth of melt–freeze polycrystals at the cost of mass loss of clustered rounded grains. After every freeze cycle, the sample was sectioned vertically to obtain the positions of the sub-layers and its structure including grain-size distribution density, thickness and position of crusts, and also the volumetric compaction of the sample. Thereafter, the empty sampled space was refilled with small rounded grains (segregated from old snow) to prevent stray effects of radiation onto the sample. From each sub-layer a sample was collected for X-ray microtomography and scanned at a resolution of 5 μm with a SkyScan 1172 tomograph (Belgium). The void ratio was determined according to Reference EpsteinEpstein (1989) and Reference Kaempfer, Schneebeli and SokratovKaempfer and others (2005). The intrinsic permeability of snow was estimated using Equation (1).
Radiation source and profiling of liquid water saturation
To simulate the natural solar cycles under laboratory conditions, a sun simulator (SolarConstant 2500, KHS, Germany) was used to illuminate the snow sample. This system consists of two radiation units of metal halide sources (2.5 kW each) in the spectral range 280–3000 nm. The spectral densities of this source are nearly equivalent to that of the natural solar spectrum. In this system the solar cycles can be imitated and controlled with the help of an electronic power supply (EPS) module for different density filters. The EPS module can regulate the radiation intensity up to 50% of the peak intensity (1297Wm−2), and, below this intensity, density filters can be used to control the intensity minimum up to 8% of the peak intensity. After installation of the sun simulator inside the cold chamber, spectral densities were calibrated with the help of a standard pyranometer. Radiation intensity can thus be modulated between 96 and 1300Wm−2 over an area of 100 cm × 50 cm with non-uniformity of ±5%. Figure 3a shows the experimental set-up for the sun simulator inside the cold chamber (SASE, Manali) illuminating a snow sample. Any radiation cycle can be simulated through a DOS-based ‘SOLSIM’ program via a personal computer. In the present arrangement, initial warming-up time for the radiation unit is 600s, so this time lag is inherently introduced between two consecutive cycles. The snow sample (Fig. 2) was periodically exposed for 168 hours. The duration of a melt cycle (light pulse) was 3 hours, whereas the duration of a freeze cycle (dark pulse) was 16 hours at -6.0°C.
(a) Experimental set-up for solar simulator illuminating a snow sample in the environmental cold chamber at SASE, Manali. (b) The PPSP device used to record the liquid water saturation in snow.

In the present set-up, a PPSP device, developed by Reference Kapil, Prasher, Chasmai and SatyawaliKapil and others (2009), was used to record the vertical distributions of meltwater saturation within the snow previously exposed to the radiation (Fig. 3b). This device consists of two vertically moving parallel probes of stainless steel which support two electrical sensor tips of copper to detect the liquid water content and correspondingly the liquid water saturation.
Results and Discussion
Effect on snow density
Grain-size distributions were recorded from the snow sample for different sub-layer stratifications. The mean grain-size distributions for percentage masses of the top sub-layer (S1), middle sub-layer (S6) and bottom sub-layer (S12) were observed to follow the log-normal distribution
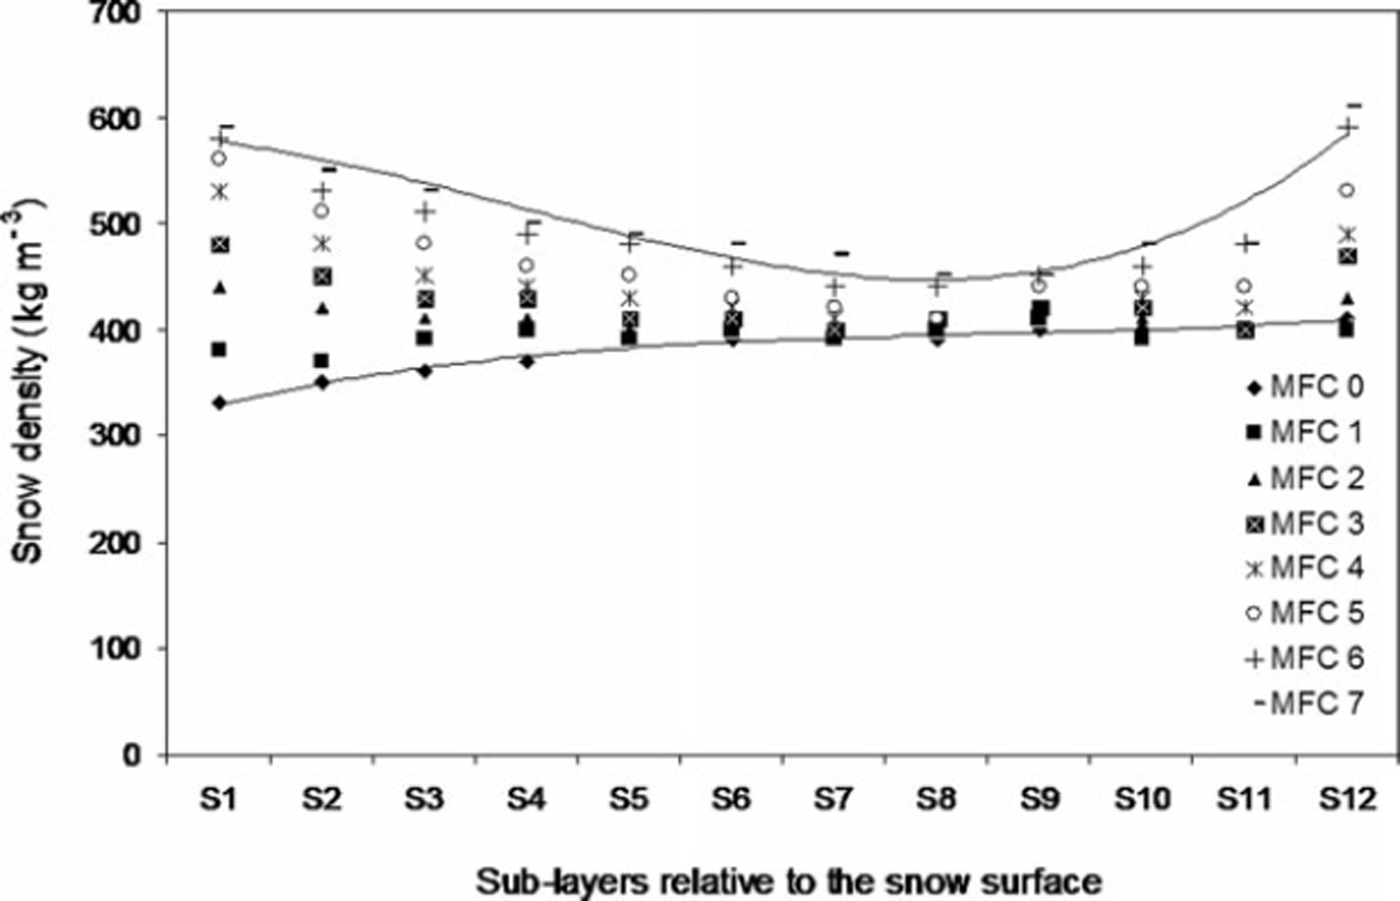
where dm is the mean grain size of snow (geometric mean, dm = (d 1 d 2)1/2, of a grain-size range d 1–d 2), d av is the average of the mean grain sizes, and a is the standard deviation for the mean grain sizes. However, with the melt–freeze cycles the snow texture including density changed significantly within different sub-layers. The density variations for sub-layers S1, S2… S12 corresponding to different melt–freeze cycles (MFC) are shown in Figure 4. These results show that the density variations in the topmost (S1) as well as in the bottommost sub-layer (S12) were larger than that of the middle sub-layer (S6). Densities in sub-layers S1-S4 and S11–S12 increased significantly, but the density increase for S5-S10 was small. Since S1 directly interacted with the radiation, the effect of radiation on density was expected to be large. For S2–S4, the increased densification was due to the interaction of melt-water flowing downward from S1 to adjacent layers and the meltwater generated by subsurface melting due to the penetration of intense radiation (Reference Koh and JordanKoh and Jordan, 1995). Also, the increased densities within bottom sub-layers (S11 and S12) were due to the accumulation of meltwater (generated at the top sub-layers) above the impermeable base. The meltwater flowed through various preferential channels. In sub-freezing snow these flow paths give rise to various percolation facies, i.e. finger-like, stem-like, root-like and zigzag patterns. Vertical flow paths may be identified by ice columns. The flow paths were clearly visible in a comprehensive 3-D view of the sample, but in a two-dimensional section these channels may not be clearly visible. Due to capillary action in the upward direction, saturation levels of the sub-layers in the vicinity of the impermeable base can increase significantly. Meltwater flowing through various flow paths and meltwater accumulating in the bottom layer can cause further melting as well as further coarsening of the grains, which may increase the bottom density.
Variations in the snow density within different sub-layers of the snow sample for different melt–freeze cycles.
Growth of melt–freeze polycrystals
The effect of shrinkage and coarsening redistributed the mass among the grains from smaller grains (clustered rounded grains) to larger grains (melt–freeze polycrystals). For clustered rounded grains this is shown in Figure 5a and b respectively for top (S1), middle (S6) and bottom sub-layers (S12). From this figure it is clear that for each melt–freeze cycle the mass redistribution proceeds from clustered rounded grains to melt–freeze polycrystals.
(a) Mass loss (%) of clustered rounded grains (class 6a), and (b) mass growth (%) of melt–freeze polycrystals (class 6b), within top sublayer (S1), middle sub-layer (S6) and bottom sub-layer (S12) with ongoing melt–freeze cycles.
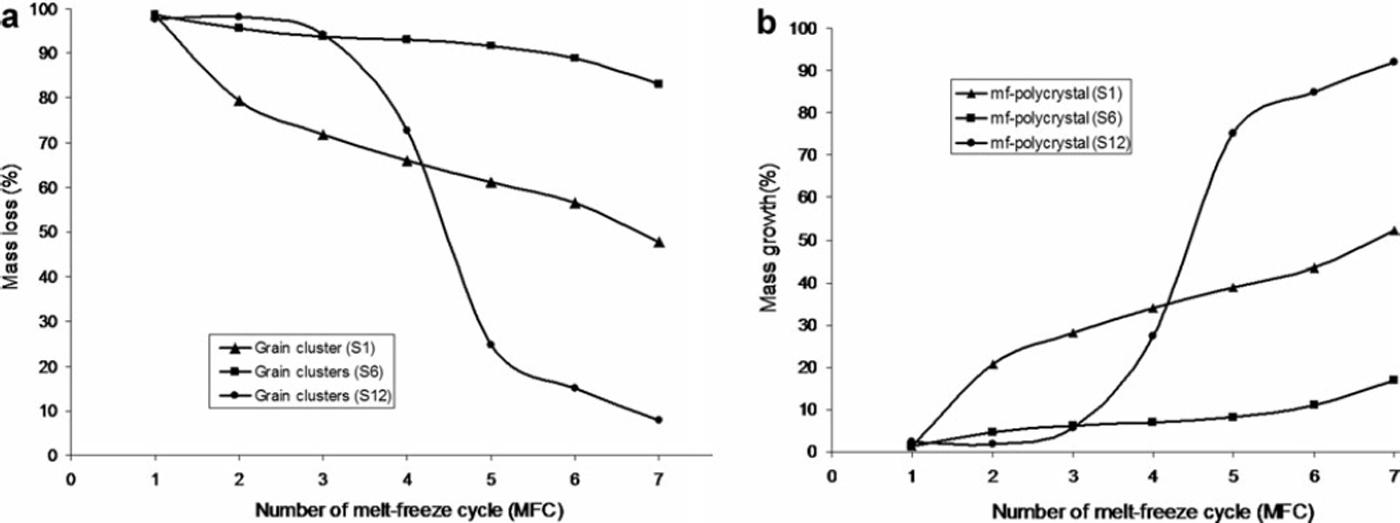
The effect of radiation on the top sub-layers was most prominent, so that the mass loss of the clustered rounded grains and the mass growth of melt–freeze polycrystals were largest within the top sub-layers during the first few melt–freeze cycles. The effect of radiation on S6 was smaller than on S1, but after the second melt–freeze cycle, radiation also started to affect the middle sub-layers. The effect of melt–freeze cycles on S12 seems very peculiar; during the first few cycles no appreciable loss of clustered rounded grains or growth of melt–freeze polycrystals was observed, but after the third melt–freeze cycle there was a sudden mass growth of melt–freeze polycrystals, with nearly 75% of clustered rounded grains converted into melt–freeze polycrystals. The reason for the sudden growth may be enhanced grain coarsening by the meltwater accumulated at the impermeable base, as discussed above.
Growth of melt–freeze polycrystals as a function of collective saturation
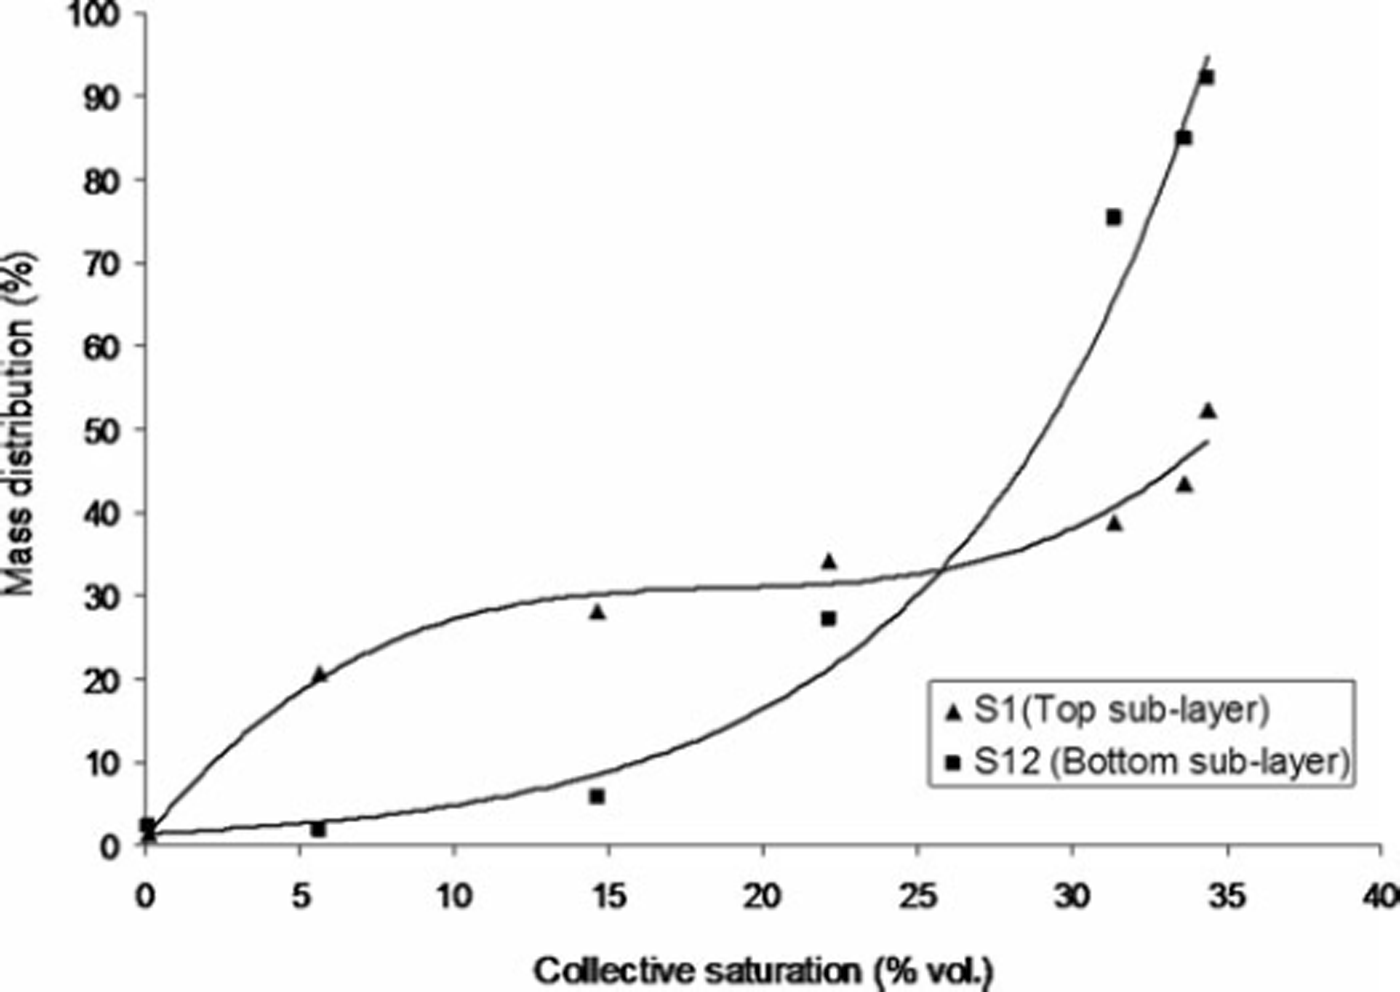
The term collective saturation describes the cumulative saturation and can be expressed as the sum of the preceding saturation values associated with the corresponding grain growth. It is associated with the past snow grain history relative to its saturation that contributed to its mass growth. We measured water saturation in the top- and bottommost sub-layers since liquid water content was expected to be highest, and hence grain growth most prominent, there. The mass growth (T in %) for melt–freeze polycrystals in the top (S1) and bottom sub-layers (S12) was obtained as a function of collective saturation (% vol.), as shown in Figure 6. The results indicate that there are distinct growth patterns for the melt–freeze polycrystals in the top sub-layer (which directly interacts with the radiation) and in the bottom sub-layer (which does not directly interact with the radiation but receives the meltwater from overlying sub-layers). The growth of melt–freeze clusters in the top sub-layers is due to instantaneous refreezing of meltwater, while the growth of melt–freeze polycrystals in the bottom sub-layers is due to enhanced grain coarsening within saturated snow in accordance with Reference Raymond and TusimaRaymond and Tusima (1979) and Reference ColbeckColbeck (1987b).
Dependence of mass growth (%) of melt–freeze polycrystals on the collective saturation of snow within top (S1) and bottom sublayers (S12).
Evolution of impermeable horizons within homogeneous snow
Intrinsic permeability of snow was calculated using Equation (1) (Reference ShimizuShimizu, 1970), after each melt–freeze cycle within sub-layers S1–S12. The intrinsic permeability of snow is directly related to the void ratio, which relates to the growth of individual grains. Also, in the previous subsection we have seen that the mass growth of melt–freeze polycrystals strongly depended on saturation. Therefore, we correlated the intrinsic permeability of snow with the liquid water saturation for each melt–freeze cycle.
In order to monitor the growth of the melt–freeze polycrystals within each sub-layer corresponding to each MFC, the X-ray microtomographs from the snow were recorded after every MFC. Figure 7 depicts the X-ray microtomographic reconstructed images for clustered rounded grains initially and melt–freeze polycrystals for the third and sixth melt–freeze cycles, within different sublayers, i.e. S1, S6 and S12. In these images the dark patches indicate solid ice; gray (light) patches show the intervened void portions. In a single scanning of the sample (for each layer and each melt–freeze cycle), nearly 600 numbers of reconstructed images were grabbed from the raw images with a resolution of 5 |im. The analysing tool CTAn was used to calculate the structural thickness and structural separation. Using these parameters the (3-D) void ratio VR and the grain-size distributions were estimated with respect to the liquid water saturation. The variations in the intrinsic permeabilities (x10−10m2) of snow with average saturation (% vol.) within different sub-layers (S1-S12) for each MFC are shown in Figure 8. Before any melt–freeze cycle (MFC = 0) the snow sample was dry (-6°C) and therefore liquid water saturation was zero (not shown in Figure 8). Initially, the intrinsic permeabilities were very similar (≈15 × 10−10m2) throughout sub-layers S1–S12 and these values were larger than the permeability values obtained subsequently with ongoing melt–freeze cycles.
Reconstructed X-ray microtomography images for the snow samples (resolution 5 mm) grabbed from various sub-layers corresponding to different melt–freeze cycles (MFC): (a) MFC=0; (b) MFC=3; (c) MFC=6.

Variations in the intrinsic permeabilities of snow sub-layers corresponding to different melt–freeze cycles with saturation (% vol.) recorded after each melt cycle.
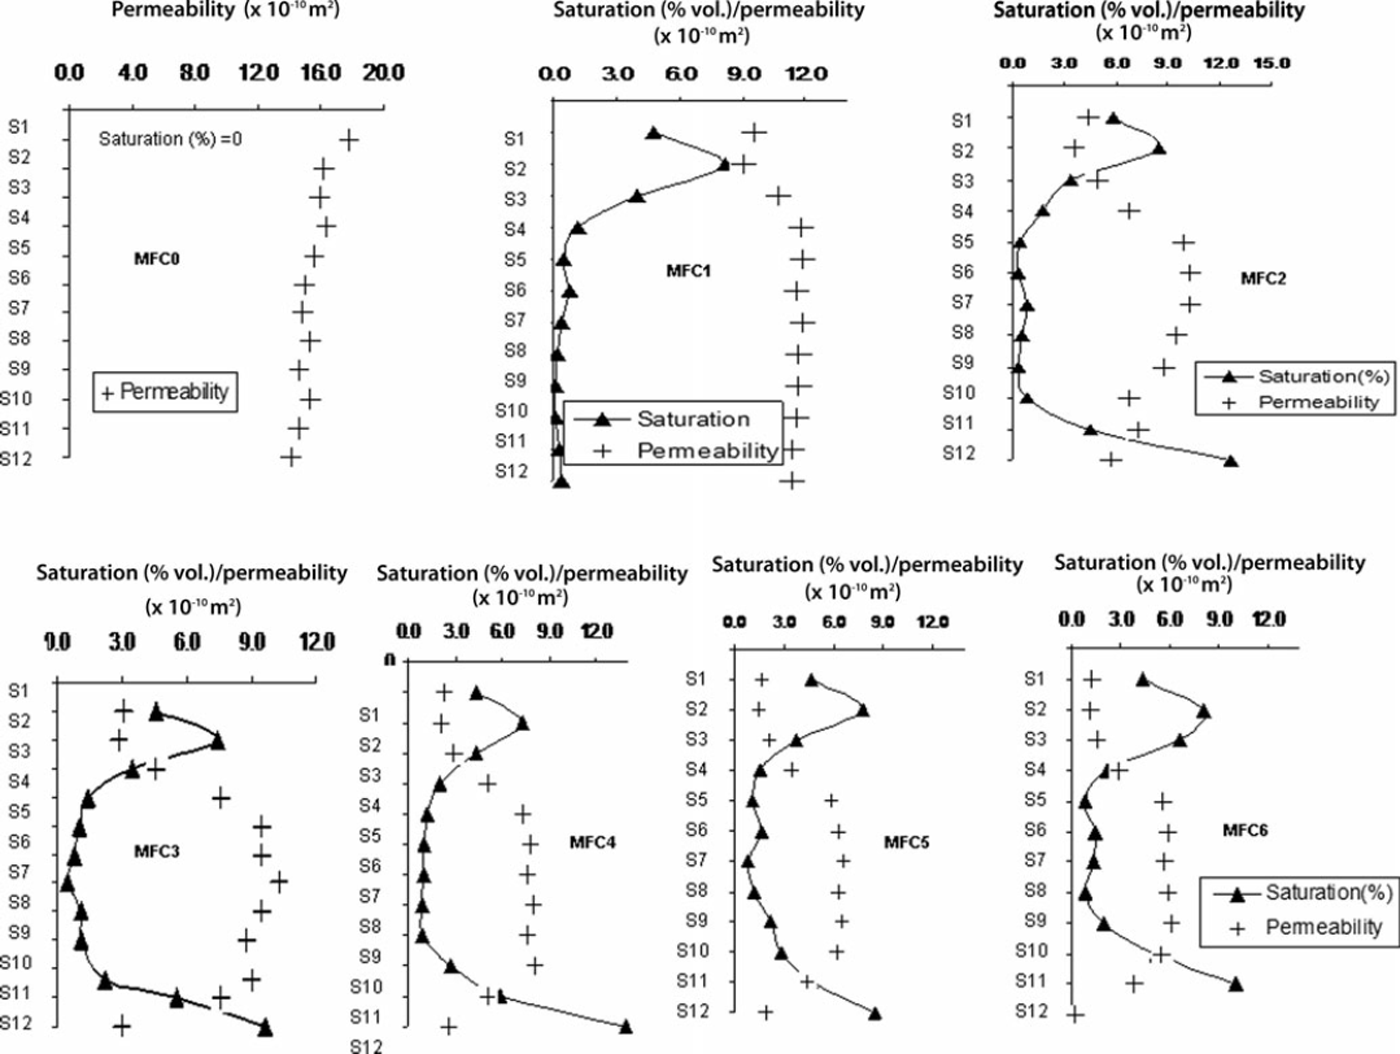
The average liquid water saturations measured after every melt cycle within sub-layer S2-S3 were greater than in the adjacent sub-layers S1 and S3-S4 for each MFC. Correspondingly the intrinsic permeability for these layers significantly decreased with each melt–freeze cycle. The depth of S2-S3 was approximately 7–12 cm with respect to the snow surface, and the larger saturation in this region was caused primarily by subsurface melting and secondarily by the meltwater received from S1 due to direct melting. These results are in agreement with the findings of Reference Koh and JordanKoh and Jordan (1995) and Reference Pfeffer and HumphreyPfeffer and Humphrey (1996). The average saturations within S1 and S12 were also larger, resulting in substantial growth of melt-freeze clusters. Thus, the intrinsic permeabilities of these layers have changed significantly. From these observations it is clear that the intrinsic permeabilities for S1, S2-S3 and S12 decreased from 17.76 × 10⁻¹⁰ m2 to 1.27 × 10⁻¹⁰m2, from 16.14 × 10⁻¹⁰ m2 to 1.09 × 10⁻¹⁰ m2 and from 14.15 × 10⁻¹⁰ m2 to 0.17 × 10⁻¹⁰ m2, respectively, with ongoing melt–freeze cycles. The decreasing trends for intrinsic permeabilities within S1, S2-S3 and S12 with ongoing melt–freeze cycles indicate that impermeable horizons were evolving within the sub-freezing snow sample (which initially was a homogeneous sample).
For manual identification of these partially permeable layers, stratigraphic mapping of the sample was carried out after each melt–freeze cycle. Figure 9a is the sectioned view of the snow sample after the sixth melt–freeze cycle. Through visual identification of the sub-layer structures, two melt–freeze crusts (mfc-1 and mfc-2) in the top sublayers and one ice crust near the impermeable base stratum were found. As previously discussed, the evolution of mfc-1 resulted from the growth of melt–freeze clusters due to direct melting in S1. The growth of the ice crust near sublayer S12 occurred due to grain coarsening among the highly saturated snow grains and subsequent refreezing. The growth of mfc-2 took place due to growth of melt– freeze clusters in S2–S3, due to the penetration of shortwave radiation. It is interesting to note that mfc-2 evolved within the sub-freezing homogeneous snow due to subsurface melting. The positions of these crusts within the snow were correlated with the saturation spikes revealed in the saturation profile collected by PPSP. Figure 9b illustrates a saturation profile of the snow sample, previously exposed to two melt–freeze cycles, and it was recorded immediately after the second melt cycle. A comparison between the saturation spikes (Fig. 9b) and the actual positions of the melt–freeze and ice crusts within stratigraphic mapping of the snow sample (Fig. 9a) showed good agreement between the two methods. The saturation spikes recorded by PPSP indicate the existence of impermeable or semi-permeable horizons within the snow which impeded the flow of water in the downward direction; as a result, saturation increased over these barriers due to accumulation or lateral flow of water.
(a) Transect of snow sample after sixth and last melt–freeze cycle, exhibiting the surface melt–freeze crust (mfc-1), subsurface melt–freeze crust (mfc-2) and bottom ice crust; and (b) saturation profile of snow sample after second melt–freeze cycle recorded with the help of PPSP device.

Summary and Conclusions
Fine-to-coarse transitions can occur within heterogeneous snow and may impede the water flow. In this work, a new fine-over-coarse texture was created within sub-freezing homogeneous snow by subsurface melting due to penetration of shortwave radiation. Under controlled environmental conditions, using a sun simulator as a source of radiation, melt–freeze polycrystals were grown from clustered rounded grains. The development of impermeable or partially permeable horizons was monitored during several melt–freeze cycles. The impermeability of any sub-layer was associated with the reduction in its void ratio with the growth of melt–freeze polycrystals which finally developed into melt–freeze crusts; these can act as barriers to the vertical flow of liquid water. To see how impermeability increased within sub-layers, the intrinsic permeability from entire sub-layers was regularly measured during experiments. To measure the void ratios for each sub-layer corresponding to each melt–freeze cycle, samples were collected from each sub-layer and analysed by X-ray tomography. The estimated void ratios were then used to calculate the intrinsic permeability of the sample. The effect of grain coarsening was larger in sub-layers adjacent to the impermeable base stratum than in surface sub-layers directly interacting with the radiation. After every melt cycle and before every freeze cycle, a saturation profile was recorded using a PPSP device with vertical resolution of 7 mm. We analysed the growth of melt–freeze polycrystals as a function of collective saturation (cumulative saturation values). Also, the effect of saturation on the permeability of snow was shown to correspond to each melt–freeze cycle. Stratigraphic mapping of the sample was carried out after every melt–freeze cycle. In the present case, three crusts, i.e. one surface melt–freeze crust, one subsurface melt–freeze crust and one bottom ice crust, were observed within the sample after several melt–freeze cycles. Formation of a subsurface melt–freeze crust within sub-freezing homogeneous snow exposed to multiple melt–freeze cycles was verified. To locate the positions of impermeable horizons within the sample, an indirect method was applied that used saturation spikes. The saturation spikes recorded by PPSP agreed with the actual positions of the impermeable or semipermeable horizons which had developed within the snow.
Acknowledgements
We thank P.K. Srivastava and V. Kumar for their support during the X-ray microtomography study of the snow samples; J. Singh for his dedicated efforts to fabricate various components of the experimental set-up required to execute the present work; P.S. Pendro, D. Kumar, A. Prasher, S. Patel and P. Ranjan for their support during the experimental work at the cold laboratory, Manali; and T.W. Pfeiffer, J. Schweizer and S.A. Sokratov who shaped this paper into its present form through their critical insightful comments.


