


1. Introduction
In classical descriptions of speech production, it is assumed that articulation is symmetrical in the transverse plane of the vocal tract. Phonetics textbooks have noted, however, that some speech sounds – in particular lateral consonants – may be articulated with a substantial degree of left–right asymmetry; see Hamlet (Reference Hamlet1987) for a brief review of these texts. Yet there have been very few instrumental investigations of articulation asymmetry. Electropalatography (EPG) seems to be particularly well suited to this endeavour. In EPG, a custom-made, thin acrylic palate sits in the roof of the mouth and is held in place by wire clasps that clip over the teeth. The real-time spatial pattern of tongue–palate contact is captured by a grid of (usually) 62 electrodes distributed over the palate surface. The output is a sequence of binary images, known as palatograms, representing the pattern of electrode activations as a function of time.
The direction and amount of asymmetry in EPG images is likely to depend on several factors, which might include the speaker’s anatomy, their handedness (Liu et al., Reference Liu, Islam, Radford, Tkachman and Gick2024), and asymmetries in the manufacture of the electropalate (e.g., nonuniformities in the thickness of the acrylic resin or in the orientation of the embedded electrodes). Lingual asymmetries could potentially mirror asymmetries observed in other aspects of articulation, e.g., involving the lips (Graves & Goodglass, Reference Graves and Goodglass1982; Graves & Landis, Reference Graves and Landis1985; Hausmann et al., Reference Hausmann, Kautz, Lamm, Radelt and Güntürkün1998). Improved understanding of the relative importance of these factors could have both theoretical and practical benefits. It could enhance understanding of motor control and motor constraints in speech production, as well as their potential relationship with the neural organization of speech processing. In addition, it could provide insights into the relationship between anatomical features of speakers and the acoustic characteristics of speech. For example, Hamlet et al. (Reference Hamlet, Bunnell and Struntz1986) suggested that an individual’s articulatory asymmetries may contribute to the unique characteristics of their vocalic transitions to and from /s/ and /l/, which, in turn, might play a role in speaker recognition. From a practical viewpoint, measurements of asymmetry in neurotypical speakers could serve as a reference when treating individuals with speech deficiencies that are caused by asymmetry, e.g., cleft palate and dysarthria due to unilateral weakness.
This study is part of a wider research programme to investigate the factors that affect articulatory asymmetry in EPG data. The present study had two specific objectives. The first and main objective was to refine the methodology for measuring asymmetry in electropalatograms. The secondary objective was to gain information of a preliminary nature regarding the amount of asymmetry observed for the linguopalatal consonants of British English, where the term ‘linguopalatal’ is used to refer to speech sounds in which the active articulator is the tongue and the passive articulator is the palate. The main purpose of acquiring such information is to allow future studies to focus on the phonemes or phonetic features (meaning voice, place or manner) that result in the greatest amount of asymmetry. In addition, from a theoretical perspective, studying the relationship between the amount of asymmetry and the type of speech sound could shed light on the likely causes of asymmetry. For example, a strong influence of place of articulation that is consistent across speakers could be considered evidence in support of a mechanism involving the differential movement of the coronal and dorsal parts of the tongue.
Until recently, lateral asymmetry in electropalatograms had only been explicitly investigated in a small number of studies (Hamlet, Reference Hamlet, Bunnell and Struntz1986; Hiki & Imaizumi, Reference Hiki and Imaizumi1974; McCutcheon et al., Reference McCutcheon, Hasegawa and Fletcher1980; Marchal & Espesser, Reference Marchal and Espesser1987; Marchal et al., Reference Marchal, Farnetani, Hardcastle and Butcher1988; Farnetani, Reference Farnetani1988). These studies employed limited phoneme inventories, meaning that they provided little insight into the relationships between the degree of asymmetry and the phonetic features of consonants (voice, place and manner). The current study builds on our prior investigations into these relationships (Verhoeven et al., Reference Verhoeven, Mariën, De Clerck, Daems, Reyes-Aldasoro and Miller2019; Miller et al., Reference Miller, Constantino Reyes-Aldasoro and Verhoeven2019). In the first of these studies (Verhoeven et al., Reference Verhoeven, Mariën, De Clerck, Daems, Reyes-Aldasoro and Miller2019), we carried out a meta-analysis of 1,500 previously published palatograms representing linguopalatal consonants uttered by 225 speakers in 10 different languages. The direction and amount of asymmetry, quantified using the asymmetry index introduced by Marchal and Espesser (Reference Marchal and Espesser1987), were determined by visual inspection of the published images. Asymmetry was found to depend on the manner of articulation, but no significant relationship was observed for the other consonant dimensions (voice and place). In a subsequent study (Miller et al., Reference Miller, Constantino Reyes-Aldasoro and Verhoeven2019), we investigated the relationship between asymmetry and the type of speech sound in a more controlled setting, using data from a single source. The data in question (Wrench, Reference Wrench2024), which were acquired at the Centre for Speech Technology Research (CSTR) at Edinburgh University, consisted of temporally registered sound and EPG files recorded during a sentence-reading task carried out by English speakers with a variety of accents. The degree of asymmetry was again calculated using the metric proposed by Marchal and Espesser (Reference Marchal and Espesser1987), which was subsequently converted to a four-level ordinal variable to enable correspondence analysis. The outcome was a 2-D correspondence map visualizing the relationship between the consonant phonemes of English and their asymmetry levels. The results broadly agreed with those of the meta-analysis (Verhoeven et al., Reference Verhoeven, Mariën, De Clerck, Daems, Reyes-Aldasoro and Miller2019) in the sense that the level of asymmetry was most strongly influenced by manner of articulation. In particular, fricatives and approximants were found to be most asymmetrical.
The current study also uses the speech corpus from the CSTR, but it introduces a number of key methodological differences relative to our previous study (Miller et al., Reference Miller, Constantino Reyes-Aldasoro and Verhoeven2019). Most importantly, as explained in detail in the following section, the current study (a) employs a more sophisticated asymmetry metric and (b) analyses the relationship between asymmetry and speech sounds using a linear mixed-model regression that includes the number of activated electrodes as a control variable. In so doing, the study not only produces findings regarding the relationship between asymmetry and speech sounds that are less influenced by confounding factors than previous research, but also leads to a better understanding of the challenges involved in measuring articulation asymmetry by means of EPG.
2. Methods
2.1 Data preparation
The data analysed in this study were obtained from the Mocha (Multichannel Articulatory Database) – Timit corpus provided by the CSTR (Wrench, Reference Wrench2024). This corpus contains 460 short sentences (example: Stimulating discussions keep students’ attention)Footnote 1 , which were ‘designed to include the main connected speech processes in English (e.g., assimilations, weak forms)’ (Wrench, Reference Wrench2024). A detailed description of the phonetic and linguistic characteristics of the speech data is provided in the following subsection. The 62-electrode palatograms, which were acquired using the Reading EPG system (Hardcastle, Reference Hardcastle1984), are stored in the Mocha-Timit (M-T) database in raw binary form (8 bytes per sample) and have a frame rate of 200 Hz. The EPG data are reported to be ‘carefully synchronized’ with the audio data, where the latter have a sampling rate of 16 kHz. For each utterance, a text file is provided containing phoneme segmentations that were produced automatically using forced alignment [Simon King, personal communication]. In the current paper, however, and in contrast to our previous study (Miller et al., Reference Miller, Constantino Reyes-Aldasoro and Verhoeven2019), the segmentations provided in the M-T database were disregarded and the phoneme boundaries were determined as described in the following two paragraphs.
Initially, the recorded utterances were segmented and annotated automatically using AlignTool (Schillingmann et al., Reference Schillingmann, Wrede and Belke2017), an open-source alignment tool that operates in two stages (Schillingmann et al., Reference Schillingmann, Ernst, Keite, Wrede, Meyer and Belke2018). During the first stage, preliminary onset and offset times of words and phonemes are established using Praat (Boersma & Weenink, Reference Boersma and Weenink2023). Subsequently, an automatic speech recognition system called MAUS (Munich Automatic Segmentation System) (Schiel, Reference Schiel1999) performs a forced alignment between the spoken utterances and their orthographic transcriptions. The output is a Praat TextGrid file providing the onsets and endpoints of the words and speech sounds on different tiers. TextGrid files enable visualization of the segmentations in relation to the waveform and spectrogram of the utterance, all of which are temporally aligned.
In the next step, the automatic segmentations were checked, and if necessary adjusted, by an experienced phonetician. The assessor consistently used the spectral information to decide upon the accuracy of the boundary locations suggested by AlignTool. This decision was relatively clear-cut for transitions between plosives, nasals, fricatives, and lateral approximants (on the one hand) and vowels (on the other). In all these instances, boundaries were adjusted to coincide with the locations of abrupt spectral change, according to the conventions described in detail in Peterson and Lehiste (Reference Peterson and Lehiste1960). The boundaries between approximants and vowels were more difficult to identify reliably, and auditory cues were used to support the visual information in the spectrogram and waveform. The majority of the phoneme boundaries had to be adjusted, and in some cases, the identity of the phoneme had to be changed (e.g., in the case of elision, the phoneme label generated by AlignTool was removed). In addition, plosives and affricates were separated into their hold phase and their release phase.
The M-T data used in the current analysis were the sound and EPG files pertaining to four speakers of British English (two female and two male). Three of these speakers (2 F, 1 M) have a Southern British accent, while the fourth has a relatively mild, non-rhotic, West Yorkshire accent. The remaining four speakers in the M-T database, who appear to have either an American or a Scottish accent, were omitted from the analysis. This decision was largely based on the fact that /l/ and /r/ were known in advance to be two of the most asymmetrical phonemes (Miller et al., Reference Miller, Constantino Reyes-Aldasoro and Verhoeven2019), and liquid consonants show considerable variation in different accent varieties.
With the exception of the segmentation of the phonemes (described above), the remaining analysis procedures were implemented in Matlab (The MathWorks Inc., 2022). In total, palatograms pertaining to 22,004 tokens (i.e., phonemes) were analysed (see Table 1). To arrive at this final sample, several data reduction procedures were applied. Firstly, only tokens corresponding to the linguopalatal consonants of British English were included, namely /t, d, k, g, n, ŋ, s, z, ʃ, ʒ, l, j, r/. In the case of plosives, the asymmetry metric was calculated solely from the hold phase, as this corresponds to the maximum constriction at the place of articulation. As mentioned, affricates were separated into their plosive and fricative phases (although in some instances, only one of these phases could be identified), and the components were assigned the same labels as their singleton counterparts. Each component was then analysed in the same manner as the corresponding singleton. For example, the affricate /dʒ/ generally yielded two asymmetry metrics: one for the component identified as /d/ and the other for the component /ʒ/. The second data reduction procedure involved removing all tokens for which there were fewer than three active electrodes in the entire palatogram. This step was taken to reduce the influence of unreliable data. Finally, for the set of anterior consonants, namely /t, d, n, s, z, ʃ, ʒ, l/, tokens for which there was no anterior contact, defined as no active electrodes in the front four rows of the palatogram, were excluded. Note that the approximant /r/ was not considered an anterior phoneme for this purpose, despite its label as postalveolar, because the majority of contact for /r/ tends to occur in the posterior region of the palate; see Table 1. An equivalent exclusion procedure was intended to be applied to the posterior phonemes, /k, g, ŋ, j, r/; however, the dataset did not contain a single instance of a posterior phoneme for which there was no contact in the back four rows. During segmentation, the tokens of /l/ had been categorized into instances of clear /l/ (79% of tokens) and dark /l/ (21% of tokens). However, for the purposes of the present study, the two sets were combined and considered as a single speech sound.
Phoneme distribution within the sample, along with key phoneme features averaged across all tokens. The amount of contact (total, anterior and posterior) refers to the number of active electrodes

aThe number of electrodes in the front four rows is 30.
bThe number of electrodes in the back four rows is 32.
Table 1 shows the distribution of phonemes within the sample, together with information about the amount of tongue–palate contact and the centre of gravity (CoG). The latter is a measure of the location of the highest concentration of active electrodes, with higher numbers representing a more anterior pattern of contact. The CoG was calculated according to the formula provided in Articulate Instruments Ltd. (2010), with a weighting of 100% for all contacts. The relevance of examining these variables (amount of contact and CoG) is discussed in the following subsection.
2.2 Speech-sample characteristics
As stated in the previous subsection, the Mocha-Timit corpus provided by the CSTR (Wrench, Reference Wrench2024) consists of 460 sentences. However, 450 of these sentences had in fact been designed by MIT scientists in the context of the DARPA (Defense Advanced Research Projects Agency) project. The stated goal of these scientists was to provide ‘as complete a coverage of phonetic pairs as is practical’, acknowledging that there was ‘no attempt to phonetically balance the sentences’ (Lamel et al., Reference Lamel, Kassel and Seneff1989: 61–62). In the remainder of this subsection, we summarize the key linguistic and phonetic features of the speech data.
To begin with, we present quantitative information on the linguistic composition of the 450 sentences developed at MIT, as reported by Lamel et al. (Reference Lamel, Kassel and Seneff1989). The sentences consist of 3,403 words (in total) and 1,792 unique words. The average word length is 1.58 syllables and there is an average 4.0 phones per word. The mean utterance length is 7.9 syllables, ranging from 4 to 13. The corpus contains four sentence types: simple statements (84.2%), complex statements (7.3%), simple questions (8.2%), and complex questions (0.2%). The sentences were designed to facilitate the study of some of the allophonic processes of American English, such as gemination, flapping, homorganic stop insertion, fricative devoicing and palatalisation. For further detail on these and other design aspects, the reader is referred to Lamel et al. (Reference Lamel, Kassel and Seneff1989).
As mentioned in the previous subsection, after various data reduction procedures, a total of 22,004 consonants were analysed in this study. The distribution of these consonants in terms of their manner and place of articulation is summarized in Figure 1. It can be seen that the majority of the analysed consonants were plosives and fricatives, followed by approximants and nasals. In terms of place of articulation, alveolar sounds occurred most frequently.
Analysed consonants (N = 22,004) in terms of their manner and place of articulation.

Categorization of the speech sounds adjacent to the analysed consonants.
The Mocha-Timit sentences include a wide range of consonant clusters of English, which appear at all word positions (onset, coda and medial). Of the 22,004 analysed consonants, 31.7% were part of a consonant cluster, which is broadly consistent with the frequency of consonant clusters encountered in English (see, for example, Burka (Reference Burka2021), who reported a frequency of 20.8% in word-initial position, 55.7% in medial position and 23.5% in word-final position). The utterances were also assessed with a view to locating sentence stresses. This analysis revealed that 75.8% of the syllables in the dataset were unstressed, meaning that the majority of analysed consonants appeared in an unstressed condition.
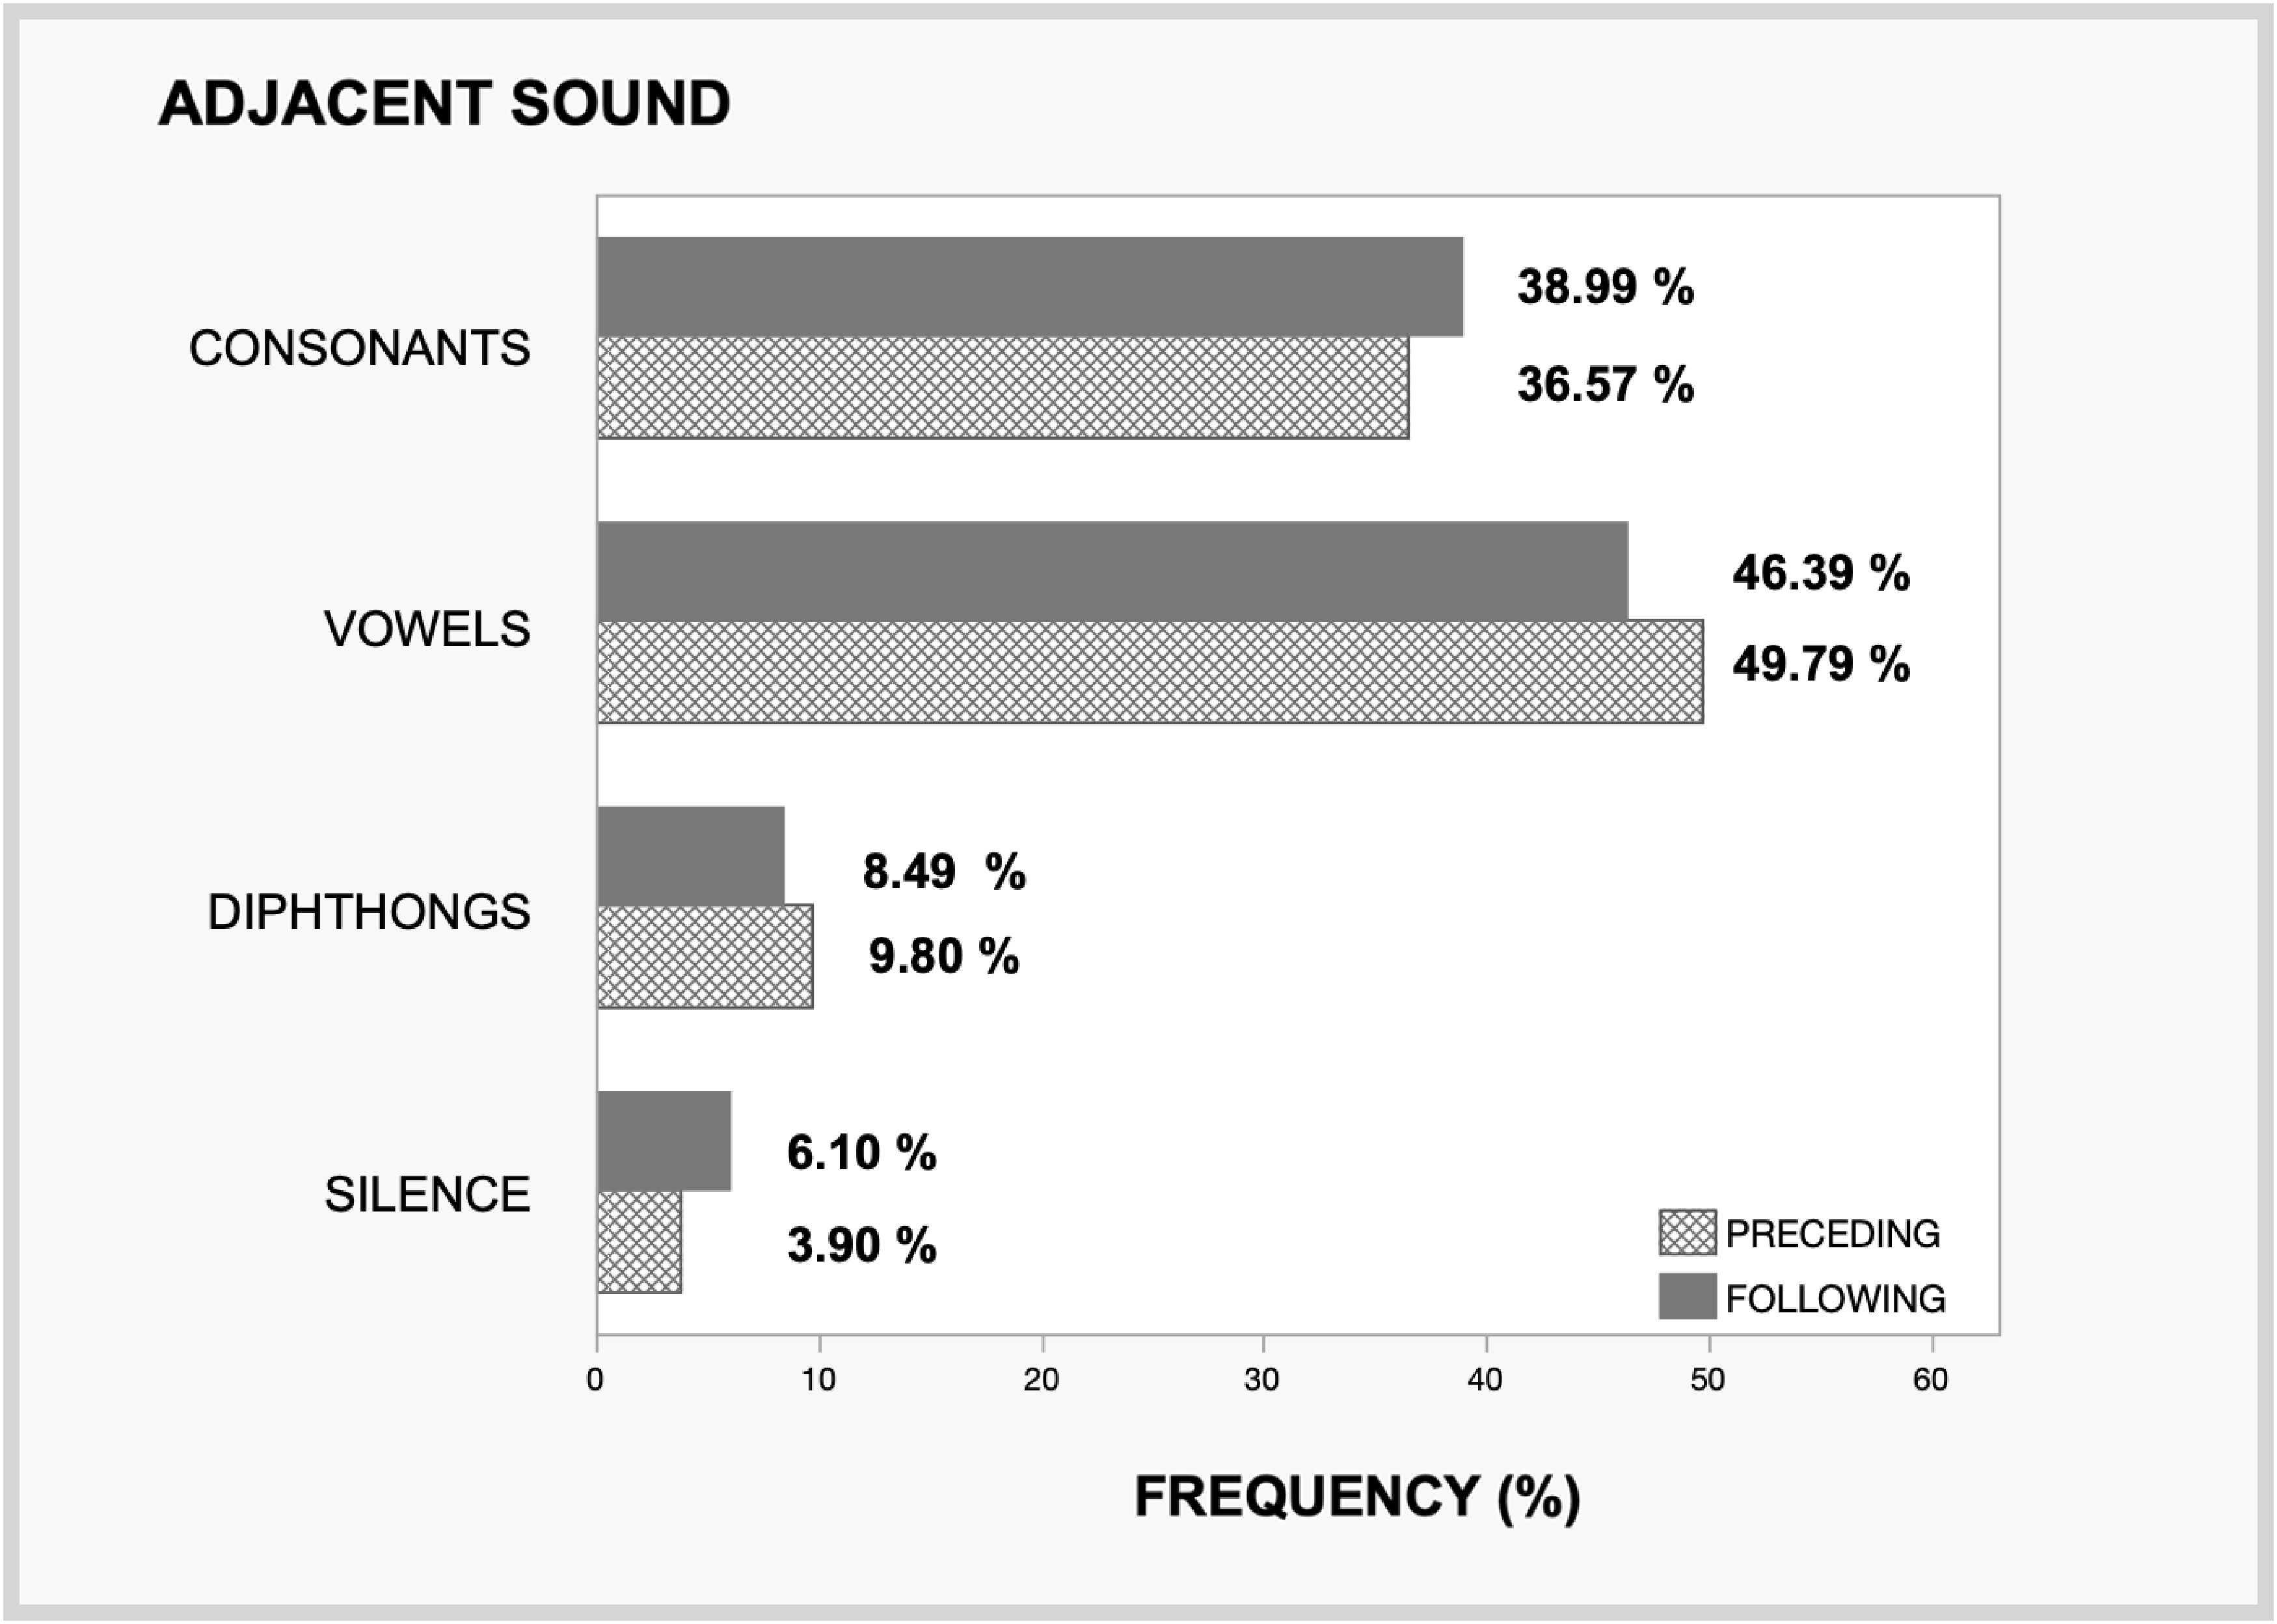
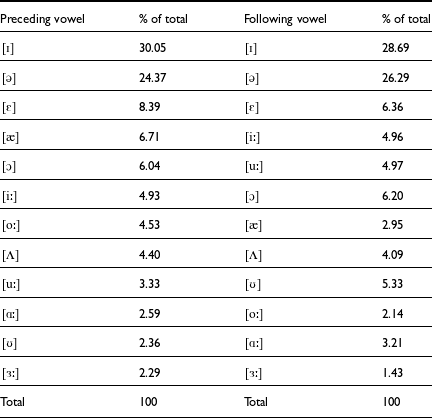
Figure 2 provides information on the immediate phonetic context of the analysed consonants, separated into the preceding and the following speech sound. For phonemes in word-initial position, the preceding sound was the last phoneme of the preceding word, and similarly, word-final phonemes were considered to be followed by the first speech sound of the subsequent word. Table 2 provides further information on the cases where the analysed consonant was flanked by a monophthong vowel. It shows the distribution of vowel phonemes, calculated separately for the set of monophthongs that preceded and followed an analysed consonant. It can be seen that the consonants in this dataset more often appeared in a front-mid vowel context than in the context of a back vowel. Furthermore, the neighbouring vowels were typically half-close to close rather than open.
Rank order of the monophthong vowels that preceded or followed an analysed consonant. Note that some of the analysed consonants appeared between two monophthongs
2.3 Variable definitions
The aim was to carry out linear mixed-model regression analysis with some type of asymmetry measure as the dependent variable, speaker ID as the random effect, and voice, place and manner as fixed effects. The asymmetry index that appears to have been used most frequently in EPG studies of asymmetry is that proposed by Marchal and Espesser (Reference Marchal and Espesser1987). To obtain this metric, the number of active electrodes on the right-hand side of the palate minus the number of active electrodes on the left-hand side is divided by the total number of active electrodes. The result can range from −1 to +1, with a value of zero representing perfect symmetry. Disadvantages of this metric are that its frequency distribution exhibits both large jump discontinuities (i.e., ‘holes’) and notable zero inflation because any pattern with an equal number of active electrodes on the left- and right-hand sides will yield a value of zero. In the present study, therefore, a more complex and sensitive asymmetry metric was used – one that involves attributing a higher weight to an asymmetrical pair of electrodes when those electrodes are located closer to the outer edges of the palate, reflecting the fact that such pairs correspond to a greater amount of actual asymmetry (in geometrical terms). The metric, which was based on the asymmetry measure suggested in Articulate Instruments Ltd. (2010), was defined as follows:
 $${I_{as}} \frac{{\mathop \sum \nolimits_{n = 1}^8 \left( {n - 0.5} \right){S_n}}}{{\mathop \sum \nolimits_{n = 1}^8 {S_n}}}{\rm{\;}}$$
where ${s_n} = \mathop \sum \nolimits_{m = 1}^8 {c_{m,n}}$
is the sum of the contact values in the
${s_n} = \mathop \sum \nolimits_{m = 1}^8 {c_{m,n}}$
is the sum of the contact values in the $n$
th column (a contact value is either 0 or 1) and
$n$
th column (a contact value is either 0 or 1) and ${c_{m,n}}$
is the contact value in the
${c_{m,n}}$
is the contact value in the $m$
th row at the position of the
$m$
th row at the position of the $n$
th column.
$n$
th column. ${I_{as}}$
varies, in principle, from 0.5 to 7.5, where a value of 4 corresponds to a palatogram with a symmetrical pattern of contact. Values that are below and above 4 denote, respectively, left- and right-sided asymmetry. Because
${I_{as}}$
varies, in principle, from 0.5 to 7.5, where a value of 4 corresponds to a palatogram with a symmetrical pattern of contact. Values that are below and above 4 denote, respectively, left- and right-sided asymmetry. Because ${I_{as}}$
incorporates an additional factor relative to the metric proposed in Marchal and Espesser (Reference Marchal and Espesser1987), it has a smoother frequency distribution with a lower proportion of values that correspond to perfect symmetry (9.9% of the current sample, as opposed to 18.5% for the more basic metric). The dependent variable for the mixed-model regression was chosen to be the absolute value of the asymmetry metric,
${I_{as}}$
incorporates an additional factor relative to the metric proposed in Marchal and Espesser (Reference Marchal and Espesser1987), it has a smoother frequency distribution with a lower proportion of values that correspond to perfect symmetry (9.9% of the current sample, as opposed to 18.5% for the more basic metric). The dependent variable for the mixed-model regression was chosen to be the absolute value of the asymmetry metric, $\left| {{I_{as}} - 4} \right|$
, rather than
$\left| {{I_{as}} - 4} \right|$
, rather than ${I_{as}}$
, because the goal was to determine the phonetic features of consonants that result in the greatest amount of asymmetry, irrespective of its direction. Herein, the terms ‘absolute asymmetry’ and ‘amount of asymmetry’ are used interchangeably to refer to the quantity
${I_{as}}$
, because the goal was to determine the phonetic features of consonants that result in the greatest amount of asymmetry, irrespective of its direction. Herein, the terms ‘absolute asymmetry’ and ‘amount of asymmetry’ are used interchangeably to refer to the quantity $\left| {{I_{as}} - 4} \right|$
. For each token in the dataset, the absolute asymmetry was calculated from a single palatogram corresponding to the midpoint of the phoneme duration, so as to minimize the effects of coarticulation. This differs from the approach taken in Miller et al. (Reference Miller, Constantino Reyes-Aldasoro and Verhoeven2019) where the asymmetry metric was averaged across the phoneme duration.
$\left| {{I_{as}} - 4} \right|$
. For each token in the dataset, the absolute asymmetry was calculated from a single palatogram corresponding to the midpoint of the phoneme duration, so as to minimize the effects of coarticulation. This differs from the approach taken in Miller et al. (Reference Miller, Constantino Reyes-Aldasoro and Verhoeven2019) where the asymmetry metric was averaged across the phoneme duration.
Turning our attention to the fixed-effect variables, the variables of interest were the three consonant dimensions as defined in phonetic theory according to the canonical production of the phoneme: (1) Voice – a binary variable corresponding to the voicing status of the phoneme; (2) Place – a categorical variable representing the place of articulation; and (3) Manner – a categorical variable consisting of five levels: plosive (/t, d, k, g/), nasal (/n, ŋ/), fricative (/s, z, ʃ, ʒ/), approximant (/j, r/) and lateral approximant (/l/).
In addition to the three variables representing consonant dimension, inspection of the data revealed that it was important to include the number of active electrodes (i.e., the overall amount of tongue–palate contact) as a control variable, as this can have a confounding effect when calculating ${I_{as}}$
. This confounding effect also occurs when using the asymmetry metric proposed by Marchal and Espesser (Reference Marchal and Espesser1987), and it has been identified as problematic by previous authors (Marchal & Espesser, Reference Marchal and Espesser1987; Farnetani, Reference Farnetani1988). The effect is a consequence of the fact that, for both asymmetry indices, the calculation involves normalizing the difference in contact between the left- and right-hand sides by the total amount of contact. Accordingly, phonemes that are produced with relatively little contact, such as /r/ and /l/ (see Table 1), are more likely to yield ‘high’ absolute asymmetry values than phonemes with more extensive contact. Figure 3 illustrates this phenomenon for /k/ and /t/. Inspection of the palatograms revealed that the high absolute asymmetry values for /k/ seen in Figure 3 (i.e., the shoulders and tails of the distribution) corresponded to tokens for which there was little or no contact in the anterior half of the palate – a not uncommon occurrence. Yet the equivalent scenario (little or no posterior contact) does not arise for /t/, because most speech sounds, even those with anterior primary articulation, are accompanied by a reasonable amount of posterior contact (see Table 1). Accordingly, the histogram falls off more rapidly either side of the peak for /t/ than for /k/.
${I_{as}}$
. This confounding effect also occurs when using the asymmetry metric proposed by Marchal and Espesser (Reference Marchal and Espesser1987), and it has been identified as problematic by previous authors (Marchal & Espesser, Reference Marchal and Espesser1987; Farnetani, Reference Farnetani1988). The effect is a consequence of the fact that, for both asymmetry indices, the calculation involves normalizing the difference in contact between the left- and right-hand sides by the total amount of contact. Accordingly, phonemes that are produced with relatively little contact, such as /r/ and /l/ (see Table 1), are more likely to yield ‘high’ absolute asymmetry values than phonemes with more extensive contact. Figure 3 illustrates this phenomenon for /k/ and /t/. Inspection of the palatograms revealed that the high absolute asymmetry values for /k/ seen in Figure 3 (i.e., the shoulders and tails of the distribution) corresponded to tokens for which there was little or no contact in the anterior half of the palate – a not uncommon occurrence. Yet the equivalent scenario (little or no posterior contact) does not arise for /t/, because most speech sounds, even those with anterior primary articulation, are accompanied by a reasonable amount of posterior contact (see Table 1). Accordingly, the histogram falls off more rapidly either side of the peak for /t/ than for /k/.
Normalized histograms of ${I_{as}}$
, aggregated over all tokens in all speakers, for /t/ (dotted line) and /k/ (solid line). An
${I_{as}}$
, aggregated over all tokens in all speakers, for /t/ (dotted line) and /k/ (solid line). An ${I_{as}}$
value of 4 corresponds to a palatogram with a symmetrical pattern of contact. Although the histograms are composed of discrete data (where each point depicts the frequency of the midpoint of a data bin), to aid visualization, the points have been connected using straight lines.
${I_{as}}$
value of 4 corresponds to a palatogram with a symmetrical pattern of contact. Although the histograms are composed of discrete data (where each point depicts the frequency of the midpoint of a data bin), to aid visualization, the points have been connected using straight lines.

Having established that it would be important to include some measure of the amount of contact as a fixed-effect control variable in the regression analysis, an investigation was carried out to establish which variable, or combination of variables, should be used from among those shown in Table 1 (amount of anterior contact, amount of posterior contact, total contact and CoG). The centre of gravity was included in this list because it is strongly correlated with the amount of contact: as mentioned, almost all phonemes of English are produced with a reasonable amount of back contact, meaning that anterior phonemes, which have a higher CoG, exhibit a greater amount of contact. The goal was to identify the model with the greatest explanatory power (in terms of adjusted R2), but no high correlation values ( $\gtrsim$
0.7) between pairs of variables representing the amount of contact. The selected model incorporated two control variables: the amount of anterior contact (referred to herein as AntCont) and the amount of posterior contact (PostCont).
$\gtrsim$
0.7) between pairs of variables representing the amount of contact. The selected model incorporated two control variables: the amount of anterior contact (referred to herein as AntCont) and the amount of posterior contact (PostCont).
2.4 Linear mixed models
2.4.1 Effect of manner of articulation
Due to various methodological considerations (described below), the effect of the three consonant dimensions (Voice, Place and Manner) could not be investigated in a single regression model; rather, a series of models was implemented. The first linear mixed model (LMM), which examined the effect of manner of articulation on the amount of asymmetry, $\left| {{I_{as}} - 4} \right|$
, incorporated the fixed-effect variables AntCont, PostCont and Manner, along with speaker ID as the random effect. The fixed-effect variables were also crossed to yield interactions, with the exception of AntCont*PostCont, which was omitted because it was found to be an irrelevant predictor that resulted in overfitting. The variable Voice was omitted because a likelihood ratio (LR) test conducted using the MATLAB function ‘compare’ revealed no significant difference between the models that did and did not include this variable (LR test statistic = −7.06, p = 0.89). In fact, in the model that included Voice, the latter was found to exhibit almost no association with the amount of asymmetry (F1,21988 = 0.017, p = 0.90). The variable Place was omitted because its inclusion led to failure of the LMM on account of rank deficiency. This was not unsurprising and probably resulted from the unbalanced nature of the data (e.g., there is only one lateral approximant, /l/, meaning that this manner class is represented by a single level of the variable Place). Separate models (described in the following two subsections) were devised to examine the effect of place of articulation on the amount of asymmetry.
$\left| {{I_{as}} - 4} \right|$
, incorporated the fixed-effect variables AntCont, PostCont and Manner, along with speaker ID as the random effect. The fixed-effect variables were also crossed to yield interactions, with the exception of AntCont*PostCont, which was omitted because it was found to be an irrelevant predictor that resulted in overfitting. The variable Voice was omitted because a likelihood ratio (LR) test conducted using the MATLAB function ‘compare’ revealed no significant difference between the models that did and did not include this variable (LR test statistic = −7.06, p = 0.89). In fact, in the model that included Voice, the latter was found to exhibit almost no association with the amount of asymmetry (F1,21988 = 0.017, p = 0.90). The variable Place was omitted because its inclusion led to failure of the LMM on account of rank deficiency. This was not unsurprising and probably resulted from the unbalanced nature of the data (e.g., there is only one lateral approximant, /l/, meaning that this manner class is represented by a single level of the variable Place). Separate models (described in the following two subsections) were devised to examine the effect of place of articulation on the amount of asymmetry.
The regression was performed using the MATLAB function ‘fitlme’, with the fit method set to ‘restricted maximum likelihood estimation’. This fit method takes into account the loss of degrees of freedom due to estimating the fixed effects; it therefore produces a less biased estimate of random-effect variances than maximum likelihood estimation. As stated in the previous subsection, the variable Manner consisted of five categories; these are referred to herein using the abbreviations PLOS, NAS, FRIC, APPR and LAPPR. When performing the regression, the category PLOS was chosen as the reference category on the basis that it had the lowest mean absolute asymmetry of all the manner categories, thereby facilitating interpretation of the regression coefficients. Post-hoc pairwise comparison for all pairs of manner categories was carried out using the MATLAB function ‘coefTest’ where the Satterthwaite approximation was used to estimate the effective degrees of freedom, as is recommended when equality of variances cannot be assumed.
2.4.2 Effect of place of articulation
A second regression analysis was conducted to examine the influence of place of articulation as defined by phonetic theory. To overcome the rank deficiency problem, the second model excluded some manners of articulation. Specifically, the approximants and lateral approximants were excluded for two reasons. Firstly, they are largely responsible for the lack of orthogonality with respect to manner and place (which was the likely cause of the rank deficiency). Secondly, approximants cannot be considered to have a primary place of articulation and therefore, when they are categorised according to phonetic theory, they may produce misleading results. Consider, for example, the central approximant /r/. This is labeled as an alveolar or a postalveolar phoneme in British English, meaning that its inclusion in the analysis would contribute to the amount of asymmetry seen in anterior phonemes. Yet, as shown in Table 1, /r/ typically exhibits very little anterior tongue–palate contact (certainly much less than that observed for alveolar obstruents), such that it cannot be considered to be representative of its nominal place of articulation. In addition to removing the approximants, all tokens of /d/ and /z/ were eliminated. This measure was taken so as to achieve a more balanced dataset in terms of the number of anterior vs. the number of posterior phonemes for a given manner class. In other words, since the alveolar obstruents were considerably more common than their velar counterparts (see Table 1), a simple means of reducing the number of alveolars was devised, which was to remove the voiced tokens. The ensuing lack of balance in terms of voicing status was considered unimportant, as Voice has almost no effect on the amount of asymmetry, as shown above.Footnote 2 The final dataset, which included the set of phonemes /s, t, n, ∫, ʒ, k, g, η/, comprised 13,581 observations. The variable Place consisted of three levels, ALV (alveolar), PALV (post-alveolar) and VEL (velar), with ALV serving as the reference category. The Manner variable likewise comprised three categories (PLOS, NAS and FRIC), with PLOS as the reference category. As for the dependent variable, in contrast to the previous model, rather than calculating the absolute asymmetry across the entire electropalate, the absolute asymmetry was calculated for one half of the palate only – either anterior or posterior, according to the place of articulation of the phoneme in question.Footnote 3 This approach was taken for two reasons. Firstly, it obviated the need to use both AntCont and PostCont as control variables (the combination of these two variables was strongly associated with the place of articulation, meaning that a model that included AntCont, PostCont and Place would be over-specified). Thus, to control for the amount of contact, a single variable was used (referred to herein as HalfCont) which was set to PostCont for the posterior phonemes (/k, g, η/) and AntCont for the anterior phonemes (/s, t, n, ∫, ʒ/). The second reason for using an absolute asymmetry metric calculated from just one half of the palate was that the amount of asymmetry at the place of maximum constriction is of greater interest, as it is more characteristic of the phoneme. To be more specific, in the case of anterior sounds, the posterior pattern of contact was observed to be similar across all phonemes for a given speaker, while in the case of posterior sounds, there was relatively little anterior contact, and the contact that did exist was likely to be due to coarticulation from neighbouring vowels (Marchal & Espesser, Reference Marchal and Espesser1987). Farnetani (Reference Farnetani1988) also used an asymmetry metric derived from the half of the palate corresponding to the place of articulation in her investigation of the amount and direction of asymmetry in /t/, /l/ and /k/. Her stated rationale was that, for a fixed utterance and speaker, the asymmetry metric of a given phoneme showed the least variability across repetitions when it was calculated using the half of the palate corresponding to the place of articulation. The final step in specifying the model to determine the effect of place of articulation was to choose the interaction coefficients. The best-fit model allowed for the interaction between Place and HalfCont, but not between Manner and HalfCont.
2.4.3 Effect of centre of gravity
Finally, two regression models were devised in order to investigate, for a fixed place of articulation, the relationship between centre of gravity (calculated from the midpoint palatogram of each token) and the amount of asymmetry. The first of these models employed the alveolar phonemes, i.e., /t, d, n, s, z/, resulting in N = 12,431 observations, while the second employed the velar phonemes, i.e., /k, g, η/, corresponding to N = 3,256 observations. Thus, these models addressed the question of whether phonemes with a fixed nominal place of articulation exhibit more or less asymmetry when they are produced with a more anterior pattern of contact. It was reasoned that the answer to this question might shed light on the findings of the previous model that examined the relationship between asymmetry and Place. The dependent variable was the amount of asymmetry in the half of the palate corresponding to the place of articulation (i.e., anterior for the alveolar model and posterior for the velar model). Similarly, the variable used to control for the amount of contact was HalfCont. The variable Manner comprised three categories for the alveolar model (PLOS, NAS and FRIC) and two for the velar model (PLOS and NAS). Similar to the Place model described in the previous subsection, it was found that the best-fit model was one that included the interaction between CoG and HalfCont, but not that between Manner and HalfCont.
3. Results
3.1 Manner of articulation
The first model examined the association between different manners of articulation and the amount of asymmetry (see Table 3). The interactions between the manner categories and the control variables (AntCont and PostCont) are not shown, as they are not of direct interest, but they contributed to the best-fit model. It can be seen that approximants and lateral approximants yield highly significant positive coefficients, implying a greater amount of asymmetry than the reference category (plosives). There is no significant difference in asymmetry between nasals and plosives, nor between fricatives and plosives. Post-hoc comparison tests were performed for all pairs of manner categories using the Satterthwaite method to estimate the effective degrees of freedom. Table 4 shows the statistically significant (p ≤ 0.05) results, presented in order of decreasing significance. Note that all the significant comparisons involve a contrast with either the class of approximants or the class of lateral approximants.
Results of the model to examine the association between manner of articulation and amount of asymmetry (N = 22,004, adjusted R2 = 0.38)
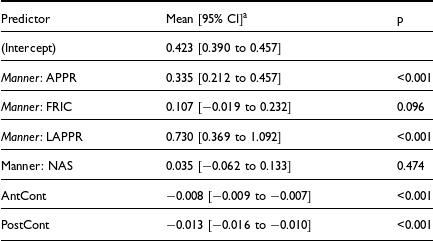
aUnstandardized regression coefficient.
Significant contrasts (p ≤ 0.05) in the post-tests for manner of articulation

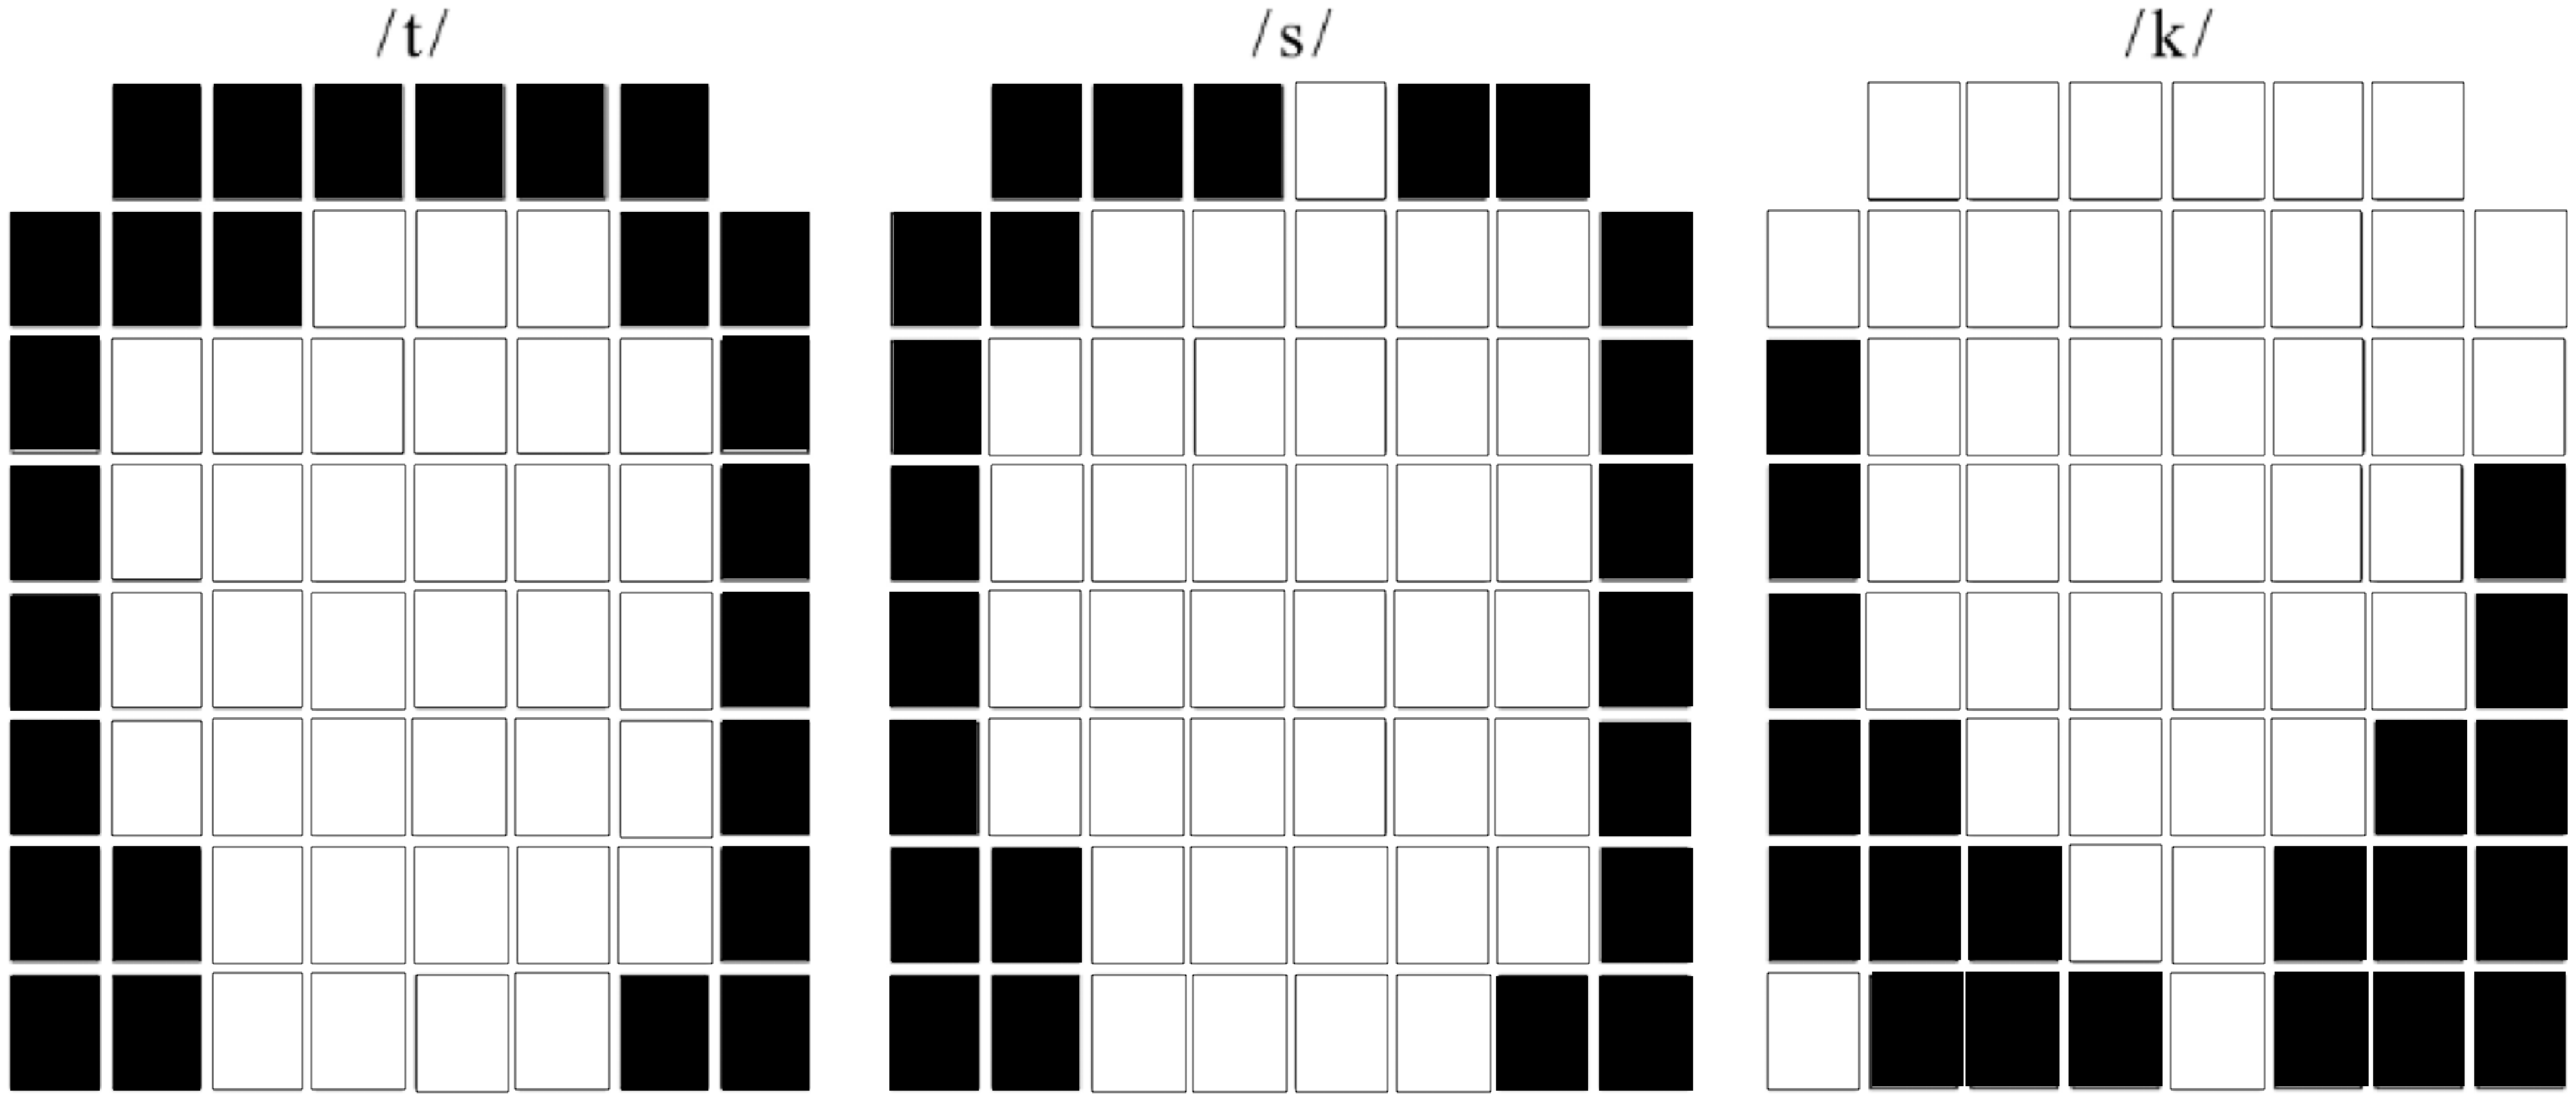
To aid interpretation of these results, it is worth examining the typical patterns of contact seen in the palatograms analysed in this study. Figure 4 shows palatograms for the phonemes /t/, /s/ and /k/ for the speaker who, on average, exhibited the greatest amount of asymmetry of all four speakers. These palatograms were chosen as typical realizations of these three phonemes, at the midpoints of the duration of the speech sound, for the speaker in question. To provide context for this figure, note that when the three approximants (/l, j, r/) are excluded from the sample, the mean value of I as across all tokens in all speakers is 3.92 (1 SD = 0.23), where a value of 4 represents perfect symmetry. The mean values of I as for the individual speakers (again excluding approximants) are 3.98 (1 SD = 0.25), 3.97 (1 SD = 0.23), 3.88 (1 SD = 0.20) and 3.86 (1 SD = 0.20), indicating that the speakers all showed a tendency towards a left-sided asymmetry. It can be observed from Figure 4 that even for the speaker who exhibited the greatest amount of asymmetry, the difference in the number of active electrodes between the left- and right-hand sides of the palate is typically small in obstruents: between one and three electrodes. When the overall amount of asymmetry is small, it is naturally difficult to detect differences in asymmetry between different manners of articulation.
Typical palatograms observed for obstruent phonemes in the speaker who exhibited the greatest amount of asymmetry. The black squares represent activated electrodes. The amount of asymmetry seen in these images, I as , is 3.85 for /t/, 3.76 for /s/, and 3.98 for /k/.
3.2 Place of articulation
The second linear mixed model was designed to examine the association between the place of articulation defined by phonetic theory (Place) and the amount of asymmetry, while controlling for Manner. As explained in Section II, in addition to the fact that the second model incorporated the effect of Place, the main differences relative to the first model were as follows: (1) a reduced dataset, /s, t, n, ∫, ʒ, k, g, η/, was employed; and (2) the dependent variable (absolute asymmetry) and the control variable (amount of contact) were only measured in the half of the palate corresponding to the place of articulation. The regression coefficients are presented in Table 5. Note that the reference category for Place is ALV (alveolar), while the reference category for Manner is PLOS (plosives). Table 6 shows all post-hoc pairwise comparisons for Place with Satterthwaite-corrected p-values.
Results of the model to determine the association between nominal place of articulation and amount of asymmetry (N = 13,581, adjusted R2 = 0.37)

aUnstandardized regression coefficient.
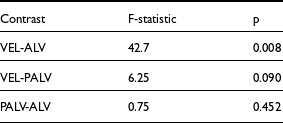
Post-tests for place of articulation
Results of the model to determine the association between centre of gravity and amount of asymmetry in alveolar obstruents (N = 12,431, adjusted R2 = 0.50)
aUnstandardized regression coefficient.
Table 5 demonstrates that the velar place of articulation yields a highly significant negative coefficient, meaning that velar phonemes exhibit less asymmetry than alveolar phonemes. As might be expected, the amount of asymmetry is not significantly different between post-alveolar and alveolar phonemes. The pairwise comparisons (Table 6) demonstrate that only the contrast between velars and alveolars is significant (p = 0.008). A further interesting observation is that, in this second model, and in contrast to the first model, fricatives have a negative coefficient relative to plosives (see Table 5). Therefore, in a model that uses a reduced set of phonemes, includes the effect of Place, and examines the amount of asymmetry only in the region of maximum constriction, fricatives are found to exhibit less asymmetry than plosives.
3.3 Centre of gravity
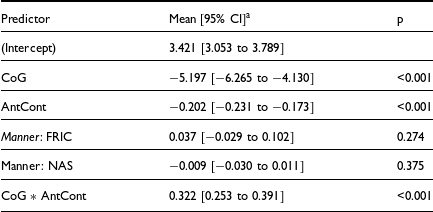
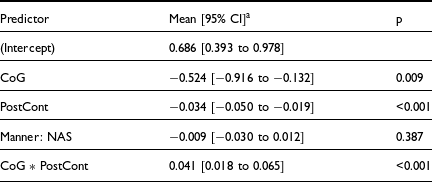
The last two models examined the association between CoG and amount of asymmetry for phonemes with a fixed nominal place of articulation. The alveolar model included the phonemes /t, d, n, s, z/, while the velar model investigated /k, g, η/. The regression coefficients are shown in Table 7 (alveolar) and Table 8 (velar), from which it can be seen that in both models, CoG has a negative association with the amount of asymmetry in the region of maximum constriction. This implies that, for a given nominal place of articulation, productions that are more anterior (i.e., have a higher CoG) are less asymmetrical. However, the regression coefficients suggest that this effect is considerably stronger for the anterior phonemes. This is confirmed by comparing the F-statistics for the effect of CoG in the two models (noting that statistical significance has been computed using the Satterthwaite approximation): F = 91.0, p = 0.002 for the alveolar model; F = 6.86, p = 0.085 for the velar model.
Results of the model to determine the association between centre of gravity and amount of asymmetry in velar obstruents (N = 3,256, adjusted R2 = 0.29)
Unstandardized regression coefficient.
4. Discussion
The objective of this study was to develop a new approach to the analysis of side-to-side asymmetry in tongue–palate contact in electropalatographic studies and to apply this method to the analysis of linguopalatal speech sounds in English. The method presented here differs from that used in previous studies in two important aspects. First, it employs an asymmetry metric, adapted from Articulate Instruments Ltd. (2010), which is more sensitive than the metric used in previous studies (Marchal & Espesser, Reference Marchal and Espesser1987) and substantially reduces unwanted features of the probability distribution (e.g., discontinuities and zero inflation). This results in a variable that is more amenable to statistical analysis. A second important aspect of the approach is that it controls for the overall amount of tongue–palate contact, which is a confounding factor when measuring asymmetry using either index. Application of the proposed methodology to a large dataset of electropalatographic recordings of English utterances provided insights into the asymmetry of linguopalatal speech sounds in English.
4.1 Manner of articulation
As far as the manner of articulation of consonants is concerned, it is clear that central and lateral approximants exhibited the greatest amount of asymmetry. As for fricatives, the results were mixed – in the first model, fricatives were only marginally more asymmetrical than plosives (and this result did not meet statistical significance), while in the second model, which (i) used a reduced set of phonemes, (ii) included the Place variable, and (iii) only measured asymmetry in the part of the palate corresponding to the place of articulation, fricatives were actually less asymmetrical than plosives (p = 0.044). Finally, in the third model, which again restricted the measurement of asymmetry to the part of the palate corresponding to the place of articulation and only examined the alveolar obstruents, the fricatives and plosives showed no significant difference in asymmetry (Table 7). Therefore, there is no clear trend for fricatives vs. plosives based on the present study.
This finding is in contrast with Verhoeven et al. (Reference Verhoeven, Mariën, De Clerck, Daems, Reyes-Aldasoro and Miller2019) who reported that fricatives exhibit more asymmetry than any other speech sound and who hypothesized that the asymmetrical articulation of fricatives may be a strategy designed to increase turbulence, thereby producing more prototypical instances of these sounds. The present data, however, do not support such a hypothesis. This is likely to be, at least in part, a consequence of the fact that the present study corrected for the amount of tongue–palate contact: if /s, z/ and /t, d/ are compared, it is found that the mean anterior asymmetry is 0.224 for the plosives and 0.358 for the fricatives, but at the same time, the mean anterior contact (in terms of the number of electrodes) is 16.3 for the plosives and 12.7 for the fricatives. Thus, since the current study controls for the amount of contact, and remembering that less contact implies greater asymmetry, the difference in asymmetry between fricatives and plosives disappears in this study – i.e., it is fully accounted for by the difference in amount of contact. The discrepancy between the two studies may also be partly due to the different languages included in Verhoeven et al. (Reference Verhoeven, Mariën, De Clerck, Daems, Reyes-Aldasoro and Miller2019): this meta-study included a very wide range of languages, some of which have posterior fricatives, and these might exhibit less contact than some approximants (unlike English, where the fricatives have more contact than /j, r, l/).
Another study worth mentioning is Farnetani (Reference Farnetani1988), which has limited data, but shows greater asymmetry for /l/ than for /t/ (in common with the present study). Although Farnetani did not investigate any fricatives, she calculated the amount of asymmetry in the half of the palate corresponding to the primary place of articulation – a measure that goes some way towards reducing the confounding effect of the amount of contact. Therefore, the comparison with the present study is more valid than the comparison with Verhoeven et al. (Reference Verhoeven, Mariën, De Clerck, Daems, Reyes-Aldasoro and Miller2019).
The findings of the present study indicate that central and lateral approximants are the most asymmetrical manners of articulation. This is consistent with several previous observations. As far as the lateral approximant /l/ is concerned, the large degree of asymmetry in tongue–palate contact is consistent with the fact that this speech sound is often produced with unilateral contact only. For example in a large (impressionistic) study on the production of /l/ in 357 speakers (Hamlet, Reference Hamlet1987), it was found that 51% of all lateral approximants were articulated with unilateral contact, with approximately equal frequency of right- and left-sided productions (25% vs. 26%). Note that unilateral contact would translate to a maximum value for the dependent variable used in this study, i.e., $\left| {{I_{as}} - 4} \right|$
= 3.5.
$\left| {{I_{as}} - 4} \right|$
= 3.5.
As far as the central approximants are concerned, the amount of asymmetry in these speech sounds was found to be 0.335 higher (on average) than the amount of asymmetry in plosives. This is consistent with Miller et al. (Reference Miller, Constantino Reyes-Aldasoro and Verhoeven2019), despite the many methodological differences between the two studies.
4.2 Place of articulation
The second model showed that velar phonemes exhibit less asymmetry than alveolar phonemes. This contradicts the findings of Farnetani (Reference Farnetani1988), who reported that /t/ was less asymmetrical than /k/ in two speakers, while the opposite was the case for the third speaker. Verhoeven et al. (Reference Verhoeven, Mariën, De Clerck, Daems, Reyes-Aldasoro and Miller2019) showed no statistically significant effect of place, but as mentioned earlier, their study measured asymmetry across the whole palate (front and back). Greater asymmetry in alveolar sounds than in velar sounds seems logical given that the tongue tip is the most flexible and mobile part of the tongue and exhibits the largest displacements (Derrick & Gick, Reference Derrick and Gick2021). Therefore, for a given angle of deviation of the tongue from its central axis, the front of the tongue would be displaced further from the midline than the back of the tongue.
4.3 Centre of gravity
For obstruent phonemes with a fixed nominal place of articulation, productions that were more anterior showed less asymmetry. This was particularly the case for the alveolar phonemes, while the effect was much less marked for the velars. Furthermore, asymmetry measurements derived from posterior phonemes are inherently less reliable because for some speakers, the palate does not extend far enough back in the mouth to capture the full pattern of contact. In the light of these two considerations, it is probably prudent to interpret the finding in the context of the alveolar phonemes only. A possible explanation for the alveolars would be as follows. The shape of the hard palate flattens out anterior to the alveolar ridge; therefore, alveolar productions that are more anterior make contact with a flatter surface (compared to productions that make contact at or behind the alveolar ridge). This means that, for a given amount of asymmetry in the elevation of the tongue, the pattern of tongue–palate contact will be more symmetrical when the tongue makes contact at a more anterior position where the palate is flatter.
4.4 Limitations
It should be noted that this study had a number of limitations. Firstly, the study was carried out on a relatively small number of speakers. Secondly, in some speakers, the artificial palate may not have extended far enough back in the mouth to capture the full pattern of contact for the velar phonemes – an inherent limitation of EPG. A further inherent limitation of EPG is that the data are 2D, so it is not possible to distinguish between asymmetry in terms of tongue elevation and asymmetry due to the contour of the palate. Finally, this study did not take into account allophonic variation resulting from the phonetic environment in which speech sounds occur.
4.5 Future work
On the basis of this work, several areas of future work can be identified. Firstly, it would be useful to examine the temporal behaviour of asymmetry in tongue–palate contact, which relates to tongue positioning in the transition from the approach phase to the point of maximum contact, and then in the transition from the point of maximum contact to the release phase. There have been indications that, in a given speaker, there are asymmetries in the release of tongue contact that are relatively consistent with regard to the side on which contact is lost (in the case of unilateral contact loss) and the sequential order of contact loss (in the case of bilateral contact loss) (Gick et al., Reference Gick, Allen, Roewer-Després and Stavness2017). A further motivation for studying the temporal behaviour of asymmetry is that it could shed light on potential differences in asymmetry between plosives and fricatives. In the present study, there was no significant difference in asymmetry between these two manners of articulation. However, if voiceless plosives were to be examined at their point of release (rather than at their point of maximal closure), it is likely that the pattern of contact, as well as the amount of contact, would more closely resemble that of a fricative. Having corrected for differences in contact patterns, a difference in the amount of asymmetry exhibited by fricatives and plosives might emerge.
Secondly, it would be worthwhile examining the amount of asymmetry as a function of the phonetic and phonological context in which the speech sounds occur. Examples of factors that could be investigated include the adjacent speech sound (e.g., consonant vs. vowel, vowel height, vowel backness), stress, syllabic context (onset vs. coda), and allophonic variations (e.g., clear vs. dark /l/, unreleased plosives, pre-glottalisation). The effect of vowel context on articulatory asymmetry might be particularly relevant in the case of velar phonemes due to the strength of the phenomenon of velar-vowel coarticulation. To study these additional factors, the follow-up study should involve a larger number of speakers (to facilitate the detection of small effect sizes) and speech stimuli that have been carefully designed to investigate the effect of each factor separately.
Thirdly, the investigation of asymmetry in other accents of English and in other languages would be worthwhile. With regard to accents of English, the fact that approximants exhibit the greatest amount of asymmetry suggests that it would be interesting to determine whether this finding persists across accents, which often exhibit considerable variation in the realization of approximants. As far other languages are concerned, it would be beneficial to include languages with phonologies that are more orthogonal than that of English with regard to, for instance, the presence of both anterior and posterior fricatives.
6. Conclusions
The main contribution of this study pertains to the measurement and modelling of asymmetries in the articulation of the linguopalatal speech sounds of British English. Specifically, this study used an asymmetry metric that is more sensitive than the one proposed by Marchal and Espesser (Reference Marchal and Espesser1987), which has been widely used in previous studies. The present metric reduces the incidence of unwanted features of the frequency distribution, such as jump discontinuities and zero inflation (noting that a value of zero corresponds to a symmetrical pattern of contact), thereby facilitating statistical analysis. A further significant feature of the proposed methodology is that it emphasizes the importance of controlling for the amount of tongue–palate contact in the analysis of articulatory asymmetries. Thirdly, the study highlights the benefits of calculating asymmetry in the region of the palate that corresponds to the place of articulation of the speech sound.
Application of the proposed methodology to a large corpus of speech sounds (N = 22,004) showed that lateral approximants, in terms of their manner of articulation, are the most asymmetrical speech sounds, followed by central approximants. In contrast to previous studies, fricatives were not found to be consistently more asymmetric than obstruents. In terms of the place of articulation, velar speech sounds exhibited less asymmetry than alveolar speech sounds. Some limitations and directions for future research were discussed.
Acknowledgements
This work was funded by Leverhulme Trust Research Project Grant RPG-2017-054.


 Open access