


Introduction
The term “evolvability” refers to those characteristics that confer a disposition to evolve under a causal stimulus, such as natural selection. In most modern usages, evolvability is tied to the ability of a population to produce and maintain evolutionarily relevant genetic variation. Although evolvability is conceptualized somewhat differently across fields of inquiry (Nuño de la Rosa Reference Nuño de la Rosa2017), studies of evolvability share a broad commitment to understanding how different aspects of variation are relevant to evolutionary processes. Evolvability has become increasingly prominent in evolutionary biology through studies that adopt approaches from quantitative genetics (Hansen and Houle Reference Hansen and Houle2008), evolutionary developmental biology (evo-devo; Hendrikse et al. Reference Hendrikse, Parsons and Hallgrímmson2007; Tiozzo and Copley Reference Tiozzo and Copley2015), phylogenetic models of macroevolution (Hunt and Slater Reference Hunt and Slater2016), and experimental evolution (Colegrave and Collins Reference Colegrave and Collins2008).
Paleontology has a long history of investigating questions of evolvability (e.g., Simpson Reference Simpson1944; Eldredge and Gould Reference Eldredge, Gould and Schopf1972; Vermeij Reference Vermeij1973a,Reference Vermeijb), but these efforts are often unfamiliar to most neontological investigators of evolvability. Similarly, neontological thinking about evolvability also could be unfamiliar to paleontologists. This disconnect remains, in part, because the study of evolvability in the fossil record has seemed intrinsically difficult. The challenge arises largely because of obstacles in disentangling whether the causes of evolutionary patterns arise from variational properties of traits or lineages (“evolvability” features) or properties of the abiotic or biotic environment (sources of selection and ecological success), both of which might generate similar if not indistinguishable outcomes in deep time (Jablonski Reference Jablonski2017a,Reference Jablonskib, Reference Jablonski2020; Jackson Reference Jackson2020). These difficulties are often viewed as a rationale for investigating questions about evolvability using other, primarily neontological approaches, because they harbor the promise of discriminating between variational contributions and selective components, especially through experimental manipulation of variables related to trait generation or selective regime under highly controlled conditions (Colegrave and Collins Reference Colegrave and Collins2008; Payne and Wagner Reference Payne and Wagner2019).
Importantly, this rationale ignores the distinctive empirical resources that paleontological studies bring to questions about evolvability. Despite the challenges of disentangling the variational and environmental causal factors responsible for evolutionary trajectories in the history of life, the fossil record is unique in offering data that span millions of years and therefore capture evolutionary processes of sustained duration and significance that are otherwise inaccessible to evolutionary biologists (Dilcher Reference Dilcher2000; Bell Reference Bell2014; Jablonski and Shubin Reference Jablonski and Shubin2015; Jackson Reference Jackson2020), including the directionality of evolutionary change for particular traits. At a minimum, it is critical to find an appropriate balance between what paleontology is uniquely positioned to offer to the study of evolvability and what is impossible because of the absence or loss of pertinent information.
Paleontology not only offers an unparalleled and ever-increasing data resource, but its value is augmented when combined strategically with other approaches to evolvability. Consider first the intersection of quantitative genetics and paleontology. A pioneering study (Cheverud Reference Cheverud1988) suggested that a standardized summary of the multivariate phenotypic relationships among a set of traits (i.e., the P matrix, or phenotypic variance–covariance matrix), which can be derived from fossil evidence, could serve as a reliable proxy for the standardized summary of multivariate genetic relationships among a set of traits (i.e., the G matrix, or additive genetic variance–covariance matrix), whose geometry shapes the direction of evolution in response to selection (Lande Reference Lande1979). Subsequently, a number of studies have profitably analyzed morphological traits using fossil data that take advantage of this proxy inference (e.g., Renaud et al. Reference Renaud, Auffray and Michaux2006; Hunt Reference Hunt2007; Brombacher et al. Reference Brombacher, Wilson, Bailey and Ezard2017). Another example is found in combining evo-devo approaches with paleontology. On the assumption that ontogenetic processes are conserved from fossil taxa to their modern relatives, sufficient developmental information can yield predictions about which traits and lineages may be more likely to produce phenotypic variation relevant to evolutionary processes (Urdy et al. Reference Urdy, Wilson, Haug and Sánchez-Villagra2013), such as models of mammalian molar development predicting the evolvability of different dental traits (e.g., Jernvall Reference Jernvall2000; Salazar-Ciudad and Jernvall Reference Salazar-Ciudad and Jernvall2010). A third example is how evolvability has been analyzed using phylogenetic models at the level of macroevolution, where species-level trait variance can be correlated with key variables such as speciation rates in a lineage (see, e.g., Rabosky Reference Rabosky2012). Increased evolvability has been implicated in dramatic morphological evolution via changes to the structure of developmental modules using phylogenetic models (Parins-Fukuchi Reference Parins-Fukuchi2020).
Our aim in the present paper is to make an explicit case for studying evolvability in the fossil record with special attention to the advances that can be derived from fruitful cross-disciplinary collaborations in evolutionary biology. We begin by recalling key examples from the history of paleontology where questions about evolvability were under scrutiny, sometimes in the guise of alternative terminology, and accentuate the unique position of the fossil record for informing questions about evolvability. Next, we illustrate in detail how paleontology is working in combination with other approaches to yield new insights into evolvability, focusing on three primary partnerships: quantitative genetics, evo-devo, and phylogenetically informed macroevolutionary modeling. In conclusion, we offer a methodological schema that focuses on the conceptualization, measurement, and testing of hypotheses for investigating evolvability that yields several potential avenues of research on outstanding questions that exploit both the distinctive contribution of paleontology and the interdisciplinary synergy available with other approaches in evolutionary biology. Overall, this generates a strong motivation for empirical and theoretical studies of evolvability in the fossil record.
Evolvability and Paleontology: Classical Studies and Controversies
The modern concept of evolvability focuses on the variational properties of traits, especially how the relationship between genotype and phenotype mediated by development establishes the capacity of traits to drift and respond to selection (Houle Reference Houle1992; Wagner and Altenberg Reference Wagner and Altenberg1996). Many paleontological studies examine phenotypic variation, including those pertaining to taxonomic richness, morphological disparity, functional diversity, and morphological change in single or multiple related lineages, but few directly invoke the term “evolvability” or attempt to connect with its modern meanings. However, some classics in the paleontological literature stand out as pioneering ideas closely aligned with and sometimes predating the modern evolvability concept. For example, in Tempo and Mode in Evolution, Simpson noted that the “capacity of … animals to differ” is distinct from the expression of differences among individuals (i.e., realized variation) and the inheritance of phenotypes (Simpson Reference Simpson1944: p. 30), a perspective he saw explicitly in earlier paleontological discussions (e.g., Rosa Reference Rosa1899). In a related vein, Vermeij (Reference Vermeij1973b) claimed that there was an “increase in potential versatility of form” through geological time, which he supported with an example of how the number of parameters required to describe coiling in gastropods increased over the Phanerozoic. Another example of a trend in versatility comes from Adamowicz et al. (Reference Adamowicz, Purvis and Wills2008), who documented parallel increases within multiple lineages of crustaceans in the number of different types of limbs. According to Vermeij (Reference Vermeij1973a), groups with a greater potential versatility of form replaced those that exhibited this capacity to a lesser degree.
Beyond these classic exemplars, there is a rich literature on the temporal dynamics of morphological disparity among taxa that points to changing patterns of new traits and trait combinations over long time spans (reviewed in Foote Reference Foote1997; Hughes et al. Reference Hughes, Gerber and Wills2013). Some groups, once evolved, seem constrained in morphospace, whereas previously occupied regions of morphospaces, once vacated, are sometimes not reoccupied. Although these patterns are the combined outcome of both evolvability and ecological success or failure (i.e., selection), the relevance of evolvability explanations has long been recognized, usually considered in terms of constraints—the lack of evolvability in some guise (Raup Reference Raup1967; Blake Reference Blake1980; Maynard Smith et al. Reference Maynard Smith, Burian, Kauffman, Alberch, Campbell, Goodwin, Lande, Raup and Wolpert1985; Gould Reference Gould1989; Allmon and Ross Reference Allmon, Ross, Ross and Allmon1990; Erwin Reference Erwin2007; Vermeij Reference Vermeij2015; Wright Reference Wright2017; Jablonski Reference Jablonski2020; see Brigandt [Reference Brigandt and Love2015] about the usage shift from constraint to evolvability and on the relationship between these two concepts). The connection between morphospace exploration and evolvability has been perhaps most explicit in discussions of the dramatic explosion of disparity in the Cambrian Period. Two classes of (non-mutually exclusive) hypotheses have been commonly considered: (1) those that emphasize ecological opportunities afforded by nearly unoccupied early Paleozoic ecosystems or environmental triggers such as changes in the amount of dissolved oxygen in seawater that facilitate the formation of biomineralized skeletons, and (2) those that posit genetic or developmental processes facilitating elevated expression of morphological variation in the Cambrian (Cisne Reference Cisne1974; Erwin Reference Erwin1994; Valentine Reference Valentine1995; Webster Reference Webster2007, Reference Webster2019; Erwin and Valentine Reference Erwin and Valentine2013). The first class of explanations invokes selection and ecological success, whereas the second relates to evolvability.
Similarly, stasis within fossil species can be explained by mechanisms that are either extrinsic, related to natural selection, or intrinsic, related to the variational potential of populations. Eldredge and Gould's (Reference Eldredge, Gould and Schopf1972) original suggestion for the cause for stasis was that variational constraints would be relaxed at speciation. This specific explanation did not fare well, as Gould himself later acknowledged (Gould Reference Gould2002), but more modern versions suggested that stasis may result when traits lack variation or if most variation is bound up in correlations with other traits (Hansen and Houle Reference Hansen, Houle, Pigliucci and Preston2004, Reference Hansen and Houle2008). In opposition to these explanations are those that view stasis as the outcome of stabilizing natural selection (Charlesworth et al. Reference Charlesworth, Lande and Slatkin1982; Estes and Arnold Reference Estes and Arnold2007; reviewed by Hunt and Rabosky Reference Hunt and Rabosky2014).
Extinction as a failure of evolvability is implicit in Van Valen's Red Queen hypothesis (Van Valen Reference Van Valen1973), which envisions species at a constant risk of extinction because they must continually adapt in the face of changing environments, as well as to other species that are continually improving. However, studies that explicitly test whether evolvability (as reflected in, e.g., trait variation) protects against species extinction are still quite rare (Liow Reference Liow2007; Hopkins Reference Hopkins2011; Kolbe et al. Reference Kolbe, Zambito, Brett, Wise and Wilson2011). Quantitative genetics suggests distinctive strategies for measuring trait variation in the fossil record that can provide further unique insights into evolvability on geological timescales.
Quantitative Genetics in the Rock Record
Estimating G Matrices from P Matrices Drawn from Fossils
Evolutionary quantitative genetics is a theoretical framework linking selection and genetic variation to evolutionary change (Lynch and Walsh Reference Lynch and Walsh1998; Walsh and Lynch Reference Walsh and Lynch2018). Central to this framework is the Lande equation (Lande Reference Lande1976, Reference Lande1979; Lande and Arnold Reference Lande and Arnold1983), which permits the response to selection to be decomposed into (1) the pattern of genetic variation and covariation among traits (summarized in the genetic variance–covariance [G] matrix) and (2) the strength and direction of selection on individual traits (e.g., from environmental factors). This decomposition formally separates evolutionary change into evolvability-related and selection-related components. As most traits do not exist as autonomous units and are unable to respond to selection independently of other traits (Lande Reference Lande1979; Cheverud Reference Cheverud1982a; Lynch and Walsh Reference Lynch and Walsh1998; Hansen et al. Reference Hansen, Armbruster, Carlson and Pélabon2003a; Hansen and Houle Reference Hansen and Houle2008; Walsh and Blows Reference Walsh and Blows2009), a multivariate theoretical formulation of natural selection and variation is necessary to gain a more satisfactory understanding of evolutionary change.
In the Lande equation, Δz = Gβ, Δz is the response to selection (a vector with the amount of change in each measured trait), G is the additive genetic variance–covariance matrix (or G matrix) among those traits, which quantifies the role of the genetic system in evolution, and β is the selection gradient, which quantifies the amount and direction of selection on each trait independent of other traits (Fig. 1). Hansen and colleagues (Hansen et al. Reference Hansen, Armbruster, Carlson and Pélabon2003a,Reference Hansen, Pélabon, Armbruster and Carlsonb; Hansen and Houle Reference Hansen and Houle2008) later used the Lande equation to develop a theoretical framework connecting the G matrix to short-term evolutionary potential through the concept of evolvability (Houle Reference Houle1992), which describes a population's ability to evolve in the direction of selection when stabilizing selection is absent (Hansen and Houle Reference Hansen and Houle2008).
Geometry of the Lande equation. The three elements of the Lande equation are the direction and the magnitude of selection (β, dotted arrow), the amount of additive genetic variance in the direction of trait change (G, gray circle/ellipse), and the response to selection (Δz, solid arrow). The closed black and open gray circles represent the trait mean before and after the selection event, respectively. A, Δz and β point in the same direction, as there is no genetic covariance between the two traits. B, The evolutionary response is deflected toward the direction with the largest amount of genetic variance (solid line) due to the genetic covariance between trait 1 and trait 2. The direction with the largest amount of genetic variance (i.e., the direction with highest evolvability) is what Schluter (Reference Schluter1996) named the “line of least resistance.” In the context of allometry (see “Allometry, Evolvability, and Fossils”), the direction of trait evolution predicted by the allometric relationship will be similar to the “genetic line of least resistance” if P closely resembles G.

Traits are often measured in different units or have very different amounts of variation. This makes it challenging to interpret the magnitude of variation, selection, and response. One natural way of interpreting these numbers is on a proportional scale, which can be achieved by log transformation or standardizing by the trait mean. To calculate a proportional evolvability, we can divide additive genetic variance by the trait mean squared (i.e., evolvability equals a mean-standardized additive genetic variance). This measure of evolvability predicts an expected proportional response to selection that is as strong as that on fitness. For example, an evolvability of 0.10 means the expected response in the trait mean per generation is 10% given selection as strong as selection on fitness itself. Typically, observed directional selection is on the order of 10% as strong as the selection on fitness (Hereford et al. Reference Hereford, Hansen and Houle2004). This concept of evolvability also can be used to generate hypotheses about the direction and strength of selection (β) responsible for past evolutionary change (Δz).
For many evolutionary biologists and paleontologists, quantitative genetics seems irrelevant for studies of macroevolution, including paleontology, because of empirical evidence and theoretical considerations that imply G can evolve rapidly (e.g., Arnold et al. Reference Arnold, Burger, Hohenlohe, Ajie and Jones2008). If G is likely to evolve within short timescales, then its power to predict evolution is severely limited.
Although we know G can evolve (Steppan et al. Reference Steppan, Phillips and Houle2002), directions of diversification among populations are often aligned with above-average genetic variation. Schluter (Reference Schluter1996) was the first to show empirically that G can have a detectable influence on the direction of evolution across macroevolutionary timescales. Schluter also suggested that genetic constraints would predict phenotypic divergence along “lines of least genetic resistance”—phenotypic divergence in directions aligned with above-average additive genetic variance (Fig. 1B). Several studies have found such a pattern (reviewed in Bolstad et al. Reference Bolstad, Hansen, Pélabon, Falahati-Anbaran, Pérez-Barrales and Armbruster2014). More recently, the concept of evolvability has been used as a general framework to compare genetic variation measured within populations with rates of phenotypic divergence among populations across traits. There is growing evidence that evolvability can predict patterns of macroevolution at surprisingly long timescales. For example, Bolstad et al. (Reference Bolstad, Hansen, Pélabon, Falahati-Anbaran, Pérez-Barrales and Armbruster2014) found that patterns of genetic variation in contemporary populations of the plant Dalechampia predicted macroevolutionary divergence within the genus on million-year timescales. Houle et al. (Reference Houle, Bolstad, van der Linde and Hansen2017) showed that standing genetic variation within a population of the insect Drosophila melanogaster was strongly correlated with phenotypic divergence across the Drosophilidae, which represents at least 40 Myr of evolution (see also McGlothlin et al. Reference McGlothlin, Kobiela, Wright, Mahler, Kolbe, Losos and Brodie2018). These studies suggest that evolutionary quantitative genetics may be applicable to much longer timescales than were considered previously. Paleontologists are well situated to contribute to the testing of the generality of these results.
Robust estimates of G normally require measurements of large numbers of families of known pedigree (i.e., relationships among relatives). Properly estimating G is a major undertaking even in living populations (Steppan et al. Reference Steppan, Phillips and Houle2002; Dochtermann Reference Dochtermann2011; Charmantier et al. Reference Charmantier, Garant and Kruuk2014); it is close to impossible for most taxa found in the fossil record. Fortunately, the phenotypic variance–covariance matrix, P, is both estimable in many paleontological settings and a possible proxy for G. P is the sum of G and other sources of phenotypic variation, notably the effects of the environment. Cheverud (Reference Cheverud1988) conjectured that P can be proportional to G based on three cogent arguments (Fig. 2). First, many quantitative traits have heritabilities of a magnitude that suggests G accounts for a substantial proportion of the variation measured by P. Second, the nongenetic variation in P arises through the same developmental and physiological pathways that structure G, and thus may have a similar pattern (Cheverud Reference Cheverud1984). Finally, if the first two legs of the conjecture hold, estimates of P may better estimate the true G than direct estimates of G based on small, imprecise experiments. The precision of a G matrix is a function of the number of families, while the precision of a P matrix is a function of the (much larger) number of individuals measured.
Heritability, proportionality of G and P, and Cheverud's conjecture. Panels schematically illustrate how G and P are related and how trait heritability affects the relationship. A and B show proportional G and P; C and D show disproportional G and P. A and C show traits with heritability of 0.5 (i.e., 50% of phenotypic variation is attributable to genetic variation); and B and D show traits with heritability of 0.2. In each panel, the dark gray ellipse represents the P matrix and the light gray ellipse represents the G matrix. In C and D, G is rotated to be maximally dissimilar to P. Cheverud's conjecture holds in situations depicted in A and B. In highly heritable traits, represented by C, there is an upper limit on the dissimilarity between G and P.

Evidence for and against Cheverud's conjecture has accumulated (Kohn and Atchley Reference Kohn and Atchley1988; Roff Reference Roff1995, Reference Roff1996, Reference Roff1997; Simons and Roff Reference Simons and Roff1996; Reusch and Blanckenhorn Reference Reusch and Blanckenhorn1998; Waitt and Levin Reference Waitt and Levin1998; de Oliveira et al. Reference de Oliveira, Porto and Marroig2009; Porto et al. Reference Porto, de Oliveira, Shirai, De Conto and Marroig2009; Martínez-Abadías et al. Reference Martínez-Abadías, Esparza, Sjøvold, González-José, Santos, Hernández and Klingenberg2012). The validity of the conjecture in nonmorphological traits is controversial (Atchley et al. Reference Atchley, Rutledge and Cowley1981; Lofsvold Reference Lofsvold1986; Hadfield et al. Reference Hadfield, Nutall, Osorio and Owens2007), while a recent review confirms that P and G are generally similar for the morphological traits that paleontologists can measure (Sodini et al. Reference Sodini, Kemper, Wray and Trzaskowski2018). Therefore, using P as an estimate of G enables paleontologists to strategically utilize evolutionary quantitative genetic tools.
Rather than simply substituting P for G, it is also possible to test evolutionary hypotheses about whether evolution likely occurred through selection or drift across a range of values for trait heritability, which would scale elements of the known P to produce a hypothetical G that can be tested (e.g., Polly Reference Polly2004). For example, Cheverud (Reference Cheverud1988) argued that the average heritabilities for morphological characters (0.3–0.4) could be used to scale a P matrix of this trait type to obtain an estimate of G. More generally, testing both if and how a range of heritability values affects the results could clarify how large an effect G would have and define areas of parameter space that are highly improbable. Another possibility for estimating G from fossils is by quantifying bilateral asymmetry (e.g., Polly et al. Reference Polly, Killick and Ruddy2011; Webster and Zelditch Reference Webster and Zelditch2011a). Differences between symmetric structures in an organism are assumed to be due to nongenetic factors, and thus a rough G can be calculated by correcting for the nongenetic factors that go into P (see also Leamy and Klingenberg Reference Leamy and Klingenberg2005). However, this approach has caveats. First, the estimate of nongenetic factors should be assumed to be a minimum, because environmental effects can affect bilateral structures in a symmetrical way. Second, the structures are assumed to be truly symmetric rather than having directional asymmetry due to ecological function (e.g., claw size in fiddler crabs).
An important cautionary note when estimating P from fossil data is that the population variance of fossil samples may be inflated due to changes in the population mean over the timescale captured by the sample. However, fossil samples have been found to show levels of trait variances and covariances similar in magnitude with estimates from extant, non–time averaged populations (Hunt Reference Hunt2004). In addition, the richness of the fossil record varies substantially among taxa, and not all fossil species have sufficient sample sizes to robustly estimate P. Cheverud (Reference Cheverud1988) suggested at least 40 individuals were needed for a reasonably accurate P for G substitution, but larger sample sizes are required as the number of traits increase and to accurately estimate some evolvability statistics (Grabowski and Porto Reference Grabowski and Porto2017). One potential solution is to use P (or G) matrices from extant species as a substitute for unknown fossil G matrices (Ackermann and Cheverud Reference Ackermann and Cheverud2004; Young et al. Reference Young, Wagner and Hallgrímsson2010; Grabowski et al. Reference Grabowski, Polk and Roseman2011; Hansen and Voje Reference Hansen and Voje2011; Grabowski and Roseman Reference Grabowski and Roseman2015; Baab Reference Baab2018). This assumes that the estimated P or G from the extant population is similar enough to G in the ancestral, extinct population. Based on similarities between closely related extant species, a wide array of work (both neontological and paleontological) has assumed that P (or G) from an extant population is representative of the ancestral G, which has allowed researchers to make evolutionary inferences from phenotypic data across macroevolutionary timescales in ways that would otherwise be impossible (Ackermann and Cheverud Reference Ackermann and Cheverud2004; de Oliveira et al. Reference de Oliveira, Porto and Marroig2009; Rolian Reference Rolian2009; Marroig and Cheverud Reference Marroig and Cheverud2010; Young et al. Reference Young, Wagner and Hallgrímsson2010; Grabowski et al. Reference Grabowski, Polk and Roseman2011; Grabowski Reference Grabowski2013; Baab Reference Baab2018; Villamil Reference Villamil2018; Savell Reference Savell2020; Agosto and Auerbach Reference Agosto and Auerbach2021).
Paleontological studies that estimate P matrices exemplify how some paleontological model systems are well suited for exploring a potential role of evolvability in macroevolution. Hunt's (Reference Hunt2007) study on phenotypic divergence in the ostracode genus Poseidonamicus is one example. Analyzing morphological traits from 51 fossil samples spanning a time interval of about 40 Myr, Hunt showed a positive relationship between phenotypic variation within fossil samples and the directions of evolutionary change in different lineages—a relationship that weakened with elapsed time. The ability to study the duration of the effect of trait variation on evolutionary change exemplifies a unique advantage paleontological data bring to the study of evolvability. Another example is Brombacher et al. (Reference Brombacher, Wilson, Bailey and Ezard2017), who estimated the phenotypic variances from 75 samples of two fossil lineages of planktonic foraminifera (Truncorotalia crassaformis and Globoconella puncticulata) across 500 kyr. They concluded that the within-sample covariance generally predicted evolution from one sample to the next. However, major changes in climate caused this prediction to break down. A similar conclusion was reached by Renaud et al. (Reference Renaud, Auffray and Michaux2006) in their investigation of how variational properties of fossil samples of two closely related rodent species affected their evolution.
Perhaps the best example of a paleontological study system that can connect the concept of evolvability from quantitative genetics to long-term phenotypic evolution is work on the bryozoan genus Metrarabdotos (Cheetham et al. Reference Cheetham, Jackson and Hayek1994). This work capitalized on the clonal nature of bryozoans, which permits estimates of the broad-sense G matrix (a quantification of the effects of genotypes on resemblance between individuals) from variation among genetically identical zooids within a colony. In contrast, the G matrix of the Lande equation, also known as the narrow-sense G matrix, measures just the part of inheritance that causes outbred offspring to resemble their parents. Evidence suggests broad-sense and narrow-sense G matrices may be similar to each other for morphological traits that can be measured from fossils. Although methodological issues obfuscate the original conclusions on evolutionary tempo and mode within the bryozoan clade (Voje et al. Reference Voje, Martino and Porto2020), this work—along with that of others (Renaud et al. Reference Renaud, Auffray and Michaux2006; Hunt Reference Hunt2007; Hubbe et al. Reference Hubbe, Melo and Marroig2016; Brombacher et al. Reference Brombacher, Wilson, Bailey and Ezard2017)—exemplifies how evolutionary quantitative genetics and the concept of evolvability can be operationalized in the fossil record (see also Di Martino and Liow Reference Di Martino and Liow2021).
The potential relationship of P to measures of evolvability helps illuminate links between quantitative genetic reasoning and different conceptions of evolvability, such as Vermeij's (Reference Vermeij1973a,Reference Vermeijb) concept of versatility. Vermeij argued that the development of form is analogous to a problem in analytical geometry where the number of parameters in the generating equation determines the ways in which form may vary. In this analogy, the developmental system dictates the complexity of the generating equation with the number of parameters in that system being capable of independent variation. For example, Vermeij (Reference Vermeij1973a) hypothesized that mollusk shells were ancestrally conical, then evolved planispiral forms, and finally acquired the ability to vary conispirally. In terms familiar to quantitative genetics, this hypothesis suggests that the ancestral forms would vary only in the rate at which the cone expands and the asymmetry of the cone's opening, but not with respect to the central axis of growth. The evolution of planispiral forms would increase evolvability in the rate at which the shell curves, while conispiral forms would also be capable of varying in the vertical translation of the center of growth. This hypothesis could be tested with data on phenotypic variation derived from the fossil record along the lines described earlier.
Allometry, Evolvability, and Fossils
Another theoretical framework that connects paleontological data to evolvability is the study of allometry (Huxley Reference Huxley1932; Gould Reference Gould1966; Lande Reference Lande1979, Reference Lande and Jungers1985). Allometry is commonly expressed as a power function in the form of Y = aXb, where X is overall size and Y is the size of a part. Depending on the level of comparison, three conceptually distinct kinds of allometry can be defined: (1) ontogenetic allometry characterizes variation among individuals at different growth stages from embryo to adult, (2) static allometry characterizes variation among individuals of the same life stages (typically adults), and (3) evolutionary allometry characterizes variation across populations or species (Cheverud Reference Cheverud1982b). Over the past decade, there have been developments in the concepts and tools used to study allometry in the context of quantitative genetics (Houle et al. Reference Houle, Pélabon, Wagner and Hansen2011; Pélabon et al. Reference Pélabon, Bolstad, Egset, Cheverud, Pavlicev and Rosenqvist2013; Voje et al. Reference Voje, Hansen, Egset, Bolstad and Pélabon2014) and based on arguably invariant physical and chemical principles (i.e., metabolic theory of allometry; West et al. Reference West, Brown and Enquist1997; Brown et al. Reference Brown, Gillooly, Allen, Savage and West2004). Of these, we focus on the former, because quantitative genetics is a framework that allows us to make predictions about phenotypic evolution from evolvability. Ontogenetic and static allometries are particularly relevant for evolvability, because they are summary statistics for the variance and covariance of a trait with overall size. Size is often a “line of least evolutionary resistance” (Marroig and Cheverud Reference Marroig and Cheverud2005), and traits are commonly more evolvable in the direction predicted by the allometric relationship compared with other directions, similar to the concept of “genetic lines of least resistance” (e.g., Schluter Reference Schluter1996; Fig. 1B). Furthermore, the direction of trait evolution predicted by the allometric relation is often found to be conserved among taxa (Voje et al. Reference Voje, Hansen, Egset, Bolstad and Pélabon2014; Fig. 3), suggesting that patterns of developmental and genetic constraints are at play in channeling the evolutionary response of a trait in relation to changes in overall size (Pélabon et al. Reference Pélabon, Firmat, Bolstad, Voje, Houle, Cassara, Rouzic and Hansen2014).
Brain mass–body mass allometry within and among species of the teleost order Perciformes. Gray lines represent the allometric relationship between brain mass and body mass among adult individuals within species (static allometry), whereas a dashed line represents the same relationship across species (evolutionary allometry). Static allometries are estimated using the ordinary least squares. Evolutionary allometry is based on the phylogenetically informed regression method reported in Tsuboi et al. (Reference Tsuboi, van der Bijl, Kopperud, Erritzøe, Voje, Kotrschal, Yopak, Collin, Iwaniuk and Kolm2018): log10(brain mass) = log10(body mass) × 0.496 − 1.73. Circles are species’ means (n = 94 species). The static allometric slopes (mean = 0.45, SD = 0.02) are similar to the slope of evolutionary allometry, which suggests that the static slopes are conserved over geological timescales and constrained in the direction of brain size evolution in Perciformes.

The study of allometry has a rich history within paleontology. Gould's (Reference Gould1974) study of the antler size of the Irish elk Megaloceros giganteus shows two results relevant for evolvability. First, the Irish elk had the predicted antler size of a species of its body size from the pattern of evolutionary allometry across 20 extant species of the subfamily Cervinae. Second, within-species static allometry was similar to the among-species evolutionary allometry of antler and body size. Based on these findings, Gould concluded that the seemingly extravagant antlers of the Irish elk evolved through heterochronic extrapolation of patterns of allometry in Cervinae. Work on horse-skull morphology is another example of allometric relationships in paleontology (Robb Reference Robb1935a,Reference Robbb; Radinsky Reference Radinsky1984). The similarity between the slope of ontogenetic and static allometry of the modern horse and evolutionary allometry among fossil horses has been interpreted as constraining the morphological divergence of the family Equidae in morphospace (Simpson Reference Simpson1944).
The fossil record provides critical data to examine the hypothesis that morphological evolution is constrained to follow the direction of ontogenetic and static allometry due to low evolvability of the allometric slope (“the allometric-constraint hypothesis”; reviewed in Pélabon et al. Reference Pélabon, Firmat, Bolstad, Voje, Houle, Cassara, Rouzic and Hansen2014; Voje et al. Reference Voje, Hansen, Egset, Bolstad and Pélabon2014). The previously mentioned study by Brombacher et al. (Reference Brombacher, Wilson, Bailey and Ezard2017) looked at traits in relation to size and tested the allometric-constraint hypothesis in two lineages of planktonic foraminifera. They estimated the static allometric slope at time step t and evaluated whether this predicted the direction of evolution in the bivariate means at time step t + 1. Within a constant climatic phase, the static allometric slope predicted the direction of among-population morphological divergence, whereas the static slope failed to do so for the divergence across different climatic phases. This pattern is consistent with the idea that allometry serves as a constraint over relatively short timescales, but that allometric slopes evolve and facilitate evolution away from the common allometric trajectory on longer timescales (Voje and Hansen Reference Voje and Hansen2013; Voje et al. Reference Voje, Hansen, Egset, Bolstad and Pélabon2014; Tsuboi et al. Reference Tsuboi, Kotrschal, Hayward, Buechel, Zidar, Lovlie and Kolm2016; Houle et al. Reference Houle, Jones, Fortune and Sztepanacz2019). Within the same conceptual framework, Firmat et al. (Reference Firmat, Lozano-Fernandez, Agusti, Bolstad, Cuenca-Bescos, Hansen and Pélabon2014) detected a pattern supporting allometric constraints in the dental morphology of rodents, though over a relatively short timescale (~600 Kyr). However, the extent to which these results reflect allometric constraints is still an open question, because the traits studied by both Brombacher et al. (Reference Brombacher, Wilson, Bailey and Ezard2017) and Firmat et al. (Reference Firmat, Lozano-Fernandez, Agusti, Bolstad, Cuenca-Bescos, Hansen and Pélabon2014) were weakly correlated with size. This means that evolvability is only modestly reduced in directions away from the allometric relationship. Future studies investigating sets of traits in the fossil record that show a stronger association with overall body size could be illuminating to assess the evolvability of allometric slopes and the predictability of allometry on trait evolution.
Evolutionary Developmental Paleontology
Fossil Evo-Devo
Evolvability is at the center of evo-devo (Hendrikse et al. Reference Hendrikse, Parsons and Hallgrímmson2007). One key intersection between evo-devo and paleontology concerns morphologies recorded by fossils but not present among extant taxa, including intermediate states in important evolutionary transitions. Proximate developmental processes that underpin major evolutionary transitions have been inferred for an increasing number of examples, such as the mammalian inner ear (Luo Reference Luo2011; Luo et al. Reference Luo, Meng, Ji, Liu, Zhang and Neander2015; Urban et al. Reference Urban, Anthwal, Luo, Maier, Sadier, Tucker and Sears2017; Wang et al. Reference Wang, Meng and Wang2019, Reference Wang, Wible, Guo, Shelley, Hu and Bi2021; Le Maitre et al. Reference Le Maitre, Grunstra, Pfaff and Mitteroecker2020), arthropod segmentation (Chipman and Edgecombe Reference Chipman and Edgecombe2019), tetrapod limbs (Stewart et al. Reference Stewart, Lemberg, Taft, Yoo, Daeschler and Shubin2020), and turtle shells (Lyson and Bever Reference Lyson and Bever2020; Schoch and Sues Reference Schoch and Sues2020). Insights from these paleo-evo-devo studies provide a richer understanding of how evolutionary novelties arise and their importance in the history of life (Erwin Reference Erwin2012; Urdy et al. Reference Urdy, Wilson, Haug and Sánchez-Villagra2013; Wagner Reference Wagner2014; Jablonski Reference Jablonski2020). However, cases in which researchers use developmental information to make predictions about the generation of phenotypic variation are most relevant to the topic of evolvability.
Sufficient knowledge of developmental processes, coupled with assumptions or evidence that they are conserved from fossil taxa to their modern relatives, can offer an alternative to the quantitative genetic approach for predicting which traits and lineages may be more likely to produce abundant variation for natural selection and other evolutionary processes (Jackson Reference Jackson2020). For example, the structure of some gene regulatory networks may greatly limit the realization of variation in certain body-plan traits, leading to their profound stability over time (Davidson and Erwin Reference Davidson and Erwin2006). Cell-reflecting structures in ostracod carapaces offer another example. These structures allow for cell divisions to be inferred from ontogenetic changes in reticulation (Okada Reference Okada1981; Liebau Reference Liebau1991), and it has been shown that some divisions in these sequences can be much more variable than others, shaping the variation present in fossil and modern populations (Hunt and Yasuhara Reference Hunt and Yasuhara2010). In the remainder of this section, we discuss two trait systems—vertebral counts in amniotes and tooth development in mammals—for which the intersection of evo-devo, evolvability, and paleontology has been especially productive.
Vertebral Counts in Amniotes
The regionalization of the axial skeleton in amniotes has been well studied in terms of variation and evolutionary divergence. Vertebrae are divided into presacral, sacral, and caudal series, with the presacral series further subdivided into cervical, thoracic, and lumbar series. It has long been known that the counts of vertebrae in these different series tend to be conserved in mammals but are more variable in reptilian or avian groups. Müller et al. (Reference Müller, Scheyer, Head, Barrett, Werneburg, Ericson, Pol and Sánchez-Villagra2010) showed that this pattern of variability is ancient: mammals share their conserved variation with basal synapsids, whereas even basal reptilian groups show high evolutionary lability in vertebral counts in different axial regions. In particular, cervical (neck) vertebrae counts are nearly invariant among mammals; only manatees and three-toed sloths differ from the canonical mammalian complement of seven (Narita and Kuratani Reference Narita and Kuratani2005). In contrast, many reptilian and avian groups are extremely variable in their vertebral counts. Cervical vertebrae counts range from 10 to 26 in birds (Marek et al. Reference Marek, Falkingham, Benson, Gardiner, Maddox and Bates2021) and, remarkably, from 6 to 76 in sauropterygians (pliosaurs, plesiosaurs, and their relatives; Soul and Benson Reference Soul and Benson2017). Total vertebral counts in snakes can differ by several hundred across species (Lindell Reference Lindell1994).
Is the rarity of evolutionary changes in vertebral counts, especially in the neck region, caused by constraints (i.e., a low evolvability) of this suite of traits in mammals (Jones et al. Reference Jones, Benitez, Angielczyk and Pierce2018)? The simplest variational cause for a lack of evolutionary change is the lack of genetic variation. If mammalian development (almost) always produces axial skeletons with exactly seven neck vertebrae, then this trait would have (near) zero evolvability. Perhaps surprisingly, this seems not to be the case: studies of different mammalian species have documented variation in cervical counts (Galis Reference Galis1999; Galis et al. Reference Galis, Dooren, Feuth, Metz, Witkam, Ruinard, Steigenga and Wunaendts2006; Varela-Lasheras et al. Reference Varela-Lasheras, v. d. M. S.D., Metz, V. A. J. and Galis2011; ten Broek et al. Reference ten Broek, Bakker, Varela-Lasheras, Bugiani, Van Dongen and Galis2012). However, these studies also demonstrate that individuals bearing variant numbers of cervical vertebrae almost always exhibit other skeletal or soft-tissue anomalies, including lethal cancers. (It is worth highlighting that this translates into a methodological recommendation for paleontologists and others to describe “anomalies” and not simply remove them as outliers from quantitative analyses.) Therefore, evolutionary changes are limited not by the absence of variation, but instead by strong genetic correlations between vertebral counts and other traits that dramatically lower organismal fitness. The result is that very little of the variation in vertebral patterning is available for adaptive evolution.
The explanation that cervical vertebral counts are conserved in mammals because of low evolvability has been extended to consider differences in evolvability across other vertebral traits and between different lineages. Thoracic vertebrae variants also are associated with negative developmental anomalies, but the association is weaker than for cervical variants (Galis et al. Reference Galis, Dooren, Feuth, Metz, Witkam, Ruinard, Steigenga and Wunaendts2006), and vertebral counts are less conserved in the mammalian thoracic region (Narita and Kuratani Reference Narita and Kuratani2005). Some have argued that the two lineages with evolutionary shifts in cervical vertebrae, manatees and sloths, have been able to do so because their relatively low metabolism reduces harmful side effects, especially those related to cancers (Varela-Lasheras et al. Reference Varela-Lasheras, v. d. M. S.D., Metz, V. A. J. and Galis2011). Similarly, the lower incidence of cancer in birds and reptiles may be related to the greater evolutionary lability of vertebral counts in these groups (Galis Reference Galis1999), though additional factors, especially overall neck length, likely play a role (Varela-Lasheras et al. Reference Varela-Lasheras, v. d. M. S.D., Metz, V. A. J. and Galis2011).
Molar Development in Mammals
Developmental biologists have extensively explored the mouse as a model system for tooth development, with several decades of work elucidating the gene expression patterns and tissue interactions associated with tooth formation. Given that the fossil record of mammalian teeth is especially rich, there is great potential to marry this archive of tooth form with an accumulating understanding of tooth development.
Generative models of tooth formation have been crucial to making predictions about the evolvability of different dental traits (Polly Reference Polly1998; Jernvall Reference Jernvall2000; Salazar-Ciudad and Jernvall Reference Salazar-Ciudad and Jernvall2010; Ortiz et al. Reference Ortiz, Bailey, Schwartz, Hublin and Skinner2018). For example, the inhibitory cascade (IC) model makes predictions about the relative size of molars in the tooth row. Kavanagh et al. (Reference Kavanagh, Evans and Jernvall2007) built on the experimental demonstration in mice that the first molar (M1) inhibits the formation of the second (M2), which in turn inhibits the third molar (M3). They then postulated a quantitative relationship that captured this behavior with a parameter that represents the relationship between signal activation and inhibition in the developing tooth precursors. This model predicts that molars can develop on a continuum between equal sized (M1 = M2 = M3) and increasingly M1 dominated (M1 > M2 > M3), depending on the relative strength of activator to inhibitor. Moreover, the model predicts that M2 should always account for one third of total molar size when three molars are present and that the slope between M2/M1 and M3/M1 should be exactly two. The IC model proposes that variation in relative tooth size should therefore be highly structured, with some configurations arising easily and others essentially forbidden (e.g., M2 > M1). Assuming the IC model is strictly true, evolvability should therefore be high in some dimensions and absent in others.
Initial data published with the IC model indicated that relative molar sizes in murine rodents followed its predictions (Kavanagh et al. Reference Kavanagh, Evans and Jernvall2007). Many subsequent studies have applied the IC model to other mammalian groups, both extant and fossil. Halliday and Goswami (Reference Halliday and Goswami2013) assessed a large sample that included fossil mammals dating back to the Jurassic and found that molar ratios in most, but not all, taxa were similar to the IC predictions (Fig. 4). Other studies reported on different mammalian clades, which yielded results that sometimes comported with IC predictions, but other times did not (Polly Reference Polly2007; Renvoisé et al. Reference Renvoisé, Evans, Jebrane, Labruère, Laffont and Montuire2009; Wilson et al. Reference Wilson, Sánchez-Villagra, Madden and Kay2012; Asahara Reference Asahara2013; Evans et al. Reference Evans, Daly, Catlett, Paul, King, Skinner, Nesse, Hublin, Townsend, Schwartz and Jernvall2016). All these studies looked at predicted (mean) tooth morphologies. To generate an independent prediction of the IC model, Roseman and Delezene (Reference Roseman and Delezene2019) derived the expected variances and covariances of tooth dimensions and found that these predictions were generally not matched closely by data from primates (see also Vitek et al. Reference Vitek, Roseman and Bloch2020).
Area of third molar (M3) compared with the second molar (M2), each relative to the area of the first molar (M1). Each point represents tooth measurements from the tooth row of an individual mammal; many extinct and extant mammalian groups are represented. Black line indicates the relationship predicted by the inhibitory cascade (IC) model of tooth development. Gray areas indicate tooth proportions that the strict IC model cannot produce. A large proportion of taxa have tooth dimensions consistent with the IC model, although some, such as rodents (blue diamonds), are more compatible than others, such as condylarths (red squares). Data are from Halliday and Goswami (Reference Halliday and Goswami2013).

Like all models, the IC is a simplification of reality and therefore should not be expected to fully reproduce patterns in nature. Moreover, the experimental evidence that prompted the development of this model was drawn from a single mouse species. Many of the studies that found patterns at odds with IC predictions postulated that these deviations could result from evolutionary changes in tooth development processes that occurred between the focal clade and mice (reviewed in Roseman and Delezene Reference Roseman and Delezene2019). This is to be expected, because development evolves, and predictions based on an unchanged developmental program will thus decay in usefulness with increasing evolutionary time. It is noteworthy that the IC predictions were supported—at least sometimes—in taxa tens to hundreds of millions of years diverged from modern mice. Therefore, differences in evolvability due to features captured in developmental models can be quite persistent, perhaps much more so than those based on inferences from quantitative genetic parameters, such as the G or P matrix.
Integration and Modularity
Phenotypes are composed of parts recognized with anatomical names. For example, tetrapod bodies can be divided into forelimbs, hind limbs, and axial regions, and these may be subdivided further. Morphological parts can be associated or integrated with others because they are specified by common genes, influenced by shared developmental pathways, or work together to achieve a particular function (e.g., locomotion for forelimbs and hind limbs in many tetrapods) (Olson and Miller Reference Olson and Miller1958; Klingenberg Reference Klingenberg2008; DiFrisco et al. Reference DiFrisco, Love and Wagner2020). Empirical studies repeatedly suggest that such associated parts tend to be more correlated with each other than with unassociated parts. For example, individuals with larger than average forelimbs also have larger than average hind limbs. Modules refer to groups of traits that are integrated with each other but relatively independent of other sets of traits. Such modules can be identified a priori, based on developmental, anatomical, or functional knowledge. Alternatively, they can be inferred from measured patterns of covariation among traits (Klingenberg Reference Klingenberg2008; Goswami and Polly Reference Goswami and Polly2010), though there does not appear to be a strong consensus as to which of the many available methods to do so has the strongest justification.
Modularity and integration reflect the apportionment of evolvability among traits. Modular trait architecture is generally thought to facilitate adaptive evolution by allowing changes within modules to not interfere with function in other modules (Riedl Reference Riedl1978; Cheverud Reference Cheverud1996; Wagner Reference Wagner1996; Wagner and Altenberg Reference Wagner and Altenberg1996; Kirschner and Gerhart Reference Kirschner and Gerhart1998). In terms of evolutionary quantitative genetics, modularity is beneficial if mutually correlated traits are frequently selected in a direction consistent with their correlations. In this case, modular architecture will minimize the pleiotropic effects of adaptation on other modules and enhance the overall rate of evolution. If, however, the directions of selection are random over long time periods, the overall rate of evolution is the same in organisms with modular and nonmodular architecture. Phenotypic evolution will still occur more rapidly in directions of modular variation but less rapidly in other directions, leading to a nonadaptive correlation between modules and rates of evolution. Alternatively, modular genetic architecture may reflect patterns of development that are antagonistic to adaptation, rather than consistent with it, and therefore constrain adaptation. The net impact of modularity will therefore depend on whether modularity is aligned with likely directions of selection. Such alignment is plausible, especially for modules related to function, though to date it has not been broadly evaluated by empirical evidence, perhaps due to the scarcity of estimates of natural selection on suites of traits (Melo et al. Reference Melo, Porto, Cheverud and Marroig2016). In addition, the way modularity evolves can also be important. If modularity is achieved by reducing variability in nonmodular directions, overall evolvability can decrease even as the trait architecture becomes more strongly modular in structure (Hansen Reference Hansen2003).
Paleontologists have assessed patterns of integration and modularity within abundantly preserved species, explored differences in modularity between closely related species (Gerber and Hopkins Reference Gerber and Hopkins2011; Webster and Zelditch Reference Webster and Zelditch2011a,Reference Webster and Zelditchb), and tracked changes in modularity and integration within lineages (Maxwell and Dececchi Reference Maxwell and Dececchi2013; Goswami et al. Reference Goswami, Binder, Meachen and O'Keefe2015). In other cases, modularity has been assessed in extant populations and then applied to fossil taxa not normally preserved in high abundance (e.g., Young et al. Reference Young, Wagner and Hallgrímsson2010). All these studies provide important information about the stability of trait variational patterns, as well as whether evolutionary divergence is shaped by the developmental organization of traits. Other studies address what is sometimes called “evolutionary modularity” (e.g., Klingenberg Reference Klingenberg2014; Larouche et al. Reference Larouche, Zelditch and Cloutier2018; Felice et al. Reference Felice, Watanabe, Cuff, Noirault, Pol, Witmer, Norell, O'Connor and Goswami2019; Parins-Fukuchi Reference Parins-Fukuchi2020). This approach also looks at associations among sets of traits, but the variation examined is between rather than within species. This body of work sheds light on how macroevolutionary changes may be coordinated among traits. However, these studies are less easily related to evolvability, because in the absence of information about genetic variation or development within species, it is not possible to determine variational versus selective causes for these patterns.
Comparative Methods, Macroevolution, and Paleontology
Phylogenetically informed macroevolutionary modeling is another area in which increased integration with paleontology is possible and being realized. Recent developments in phylogenetic comparative methods have led to an explosion of neontological interest in the study of macroevolutionary processes and patterns (reviewed in O'Meara Reference O'Meara2012; Pennell and Harmon Reference Pennell and Harmon2013; Garamszegi Reference Garamszegi2014). This is a direct consequence of the development of novel and powerful statistical models of trait and lineage evolution. As a result, there is a growing overlap in the type of research questions that paleontologists and neontologists can ask regarding long-term evolvability (Hunt and Slater Reference Hunt and Slater2016): What role does evolvability play in regulating lineage diversity and morphological disparity through time? How can we explain stasis over macroevolutionary timescales? To what extent can evolutionary novelties shape the patterns or rates of diversification? Can shifts in modularity induce changes in the rate of morphological diversification?
One of the benefits of this increased overlap in research interests is the emergence of interdisciplinary approaches, such as the addition of fossil data to molecular phylogenies (e.g., Slater et al. Reference Slater, Harmon and Alfaro2012) or the application of comparative methods to trees derived from fossil data (e.g., Mitchell et al. Reference Mitchell, Etienne and Rabosky2019). Another important benefit is the realization that paleontologists and neontologists working in a comparative framework can share a common set of mathematical models. This unification is essential for evolvability research, because it provides the field with a robust statistical framework in which to test hypotheses regarding the impact of intrinsic organismal properties on long-term evolutionary dynamics.
Quantitative genetic and developmental approaches to evolvability are clearly applicable at short timescales, but genetic and developmental systems evolve over longer timescales, which means that the evolvability of clades may diverge over time (but see Tsuboi et al. Reference Tsuboi, van der Bijl, Kopperud, Erritzøe, Voje, Kotrschal, Yopak, Collin, Iwaniuk and Kolm2018). In addition, long-term evolvability must encompass not only a lineage's ability to respond to selection, but also its capacity to survive repeated rounds of large-scale changes in its biotic and abiotic environment (Jablonski Reference Jablonski2017a). Evolvability research on macroevolutionary timescales is, therefore, necessarily more complex than studies at microevolutionary timescales (Jablonski Reference Jablonski2008). This makes it more challenging to disentangle whether macroevolutionary patterns arise from variational properties of traits or lineages rather than selection or ecological opportunity.
At the macroevolutionary level, the confluence of phylogenetic methods with paleontological data allows researchers to focus on clade-level properties as a rich source of data. We highlight the study of two such properties: (1) morphological disparity and (2) lineage diversification through speciation and extinction rates.
Disparity
One of the clearest routes for combining neontological and paleontological data in the study of long-term evolvability is through analyses of disparity or degrees of morphological difference. Studies of disparity have traditionally been used to test the idea that the exploration of a morphospace is limited by the availability of ecological space (Harmon et al. Reference Harmon, Schulte, Larson and Losos2003; Yoder et al. Reference Yoder, Clancey, Des Roches, Eastman, Gentry, Godsoe, Hagey, Jochimsen, Oswald, Robertson, Sarver, Schenk, Spear and Harmon2010; Hughes et al. Reference Hughes, Gerber and Wills2013). Ecological opportunity would then be the major determinant of the rate of morphological diversification (Rainey and Travisano Reference Rainey and Travisano1998) and the opening of adaptive zones would help to explain large radiations (Simpson Reference Simpson1944). Increasingly, however, biologists have come to recognize that intrinsic organismal factors might play a role in regulating the occupation of a multivariate morphospace (Polly Reference Polly2008; Wagner Reference Wagner2018). In particular, the pathways followed by a lineage are shaped not only by externally imposed selection processes, but also by variational properties that steer evolution along paths with abundant variation and constrain it away from trajectories that lack such variation.
A classic example is observed in mammals following the Cretaceous–Paleogene (K-Pg) extinction (Archibald and Deutschman Reference Archibald and Deutschman2001; Raia et al. Reference Raia, Carotenuto, Passaro, Piras, Fulgione, Werdelin, S. J. and F. M.2013; Slater Reference Slater2013). Although several mammalian lineages survived the K-Pg extinction event, they have since followed remarkably different morphological diversification patterns. Placentals have diversified into a large array of forms, encompassing species that are aerial, arboreal, fossorial, aquatic, or cursorial with body sizes that vary anywhere from 2 g to 1.5 × 10⁸ g (Wilson and Reeder Reference Wilson, Reeder, Wilson and Reeder2005). Marsupials, on the other hand, have remained far more conservative and display lower disparity than placentals for several skeletal elements, such as the mandible and dentition (Echarri and Prevosti Reference Echarri and Prevosti2015), skull (Bennett and Goswami Reference Bennett and Goswami2013; Porto et al. Reference Porto, Sebastiao, Pavan, VandeBerg, Marroig and Cheverud2015), shoulder girdle (Sears Reference Sears2004), and limb bones (Cooper and Steppan Reference Cooper and Steppan2010). Several authors have argued that the low disparity in skeletal forms among marsupials is a consequence of their altricial reproductive strategy, which requires juvenile marsupials to climb to one of their mothers’ teats soon after birth and suckle earlier and for longer than placentals (Lillegraven Reference Lillegraven1975; Smith Reference Smith2006). This strategy requires an early ossification of facial and limb skeletal elements (Sánchez-Villagra Reference Sánchez-Villagra2002; Bininda-Emonds et al. Reference Bininda-Emonds, Jeffery, Sánchez-Villagra, Hanken, Colbert, Pieau, Selwood, Ten Cate, Raynaud, Osabutey and Richardson2007) so the neonate can both climb and suckle properly. Early ossification of skeletal structures, in turn, may limit the range of forms easily generated during marsupial ontogeny, which would allow for more derived skeletal morphologies and thereby limit ecomorphological diversification of the group (Fig. 5).
Constraints on marsupial ecomorphological diversification. A, Example of an early ossifying skeletal element in marsupials. Here we illustrate two stages of cranial bone development in koalas (Phascolarctos cinereus): shortly after the onset of ossification and immediately before achieving adult form. Note the relative early ossification of the dentary and maxilla (red) when compared with other cranial bones (gray). (Modified from supplemental fig. 5 in Spiekman and Werneburg Reference Spiekman and Werneburg2017.) B, Example of morphological disparity patterns observed when comparing placentals (blue) and marsupials (green). In this example, disparity patterns were obtained for forelimb traits. ![]() = marsupials;
= marsupials; ![]() = placentals;
= placentals; ![]() = echidna;
= echidna; ![]() = placentals with flippers. (Modified from fig. 4 in Cooper and Steppan Reference Cooper and Steppan2010.) C, Phylogenetic time tree of mammalian families. Differentially colored dots (in the original figure from Meredith et al. Reference Meredith, Janečka, Gatesy, Ryder, Fisher, Teeling, Goodbla, Eizirik, Simão, Stadler, Rabosky, Honeycutt, Flynn, Ingram, Steiner, Williams, Robinson, Burk-Herrick, Westerman, Ayoub, Springer and Murphy2011) indicate nodes that are (1) not strongly supported due to conflict between DNA and amino acid trees, (2) in agreement but with decreased support, or (3) in disagreement with prior studies. (Modified from fig. 1 in Meredith et al. Reference Meredith, Janečka, Gatesy, Ryder, Fisher, Teeling, Goodbla, Eizirik, Simão, Stadler, Rabosky, Honeycutt, Flynn, Ingram, Steiner, Williams, Robinson, Burk-Herrick, Westerman, Ayoub, Springer and Murphy2011.)
= placentals with flippers. (Modified from fig. 4 in Cooper and Steppan Reference Cooper and Steppan2010.) C, Phylogenetic time tree of mammalian families. Differentially colored dots (in the original figure from Meredith et al. Reference Meredith, Janečka, Gatesy, Ryder, Fisher, Teeling, Goodbla, Eizirik, Simão, Stadler, Rabosky, Honeycutt, Flynn, Ingram, Steiner, Williams, Robinson, Burk-Herrick, Westerman, Ayoub, Springer and Murphy2011) indicate nodes that are (1) not strongly supported due to conflict between DNA and amino acid trees, (2) in agreement but with decreased support, or (3) in disagreement with prior studies. (Modified from fig. 1 in Meredith et al. Reference Meredith, Janečka, Gatesy, Ryder, Fisher, Teeling, Goodbla, Eizirik, Simão, Stadler, Rabosky, Honeycutt, Flynn, Ingram, Steiner, Williams, Robinson, Burk-Herrick, Westerman, Ayoub, Springer and Murphy2011.)

Vermeij hypothesized that the number of dimensions in which the phenotype is capable of varying (“versatility”) is correlated with disparity (Vermeij Reference Vermeij1973b). He pointed to the possibility that increasing versatility facilitated the evolution of more complex forms and enabled the evolution of innovations that opened new adaptive zones. Versatility is therefore a higher-level property not tied to any specific phenotype, enlarging the nature of evolvability characteristics that can influence disparity.
One of the main reasons why disparity provides fruitful grounds for integrating paleontological and neontological approaches to evolvability is that incorporating fossil taxa does not change the mechanics of phylogenetically informed analyses. The main, necessary components are essentially the same: (1) a tree with branches scaled to time units, (2) scores for each taxon in the morphological trait of interest, (3) a model for evolutionary change, and (4) the evolvability hypothesis being tested. However, several initial studies have demonstrated that even incorporating a little fossil information into a phylogenetic backbone can go a long way toward improving parameter estimates of the statistical models used for testing differential evolvability hypotheses (e.g., Pyron and Burbrink Reference Pyron and Burbrink2012) and the ability to differentiate between evolutionary models (e.g., Slater et al. Reference Slater, Harmon and Alfaro2012).
Lineage Diversification
Another promising route for integration of neontological and paleontological data in the study of long-term evolvability is through analyses of lineage diversification rates, which can be decomposed into speciation and extinction, of which the latter is better estimated directly from the fossil record (Rabosky Reference Rabosky2010). There are several proposed routes by which organismal or population properties can affect diversification. At the trait level, morphological novelties are capable of reshaping lineage diversification rates, sometimes causing bursts of diversification (Rabosky et al. Reference Rabosky, Santini, Eastman, Smith, Sidlauskas, Chang and Alfaro2013). The study of such trait-dependent diversification has enjoyed a significant revival in modern phylogenetics with the development of trait-dependent speciation and extinction models (FitzJohn Reference FitzJohn2010, Reference FitzJohn2012; Goldberg et al. Reference Goldberg, Lancaster and Ree2011; Goldberg and Igić Reference Goldberg and Igić2012; Magnuson-Ford and Otto Reference Magnuson-Ford and Otto2012). In principle, such approaches can separately estimate effects of traits on speciation and extinction using only observations from extant taxa and a phylogeny connecting them. However, these methods perform unreliably under many conditions when their strict assumptions are violated (Rabosky and Goldberg Reference Rabosky and Goldberg2015), and more general arguments cast doubt on extant-only data being able to recover historical diversification dynamics (Louca and Pennell Reference Louca and Pennell2020). As a result, fossil data may be especially informative for testing whether traits—including those related to evolvability—influence speciation and extinction rates. Indeed, it is reasonable to hypothesize that high evolvability, through enhanced generation of potentially adaptive variants, can protect against extinction. Evolvability also may plausibly influence the formation of new species, as it can enhance responses to natural selection, which can be important under scenarios of ecological speciation (Schluter Reference Schluter2009) or for the survivorship of incipient species as they become established (Allmon and Sampson Reference Allmon, Sampson, Allmon and Yacobucci2016).
However, tests for such associations between evolvability and speciation or extinction face a complication. The propensity to speciate or go extinct are properties of lineages, not traits (though traits, of course, can influence these probabilities). Differences in variation—and therefore, evolvability—are commonplace among traits. However, the frequency and strength of such differences among lineages are unclear. Taxonomic differences have been documented for genetic features related to evolvability, such as overall rates of mutation (Lynch Reference Lynch2010) and recombination (Stapley et al. Reference Stapley, Feulner, Johnston, Santure and Smadja2017). Developmental or morphological features that have been associated with evolvability differences among clades include growth strategy in regular versus irregular echinoids (Hopkins and Smith Reference Hopkins and Smith2015), the loosening of allometric relationships (Tsuboi et al. Reference Tsuboi, van der Bijl, Kopperud, Erritzøe, Voje, Kotrschal, Yopak, Collin, Iwaniuk and Kolm2018), and the breaking of left–right symmetry in bivalves (Jablonski Reference Jablonski2020).
Despite the obstacle of distinguishing properties of traits and lineages, we noted earlier that several paleontological studies tested whether extinction was predicted by phenotypic variation (Liow Reference Liow2007; Hopkins Reference Hopkins2011; Kolbe et al. Reference Kolbe, Zambito, Brett, Wise and Wilson2011). These studies captured variation levels using morphometric analysis of skeletal elements (Hopkins Reference Hopkins2011; Kolbe et al. Reference Kolbe, Zambito, Brett, Wise and Wilson2011) or through expert, but qualitative, opinions judging certain species to be unusually variable (Liow Reference Liow2007). For the measured variation to be relevant for extinction, the focal traits must be construed as proxies for overall phenotypic variation or selectively important enough to influence adaptation and population survival. We do not know of other analyses of variation and extinction or any studies that perform analogous analyses for origination, though the possibility is discussed in some detail by Jablonski (Reference Jablonski2020). For example, Vermeij's (Reference Vermeij1973a) claim that taxa with higher versatility tend to preferentially replace those of lower versatility implies that this evolvability-related characteristic should increase speciation or decrease extinction, and possibly both together.
Conclusions and Prospects
Although evolvability is not commonly invoked by many paleontologists, the examples we have presented provide a substantial rationale for paleontologists to actively incorporate the concept of evolvability into investigations of the fossil record. Our enthusiasm should, however, be tempered with caution; disentangling the role of evolvability and the forces that cause evolution is always challenging. With these two points in mind, we offer a methodological schema for paleontologists and their interdisciplinary collaborators to initiate investigations of evolvability. To enable such a study, three distinct aspects must be addressed: conceptualization (what counts as evolvability?); measurement (how is evolvability empirically measured, directly or indirectly?); and testing (what strategies are used to evaluate hypotheses about evolvability?).
The conceptualization of evolvability differs across the approaches canvassed herein. Classic studies focused on how variational properties could influence the propensity for evolutionary stability versus change, within the span of individual lineages and more broadly over the history of life. For example, Vermeij (Reference Vermeij1973a,Reference Vermeijb) used the potential versatility of form. Within quantitative genetics, evolvability is conceptualized as the short-term evolutionary potential for a population to evolve in the direction of selection (Hansen and Houle Reference Hansen and Houle2008). Within evo-devo, evolvability is understood in terms of how developmental processes channel trait variation. Within phylogenetic macroevolutionary modeling, evolvability is analyzed retrospectively and can be linked to different indicators of the evolutionary success of lineages. Although there is an interesting theoretical question about how these different conceptions are related to one another, the crucial requirement for studying evolvability in the fossil record is one clearly specified conceptualization.
Once evolvability is conceptualized in a particular way, the next issue to address methodologically is how evolvability will be measured. For instance, Vermeij (Reference Vermeij1973a,Reference Vermeijb) operationalized “potential versatility of form” as the number of parameters required to describe coiling in gastropods. In quantitative genetics, short-term evolvability is defined as the mean-standardized additive genetic variance. In evo-devo studies, developmental considerations may form the basis for statements of relative evolvability (e.g., cervical vertebrae should be less evolvable than thoracic vertebrae in mammals), though these may not readily predict the magnitudes of such effects. The specific type of measurement utilized will limit the kinds of evolutionary inference which can be drawn in distinctive ways that must be explicitly appreciated.
Finally, with evolvability operationalized, the final step in the methodological sequence is testing. Armed with measures or predictions of relative evolvability across traits or lineages, researchers can then measure evolutionary differences to assess the degree to which divergences match evolvability predictions. Are changes larger in more evolvable traits or lineages? Are low-evolvability traits or directions in morphospace especially conserved? Do lineages whose characteristics indicate high evolvability attain greater morphological disparity or experience greater diversification? To the extent that evolvability predictions are upheld, the argument is supported that variation—and not just selection—is important in shaping long-term evolutionary changes. When evolvability does not predict empirical divergence, it is likely that natural selection has been the dominant process determining evolutionary outcomes. Compilation of numerous such tests can help to establish the relative importance of these two components of evolution for different kinds of traits, in different lineages, and over different timescales.
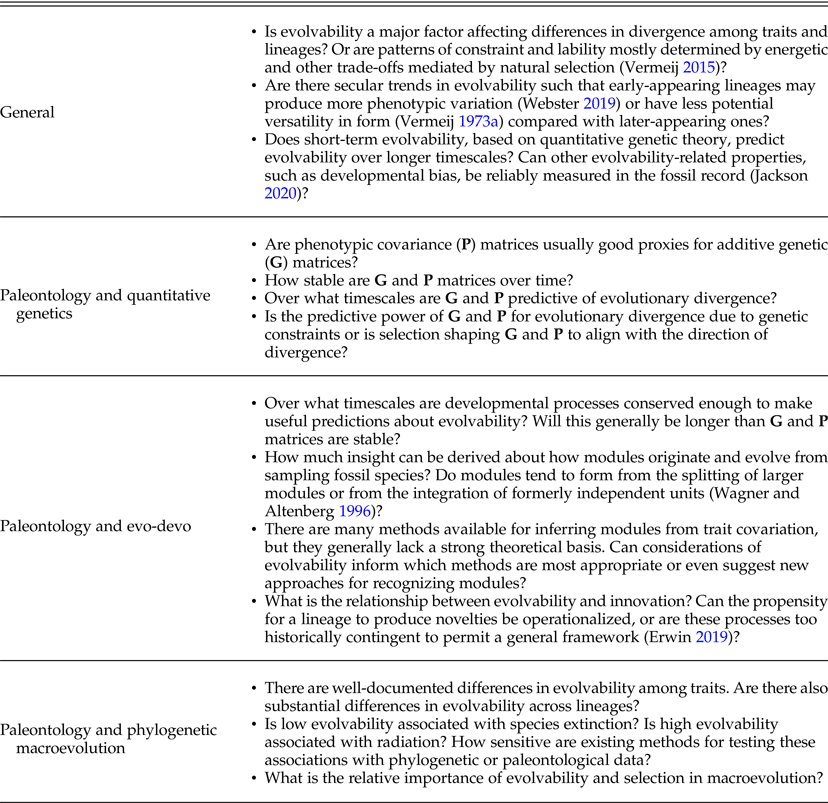
This three-step methodological schema offers a general template for approaching a variety of outstanding questions on evolvability in the fossil record (Box 1). These include major theoretical questions such as the relative importance of variation versus selection in the history of life, as well as more granular issues such as the timescales over which variational patterns, and thus evolvability predictions, are stable. Attention to the specifics of the schema can provide detailed guidance for novel empirical and theoretical studies of evolvability in the fossil record. Paleontology, with its unique access to temporal data from the history of life, is positioned to make distinctive contributions to studies of evolvability and especially in interdisciplinary collaboration with other evolutionary biological approaches.
Outstanding questions on evolvability in the fossil record.
Acknowledgments
This paper emerged out of a collaboration initiated by our participation in the project “Evolvability: A New and Unifying Concept for Evolutionary Biology?” (2019–2020), which was funded by the Norwegian Academy of Science and Letters and hosted by the Centre for Advanced Study (Oslo) in 2019–2020. We are grateful to the project group leaders, T. F. Hansen and C. Pelabon, for their organizational efforts and specific comments on the article. We also thank all the Fellows involved in the project for stimulating discussions on many of the issues treated herein (with special thanks to F. Galis). Three reviewers for the journal provided constructive comments and incisive feedback that helped to improve the final version of the article. We especially appreciate D. Polly's many useful suggestions in this regard.


 Open access