

INTRODUCTION
One notable product of Arctic amplification, the enhanced warming of high northern latitude air temperatures relative to the Northern Hemisphere mean, is a change in the seasonality of sea-ice melt toward increasing periods of open water (Overland and others, Reference Overland2016; Tonboe and others, Reference Tonboe2016). The waters along west Greenland represent one Arctic region characterized by progressively longer melt duration (Stroeve and others, Reference Stroeve, Markus, Boisvert, Miller and Barrett2014). Extension of the open water season has been accompanied by late spring/early summer decreases in albedo and increases in shortwave absorption into melt ponds and the open ocean along the marginal ice zone, accelerating the sea-ice-albedo feedback (Curry and others, Reference Curry, Schramm and Ebert1995; Stroeve and others, Reference Stroeve, Markus, Boisvert, Miller and Barrett2014). Cloud cover and water vapor feedbacks influenced by sea-ice losses and moisture flux into the Arctic also induce air temperature warming and prolong melt conditions (Serreze and Barry, Reference Serreze and Barry2011).
In addition to recent summertime sea-surface warming trends in Baffin Bay (Myers and Ribergaard, Reference Myers and Ribergaard2013; Comiso and Hall, Reference Comiso and Hall2014), simultaneous, physically-related mid-tropospheric geopotential height (GPH) increases that promote upper-air anticyclonic ridging features have been noted across the region through development and analyses of the Greenland Blocking Index (GBI; Hanna and others, Reference Hanna, Cropper, Hall and Cappelen2016). Greenland blocks impact local cryosphere melt (e.g. Hanna and others, Reference Hanna2014; Stroeve and others, Reference Stroevein press), and are also linked to weather and climate patterns in the middle latitudes (Overland and others, Reference Overland, Francis, Hanna and Wang2012, Reference Overland2015; Hanna and others, Reference Hanna, Cropper, Hall and Cappelen2016; Budikova and others, Reference Budikova, Ford and Ballinger2017; Chen and Luo, Reference Chen and Luo2017) and other parts of the Arctic (Ballinger and others, Reference Ballinger, Sheridan and Hanna2014). Recent work by Ballinger and others (Reference Ballingerin press) identified an increase in the intensity and occurrence of autumn blocking over Greenland (September–December) that has contributed to the region's maritime warming and the increase of open water duration west of the island.
While GBI conditions play a dynamical role in extending the local melt season, less is known about the influence of upper-air anticyclones on changes in the timing of spring melt. Trend analyses of passive microwave-derived marginal sea-ice melt and freeze dates by Stroeve and others (Reference Stroeve, Markus, Boisvert, Miller and Barrett2014) revealed a statistically significant (99% level) change toward earlier melt in Baffin Bay from 1979 to 2013. The spring 2013 melt onset (MO) observed across Baffin and waters extending southward into Davis Strait and Labrador Sea (hereafter termed BDL) is particularly striking. The 2013 MO occurred on 12 April, nearly 2 months earlier than the 1981–2010 climatological melt of the region (9 June) and several weeks before the next earliest melt occurrence (1995) in the record. This unusually early melt event followed exceptionally high surface air temperature anomalies of +7.7–8.6°C along the west coast of Greenland in March 2013 (Tedesco and others, Reference Tedesco2013).
Given the rapidly changing seasonality of the BDL ice cover, and lack of knowledge regarding the physical causes of melt anomalies in 2013 and other recent years, we utilize a new, daily GBI dataset to provide an initial framework to better understand the precursor role of local atmospheric circulation on early melt events. We place emphasis on the preceding, sub-seasonal dynamic and thermodynamic controls of MO, as atmosphere/ocean interactions within this timeframe (i.e. out to ~90-days) have been shown to dramatically impact springtime sea-ice melt signatures across the Arctic (e.g. Drobot and Anderson, Reference Drobot and Anderson2001b; Mortin and others, Reference Mortin2016). GBI and early BDL MO linkages are supplemented with a number of ocean-atmosphere composite analyses to further compare precursor conditions of extreme melt events and evaluate the causes of the large 2013 anomaly.
DATA AND METHODS
Daily 25 km gridded passive microwave brightness temperatures obtained from the Scanning Multichannel Microwave Radiometer and Special Sensor Microwave/Imager products are used to calculate MO, which is identified as the day of year when skin temperatures >0°C persist over a marine area and either surface water on snow or open ocean is observed (Markus and others, Reference Markus, Stroeve and Miller2009). This MO dataset spans Baffin Bay, Davis Strait and Labrador Sea (Fig. 1) and covers the period of 1979–2015. MO is primarily determined from three quantities: daily difference in the 37 GHz vertically polarized brightness temperatures (v37), daily difference in the gradient of the 37 and 19 GHz vertically polarized brightness temperatures (v19) adjusted for sea-ice concentration, and daily difference in the quantity P = v19 + 0.8 v37 (Smith, Reference Smith1998). The three quantities are normalized, given a low-pass filter to remove noise, and summed. The top five values of that sum are compared with the results from the 3 × 3 pixel box centered on the pixel under consideration, and the MO date is determined based on the highest spatial agreement (e.g. if one result matches four of the surrounding pixels and the next matches only two, the first result is selected as MO).
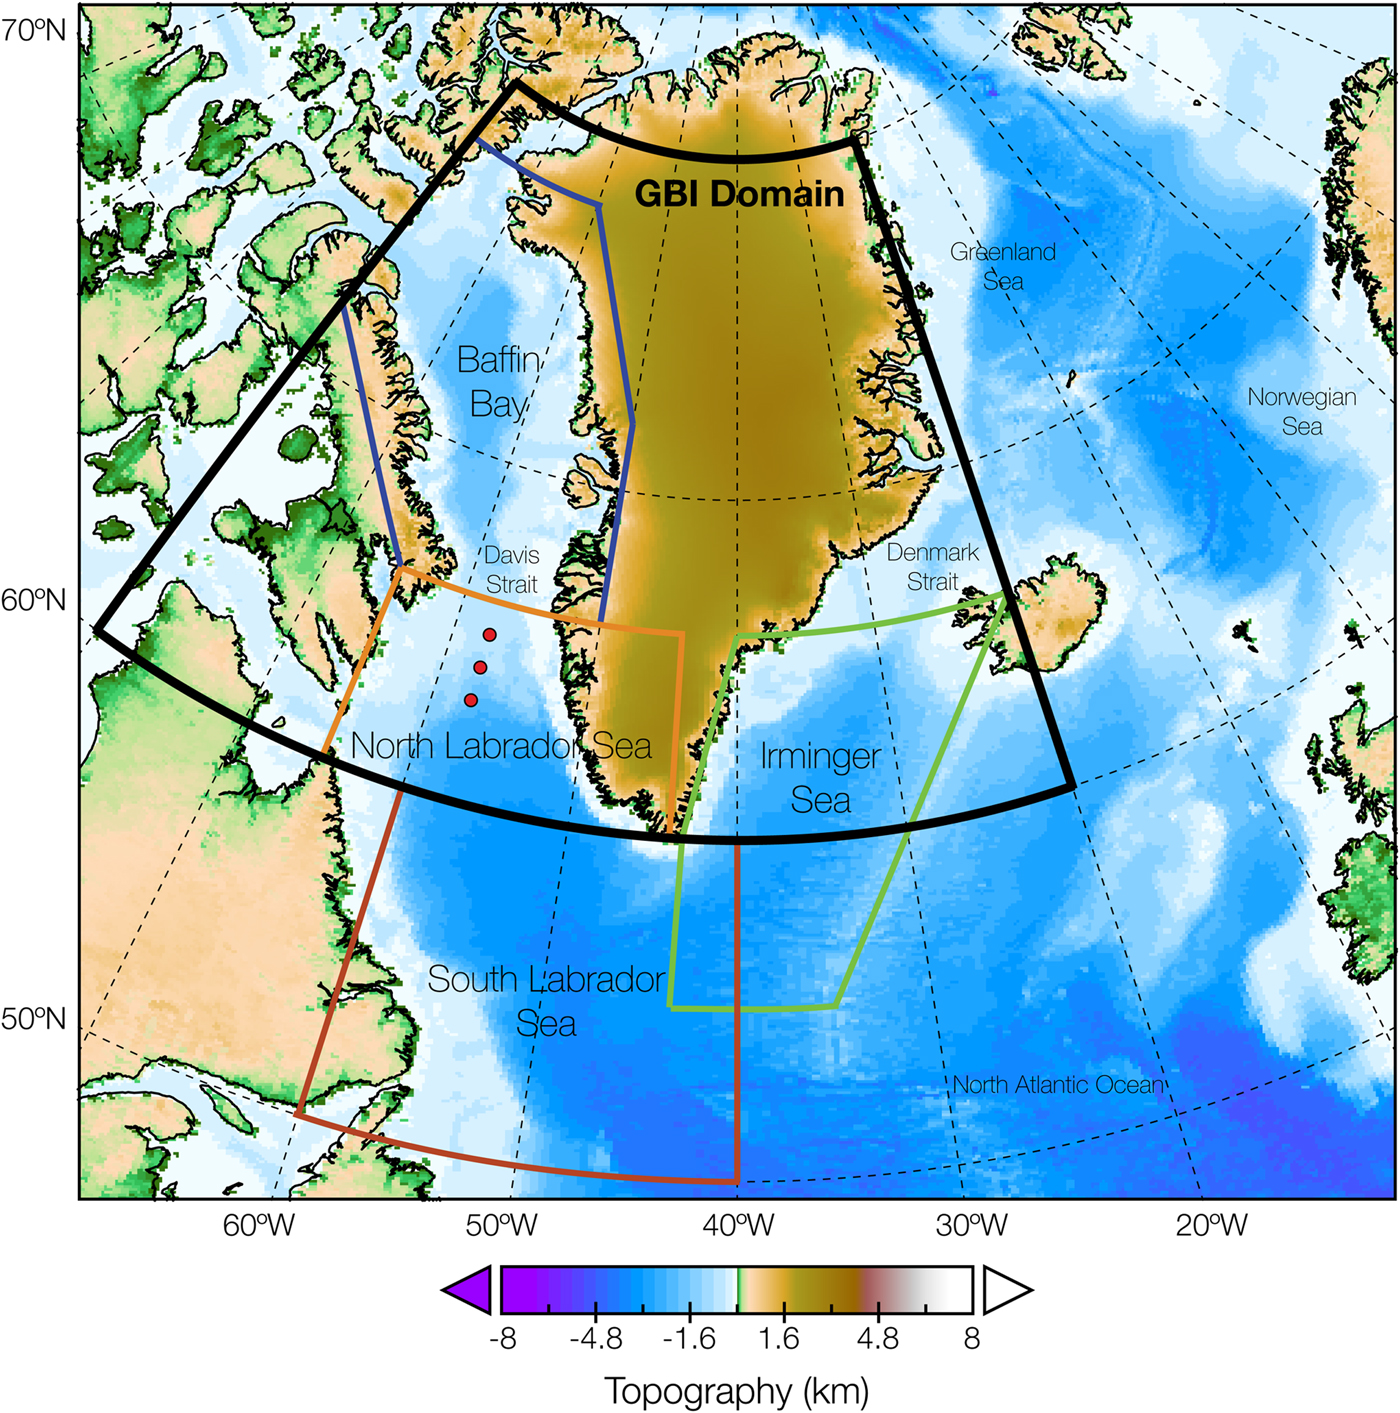
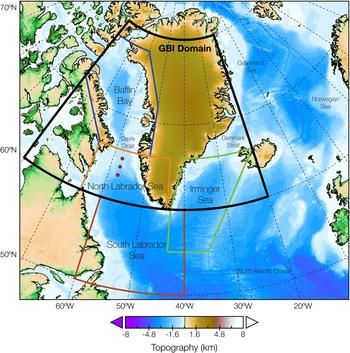
Study area map identifying the GBI and regional SST domains. The red dots signify North Labrador SST grid points (as indicated in Table 3) located near the ice/ocean interface. The Baffin Bay, Davis Strait and North/South Labrador Sea areas collectively comprise the BDL region.
The algorithm, described in Markus and others (Reference Markus, Stroeve and Miller2009), uses NASA Team ice concentration (IC; Cavalieri, Reference Cavalieri1996) to validate the MO result. Primarily in the marginal ice zones, MO is coincident with the disintegration of the sea ice. The algorithm checks for sea ice in the middle of the year, and if the IC is 0%, the algorithm searches back in time for the last day where the IC was above 80%. This IC result is compared with the algorithm result from the previous section prior result and the earliest day of the two represents MO.
GBI daily data are calculated based on NCEP/NCAR reanalysis (Kalnay and others, Reference Kalnay1996) 500 hPa GPH data downloaded for a grid of 35 well-distributed points that are then averaged to produce daily GBI values, and normalized to the 1951–2000 period for the standard GBI region of 60–80°N, 20–80°W. Daily data are an extension of monthly GBI time series presented in Hanna and others (Reference Hanna, Cropper, Hall and Cappelen2016). For consistency in supplemental atmospheric analyses, we utilize NCEP/NCAR data fields to create a number of composites involving GPH, sea-level pressure (SLP), meridional wind, air temperature, turbulent sensible and latent heat fluxes, precipitable water and omega (vertical atmospheric motion).
Additional climate modes previously associated with North Atlantic climate and cryosphere variability (e.g. Lewis and others, Reference Lewis2017) are selected to supplement the GBI and related composite analyses, including the North Atlantic Oscillation (NAO) and Atlantic Multidecadal Oscillation (AMO). The daily NAO index version utilized here is the station-based product of Cropper and others (Reference Cropper, Hanna, Valente and Jónsson2015), which represents the normalized (1951–2000) SLP difference between Iceland and the Azores. The AMO index represents the unsmoothed monthly sea surface temperature (SST) with trend included, spanning 0–70°N within the North Atlantic basin, based on the Kaplan and others (Reference Kaplan1998) SST dataset.
Regional SSTs are analyzed for Baffin Bay, north and south portions of Labrador Sea, and Irminger Sea, whose waters are directed towards and supply heat to eastern Baffin Bay by the East and West Greenland Current (Myers and others, Reference Myers, Donnelly and Ribergaard2009; Myers and Ribergaard, Reference Myers and Ribergaard2013). A multi-dataset product is used that incorporates satellite observations from the Pathfinder Advanced Very High Resolution Radiometer Version 5.2 (Casey and others, Reference Casey, Brandon, Cornillon, Evans, Barale, Gower and Alberotanza2010) and the Along-Track Scanning Radiometer Reprocessing for Climate datasets (Embury and others, Reference Embury, Merchant and Corlett2012), and in-situ observations from the International Comprehensive Ocean-Atmosphere Dataset Version 2.5 (Woodruff and others, Reference Woodruff2011). An interpolation method described by Høyer and others (Reference Høyer, Le Borgne and Eastwood2014) is applied to create the SST product, which consists of daily, gap-free fields from 1982 to 2012 at a 0.05° horizontal resolution. Using the same grid, the SST record has been extended to 2015 with an operational product based on near real-time satellite observations, which have been compared with and show agreement with the multi-dataset product previously described. Arctic SST data from the Met Office Hadley Centre sea ice and SST dataset (HadISST1; Rayner and others, Reference Rayner2003) are used to supplement the regional SST and AMO datasets.
To gain an idea of the optimal, pre-melt time periods when the regional, mid-tropospheric circulation described by the GBI may strongly precondition sea ice for continuous melt, we initially examine lagged correlations between composite, daily GBI values and observed MO dates. Given a focus on sub-seasonal linkages, average GBI values are initially examined over consecutive 10, 15 and 30-day periods out to 90-days prior to melt in an attempt to identify robust temporal associations (latter two periods not shown). The 10-day GBI aggregations exhibit the most robust covariance with the sea ice, especially in the 40-days prior to melt, and are selected for subsequent analyses. Separate series of lagged Pearson correlations are conducted, one with undetrended values to assess the role of climatic changes in the GBI/MO relationship and another with the datasets linearly detrended (DT) to evaluate interannual fluctuations, including covariations of extremes, in the datasets. A two-tailed t-test (e.g. Wilks, Reference Wilks2011) is applied to address significance in the results given a threshold of P ≤ 0.05. Resulting lagged associations are utilized to constrain the temporal limits of the composite analyses preceding melt events with particular emphasis placed on 2013.
Prior to analyses involving the passive microwave (PM) MO data from Markus and others (Reference Markus, Stroeve and Miller2009), further quality-control measures are initially undertaken. To determine if the 2013 anomalous early MO was ‘real’ and not due to instrumental errors, we surveyed the daily brightness temperature maps for data artifacts, and did not find evidence of sensor-related errors. As a next step, we compared the PM MO dates with those derived by the Advanced Horizontal Range Algorithm (AHRA; Drobot and Anderson, Reference Drobot and Anderson2001a). AHRA time series for the BDL region (Bliss and Anderson, Reference Bliss and Anderson2014) exhibit a similar dip in 2013 as the PM time series with MO occurring on 1 April, which is ~3σ below the 1981–2010 mean MO date (1 May; A. Bliss, pers. comm.), thus showing this particular year's extreme melt to be robust to the method selected.
RESULTS
Climatological assessment of 2013 melt onset
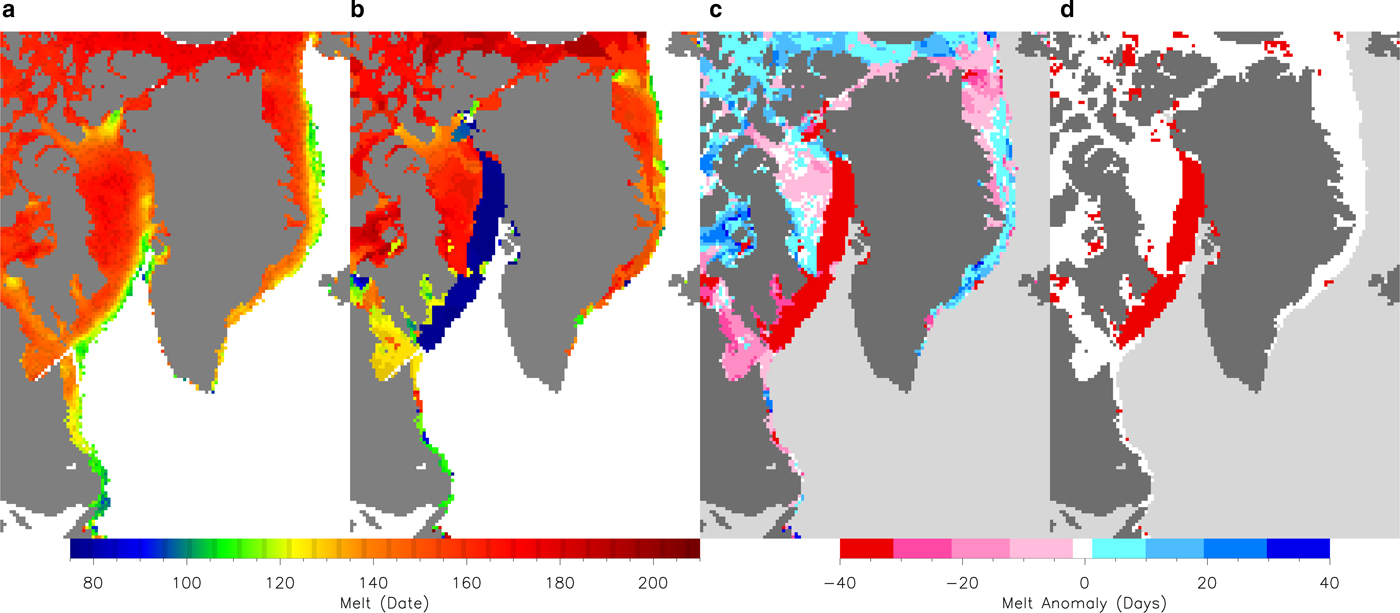
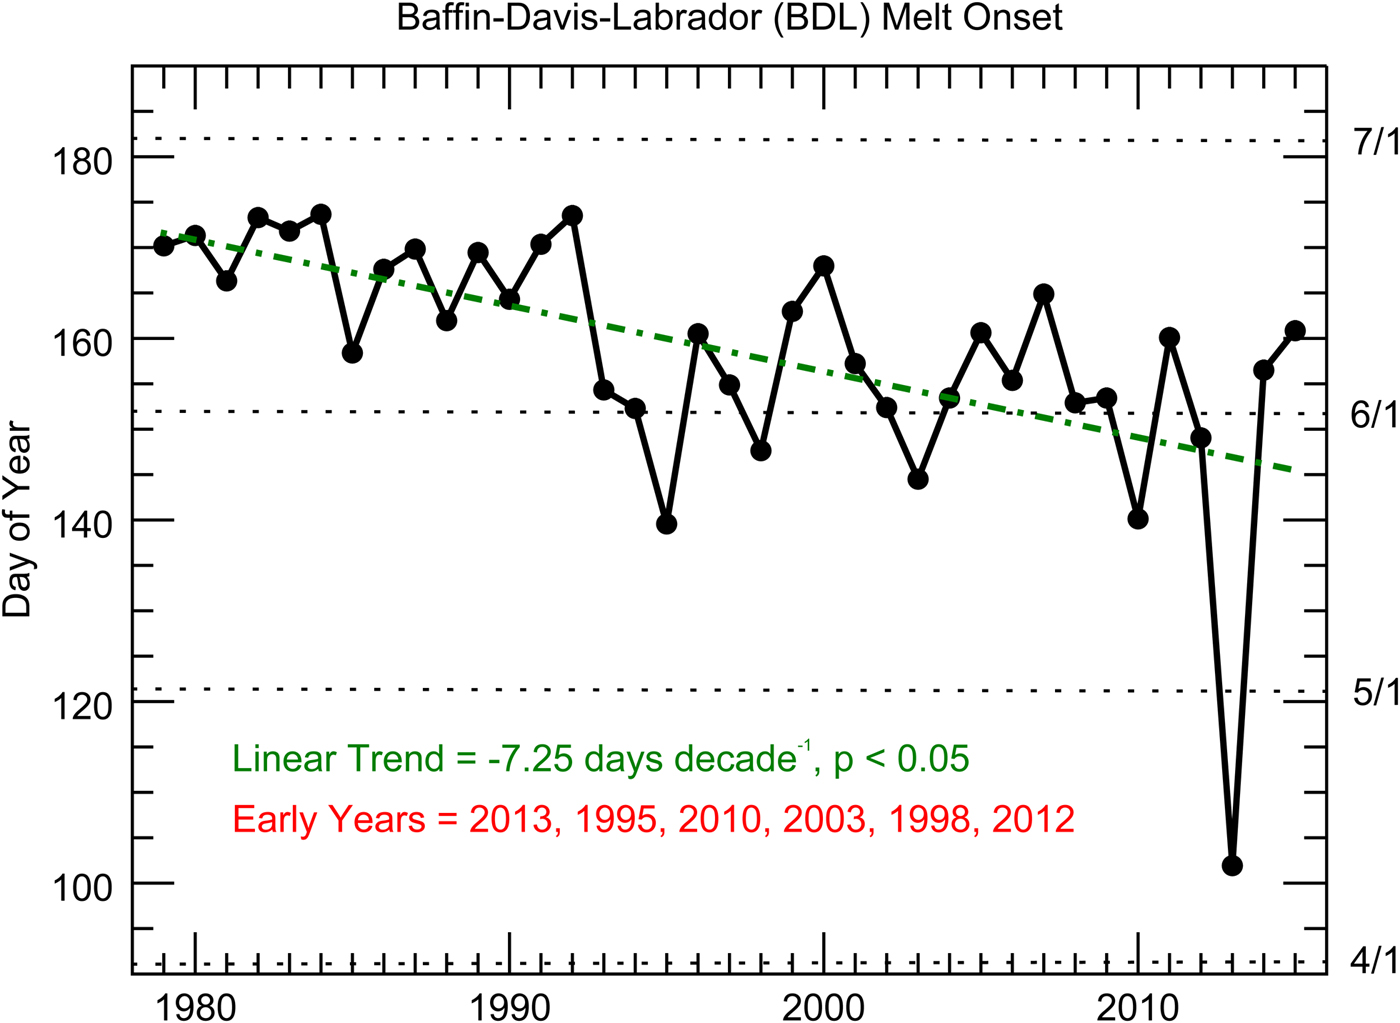
PM imagery portraying long-term MO and the 2013 event in the BDL region and surrounding areas are shown in Figure 2. While much of Baffin Bay shows intermixed pixels of ±10 day deviations from normal in 2013, there is a rather notable northeast to southwest trending swath of early melt anomalies (~−40 days) that extends along the ice edge from ~75°N in northeastern Baffin Bay to ~60°N around the southern tip of Baffin Island (Fig. 2c). The 2013 early melt event (day of year 102; 12 April) is particularly anomalous relative to MO dates archived across the modern satellite record (Fig. 3) at almost six standard deviations (6σ) below the 1981–2010 mean BDL MO date, and is ~8 weeks earlier than normal MO (day of year 160; 9 June). It is apparent from Figure 3 that progressively earlier melt conditions are a clear feature of the recent BDL spring environment, though the 2013 region-wide melt is an outlier, beginning 38 days earlier than the next earliest melt observed in 1995 (day of year 140; 20 May).
Melt onset (MO) maps of the BDL region and surrounding areas depicting (a) climatological MO dates, 1979–2015, (b) 2013 MO dates, (c) 2013 MO anomalies (relative to the 1979–2015 period), and (d) areas of statistical difference from climatology (in red, P ≤ 0.05).
Time series of BDL MO dates, 1979–2015. The left y-axis represents the day of year when continuous melt occurs, while the right y-axis shows the respective first day of each month (i.e. 4/1 = 1 April) in non-leap years. Early MO years, 1σ below the 1981–2010 mean, are identified within the graphic.
Atmospheric circulation anomalies
Based on the lagged correlations, especially involving the detrended time series, the optimal GBI linkage with subsequent MO is found within the 40-day period preceding melt (r DT<−0.35, P ≤ 0.05 in all 10-day windows out to 40 days; Table 1). Visual inspection of the detrended time series (Fig. S1) reveals pronounced anti-correlation during the earliest melt years where positive GBI occurrences are anomalously high pre-dating MO.
Lagged Pearson's correlations of GBI composite values within different time windows preceding each respective BDL melt onset (MO) versus MO day of year. Linearly detrended analyses are indicated as such (r DT)
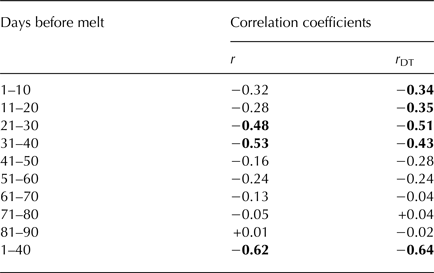
Bold values are significant at P ≤ 0.05.
To initially assess the physical contributions to anomalous sea-ice melt events, the synoptic atmospheric circulation is evaluated through analyses of the GBI over the 40-day timeframe preceding extreme MOs (characterized as 1σ events below the climatological BDL melt date). Early melt years are typically defined by positive, daily GBI conditions during at least half of the days in this timeframe, with many of these occurring within the 10–15-day period immediately prior to melt (Fig. 4). The 2013 event is characterized by positive GBI values persisting throughout the 40-days leading up to melt (μ GBI = 1.46) with 31 days exhibiting GBI values of at least +1, of which 10-days observed index values >+2 (Table 2). The preponderance of +1 and +2 extreme daily GBI values represent a statistically significant increase from climatology by roughly a factor of 4 and 5, respectively. Similar to 2013, the 2010 pre-melt period exhibits 40 consecutive days of positive GBI values, while the 1995 melt coincides with 9 days of GBI values ≥+2. The latest melt onsets of the 1980s and early 1990s, by contrast, are characterized by greater GBI variability with fewer positive GBI days and more frequent negative extreme occurrences (Table S1 and Fig. S2), reflecting the colder ocean-atmosphere state of the region relative to the years that followed (Buch and others, Reference Buch, Pedersen and Ribergaard2004; van As, Reference van As2011). These case studies identify the unparalleled nature of the 2013 event in terms of extreme GBI persistence before MO with values remaining ≥+1 for 26 consecutive days (day 40–day 14; Fig. 4), and 500 hPa GPH anomalies of +300 m over Baffin Bay during the 21–30 days before melt (not shown).
Daily GBI values during the 40-days preceding the early BDL MO years, which are listed sequentially in the bottom left of the plot with the corresponding day of year (DOY) marking continuous melt conditions for the region.
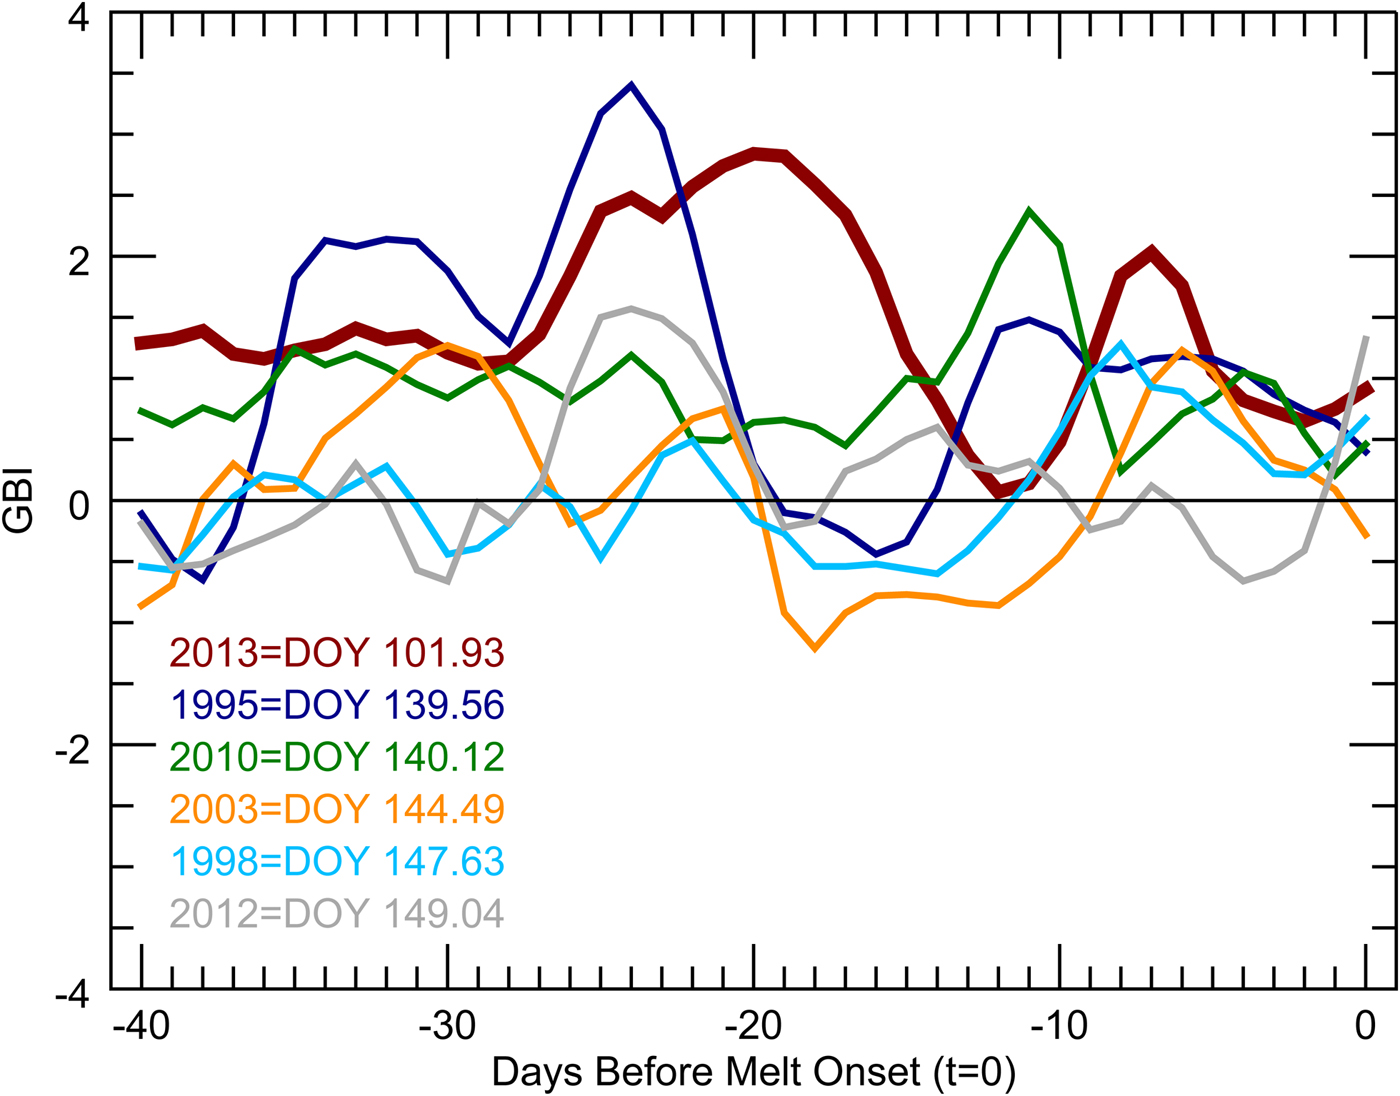
GBI descriptive statistics (mean = μ, standard deviation = σ) and sum (Σ) of days at different GBI value thresholds for the 40-day period preceding MO across the climatological normal period and the early melt years
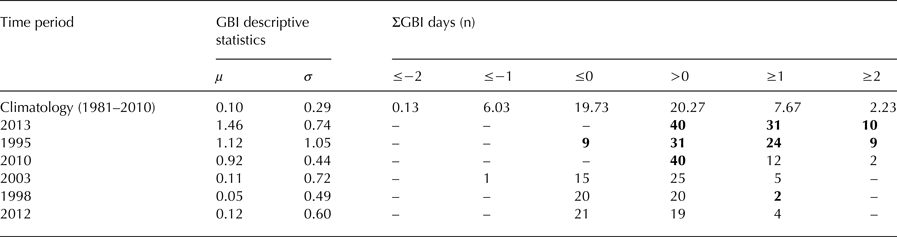
Significant differences, determined by a two-tailed t-test (P ≤ 0.05), between GBI occurrences during the individual years and climatology are shown in bold (where threshold of occurrence is at least 5% of days, n = 2).
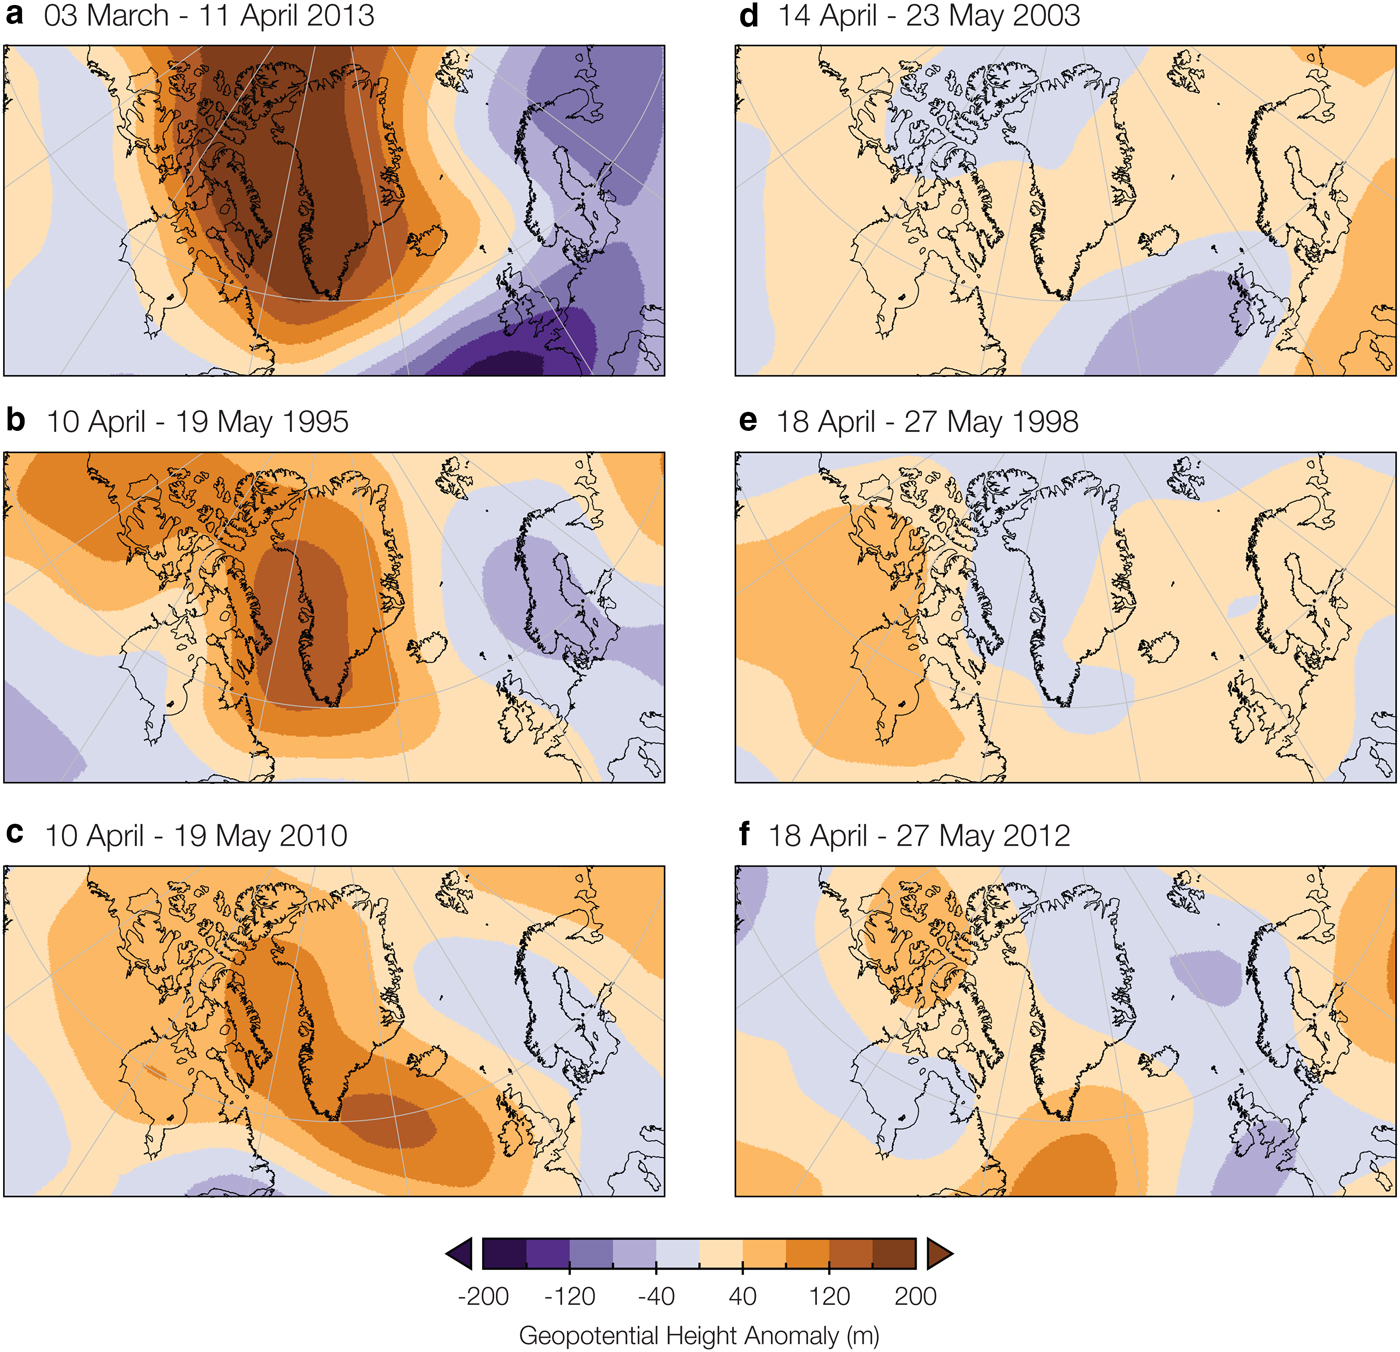
Composite 500 hPa GPH analyses reveal notable circulation differences between the set of early melt years (Fig. 5). In particular, strong high pressure blocking is shown across the BDL region in 2013, with mean height anomalies of ≥+160 m spanning much of the area and extending into the Central Arctic Ocean. Mid-tropospheric GPH anomalies are similarly above-normal in the next earliest years of 1995 and 2010 across the North Atlantic and Greenland, but exhibit lower heights over the BDL area by 40–80 m during their respective pre-melt periods relative to the 2013 event. Positive (anticyclonic) 500 hPa GPH anomalies favor meridional flow as indicated by prevailing southerly winds observed blowing south-to-north across Davis Strait (60–65°N, 52.5–62.5°W) from the polar front jet level (300 hPa) to the lower troposphere (925 hPa; not shown). These anomalous flows are not evident for 1998, 2003 and 2012, which have MO anomalies closer to 1σ below normal.
Composite 500 hPa GPH anomaly maps, versus 1981–2010 mean, during the 40-day period referenced for (a) 2013, (b) 1995, (c) 2010, (d) 2003, (e) 1998 and (f) 2012 early MO years.
Poleward advection of lower-latitude air onto the BDL ice cover in 2013 is also impacted by a weaker-than-normal North Atlantic surface pressure gradient. Average values of the Cropper NAO index over the 40-day window are 2.16σ below the climatological mean, which is substantially more negative than the next lowest NAO value observed during an extreme melt year (−0.93 in 1995). In 2013, the Icelandic Low shows significant weakening from normal with positive sea-level pressure values of ~+16–20 hPa extending from northern Irminger Sea northward onto the eastern half of the island and adjacent Greenland Sea. Positive SLP anomalies of +8–12 hPa also extend into the BDL area, while a significantly weakened Azores High with below-normal pressure is found across the northeastern Atlantic (Fig. S3). Persistent positive surface pressure and mid-tropospheric height anomalies over the BDL region favor southerly, geostrophic airflow from the comparatively warmer environment of the western North Atlantic through Davis Strait and into Baffin Bay, thereby preconditioning the seasonal sea ice for abnormally early melt.
Thermodynamic environment
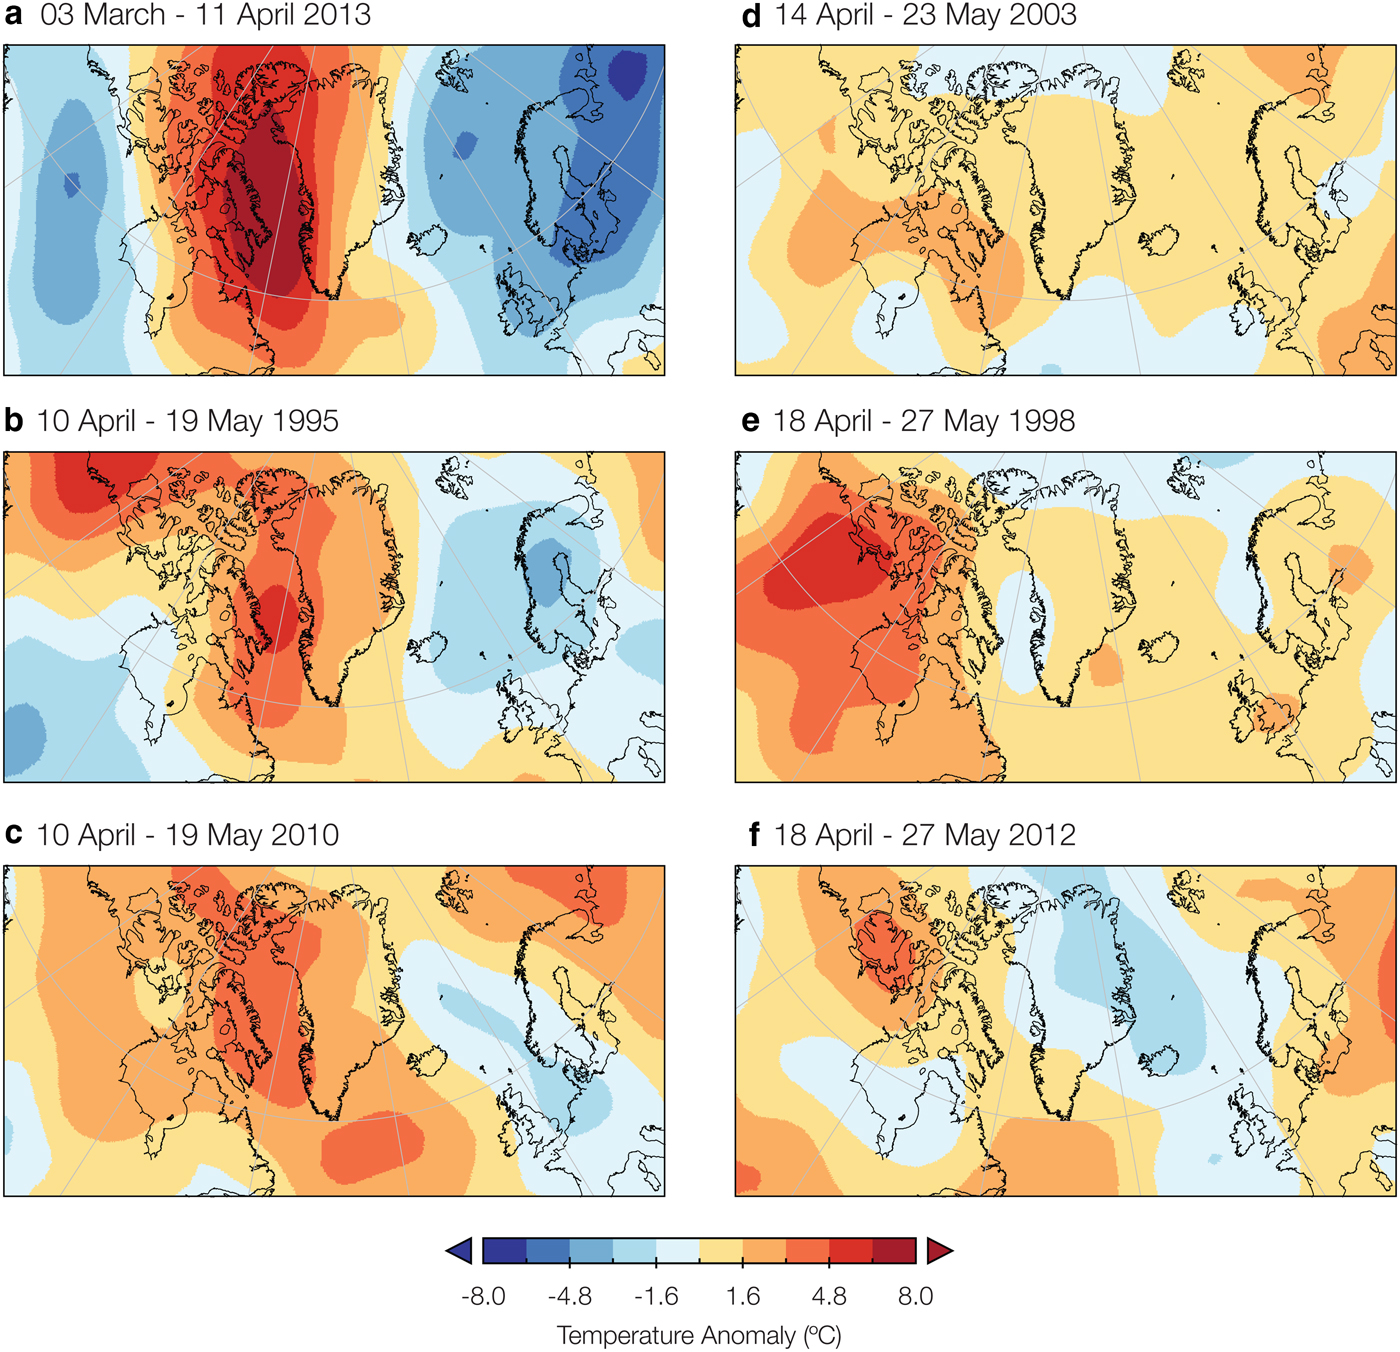
Collocated with the persistent and strong, upper-level high pressure Greenland block in 2013 are positive T850 anomalies of >+6°C oriented in a south-to-north manner along Davis Strait that extend into Baffin Bay (Fig. 6). Aside from 1998 and 2012, the remaining early melt years are led by positive temperature anomalies over waters adjacent to the west Greenland coastline, though none are comparable with the magnitude of warm anomalies in 2013.
Composite T850 hPa anomaly maps, versus 1981–2010 mean, during the 40-day period referenced for (a) 2013, (b) 1995, (c) 2010, (d) 2003, (e) 1998 and (f) 2012 early MO years.
To further investigate the nature of the 2013 warm air temperatures over the BDL during the unusually strong and persistent Greenland Block, we initially examine the regional SST conditions. Over the 40-days preceding melt, SST anomalies are slightly positive in Baffin Bay (Table 3), narrowly above the salinity-adjusted freezing point in an area often characterized by sub-freezing temperatures and seasonal sea-ice coverage during this time (not shown). Northern and southern portions of the Labrador Sea also exhibit positive SST anomalies of +0.13 and +0.47°C, respectively, while the surface waters within Irminger Sea are +0.37°C from the 1982–2011 average. The precursor North Atlantic-wide ocean temperature departures categorized by the March 2013 AMO index value are anomalous (+0.17°C), falling within the uppermost quartile of SST values beginning in 1982. In addition, HadISST1 also shows a swath of +0.50–1.50°C SST anomalies extending south from the southwest Greenland coast, representing a source of lower latitude warm air swept north across the ice by prevailing winds (Fig. S4).
SST anomalies over the 40-day period preceding melt in 2013 (versus 1982–2011 climatology) and corresponding rank over the 1982–2015 period (warmest year = 1, coldest year = 34)
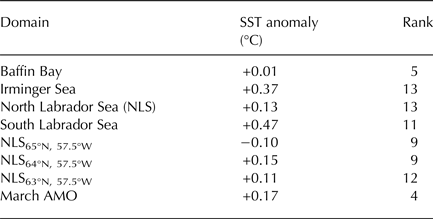
March AMO represents a monthly-averaged value. The high rank despite negative anomaly at the 65°N grid point reflects the tendency for this North Labrador Sea (NLS) location to be ice-covered with the exception of warm years. Local hydrographic regions are identified in Fig. 1.
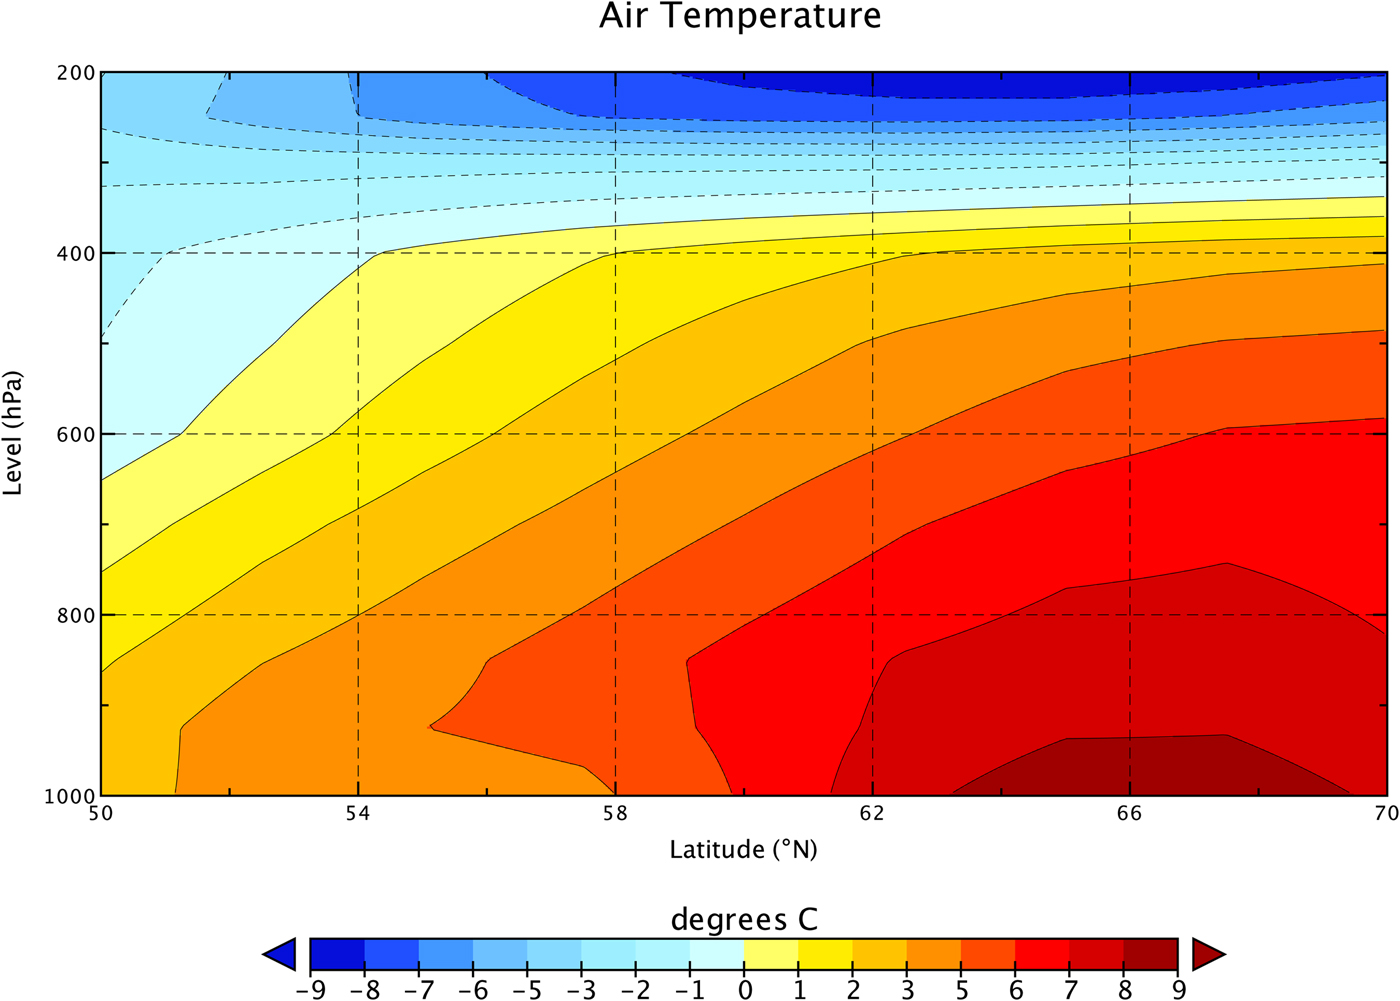
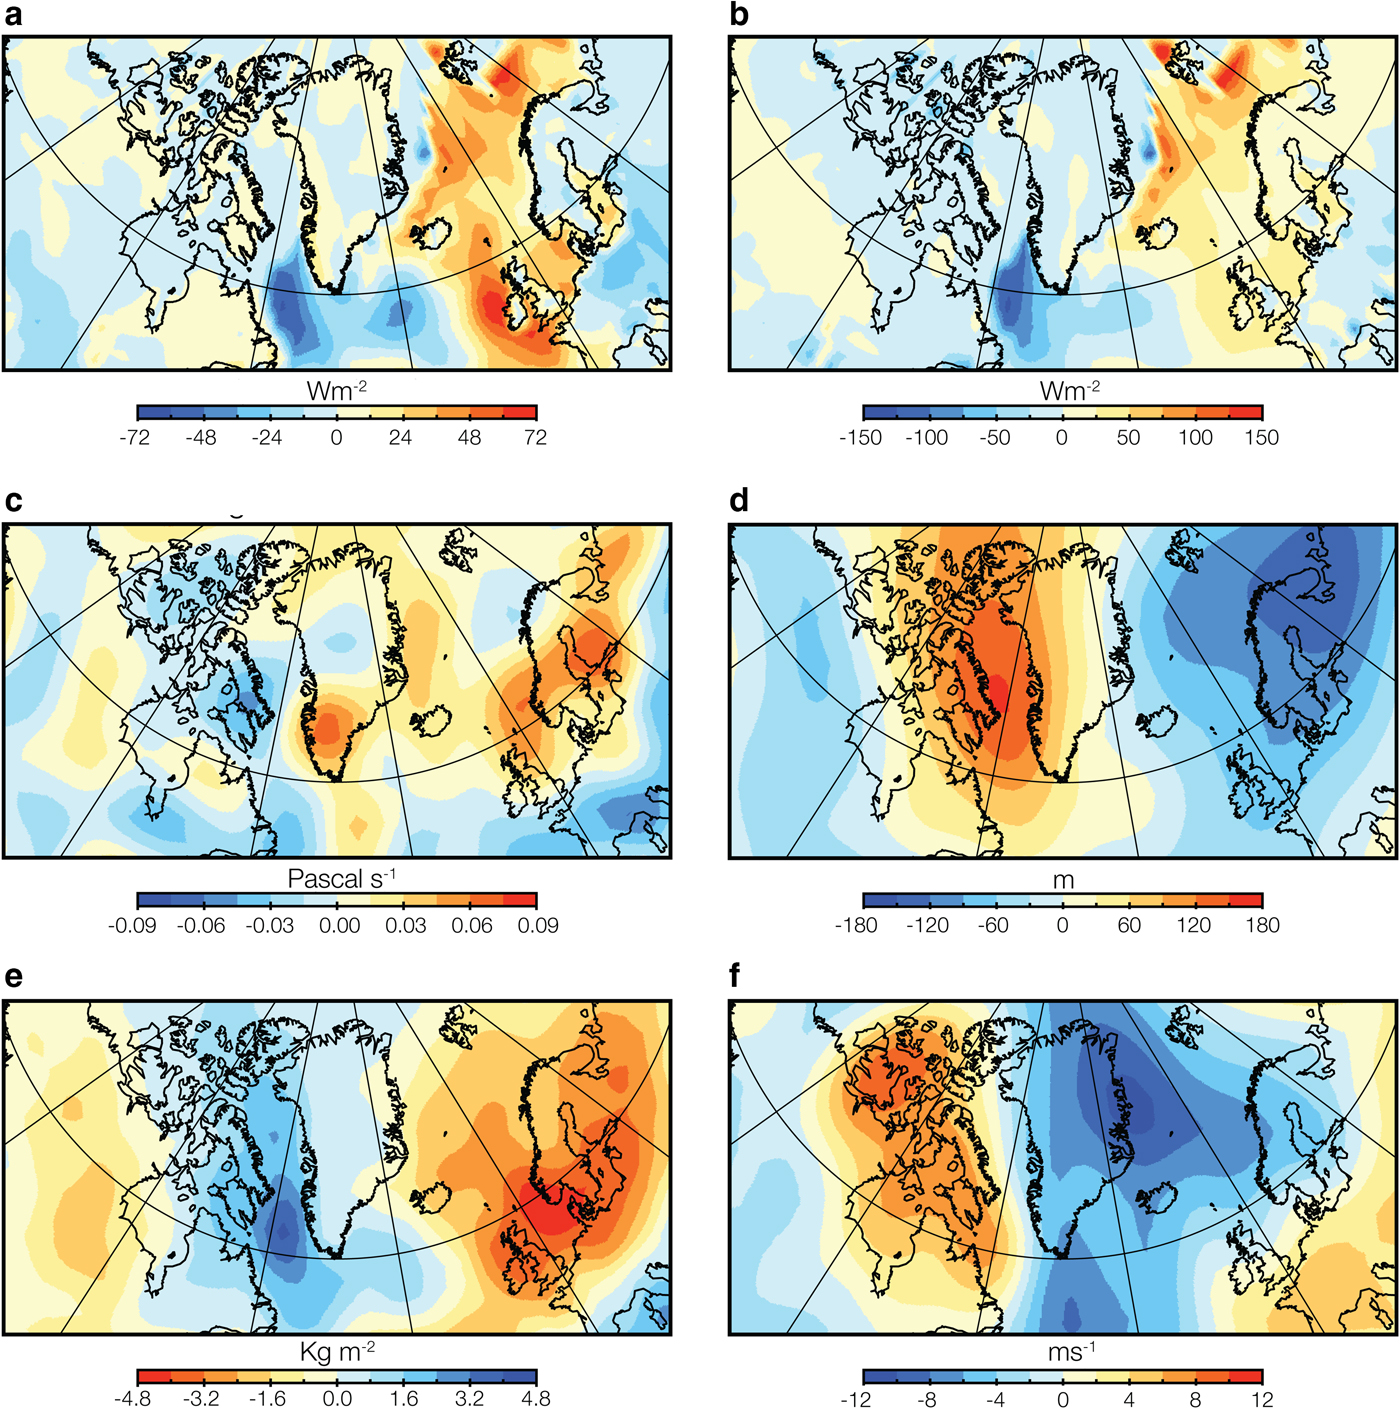
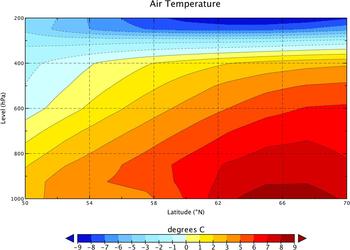
Positive air temperature anomalies extend from the surface to the middle troposphere over the BDL region (Fig. 7) with the largest departures (~+8°C) near the surface, emanating southward from southern Baffin Bay (~69°N) into northern Labrador Sea (~63°N). Conductive heat flux from the relatively warm ocean surface to the adjacent cooler atmosphere may slightly influence the anomalously warm lower tropospheric air temperature anomalies, however persistent high pressure and on-ice flow likely has a greater impact on melt. Small, negative latent and sensible heat flux anomalies over areas of seasonal ice coverage (Figs 8a, and b) suggest transfers of atmospheric moisture and heat toward the surface. Descending motion, while pronounced over southern Greenland, is also relatively weak in BDL areas as indicated by positive 500 hPa omega anomalies (Fig. 8c). Poleward-flowing thermal winds, corroborated by the meridional wind anomaly extending westward from central Davis Strait, are associated with large, positive 1000–500 hPa thickness anomalies that reinforce the concurrent blocking regime in transporting a warm, moist layer of air over the Labrador Sea northward onto the BDL ice cover before melt ensues (Figs 8d–f).
Vertical air temperature anomalies for 3 March – 11 April 2013 stretching from southern Baffin Bay through the Labrador Sea (50–70°N, 50–60°W) relative to the 1981–2010 mean for the 40-day period.
Composite plots of (a) latent heat flux (b) sensible heat flux, (c) 500 hPa omega, (d) 1000–500 hPa thickness, (e) columnar precipitable water and (f) meridional wind speed for the 40-days preceding 2013 BDL melt onset relative to the 1981–2010 climatology for the time period.
DISCUSSION
A confluence of precursor dynamical and thermodynamic conditions influenced the unseasonably early melt of the 2013 BDL ice cover. Foremost, positive 500 hPa height anomalies, assessed from the GBI time series and shown via composite analyses, persisted in the immediate 40-day window before melt. Stationary, upper-air ridges are not uncommon in this region in the weeks-to-months preceding the spring break-up; however, the magnitude of the persistent 500 hPa GPH pattern observed in 2013 is unprecedented preceding MO events during the PM satellite record. Downstream linkages to the GBI anomaly also manifested in a record low Hurrell PC-based March NAO index value back to 1899 (Hanna and others, Reference Hanna, Cropper, Hall, Scaife and Allen2015) and the coldest UK-wide March temperatures since 1962 (Met Office, 2013).
Since the early 1990s, GBI values have increased during the cold season when seasonal ice cover forms and persists in the BDL region (November–March; Hanna and others, Reference Hanna, Cropper, Hall and Cappelen2016). Amplified upper-level heights in winter (DJF) and spring (MAM) across Greenland tend to coincide with a weak North Atlantic polar front jet stream and enhanced meridional circulation of warm air from the Irminger and Labrador Seas and northeastern Canada into Baffin Bay (Hanna and others, Reference Hanna, Cropper, Hall and Cappelen2016). The synoptic ocean-atmosphere conditions associated with the 2013 BDL melt anomaly are characterized by anomalous blocking, meridional flow and relatively mild air temperatures with slightly above-average Labrador and Irminger SSTs that directly interact with the ice cover through regional hydrography involving the East Greenland Current. Local SSTs in sea-ice free areas of the Arctic influence low-to-middle troposphere warming through ocean-atmosphere heat exchange (Screen and others, Reference Screen, Deser and Simmonds2012). However, the coupling of persistent and positive GBI conditions and local SST anomalies does not appear to be a preconditioning requirement to generate an anomalously early BDL MO. For example, the 40-day period preceding both the 2010 and 2013 early melt events are categorized by positive local SST conditions and GBI values, while the pre-melt period during the 1995 event witnessed above-average GBI conditions amidst negative SST anomalies (not shown). Comparatively, the 2010 SST anomalies in N/S Labrador Sea and Baffin Bay were the warmest or second warmest pre-dating MO, while those regions only saw slight ocean temperature deviations from climatology in 2013. These findings, along with the turbulent flux and omega anomalies shown in Fig. 8, suggest that air temperature anomalies extending from the surface to ~400 hPa were influenced slightly by downward shortwave flux and SSTs with a larger warming contribution from warm air advection due to the presence of persistent high pressure about the region.
The 2013 anomalous climatic event marked the second notable period of GBI persistence that dramatically impacted the North Atlantic cryosphere within the space of a year. Summer (JJA) 2012 also witnessed record-breaking GBI values (over the NCEP/NCAR record from 1948 onward) and the Greenland ice sheet experienced historic spatial melt extent (Nghiem and others, Reference Nghiem2012; Hanna and others, Reference Hanna2014). Above-average coastal air and ocean surface temperatures persisted into autumn 2012 bringing about the second latest Baffin freeze onset in the PM record (Ballinger and others, Reference Ballingerin press). The duration of the freeze period, from 17 November 2012 to 12 April 2013 and nearly 2.5 months shorter-than-normal, is the shortest such window of the PM record (Fig. S5). Correlation analyses indicate that freeze duration and MO strongly co-vary through time (r = +0.90, r DT = +0.87, P < 0.05 in both cases) with anomalously early melt generally connected to abbreviated periods of freezing temperatures. Delays in autumn freeze onset also appear to influence this relationship by promoting earlier melt the following spring (r = −0.50, P < 0.05). It is likely that the short period of ice coverage in 2013 also coincided with a thinner-than-normal seasonal ice pack as December 2012–March 2013 near-surface air temperature anomalies (from NCEP/NCAR reanalysis) were ~+5°C above-normal across Baffin Bay (Peings and Magnusdottir, Reference Peings and Magnusdottir2015).
CONCLUSIONS
The Arctic amplification signal has emerged from climate system noise over the last two decades, creating complex, bidirectional linkages between meridional airflow and the background thermodynamic state based on behaviors of variables such as sea ice and SSTs that vary by regional geography (Francis and Vavrus, Reference Francis and Vavrus2015; Overland and others, Reference Overland2016). In this study, persistence of a strong Greenland blocking anticyclone across a 40-day period in late winter/early spring of 2013 prompted an unusually early and continuous melt of seasonal ice cover across Baffin Bay, Davis Strait and the Labrador Sea. The stationary high pressure pattern was the primary mechanism responsible for relatively warm temperatures in the lower-to-middle-troposphere, driving localized heating through the transport of warm, moist air onto the thin ice cover. We posit that an abnormally short-freeze period also played a role in preconditioning the ice cover for extreme melt. Future studies will further examine freeze duration links to melt onset in a regional sea-ice-atmosphere context.
In addition to temperature advection, poleward moisture flux has been linked with Arctic warming through increases in cloud coverage and downward infrared radiation (Gong and others, Reference Gong, Feldstein and Lee2017). Early sea-ice melt events across the Arctic often coincide with a steady increase in atmospheric water vapor over the 2-week period leading up to melt, followed by a rapid drying of the atmosphere thereafter (Mortin and others, Reference Mortin2016). In this study, persistent, high pressure anomalies extending up to the 500 hPa layer likely influenced poleward temperature and moisture advection, but precluded extremely high local humidity values from occurring, though detailed analyses of water vapor content were not explicitly conducted for 2013 or other early melt events. As the transport of heat and moisture fluxes into the Arctic are strongly influenced by variations in the polar jet stream, it is imperative to continue to conduct analyses with regional circulation modes such as the GBI to advance understanding of the precursor dynamical forcing associated with snow, glacier and sea-ice melt anomalies.
SUPPLEMENTARY MATERIAL
The supplementary material for this article can be found at https://doi.org/10.1017/aog.2017.30.
ACKNOWLEDGEMENTS
Angela Bliss, Ronald Kwok and Thomas Mote are thanked for discussions of local glaciology during spring of 2013. We appreciate comments from Walt Meier (editor) and two anonymous reviewers, which helped to improve the manuscript. The National Oceanic and Atmospheric Administration (NOAA) Earth System Research Laboratory (ESRL) Physical Sciences Division (PSD) website provided NCEP/NCAR reanalysis data (https://www.esrl.noaa.gov/psd/data/gridded/data.ncep.reanalysis.html), AMO monthly time series (https://www.esrl.noaa.gov/psd/data/timeseries/AMO/), and the Web-based Reanalysis Intercomparison Tool used to create the HadISST March 2013 SST anomaly plot (https://www.esrl.noaa.gov/psd/cgi-bin/data/testdap/plot.comp.pl). Data are available upon request. JEO is supported by Arctic Research of NOAA's Climate Program Office. This is PMEL contribution number 4679.


 Open access