


1 Introduction
Periodically driven turbulent flows are omnipresent. Well-known examples include blood flow driven by the beating heart, the flow in internal combustion engines, the Earth’s atmosphere which is periodically heated by the Sun, and tidal currents caused by periodic changes in the gravitational attraction of both the Moon and Sun.
One line of research assumes homogeneous isotropic turbulence. These studies focused on the global response of the system, i.e. the response amplitude and the phase shift of quantities such as the global Reynolds number (Lohse Reference Lohse2000), or the total energy in the system (von der Heydt, Grossmann & Lohse Reference von der Heydt, Grossmann and Lohse2003a ). Most numerical studies in addition only used simplified models, such as the GOY (Gledzer–Ohkitani–Yamada) shell model or the reduced wavevector set approximation (REWA) (Hooghoudt, Lohse & Toschi Reference Hooghoudt, Lohse and Toschi2001; von der Heydt, Grossmann & Lohse Reference von der Heydt, Grossmann and Lohse2003b ; Hamlington & Dahm Reference Hamlington and Dahm2009). Only a limited number of direct numerical simulation (DNS) studies have been performed in this field, because of the computational costs needed to achieve both fully developed turbulence and sufficient statistical convergence with temporal dependence (Kuczaj, Geurts & Lohse Reference Kuczaj, Geurts and Lohse2006; Yu & Girimaji Reference Yu and Girimaji2006; Kuczaj et al. Reference Kuczaj, Geurts, Lohse and van de Water2008). Also studies on periodically driven wind tunnels were performed (Cekli, Tipton & Van De Water Reference Cekli, Tipton and Van De Water2010).
The field of pulsating pipe flow has received significantly more attention, presumably because of its clear industrial and biophysical relevance – see e.g. Womersley (Reference Womersley1955), Shemer, Wygnanski & Kit (Reference Shemer, Wygnanski and Kit1985), Mao & Hanratty (Reference Mao and Hanratty1986), Lodahl, Sumer & Fredsøe (Reference Lodahl, Sumer and Fredsøe1998), He & Jackson (Reference He and Jackson2009), and many others. In most studies, like in the present study, an oscillatory flow was superimposed on a steady current. Depending on the relative strength, the system was either ‘current-dominated’ or, for strong oscillations, ‘wave-dominated’, the majority of the studies being current-dominated (Manna, Vacca & Verzicco Reference Manna, Vacca and Verzicco2012). For many cases it was found that pulsations increase the critical Reynolds number (Sarpkaya Reference Sarpkaya1966; Yellin Reference Yellin1966), and that an initially turbulent flow can relaminarize when a periodic forcing is applied (Ramaprian & Tu Reference Ramaprian and Tu1980; Shemer et al. Reference Shemer, Wygnanski and Kit1985). In most studies the Reynolds number of the imposed oscillatory flow, however, was close to the laminar–turbulent transition (Lodahl et al. Reference Lodahl, Sumer and Fredsøe1998); thus, even if the steady current was fully turbulent, the oscillation was not.
Periodically driven turbulence also includes studies in a number of different well-known and canonical closed flow geometries, such as Rayleigh–Bénard convection (Jin & Xia Reference Jin and Xia2008; Sterl, Li & Zhong Reference Sterl, Li and Zhong2016) and von Kármán flow (Cadot, Titon & Bonn Reference Cadot, Titon and Bonn2003). In these systems the forcing was periodically varied over time, with the variations being of
 $O$
(10 %) of either the average forcing or the energy input.
$O$
(10 %) of either the average forcing or the energy input.
The main observations made in the studies on sinusoidally driven turbulence were similar regarding the global response of the system (Cadot et al.
Reference Cadot, Titon and Bonn2003; von der Heydt et al.
Reference von der Heydt, Grossmann and Lohse2003a
,Reference von der Heydt, Grossmann and Lohse
b
; Kuczaj et al.
Reference Kuczaj, Geurts and Lohse2006; Chien, Blum & Voth Reference Chien, Blum and Voth2013). The periodic driving is governed by the Womersley number
 $Wo=L\sqrt{\unicode[STIX]{x1D6FA}/\unicode[STIX]{x1D708}}$
, which can be seen as the square root of the dimensionless modulation frequency. Here,
$Wo=L\sqrt{\unicode[STIX]{x1D6FA}/\unicode[STIX]{x1D708}}$
, which can be seen as the square root of the dimensionless modulation frequency. Here,
 $L$
is a characteristic length scale,
$L$
is a characteristic length scale,
 $\unicode[STIX]{x1D708}$
the kinematic viscosity and
$\unicode[STIX]{x1D708}$
the kinematic viscosity and
 $\unicode[STIX]{x1D6FA}$
the angular oscillation frequency. In the limit of extremely small Womersley numbers, the flow can fully respond to the changes, meaning that the flow behaviour is quasi-stationary. In this regime, no phase delay
$\unicode[STIX]{x1D6FA}$
the angular oscillation frequency. In the limit of extremely small Womersley numbers, the flow can fully respond to the changes, meaning that the flow behaviour is quasi-stationary. In this regime, no phase delay
 $\unicode[STIX]{x1D6F7}_{delay}$
between the response and the modulation is observed, and the response amplitude is identical to the modulation amplitude. As the Womersley number is increased, the fluid system cannot follow the changing boundary conditions: the response amplitude decreases and a phase delay between input and response is observed. In the extreme case of infinite Womersley numbers, the response amplitude vanishes and a phase delay can no longer be defined.
$\unicode[STIX]{x1D6F7}_{delay}$
between the response and the modulation is observed, and the response amplitude is identical to the modulation amplitude. As the Womersley number is increased, the fluid system cannot follow the changing boundary conditions: the response amplitude decreases and a phase delay between input and response is observed. In the extreme case of infinite Womersley numbers, the response amplitude vanishes and a phase delay can no longer be defined.
In this paper, we study the physics of periodically driven turbulence in a Taylor–Couette (TC) apparatus, employing a sinusoidally driven inner cylinder. TC flow, i.e. the flow of a fluid confined in the gap between two concentric cylinders, is one of the canonical systems in which the physics of fluids is studied – see e.g. the recent reviews by Fardin, Perge & Taberlet (Reference Fardin, Perge and Taberlet2014) and Grossmann, Lohse & Sun (Reference Grossmann, Lohse and Sun2016). It has the advantage of being a closed system with an exact global energy balance (Eckhardt, Grossmann & Lohse Reference Eckhardt, Grossmann and Lohse2007), and due to its simple geometry TC systems can be accessed experimentally with high precision.
An important difference between pipe flow and TC flow is the way the system is driven. Pulsating pipe flow is driven by a time-dependent pressure difference applied to the system, but the walls remain fixed. Therefore, momentum is transported from the bulk flow to the boundary layers. In TC flow, the (periodic) driving is by the rotation of the cylinders, so that the momentum is transported from the boundary layer to the bulk flow. By periodically driving the inner cylinder, we directly modulate the boundary layer, which transports the modulations to the bulk flow, whereas in pipe flow the bulk flow is directly modulated by the applied pressure gradient. Therefore, studying periodically driven TC turbulence sheds light on the role of the boundary layers in transporting these modulations. Further important differences are the presence of curvature effects and centrifugal forcing in TC, which are clearly absent in pipe flow. Apart from several recent studies that focused on the decay of turbulent TC flow (Ostilla-Mónico et al. Reference Ostilla-Mónico, Verzicco, Grossmann and Lohse2014; Verschoof et al. Reference Verschoof, Huisman, van der Veen, Sun and Lohse2016; Ostilla-Mónico et al. Reference Ostilla-Mónico, Zhu, Spandan, Verzicco and Lohse2017), or time-dependent driving close to the low-Reynolds-number Taylor-vortex regime (Ahlers Reference Ahlers1987; Walsh & Donnelly Reference Walsh and Donnelly1988; Barenghi & Jones Reference Barenghi and Jones1989; Ganske, Gebhardt & Grossmann Reference Ganske, Gebhardt and Grossmann1994; Borrero-Echeverry, Schatz & Tagg Reference Borrero-Echeverry, Schatz and Tagg2010), to our knowledge no work has been conducted so far on TC turbulence with time-dependent driving.
The outline of this paper is as follows. We start by explaining the experimental method in § 2. The results, in which we present the response of the flow, are shown in § 3. Finally, we conclude this paper in § 4.
2 Method
In this study, we restrict ourselves to the case of inner cylinder rotation, while keeping the outer cylinder at rest. The inner cylinder rotation is set to
 $$\begin{eqnarray}f_{i}(t)=\langle f_{i}\rangle _{t}(1+e\sin (2\unicode[STIX]{x03C0}t/T)),\end{eqnarray}$$
in which
 $f_{i}(t)$
is the rotation rate of the inner cylinder at time
$f_{i}(t)$
is the rotation rate of the inner cylinder at time
 $t$
and
$t$
and
 $T=2\unicode[STIX]{x03C0}/\unicode[STIX]{x1D6FA}$
is the period of the modulation. The time
$T=2\unicode[STIX]{x03C0}/\unicode[STIX]{x1D6FA}$
is the period of the modulation. The time
 $t$
is related to the phase
$t$
is related to the phase
 $\unicode[STIX]{x1D6F7}$
by
$\unicode[STIX]{x1D6F7}$
by
 $\unicode[STIX]{x1D6F7}=2\unicode[STIX]{x03C0}t/T$
. Here we chose to study the current-dominated regime. To do so, the modulation amplitude is set to
$\unicode[STIX]{x1D6F7}=2\unicode[STIX]{x03C0}t/T$
. Here we chose to study the current-dominated regime. To do so, the modulation amplitude is set to
 $e=0.10$
throughout this work, so that the mean flow is one order of magnitude larger than the induced modulation. The time-averaged rotation rate
$e=0.10$
throughout this work, so that the mean flow is one order of magnitude larger than the induced modulation. The time-averaged rotation rate
 $\langle f_{i}\rangle _{t}$
is set to
$\langle f_{i}\rangle _{t}$
is set to
 $\langle f_{i}\rangle _{t}=5$
Hz, resulting in a time-averaged Reynolds number of
$\langle f_{i}\rangle _{t}=5$
Hz, resulting in a time-averaged Reynolds number of
 $\langle Re_{i}\rangle _{t}=\langle u_{i}\rangle _{t}d/\unicode[STIX]{x1D708}=2\unicode[STIX]{x03C0}\langle f_{i}\rangle _{t}r_{i}d/\unicode[STIX]{x1D708}=5\times 10^{5}$
. In this equation,
$\langle Re_{i}\rangle _{t}=\langle u_{i}\rangle _{t}d/\unicode[STIX]{x1D708}=2\unicode[STIX]{x03C0}\langle f_{i}\rangle _{t}r_{i}d/\unicode[STIX]{x1D708}=5\times 10^{5}$
. In this equation,
 $u_{i}=2\unicode[STIX]{x03C0}f_{i}r_{i}$
equals the velocity of the inner cylinder with radius
$u_{i}=2\unicode[STIX]{x03C0}f_{i}r_{i}$
equals the velocity of the inner cylinder with radius
 $r_{i}$
,
$r_{i}$
,
 $\unicode[STIX]{x1D708}$
is the kinematic viscosity and
$\unicode[STIX]{x1D708}$
is the kinematic viscosity and
 $d$
is the gap width between the cylinders. Here, we are in the so-called ‘ultimate turbulence’ regime, in which both the bulk flow and boundary layers are fully turbulent (Kraichnan Reference Kraichnan1962; Chavanne et al.
Reference Chavanne, Chilla, Castaing, Hebral, Chabaud and Chaussy1997; Grossmann & Lohse Reference Grossmann and Lohse2011; Huisman et al.
Reference Huisman, van Gils, Grossmann, Sun and Lohse2012). The strength of the modulation, which can be estimated as
$d$
is the gap width between the cylinders. Here, we are in the so-called ‘ultimate turbulence’ regime, in which both the bulk flow and boundary layers are fully turbulent (Kraichnan Reference Kraichnan1962; Chavanne et al.
Reference Chavanne, Chilla, Castaing, Hebral, Chabaud and Chaussy1997; Grossmann & Lohse Reference Grossmann and Lohse2011; Huisman et al.
Reference Huisman, van Gils, Grossmann, Sun and Lohse2012). The strength of the modulation, which can be estimated as
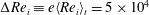 $\unicode[STIX]{x0394}Re_{i}\equiv e\langle Re_{i}\rangle _{t}=5\times 10^{4}$
, is such that the system is well into the ultimate regime at all times. We varied the modulation period
$\unicode[STIX]{x0394}Re_{i}\equiv e\langle Re_{i}\rangle _{t}=5\times 10^{4}$
, is such that the system is well into the ultimate regime at all times. We varied the modulation period
 $T$
from 180 s down to 3 s. The modulation period can be made dimensionless, resulting in the Womersley number, which is defined as
$T$
from 180 s down to 3 s. The modulation period can be made dimensionless, resulting in the Womersley number, which is defined as
 $$\begin{eqnarray}Wo=d\sqrt{2\unicode[STIX]{x03C0}/(T\unicode[STIX]{x1D708})}.\end{eqnarray}$$
See table 1 for all experimental parameters. The Womersley number is connected with the Stokes boundary layer thickness
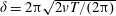 $\unicode[STIX]{x1D6FF}=2\unicode[STIX]{x03C0}\sqrt{2\unicode[STIX]{x1D708}T/(2\unicode[STIX]{x03C0})}$
, which, in its dimensionless form
$\unicode[STIX]{x1D6FF}=2\unicode[STIX]{x03C0}\sqrt{2\unicode[STIX]{x1D708}T/(2\unicode[STIX]{x03C0})}$
, which, in its dimensionless form
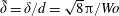 $\tilde{\unicode[STIX]{x1D6FF}}=\unicode[STIX]{x1D6FF}/d=\sqrt{8}\unicode[STIX]{x03C0}/Wo$
, is proportional to the inverse of the Womersley number. The modulation frequency was limited by the power of the motor needed to accelerate and decelerate the mass of the inner cylinder (160 kg). Owing to vibrations in the system, higher-order statistics cannot be measured. We then simultaneously measured the rotational speed of the inner cylinder
$\tilde{\unicode[STIX]{x1D6FF}}=\unicode[STIX]{x1D6FF}/d=\sqrt{8}\unicode[STIX]{x03C0}/Wo$
, is proportional to the inverse of the Womersley number. The modulation frequency was limited by the power of the motor needed to accelerate and decelerate the mass of the inner cylinder (160 kg). Owing to vibrations in the system, higher-order statistics cannot be measured. We then simultaneously measured the rotational speed of the inner cylinder
 $f_{i}(t)$
and the fluid velocity by using non-intrusive particle image velocimetry (PIV).
$f_{i}(t)$
and the fluid velocity by using non-intrusive particle image velocimetry (PIV).

Figure 1. (a) Schematic of the vertical cross-section of the T
 $^{3}$
C facility. The laser illuminates a horizontal plane (
$^{3}$
C facility. The laser illuminates a horizontal plane (
 $r,\unicode[STIX]{x1D703}$
) at mid-height (
$r,\unicode[STIX]{x1D703}$
) at mid-height (
 $z=l/2$
) for all particle image velocimetry (PIV) measurements. The flow is imaged from the bottom with a high-resolution sCMOS (scientific complementary metal oxide semiconductor) camera to obtain the velocity components
$z=l/2$
) for all particle image velocimetry (PIV) measurements. The flow is imaged from the bottom with a high-resolution sCMOS (scientific complementary metal oxide semiconductor) camera to obtain the velocity components
 $u_{\unicode[STIX]{x1D703}}$
and
$u_{\unicode[STIX]{x1D703}}$
and
 $u_{r}$
in the (
$u_{r}$
in the (
 $r,\unicode[STIX]{x1D703}$
) plane. (b) A typical instantaneous flow field, as measured with PIV. Here we show
$r,\unicode[STIX]{x1D703}$
) plane. (b) A typical instantaneous flow field, as measured with PIV. Here we show
 $u=\sqrt{u_{r}^{2}+u_{\unicode[STIX]{x1D703}}^{2}}$
normalized with the inner cylinder velocity
$u=\sqrt{u_{r}^{2}+u_{\unicode[STIX]{x1D703}}^{2}}$
normalized with the inner cylinder velocity
 $u_{i}$
, for the case with
$u_{i}$
, for the case with
 $Wo=44.3$
,
$Wo=44.3$
,
 $\unicode[STIX]{x1D6F7}=2.17$
rad and an instantaneous Reynolds number of
$\unicode[STIX]{x1D6F7}=2.17$
rad and an instantaneous Reynolds number of
 $Re_{i}=5.4\times 10^{5}.$
Table 1. Experimental details of the measurements. In all measurements the time-averaged Reynolds number as well as the modulation strength are kept identical. By changing the modulation period
 $T$
, we consequently change the Womersley number
$T$
, we consequently change the Womersley number
 $Wo$
. In the last column, we show the normalized Stokes boundary layer thickness
$Wo$
. In the last column, we show the normalized Stokes boundary layer thickness
 $\tilde{\unicode[STIX]{x1D6FF}}=\unicode[STIX]{x1D6FF}/d$
.
$\tilde{\unicode[STIX]{x1D6FF}}=\unicode[STIX]{x1D6FF}/d$
.

The experiments were performed in the Twente Turbulent Taylor–Couette (T
 $^{3}$
C) facility (van Gils et al.
Reference van Gils, Bruggert, Lathrop, Sun and Lohse2011), as shown schematically in figure 1. The apparatus has an inner cylinder with a radius of
$^{3}$
C) facility (van Gils et al.
Reference van Gils, Bruggert, Lathrop, Sun and Lohse2011), as shown schematically in figure 1. The apparatus has an inner cylinder with a radius of
 $r_{i}=200~\text{mm}$
and a transparent outer cylinder with a radius of
$r_{i}=200~\text{mm}$
and a transparent outer cylinder with a radius of
 $r_{o}=279.4~\text{mm}$
, resulting in a radius ratio of
$r_{o}=279.4~\text{mm}$
, resulting in a radius ratio of
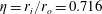 $\unicode[STIX]{x1D702}=r_{i}/r_{o}=0.716$
, and a gap width
$\unicode[STIX]{x1D702}=r_{i}/r_{o}=0.716$
, and a gap width
 $d=r_{o}-r_{i}=79.4~\text{mm}$
. The height of the set-up is
$d=r_{o}-r_{i}=79.4~\text{mm}$
. The height of the set-up is
 $l=927~\text{mm}$
, giving an aspect ratio of
$l=927~\text{mm}$
, giving an aspect ratio of
 $\unicode[STIX]{x1D6E4}=l/d=11.7$
. As working fluid we use water with a temperature of
$\unicode[STIX]{x1D6E4}=l/d=11.7$
. As working fluid we use water with a temperature of
 $T=20\,^{\circ }\text{C}$
, which is kept constant within 0.2 K by active cooling through the end-plates of the set-up. More experimental details of this facility can be found in van Gils et al. (Reference van Gils, Bruggert, Lathrop, Sun and Lohse2011).
$T=20\,^{\circ }\text{C}$
, which is kept constant within 0.2 K by active cooling through the end-plates of the set-up. More experimental details of this facility can be found in van Gils et al. (Reference van Gils, Bruggert, Lathrop, Sun and Lohse2011).
The PIV measurements were performed in the (
 $r,\unicode[STIX]{x1D703}$
) plane at mid-height (
$r,\unicode[STIX]{x1D703}$
) plane at mid-height (
 $z=l/2$
) using a high-resolution camera operating at 15 frames per second (pco.edge camera, double-frame sCMOS, 2560 pixel
$z=l/2$
) using a high-resolution camera operating at 15 frames per second (pco.edge camera, double-frame sCMOS, 2560 pixel
 $\times$
2160 pixel resolution). We illuminate the flow from the side with a horizontal laser sheet, as shown in figure 1. The laser used is a pulsed dual-cavity 532 nm Quantel Evergreen 145 Nd:YAG laser. We seeded the water with
$\times$
2160 pixel resolution). We illuminate the flow from the side with a horizontal laser sheet, as shown in figure 1. The laser used is a pulsed dual-cavity 532 nm Quantel Evergreen 145 Nd:YAG laser. We seeded the water with
 $1{-}20~\unicode[STIX]{x03BC}\text{m}$
fluorescent polyamide particles. We calculate the Stokes number, which equals
$1{-}20~\unicode[STIX]{x03BC}\text{m}$
fluorescent polyamide particles. We calculate the Stokes number, which equals
 $Stk=\unicode[STIX]{x1D70F}_{p}/\unicode[STIX]{x1D70F}_{\unicode[STIX]{x1D702}}=0.0019\ll 1$
. Furthermore, the mean particle radius is roughly six times smaller than our Kolmogorov length scale; thus we can be sure that the particles faithfully follow the flow. The images are processed with interrogation windows of 32 pixel
$Stk=\unicode[STIX]{x1D70F}_{p}/\unicode[STIX]{x1D70F}_{\unicode[STIX]{x1D702}}=0.0019\ll 1$
. Furthermore, the mean particle radius is roughly six times smaller than our Kolmogorov length scale; thus we can be sure that the particles faithfully follow the flow. The images are processed with interrogation windows of 32 pixel
 $\times$
32 pixel with 50 % overlap, resulting in
$\times$
32 pixel with 50 % overlap, resulting in
 $u_{\unicode[STIX]{x1D703}}(r,\unicode[STIX]{x1D703},t)$
and
$u_{\unicode[STIX]{x1D703}}(r,\unicode[STIX]{x1D703},t)$
and
 $u_{r}(r,\unicode[STIX]{x1D703},t)$
. We were unable to measure close to the cylinders due to the strong laser light reflections.
$u_{r}(r,\unicode[STIX]{x1D703},t)$
. We were unable to measure close to the cylinders due to the strong laser light reflections.
To compare our experiments in highly turbulent flow with the laminar case, we numerically solved the response of the flow. We therefore solved the partial differential equation
 $$\begin{eqnarray}\frac{\unicode[STIX]{x2202}u_{\unicode[STIX]{x1D703}}}{\unicode[STIX]{x2202}t}=\unicode[STIX]{x1D708}\left[\frac{1}{r}\left(\frac{\unicode[STIX]{x2202}}{\unicode[STIX]{x2202}r}\left(r\frac{\unicode[STIX]{x2202}u_{\unicode[STIX]{x1D703}}}{\unicode[STIX]{x2202}r}\right)\right)-\frac{u_{\unicode[STIX]{x1D703}}}{r^{2}}\right],\end{eqnarray}$$
which is the time-dependent Navier–Stokes equation in cylindrical coordinates for the azimuthal direction under the assumptions of (i) no azimuthal and axial derivatives, and (ii)
 $u_{r}=0$
and
$u_{r}=0$
and
 $u_{z}=0$
, so that
$u_{z}=0$
, so that
 $\boldsymbol{u}(r,\unicode[STIX]{x1D703},z,t)=u_{\unicode[STIX]{x1D703}}(r,t)\hat{\boldsymbol{e}}_{\unicode[STIX]{x1D703}}$
. As initial condition we used the steady-state laminar flow profile, i.e.
$\boldsymbol{u}(r,\unicode[STIX]{x1D703},z,t)=u_{\unicode[STIX]{x1D703}}(r,t)\hat{\boldsymbol{e}}_{\unicode[STIX]{x1D703}}$
. As initial condition we used the steady-state laminar flow profile, i.e.
 $$\begin{eqnarray}u_{\unicode[STIX]{x1D703}}(r,t=0)=\frac{1}{1-\unicode[STIX]{x1D702}^{2}}\left(\frac{r_{i}^{2}\unicode[STIX]{x1D714}_{i}}{r}-\unicode[STIX]{x1D714}_{i}\unicode[STIX]{x1D702}^{2}r\right).\end{eqnarray}$$
As time-dependent boundary conditions we set
 $$\begin{eqnarray}u(r_{i},t)=\unicode[STIX]{x1D714}_{i}r_{i}(1+0.1\sin (2\unicode[STIX]{x03C0}t/T)),\end{eqnarray}$$
and the outer cylinder is stationary, i.e.
 $u(r_{o},t)=0$
. We run the computation for 40 periods, so that all transient effects are gone.
$u(r_{o},t)=0$
. We run the computation for 40 periods, so that all transient effects are gone.

Figure 2. Normalized azimuthal velocity of the sinusoidally driven inner cylinder
 $u_{i}/\langle u_{i}\rangle _{t}$
(solid red) and normalized azimuthal velocity
$u_{i}/\langle u_{i}\rangle _{t}$
(solid red) and normalized azimuthal velocity
 $u_{\unicode[STIX]{x1D703}}/\langle u_{\unicode[STIX]{x1D703}}\rangle _{t}$
at mid-gap (solid blue). Three Womersley numbers are shown, (a)
$u_{\unicode[STIX]{x1D703}}/\langle u_{\unicode[STIX]{x1D703}}\rangle _{t}$
at mid-gap (solid blue). Three Womersley numbers are shown, (a)
 $Wo=88$
, (b)
$Wo=88$
, (b)
 $Wo=36$
and (c)
$Wo=36$
and (c)
 $Wo=15$
. The velocity is radially averaged between
$Wo=15$
. The velocity is radially averaged between
 $0.3\leqslant \tilde{r}\leqslant 0.7$
. On the top
$0.3\leqslant \tilde{r}\leqslant 0.7$
. On the top
 $x$
-axis, we show the phase
$x$
-axis, we show the phase
 $\unicode[STIX]{x1D6F7}$
of the modulations in radians.
$\unicode[STIX]{x1D6F7}$
of the modulations in radians.

Figure 3. Phase-averaged normalized azimuthal mid-gap flow velocity
 $u_{\unicode[STIX]{x1D703}}/\langle u_{\unicode[STIX]{x1D703}}\rangle _{t}$
as a function of normalized driving velocity of the inner cylinder
$u_{\unicode[STIX]{x1D703}}/\langle u_{\unicode[STIX]{x1D703}}\rangle _{t}$
as a function of normalized driving velocity of the inner cylinder
 $u_{i}/\langle u_{i}\rangle _{t}$
. We show the result for all measured Womersley numbers
$u_{i}/\langle u_{i}\rangle _{t}$
. We show the result for all measured Womersley numbers
 $Wo$
. The velocity is radially averaged between
$Wo$
. The velocity is radially averaged between
 $0.3\leqslant \tilde{r}\leqslant 0.7$
. The solid grey line corresponds to the quasi-stationary case
$0.3\leqslant \tilde{r}\leqslant 0.7$
. The solid grey line corresponds to the quasi-stationary case
 $u_{\unicode[STIX]{x1D703}}/\langle u_{\unicode[STIX]{x1D703}}\rangle _{t}=u_{i}/\langle u_{i}\rangle _{t}$
. The arrow at the bottom right indicates the direction of the cycles.
$u_{\unicode[STIX]{x1D703}}/\langle u_{\unicode[STIX]{x1D703}}\rangle _{t}=u_{i}/\langle u_{i}\rangle _{t}$
. The arrow at the bottom right indicates the direction of the cycles.
3 Results and analysis
3.1 Velocity response
In figure 2 we show the normalized driving and response of the mid-gap flow velocity
 $u_{\unicode[STIX]{x1D703}}(\tilde{r}=0.5,t)$
for three different modulation periods. The radius is non-dimensionalized as
$u_{\unicode[STIX]{x1D703}}(\tilde{r}=0.5,t)$
for three different modulation periods. The radius is non-dimensionalized as
 $\tilde{r}=(r-r_{i})/d$
, so that
$\tilde{r}=(r-r_{i})/d$
, so that
 $\tilde{r}=0$
corresponds to the inner cylinder and
$\tilde{r}=0$
corresponds to the inner cylinder and
 $\tilde{r}=1$
to the outer one. We non-dimensionalize both velocities by their time-averaged value, so both lines meander around
$\tilde{r}=1$
to the outer one. We non-dimensionalize both velocities by their time-averaged value, so both lines meander around
 $1$
. For all oscillation periods, the mid-gap flow velocity oscillates with the same period
$1$
. For all oscillation periods, the mid-gap flow velocity oscillates with the same period
 $T$
as the driving. The amplitude and phase delay of the response depend on the driving period. For the larger modulation periods
$T$
as the driving. The amplitude and phase delay of the response depend on the driving period. For the larger modulation periods
 $T$
,
$T$
,
 $u_{\unicode[STIX]{x1D703}}$
responds nearly in phase with the same amplitude as the driving. For smaller modulation periods, the response amplitude decreases and a phase delay is observed, just as in prior studies (Cadot et al.
Reference Cadot, Titon and Bonn2003; von der Heydt et al.
Reference von der Heydt, Grossmann and Lohse2003a
,Reference von der Heydt, Grossmann and Lohse
b
; Kuczaj et al.
Reference Kuczaj, Geurts, Lohse and van de Water2008; Hamlington & Dahm Reference Hamlington and Dahm2009).
$u_{\unicode[STIX]{x1D703}}$
responds nearly in phase with the same amplitude as the driving. For smaller modulation periods, the response amplitude decreases and a phase delay is observed, just as in prior studies (Cadot et al.
Reference Cadot, Titon and Bonn2003; von der Heydt et al.
Reference von der Heydt, Grossmann and Lohse2003a
,Reference von der Heydt, Grossmann and Lohse
b
; Kuczaj et al.
Reference Kuczaj, Geurts, Lohse and van de Water2008; Hamlington & Dahm Reference Hamlington and Dahm2009).

Figure 4. Azimuthal velocity profiles as a function of dimensionless radius
 $\tilde{r}$
. All data are phase-averaged and normalized. (a–c) Here
$\tilde{r}$
. All data are phase-averaged and normalized. (a–c) Here
 $u_{\unicode[STIX]{x1D703}}(\unicode[STIX]{x1D6F7})$
is normalized with the time-averaged inner cylinder velocity
$u_{\unicode[STIX]{x1D703}}(\unicode[STIX]{x1D6F7})$
is normalized with the time-averaged inner cylinder velocity
 $\langle u_{i}\rangle _{t}=6.3~\text{m}~\text{s}^{-1}$
, i.e. the same constant value for all lines. A collapse of all lines indicates that the response amplitude is small, as is observed for large
$\langle u_{i}\rangle _{t}=6.3~\text{m}~\text{s}^{-1}$
, i.e. the same constant value for all lines. A collapse of all lines indicates that the response amplitude is small, as is observed for large
 $Wo$
(see panel (a)). Furthermore, we show the response of laminar flow to the modulation, calculated numerically (see § 2). (d–f) Here
$Wo$
(see panel (a)). Furthermore, we show the response of laminar flow to the modulation, calculated numerically (see § 2). (d–f) Here
 $u_{\unicode[STIX]{x1D703}}(\unicode[STIX]{x1D6F7})$
is normalized by the instantaneous inner cylinder velocity at phase
$u_{\unicode[STIX]{x1D703}}(\unicode[STIX]{x1D6F7})$
is normalized by the instantaneous inner cylinder velocity at phase
 $\unicode[STIX]{x1D6F7}$
, i.e.
$\unicode[STIX]{x1D6F7}$
, i.e.
 $u_{i}(\unicode[STIX]{x1D6F7})$
(a value between
$u_{i}(\unicode[STIX]{x1D6F7})$
(a value between
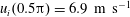 $u_{i}(0.5\unicode[STIX]{x03C0})=6.9~\text{m}~\text{s}^{-1}$
and
$u_{i}(0.5\unicode[STIX]{x03C0})=6.9~\text{m}~\text{s}^{-1}$
and
 $u_{i}(1.5\unicode[STIX]{x03C0})=5.7~\text{m}~\text{s}^{-1}$
). A collapse of all lines indicates that the behaviour of the system is quasi-stationary, as can be seen for small
$u_{i}(1.5\unicode[STIX]{x03C0})=5.7~\text{m}~\text{s}^{-1}$
). A collapse of all lines indicates that the behaviour of the system is quasi-stationary, as can be seen for small
 $Wo$
in panel (f). The solid grey lines show the azimuthal velocity profile for
$Wo$
in panel (f). The solid grey lines show the azimuthal velocity profile for
 $Re_{i}=5\times 10^{5}$
for the non-modulated, stationary case (data from Huisman et al. (Reference Huisman, Scharnowski, Cierpka, Kähler, Lohse and Sun2013b
)). (g) The azimuthal velocity
$Re_{i}=5\times 10^{5}$
for the non-modulated, stationary case (data from Huisman et al. (Reference Huisman, Scharnowski, Cierpka, Kähler, Lohse and Sun2013b
)). (g) The azimuthal velocity
 $u_{\unicode[STIX]{x1D703}}(\unicode[STIX]{x1D6F7})$
is shown for a series of phases of the modulation; here we show data for phases between
$u_{\unicode[STIX]{x1D703}}(\unicode[STIX]{x1D6F7})$
is shown for a series of phases of the modulation; here we show data for phases between
 $0.5\unicode[STIX]{x03C0}\leqslant \unicode[STIX]{x1D6F7}\leqslant 1.5\unicode[STIX]{x03C0}$
, i.e. half of a modulation cycle, as shown in this inset. See also figure 2 for the definition of phase
$0.5\unicode[STIX]{x03C0}\leqslant \unicode[STIX]{x1D6F7}\leqslant 1.5\unicode[STIX]{x03C0}$
, i.e. half of a modulation cycle, as shown in this inset. See also figure 2 for the definition of phase
 $\unicode[STIX]{x1D6F7}$
.
$\unicode[STIX]{x1D6F7}$
.
A different representation of a modulation cycle is depicted in figure 3. Here we plot the data from figure 2 parametrically as a function of
 $\unicode[STIX]{x1D6F7}$
. A fully quasi-stationary cycle completely follows the grey line, in which
$\unicode[STIX]{x1D6F7}$
. A fully quasi-stationary cycle completely follows the grey line, in which
 $u_{\unicode[STIX]{x1D703}}/\langle u_{\unicode[STIX]{x1D703}}\rangle _{t}=u_{i}/\langle u_{i}\rangle _{t}$
. The
$u_{\unicode[STIX]{x1D703}}/\langle u_{\unicode[STIX]{x1D703}}\rangle _{t}=u_{i}/\langle u_{i}\rangle _{t}$
. The
 $Wo=15$
measurement is close to this line. The deviation from this line, which indicates a phase delay, increases for smaller modulation periods.
$Wo=15$
measurement is close to this line. The deviation from this line, which indicates a phase delay, increases for smaller modulation periods.
To study whether the flow responds similarly over the gap width, we extend the analysis from figure 2 to the entire radius (see figure 4). In figure 4(a–c), the data are normalized by
 $\langle u_{i}\rangle _{t}=2\unicode[STIX]{x03C0}\langle f_{i}\rangle _{t}r_{i}=6.3~\text{m}~\text{s}^{-1}$
, i.e. the same constant for all measurements. The better all lines collapse, the smaller the response amplitude is. For the bottom row, we chose to normalize with
$\langle u_{i}\rangle _{t}=2\unicode[STIX]{x03C0}\langle f_{i}\rangle _{t}r_{i}=6.3~\text{m}~\text{s}^{-1}$
, i.e. the same constant for all measurements. The better all lines collapse, the smaller the response amplitude is. For the bottom row, we chose to normalize with
 $u_{i}(\unicode[STIX]{x1D6F7})=2\unicode[STIX]{x03C0}r_{i}\langle f_{i}\rangle _{t}[1+e\sin (\unicode[STIX]{x1D6F7})]$
, i.e. the inner cylinder velocity at the corresponding phase in the modulation. Here, when all lines collapse, the modulation is slow enough for the flow to react to the modulation, i.e. the system is in a quasi-stationary state. For comparison, the azimuthal velocity profile for the non-modulated case is shown as a grey line (Huisman et al.
Reference Huisman, Scharnowski, Cierpka, Kähler, Lohse and Sun2013b
). Figures 4(a) and 4(f) depict the most extreme cases. Furthermore, we show the laminar flow response in the top row. In figure 4(a), the azimuthal velocity of the flow is almost constant over a modulation cycle, and therefore
$u_{i}(\unicode[STIX]{x1D6F7})=2\unicode[STIX]{x03C0}r_{i}\langle f_{i}\rangle _{t}[1+e\sin (\unicode[STIX]{x1D6F7})]$
, i.e. the inner cylinder velocity at the corresponding phase in the modulation. Here, when all lines collapse, the modulation is slow enough for the flow to react to the modulation, i.e. the system is in a quasi-stationary state. For comparison, the azimuthal velocity profile for the non-modulated case is shown as a grey line (Huisman et al.
Reference Huisman, Scharnowski, Cierpka, Kähler, Lohse and Sun2013b
). Figures 4(a) and 4(f) depict the most extreme cases. Furthermore, we show the laminar flow response in the top row. In figure 4(a), the azimuthal velocity of the flow is almost constant over a modulation cycle, and therefore
 $u_{\unicode[STIX]{x1D703}}(r,\unicode[STIX]{x1D6F7})$
is close to the non-modulated statistically stationary solution for
$u_{\unicode[STIX]{x1D703}}(r,\unicode[STIX]{x1D6F7})$
is close to the non-modulated statistically stationary solution for
 $f_{i}=5$
Hz; the flow cannot adapt to the quick changes of the inner cylinder. For larger Womersley numbers, the opposite is the case (see figure 4
f). Here, for every phase
$f_{i}=5$
Hz; the flow cannot adapt to the quick changes of the inner cylinder. For larger Womersley numbers, the opposite is the case (see figure 4
f). Here, for every phase
 $\unicode[STIX]{x1D6F7}$
, the azimuthal velocity profile is identical to the statistically stationary solution for
$\unicode[STIX]{x1D6F7}$
, the azimuthal velocity profile is identical to the statistically stationary solution for
 $f_{i}(\unicode[STIX]{x1D6F7})$
. This behaviour is surprisingly constant over the entire radius. We note that it might appear as if the correct boundary conditions are not met. However, as shown in Huisman et al. (Reference Huisman, Scharnowski, Cierpka, Kähler, Lohse and Sun2013b
), the boundary layer at the studied Reynolds number is too thin to resolve from the current measurements.
$f_{i}(\unicode[STIX]{x1D6F7})$
. This behaviour is surprisingly constant over the entire radius. We note that it might appear as if the correct boundary conditions are not met. However, as shown in Huisman et al. (Reference Huisman, Scharnowski, Cierpka, Kähler, Lohse and Sun2013b
), the boundary layer at the studied Reynolds number is too thin to resolve from the current measurements.
The laminar flow response is completely different as compared to the measured turbulent case. First, the response in the flow is restricted to a thin layer close to the inner cylinder wall. Calculating the thickness of the Stokes boundary layer, although slightly off due to the presence of the outer cylinder and a cylindrical coordinate system, gives a similar result, i.e.
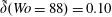 $\tilde{\unicode[STIX]{x1D6FF}}(Wo=88)=0.10$
,
$\tilde{\unicode[STIX]{x1D6FF}}(Wo=88)=0.10$
,
 $\tilde{\unicode[STIX]{x1D6FF}}(Wo=36)=0.24$
and
$\tilde{\unicode[STIX]{x1D6FF}}(Wo=36)=0.24$
and
 $\tilde{\unicode[STIX]{x1D6FF}}(Wo=15)=0.60$
(see table 1). Second, the response is radius-dependent, as is also known from Stokes oscillating plate theory, as the response decays exponentially with increasing distance from the oscillating wall. These observations highlight how turbulent mixing enhances the transport of the modulation over the entire radius.
$\tilde{\unicode[STIX]{x1D6FF}}(Wo=15)=0.60$
(see table 1). Second, the response is radius-dependent, as is also known from Stokes oscillating plate theory, as the response decays exponentially with increasing distance from the oscillating wall. These observations highlight how turbulent mixing enhances the transport of the modulation over the entire radius.

Figure 5. The delay between the driving modulation and the fluid velocity response as a function of Womersley number
 $Wo$
. The delay
$Wo$
. The delay
 $\unicode[STIX]{x1D6F7}_{delay}$
is normalized with
$\unicode[STIX]{x1D6F7}_{delay}$
is normalized with
 $2\unicode[STIX]{x03C0}$
of the modulation. The phase delay is calculated for a number of radii, not showing much difference. The same data are shown in linear scale (a) and logarithmic scale (b). The results are radially binned within
$2\unicode[STIX]{x03C0}$
of the modulation. The phase delay is calculated for a number of radii, not showing much difference. The same data are shown in linear scale (a) and logarithmic scale (b). The results are radially binned within
 $\tilde{r}\pm 0.025$
. The inset in (a) shows how the phase delay
$\tilde{r}\pm 0.025$
. The inset in (a) shows how the phase delay
 $\unicode[STIX]{x1D6F7}_{delay}$
is defined:
$\unicode[STIX]{x1D6F7}_{delay}$
is defined:
 $\unicode[STIX]{x1D6F7}_{delay}$
is calculated by cross-correlating both signals. We included the scaling of the response for laminar flow, which equals
$\unicode[STIX]{x1D6F7}_{delay}$
is calculated by cross-correlating both signals. We included the scaling of the response for laminar flow, which equals
 $\unicode[STIX]{x1D6F7}_{delay}\propto Wo$
.
$\unicode[STIX]{x1D6F7}_{delay}\propto Wo$
.
3.2 Phase delay
Up to now the conclusions drawn from figures 2–4 were only qualitative. Here, we quantify the phase shift and amplitude response for the turbulent case. We extract the phase delay
 $\unicode[STIX]{x1D6F7}_{delay}$
between the modulation and the response by cross-correlating
$\unicode[STIX]{x1D6F7}_{delay}$
between the modulation and the response by cross-correlating
 $u_{i}(t)$
and
$u_{i}(t)$
and
 $u_{\unicode[STIX]{x1D703}}(t)$
. We detect the first peak in
$u_{\unicode[STIX]{x1D703}}(t)$
. We detect the first peak in
 $u_{i}\star u_{\unicode[STIX]{x1D703}}(\unicode[STIX]{x1D70F})$
, and obtain the phase delay by fitting a Gaussian function through this peak and its two neighbouring points, to obtain the peak with increased accuracy. As visible in figure 5, at large modulation periods, the phase delay is small, as we already qualitatively concluded from figure 2. As the Womersley number increases, the bulk flow cannot follow the changing boundary conditions any more and it responds with an increasing delay. Within this approximation, von der Heydt et al. (Reference von der Heydt, Grossmann and Lohse2003a
) calculated, and Cadot et al. (Reference Cadot, Titon and Bonn2003) experimentally found, that the phase delay has a linear dependence on the modulation frequency, i.e.
$u_{i}\star u_{\unicode[STIX]{x1D703}}(\unicode[STIX]{x1D70F})$
, and obtain the phase delay by fitting a Gaussian function through this peak and its two neighbouring points, to obtain the peak with increased accuracy. As visible in figure 5, at large modulation periods, the phase delay is small, as we already qualitatively concluded from figure 2. As the Womersley number increases, the bulk flow cannot follow the changing boundary conditions any more and it responds with an increasing delay. Within this approximation, von der Heydt et al. (Reference von der Heydt, Grossmann and Lohse2003a
) calculated, and Cadot et al. (Reference Cadot, Titon and Bonn2003) experimentally found, that the phase delay has a linear dependence on the modulation frequency, i.e.
 $\unicode[STIX]{x1D6F7}_{delay}\propto Wo^{2}$
. We do not observe a similar behaviour, however. The results in the aforementioned studies, which both study homogeneous and isotropic turbulence (HIT), are significantly different from what we observe in our TC set-up, which cannot be regarded as HIT (Huisman, Lohse & Sun Reference Huisman, Lohse and Sun2013a
).
$\unicode[STIX]{x1D6F7}_{delay}\propto Wo^{2}$
. We do not observe a similar behaviour, however. The results in the aforementioned studies, which both study homogeneous and isotropic turbulence (HIT), are significantly different from what we observe in our TC set-up, which cannot be regarded as HIT (Huisman, Lohse & Sun Reference Huisman, Lohse and Sun2013a
).
As visible in figure 5(b), in this work the dependence of
 $\unicode[STIX]{x1D6F7}_{delay}$
is better described by an effective power law over a range of larger values of
$\unicode[STIX]{x1D6F7}_{delay}$
is better described by an effective power law over a range of larger values of
 $Wo$
, with
$Wo$
, with
 $\unicode[STIX]{x1D6F7}_{delay}\propto Wo^{1.1}$
. For the laminar case, the phase lag in the Stokes boundary layer problem is calculated as
$\unicode[STIX]{x1D6F7}_{delay}\propto Wo^{1.1}$
. For the laminar case, the phase lag in the Stokes boundary layer problem is calculated as
 $\unicode[STIX]{x1D6F7}_{delay}=\sqrt{2}\tilde{r}Wo$
. The exponent
$\unicode[STIX]{x1D6F7}_{delay}=\sqrt{2}\tilde{r}Wo$
. The exponent
 $1.1$
is close to the value of the laminar flow response, in which there is a linear dependence between the Womersley number and the phase delay. The phase lag saturates at around
$1.1$
is close to the value of the laminar flow response, in which there is a linear dependence between the Womersley number and the phase delay. The phase lag saturates at around
 $\unicode[STIX]{x1D6F7}_{delay}=\unicode[STIX]{x03C0}/2$
, similar to what is known in pulsating pipe flow (Womersley Reference Womersley1955; Shemer et al.
Reference Shemer, Wygnanski and Kit1985) and in periodically forced harmonic oscillators, for example.
$\unicode[STIX]{x1D6F7}_{delay}=\unicode[STIX]{x03C0}/2$
, similar to what is known in pulsating pipe flow (Womersley Reference Womersley1955; Shemer et al.
Reference Shemer, Wygnanski and Kit1985) and in periodically forced harmonic oscillators, for example.
We now come to the spatial dependence of the response. Intuitively, one expects an increasing phase delay further away from the modulated wall. Surprisingly, this is not the case. Apparently, the turbulent mixing of this highly turbulent flow prevents the system from having a range of phase delays over the radius, given the fact that the modulation has been ‘passed on’ from the boundary layer to the bulk flow. This can be explained by calculating a characteristic time scale
 $\unicode[STIX]{x1D70F}_{bulk}$
for the movement from the inner to the outer cylinder, using the Reynolds wind number
$\unicode[STIX]{x1D70F}_{bulk}$
for the movement from the inner to the outer cylinder, using the Reynolds wind number
 $Re_{w}=\unicode[STIX]{x1D70E}(u_{r})d/\unicode[STIX]{x1D708}$
, in which
$Re_{w}=\unicode[STIX]{x1D70E}(u_{r})d/\unicode[STIX]{x1D708}$
, in which
 $\unicode[STIX]{x1D70E}(u_{r})$
is the standard deviation of the radial velocity. We estimate
$\unicode[STIX]{x1D70E}(u_{r})$
is the standard deviation of the radial velocity. We estimate
 $\unicode[STIX]{x1D70F}_{bulk}=d/\unicode[STIX]{x1D70E}(u_{r})=d^{2}/Re_{w}\unicode[STIX]{x1D708}$
. For the corresponding
$\unicode[STIX]{x1D70F}_{bulk}=d/\unicode[STIX]{x1D70E}(u_{r})=d^{2}/Re_{w}\unicode[STIX]{x1D708}$
. For the corresponding
 $\langle Re_{i}\rangle _{t}=5\times 10^{5}$
, the
$\langle Re_{i}\rangle _{t}=5\times 10^{5}$
, the
 $Re_{w}$
value is known from Huisman et al. (Reference Huisman, van Gils, Grossmann, Sun and Lohse2012), resulting in a
$Re_{w}$
value is known from Huisman et al. (Reference Huisman, van Gils, Grossmann, Sun and Lohse2012), resulting in a
 $\unicode[STIX]{x1D70F}_{bulk}=0.27$
s. As long as
$\unicode[STIX]{x1D70F}_{bulk}=0.27$
s. As long as
 $\unicode[STIX]{x1D70F}_{bulk}\ll T$
, the radial dependence of the phase delay and amplitude should be negligible, in agreement with our observations. Such small periods
$\unicode[STIX]{x1D70F}_{bulk}\ll T$
, the radial dependence of the phase delay and amplitude should be negligible, in agreement with our observations. Such small periods
 $T$
are unfortunately not accessible experimentally due to the moment of inertia of the cylinders.
$T$
are unfortunately not accessible experimentally due to the moment of inertia of the cylinders.
3.3 Amplitude response
We calculate the amplitude
 $A$
of the response for both the velocity and kinetic energy, which is defined as
$A$
of the response for both the velocity and kinetic energy, which is defined as
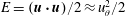 $E=(\boldsymbol{u}\boldsymbol{\cdot }\boldsymbol{u})/2\approx u_{\unicode[STIX]{x1D703}}^{2}/2$
. Following the approach of von der Heydt et al. (Reference von der Heydt, Grossmann and Lohse2003a
), the local oscillating responses of the velocity and energy are calculated as
$E=(\boldsymbol{u}\boldsymbol{\cdot }\boldsymbol{u})/2\approx u_{\unicode[STIX]{x1D703}}^{2}/2$
. Following the approach of von der Heydt et al. (Reference von der Heydt, Grossmann and Lohse2003a
), the local oscillating responses of the velocity and energy are calculated as
 $$\begin{eqnarray}\unicode[STIX]{x1D6E5}_{u}(t)=\frac{u_{\unicode[STIX]{x1D703}}(t)}{\langle u_{\unicode[STIX]{x1D703}}\rangle _{t}}-1\quad \text{and}\quad \unicode[STIX]{x1D6E5}_{E}(t)=\frac{E(t)}{\langle E\rangle _{t}}-1.\end{eqnarray}$$
We average
 $\unicode[STIX]{x1D6E5}_{u}(t)$
and
$\unicode[STIX]{x1D6E5}_{u}(t)$
and
 $\unicode[STIX]{x1D6E5}_{E}(t)$
radially and azimuthally, and make the ansatz that
$\unicode[STIX]{x1D6E5}_{E}(t)$
radially and azimuthally, and make the ansatz that
 $\unicode[STIX]{x1D6E5}_{u,E}(t)$
can be described as
$\unicode[STIX]{x1D6E5}_{u,E}(t)$
can be described as
 $$\begin{eqnarray}\unicode[STIX]{x1D6E5}_{fit}(t)=eA(T)\sin (2\unicode[STIX]{x03C0}t/T+\unicode[STIX]{x1D6F7}_{delay}).\end{eqnarray}$$
Then
 $\unicode[STIX]{x1D6E5}_{fit}(t)$
is fitted to
$\unicode[STIX]{x1D6E5}_{fit}(t)$
is fitted to
 $\unicode[STIX]{x0394}(t)$
with
$\unicode[STIX]{x0394}(t)$
with
 $A(T)$
as sole fitting parameter;
$A(T)$
as sole fitting parameter;
 $\unicode[STIX]{x1D6F7}_{delay}$
is not a fitting parameter, as it is calculated using cross-correlation (see figure 5). In the case of slow, quasi-stationary modulations, the amplitude response of the azimuthal velocity can be calculated from (3.1), namely
$\unicode[STIX]{x1D6F7}_{delay}$
is not a fitting parameter, as it is calculated using cross-correlation (see figure 5). In the case of slow, quasi-stationary modulations, the amplitude response of the azimuthal velocity can be calculated from (3.1), namely
 $A_{u}=((1+e)/1-1)/e=1$
. Strictly speaking it is impossible to describe the kinetic energy with a sinusoidal function, as it has a squared dependence on the velocity, but, as
$A_{u}=((1+e)/1-1)/e=1$
. Strictly speaking it is impossible to describe the kinetic energy with a sinusoidal function, as it has a squared dependence on the velocity, but, as
 $e$
is small, a sine wave can be used within the assumption of a linear response. However, the calculation of
$e$
is small, a sine wave can be used within the assumption of a linear response. However, the calculation of
 $A_{E}$
in the quasi-stationary case is less straightforward, as the response amplitude varies over the sine wave. We calculate
$A_{E}$
in the quasi-stationary case is less straightforward, as the response amplitude varies over the sine wave. We calculate
 $A_{E}^{max}=((1+e)^{2}-1)/e=2.1$
and
$A_{E}^{max}=((1+e)^{2}-1)/e=2.1$
and
 $A_{E}^{min}=((1-e)^{2}-1)/(-e)=1.9$
as the two extremes, leading to a phase-averaged value of
$A_{E}^{min}=((1-e)^{2}-1)/(-e)=1.9$
as the two extremes, leading to a phase-averaged value of
 $A_{E}=2.0$
. Both response amplitudes will vanish in the limit of infinitely fast modulations, i.e.
$A_{E}=2.0$
. Both response amplitudes will vanish in the limit of infinitely fast modulations, i.e.
 $Wo\rightarrow \infty$
implies that
$Wo\rightarrow \infty$
implies that
 $A_{u,E}\rightarrow 0$
.
$A_{u,E}\rightarrow 0$
.
As figure 6 clearly shows, the fluid completely follows the imposed modulation at larger modulation periods, i.e. amplitude responses of
 $A_{u}=1$
and
$A_{u}=1$
and
 $A_{E}=2$
are observed, which corresponds to our expectations. For smaller modulation periods, the response amplitude decreases. We do not observe clean power laws, as predicted assuming HIT by von der Heydt et al. (Reference von der Heydt, Grossmann and Lohse2003a
) and Cadot et al. (Reference Cadot, Titon and Bonn2003) shown as dashed lines. The response of the flow can better be described by an exponential function, as indicated by the solid black line. This is in line with the laminar flow response, in which the amplitude of the response also is an exponential function of the Womersley number and the distance to the modulated wall. Note that, in contrast to the turbulent case, the amplitude response of the laminar case depends on the radius.
$A_{E}=2$
are observed, which corresponds to our expectations. For smaller modulation periods, the response amplitude decreases. We do not observe clean power laws, as predicted assuming HIT by von der Heydt et al. (Reference von der Heydt, Grossmann and Lohse2003a
) and Cadot et al. (Reference Cadot, Titon and Bonn2003) shown as dashed lines. The response of the flow can better be described by an exponential function, as indicated by the solid black line. This is in line with the laminar flow response, in which the amplitude of the response also is an exponential function of the Womersley number and the distance to the modulated wall. Note that, in contrast to the turbulent case, the amplitude response of the laminar case depends on the radius.

Figure 6. Amplitude response as a function of the Womersley number
 $Wo$
for various dimensionless radii. The coloured lines represent our measurements, and the solid grey lines are numerically calculated laminar flow responses. (a) The response amplitude of the velocity
$Wo$
for various dimensionless radii. The coloured lines represent our measurements, and the solid grey lines are numerically calculated laminar flow responses. (a) The response amplitude of the velocity
 $A_{u}$
and (b) the response amplitude of the energy
$A_{u}$
and (b) the response amplitude of the energy
 $A_{E}$
. The experimental results are radially binned between
$A_{E}$
. The experimental results are radially binned between
 $\tilde{r}\pm 0.025$
. The dashed grey lines show the scalings of
$\tilde{r}\pm 0.025$
. The dashed grey lines show the scalings of
 $A$
as predicted by von der Heydt et al. (Reference von der Heydt, Grossmann and Lohse2003a
). We included the laminar responses, shown in solid grey lines. A number of radii are included, to highlight the dependence on the radius, which does not exist in the well-mixed turbulent case. The effective slope of the measurements
$A$
as predicted by von der Heydt et al. (Reference von der Heydt, Grossmann and Lohse2003a
). We included the laminar responses, shown in solid grey lines. A number of radii are included, to highlight the dependence on the radius, which does not exist in the well-mixed turbulent case. The effective slope of the measurements
 $A\propto \text{e}^{-0.025Wo}$
is shown in dashed black. This would correspond to the slope of the laminar flow response at
$A\propto \text{e}^{-0.025Wo}$
is shown in dashed black. This would correspond to the slope of the laminar flow response at
 $\tilde{r}\approx 0.035$
.
$\tilde{r}\approx 0.035$
.
Similar to the phase delay between modulation and response, also in the response amplitude we do not observe any trend over the radius. Here, one could expect a decreasing
 $A$
at higher radii, i.e. further away from the modulated wall. Because of the no-slip condition at the wall, the values of
$A$
at higher radii, i.e. further away from the modulated wall. Because of the no-slip condition at the wall, the values of
 $A$
and
$A$
and
 $\unicode[STIX]{x1D6F7}_{delay}$
directly at the wall are fixed, i.e.
$\unicode[STIX]{x1D6F7}_{delay}$
directly at the wall are fixed, i.e.
 $A_{u}(r_{i})=1$
and
$A_{u}(r_{i})=1$
and
 $\unicode[STIX]{x1D6F7}_{delay}(r_{i})=0$
. At the outer cylinder,
$\unicode[STIX]{x1D6F7}_{delay}(r_{i})=0$
. At the outer cylinder,
 $A_{u}(r_{o})=0$
, hence
$A_{u}(r_{o})=0$
, hence
 $\unicode[STIX]{x1D6F7}_{delay}(r_{o})$
cannot be defined. Clearly, the boundary layers play a pivotal role in transferring perturbations and modulations to the bulk of the flow.
$\unicode[STIX]{x1D6F7}_{delay}(r_{o})$
cannot be defined. Clearly, the boundary layers play a pivotal role in transferring perturbations and modulations to the bulk of the flow.
4 Summary and conclusions
To conclude, we studied periodically driven Taylor–Couette turbulence. We drove the inner cylinder sinusoidally, and measured the local velocity using particle image velocimetry. Consistent with earlier studies and theoretical expectations, we observe a phase delay and declining velocity response as we increase the Womersley number. Most surprisingly, we did not observe a radial dependence of the phase delay in the bulk of the flow, nor of the amplitude response, in contrast to the expectation one might have that there could be a larger influence of the modulation on the flow close to the modulated wall. Apparently, a radial dependence of
 $A$
and
$A$
and
 $\unicode[STIX]{x1D6F7}_{delay}$
is prevented by the strong mixing in this turbulent flow. Even though we did not measure directly in the boundary layers, their vital importance in transferring modulations to the bulk flow is evident. This contrasts with our numerical results for laminar flow, where a strong radial dependence is observed, and the response of the flow is confined to a thin layer close to the modulated wall. Therefore, it is even more remarkable that the scaling relations of both the phase delay and the amplitude response are similar to what had been found for laminar flows.
$\unicode[STIX]{x1D6F7}_{delay}$
is prevented by the strong mixing in this turbulent flow. Even though we did not measure directly in the boundary layers, their vital importance in transferring modulations to the bulk flow is evident. This contrasts with our numerical results for laminar flow, where a strong radial dependence is observed, and the response of the flow is confined to a thin layer close to the modulated wall. Therefore, it is even more remarkable that the scaling relations of both the phase delay and the amplitude response are similar to what had been found for laminar flows.
To further study this interesting phenomenon, direct numerical simulations are necessary to cover the range of extremely high Womersley number, which is inaccessible in experiments. Using such data, it will be possible to study the interplay between the modulated cylinder, the boundary layers and the bulk in more detail, as the entire flow field will then be available. Another domain of terra incognita is the study of modulations with larger amplitude. Here, we limited ourselves to a modulation amplitude of
 $e=0.1$
. Larger values induce nonlinear effects, and linear-response-type assumptions such as those made in (3.1) and (3.2) will then no longer be valid.
$e=0.1$
. Larger values induce nonlinear effects, and linear-response-type assumptions such as those made in (3.1) and (3.2) will then no longer be valid.
Acknowledgements
We would like to thank G.-W. Bruggert and M. Bos for their continual technical support over the years. We thank P. Bullee, D. Bakhuis, P. Berghout and R. Ezeta for various stimulating discussions. This work was financially supported by the NWO-TTW, NWO-I, an ERC grant, and the Natural Science Foundation of China under grant no. 11672156.


 Open access