


Introduction
Weed management was notably changed with the introduction of glyphosate-resistant (GR) crops to the United States (Corbett et al. Reference Corbett, Askew, Thomas and Wilcut2004; Burke et al. Reference Burke, Troxle, Askew, Wilcut and Smith2005; Culpepper Reference Culpepper2006; Norsworthy et al. Reference Norsworthy, Ward, Shaw, Llewellyn, Nichols, Webster, Bradley, Frisvold, Powles, Burgos, Witt and Barrett2012). Reliance on glyphosate caused a shift in the weed spectrum through extreme selection pressure, and GR biotypes of key weed species have become common (VanGessel Reference VanGessel2001; Culpepper Reference Culpepper2006; Steckel Reference Steckel2007; Norsworthy et al. Reference Norsworthy, Ward, Shaw, Llewellyn, Nichols, Webster, Bradley, Frisvold, Powles, Burgos, Witt and Barrett2012). These pests are not only the most common but are also the most troublesome weed species in the United States (Van Wychen Reference Van Wychen2016). A recent response to this biological resistance was the introduction of dicamba-resistant crops (Bish and Bradley Reference Bish and Bradley2017; Werle et al. Reference Werle, Oliverira, Jhala, Procotor, Rees and Klein2018) that allow for the POST application of dicamba on soybean [Glycine max (L.) Merr.] and cotton (Gossypium hirsutum L.). New formulations of dicamba (3,6 dichloro-2-methoxybenzoic acid) have been registered for use in these dicamba-resistant crops. Monsanto introduced a diglycolamine (DGA) salt of dicamba that includes an acetic acid/acetate pH modifier, referred to in this manuscript as DGA+VG (Hemminghaus et al. Reference Hemminghaus, MacInnes and Zhang2017; MacInnes Reference MacInnes2017). BASF also introduced N,N-Bis-(3-aminopropyl) methylamine salt for use in dicamba-resistant crops (Werle et al. Reference Werle, Oliverira, Jhala, Procotor, Rees and Klein2018).
Dicamba injury to sensitive non-target broadleaf vegetation has been extensively reported in recent years (Bish and Bradley Reference Bish and Bradley2017; Hager Reference Hager2017). The reports from these off-target dicamba injury cases have been attributed to a number of elements. Some of the possible factors are the use of nonlabeled nozzles that produce small droplets that stay suspended for several minutes after application, spraying into temperature inversions where small- or medium-sized droplets may remain suspended in cooler air near the surface of the earth, or the possibility that spray droplets deposited on soil in the target field but later moved via wind or water while on the soil (Anonymous 2018a, 2018b). These reports of off-target dicamba injury to broadleaf plants could also be due to volatility (Bish and Bradley Reference Bish and Bradley2017; Hager Reference Hager2017).
Numerous researchers have reported volatility of different dicamba salts (Behrens and Lueschen Reference Behrens and Lueschen1979; Busey et al. Reference Busey, Broschat and Johnston2003; Sciumbato et al. Reference Sciumbato, Chandler, Senseman, Bovey and Smith2004; Strachan et al. Reference Strachan, Casini, Heldreth, Scocas, Nissen, Bukun, Lindenmayer, Shaner, Westra and Brunk2010; Johnson et al. Reference Johnson, Fisher, Jordan, Edmisten, Stewart and York2012; Penner and Michael Reference Penner, Michael and Sesa2014; Bish and Bradley Reference Bish and Bradley2017; Egan and Mortensen Reference Egan and Mortensen2012). The seminal paper on dicamba volatility was written by Behrens and Lueschen (Reference Behrens and Lueschen1979), who reported that “soybean drift injury from dicamba has been attributed to spray particle drift rather than vapor drift because the commercial dimethylamine (DMA) salt formulation of dicamba is considered to be low in volatility.” This statement is similar to those of some agrochemical company representatives in recent years about the newer formulations of dicamba. MacInnes (Reference MacInnes2017) reported that volatility is usually a small contributor to potential off-target movement of the DGA salt of dicamba. Moreover, he reported that the VaporGrip® technology (DGA+VG) reduces the volatility potential of the DGA salt of dicamba even further and that spray drift and tank contamination are the main contributors to potential off-target damage. Behrens and Lueschen (Reference Behrens and Lueschen1979) also stressed the importance of air temperature and the sprayed surface affecting dicamba and relied mainly on a bioassay of soybean. This soybean bioassay was recently used by others to measure dicamba movement under field conditions. Egan and Mortensen (Reference Egan and Mortensen2012) reported that the DGA formulation substantially reduced dicamba vapor drift in comparison with the DMA formulation and that temperature was positively correlated with DMA dicamba vapor drift. Others have also employed plant bioassays as indicators of dicamba activity (Egan and Mortensen Reference Egan and Mortensen2012; Penner and Michael Reference Penner, Michael and Sesa2014; Sciumbato et al. Reference Sciumbato, Chandler, Senseman, Bovey and Smith2004). Although the sensitivity of these bioassays is adequate, a quantitative assessment via air sampling followed by chemical extraction and analysis may yield more direct indications of herbicide behavior (Mueller et al. Reference Mueller, Wright and Remund2013; Mueller Reference Mueller2015; Ouse et al. Reference Ouse, Gifford, Schleier, Simpson, Tank, Jennings, Annangudi, Valverde-Garcia and Masters2018). This research aimed to examine the effect of temperature, dicamba formulation, and glyphosate addition on dicamba concentrations. In this report, the authors use the term concentration to refer to relative amounts of dicamba measured in the air volume and or in the chemical extracts.
The humidome research in this report was conducted at different dates during autumn, thus at different ambient temperatures to examine the effect of temperature on dicamba behavior. Additionally, studies were conducted to elucidate any effect pH changes in the spray solution might have on dicamba concentrations. Preliminary reports show that dicamba volatility could be reduced by increasing spray pH, thus favoring the dicamba salt moiety (Hemminghaus et al. Reference Hemminghaus, MacInnes and Zhang2017; MacInnes Reference MacInnes2017). Our hypothesis was that dicamba volatility would be greater at higher temperatures and also at lower spray solution pH, perhaps as a result of the addition of glyphosate.
Materials and Methods
This research was conducted in the fall of 2017 and used methods from previous research by Mueller et al. (Reference Mueller, Wright and Remund2013) and Gavlick et al. (Reference Gavlick, Wright, MacInnes, Hemminghaus, Webb, Yermolenka, Su and Goss2016). Expendable supplies included plastic trays to hold the sprayed material, clear plastic vented humidity domes, soil, and the aforementioned sampling media. Plastic trays 28 by 54 by 6 cm in depth (https://www.greenhousemegastore.com) were individually covered by an 18-cm-tall vented humidity dome that was specifically sized to be attached directly to these trays. To facilitate sample collection, a 10-cm-diam hole was cut using a hole saw into the vented dome, and two small holes (2 cm diam) were also cut to allow for air entrance on the opposite side of the vented dome. A Sequatchie loam soil that had no previous herbicide use was utilized (34% sand, 48% silt, 18% clay, 1.3% organic matter, pH 6.2, and cation exchange capacity 11 mEq g−1).
This research utilized air samplers previously demonstrated to be effective in collecting dicamba from the atmosphere (Mueller et al. Reference Mueller, Wright and Remund2013). The air sampler and associated sample collection hardware are available from Hi-Q Environmental Products Co. (San Diego, CA, USA; https://www.hi-q.net/). Key components of the air samplers included the air sampler main unit equipped with digital readouts for both cumulative air flow and time interval sampling, a microfiber filter paper holder, and a PolyUrethane Filter (PUF) sampling module (Hi-Q products, San Diego, CA). The sampling media used was a 10-cm-diam HEPA-type high-purity binderless 99.99% efficiency borosilicate glass fiber filter paper and an 8-cm-long polyurethane vapor collection substrate. Additional parts included glass cartridges with stainless-steel screens for the PUF head sampler and the associated single Teflon end caps with silicone O-rings.
The herbicide mixtures were applied to screened (2 mm size), air-dried soil with each tray filled half-full. The same volume and weight of soil (~4 kg) was used in each tray. Soil and trays were used a single time and then discarded. The same air flow (55 L min−1) was used through all experiments. The humidomes were located in the same area for all experiments. All herbicide applications were made using commercially available formulations (Table 1). There were three DGA herbicide treatments: the DGA formulation of dicamba plus glyphosate (DGA+Gly) and the DGA formulation including pH modifier (VaporGrip®) with or without glyphosate (Table 1). The dicamba salt in DGA and DGA+VG is identical (Anonymous 2018b). To examine the effect of adding glyphosate, the commercial formulation of Roundup PowerMax (a potassium salt of glyphosate) (Monsanto, St Louis, MO) was used. Figures and tables use the abbreviation “Gly” to denote these formulated glyphosate applications.
Descriptive and summary aspects of runs conducted to examine dicamba concentrations following application.
a DGA indicates that diglycolamine salt formulation of dicamba was used.
b Gly denotes glyphosate was applied as the formulated product, which in this test was a potassium salt containing additional surfactants.
c DGA+VG denotes the DGA formulation of dicamba with “VaporGrip®” added, which is acetic acid/acetate included as a pH modifier.
Herbicide applications were made at 0.5 kg ae ha−1 of dicamba. The dosage of glyphosate was 1.0 kg ae ha−1. No additional surfactants or adjuvants were added. Herbicide mixtures were prepared in 1.0-L bottles and applied using a spray volume of 190 L ha−1 using a flat-fan nozzle operated 50 cm above the target application site. Treatments were made with a CO2-pressurized backpack sprayer in this research. Spray solution pH was measured for each spray bottle (Table 1). Later research showed no effect of CO2 pressure on spray pH using this water source (data not shown). McCormick (Reference McCormick1990) showed that pressurizing water using CO2 decreased spray pH, but our results conflict with this observation, perhaps because the commercial formulations used in this research provided different pH modifiers or because a different water source was used.
To validate herbicide doses applied to each tray, a 12.5-cm diam qualitative filter paper was placed in the front of each tray prior to herbicide application. The herbicides were applied as previously described. After application, the filter paper was removed and placed into a 250-ml LDPE Nalgene bottle and stored at –20 C until chemical analysis. The herbicides were applied to the trays outside of the greenhouse and away from where the air samplers were to be operated. The humidomes were inside the greenhouse, which has no cooling pads or intake fans. This physical separation avoids the confounding factors of potential aerosol droplets possibly being pulled into the air samplers at a later time. Herbicide applications were made at approximately 0700 on the day of application (Table 1). The trays were in a double-stack tray configuration, with two identical trays nested one inside the other. The top tray contained the dry soil, and the lower tray rested directly on the concrete surface outside the greenhouse. After spraying, only the top tray was transported into the greenhouse, where the air samplers were connected to each unit. The bottom trays were discarded. Trays were left undisturbed for 10 min after herbicide application, after which they were placed on plastic greenhouse carts with minimum soil disturbance and moved into the greenhouse. The treated trays were brought into the greenhouse through a double-door system, and care was taken so as not to allow any spray drift particles to enter into the greenhouse. Preliminary research including nontreated control plants indicated that no dicamba spray particles were entering the greenhouse, and systematic efforts to eliminate spray droplets from the greenhouse were made. All dicamba concentrations in samples from nontreated soil plus trays were below the limit of detection (data not shown).
Where the filter paper had been on the treated surface, a temperature/relative humidity data logger was placed into each tray and was located directly under the sampling port (Figure 1). The temperature samplers (HOBO model PRO V2, Onset Company, Bourne, MA) were set to operate at 30-min intervals. These units were re-set prior to each experiment. Previous calibrations of the HOBO units showed acceptable accuracy and agreement among the samplers (±0.1% when tested at 20 C, 30 C, and 40 C).
Humidome setup for research showing soil in tray, HOBO temperature, and relative humidity sensor, sampling connections, and air sampler.
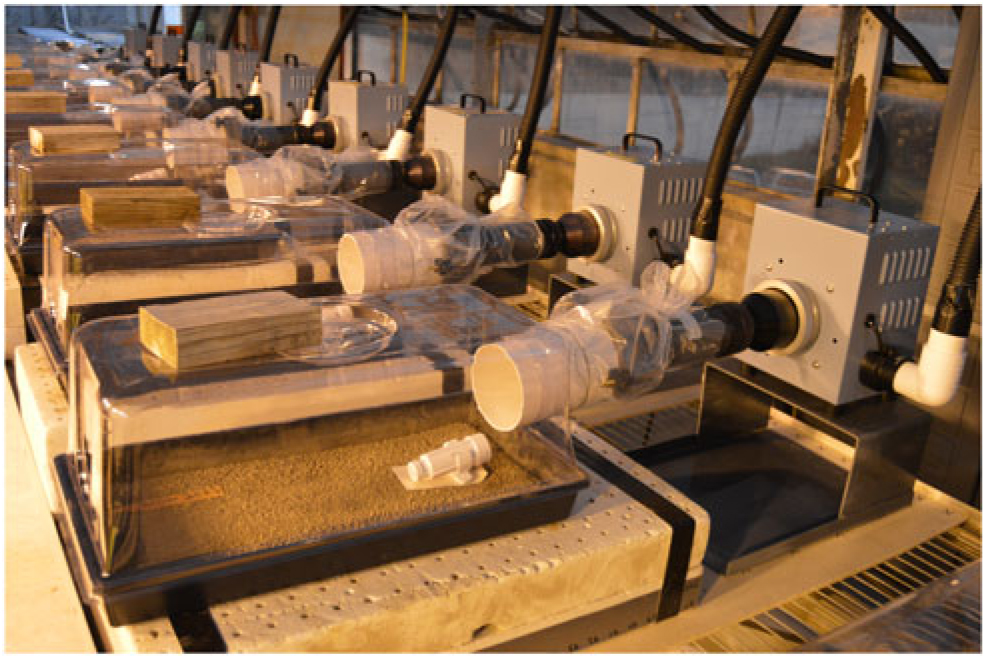
Each tray was covered with a clear plastic dome and attached to a single air-sampling unit (Figure 1). Air samplers were equipped with a microfiber filter paper in front of a PUF sampling medium as previously described. Each air-sampling unit was re-zeroed for cumulative flow and elapsed time. The samplers operated at 55 L min−1, the lowest flow rate that was stable given the electronic sensors that these samplers utilize. A concern was that this air flow would cause turbulence that could move soil particles. To verify that air speed was not excessive, air flows inside an assembled humidome were measured using an anemometer (Fisherbrand 06-662-73; https://www.traceable.com), which had a dynamic flow rate down to 0.05 m s−1. The highest flow rate was measured immediately in front of an inlet hole on the inlet side of the humidome, and a maximum air speed of 0.09 m s−1 was detected. This is less than the minimum speed of 1.34 m s−1 to make a labeled application under field conditions (Anonymous 2018b). Measurements inside the humidome were less than 0.05 m s−1 and indicated that turbulence sufficient to forcibly move soil particles into the air would not be expected. Also, if soil particles were swept aloft by excessive air flows, this same phenomenon would occur at night and in the daytime, yet the dicamba measurements showed a strong diurnal pattern, suggesting a different primary mechanism for dicamba movement.
Sampling intervals for all experiments were 12 h. The exact amount of time was recorded for each sampler and used to calculate the dicamba collected per unit of time. The samplers automatically measured the cumulative flow. Each air sampler was connected to the respective treated tray plus cover using a 10-cm-diam PVC plastic pipe that was affixed to the sampling apparatus. A polyethylene plastic bag with one end cut off was placed on both ends of the plastic pipe, and rubber bands or wire ties were used to seal this connection (Figure 1). Preliminary research showed minimum air leakage and adequate sample collection with these methods. Each sampler had an exhaust port attached to a flexible hose that was vented outside of the greenhouse. The elevation of the treated tray plus vent cover matched that of the sampling apparatus. As no dicamba was detected in the PUF sampling medium, dicamba was not expected to return into the greenhouse from the vent tubes.
There were eight runs of the test with two replications per run of each treatment in a randomized complete block design. The blocking was done on table location. All units were in a single greenhouse on a single set of long tables (Figure 1). The temperature in the greenhouse was not directly modulated. Thus, some temperatures were approximately 40 C, whereas other experiments were conducted at less than 20 C. This approach was used to more closely reflect field conditions in which dicamba would be applied.
These research methods generated three types of samples. First, samples were collected on 12.5-cm-diam qualitative filter papers to verify herbicide application. Second, microfiber filter papers as the primary sample collection medium were used in air samplers. Third, PUF samples were utilized for the secondary sample collection media. Sampling media were placed directly into a small container upon collection at respective intervals and stored in a –20 C freezer until later chemical analysis. As the research progressed, it was observed that all dicamba measurements were noted on the microfiber filter paper only, and the PUF sampling media did not contain any dicamba. To facilitate ease of sample collection, the PUF sampling media were only collected at the end of each experiment, stored at –20 C, and later extracted.
The microfiber filter papers were extracted with 40 ml of methanol for 1.5 h on a reciprocating shaker operated at 80 cycles min−1. Concentrations were corrected for dilution and recovery (80%, preliminary data). PUF sampling media were sectioned into four long, narrow sections using an 8-cm box cutter knife cleaned with methanol between individual samples. The four sections were placed into a single 1,000-ml bottle, and 400 ml of methanol were added and the bottle shaken as previously described. An aliquot of each extraction was passed through a 0.45-µm filter directly into a LC MS vial for later chemical analysis. The samples collected at the time of dicamba application were extracted by shaking in methanol for 1 h, filtration, and then analysis by LC using a diode array detector (Agilent model G1315B; Agilent Technologies, Santa Clara, CA; https://www.Agilent.com) operated at 230 nm.
Dicamba concentrations were determined using an external standard technique of analytical standards of dicamba acid (Chemservice, Westchester, PA; https://www.Chemservice.com) dissolved in methanol. An Agilent Liquid Chromatograph (1100 series) in line with an Agilent single-quad 6120 mass spectrometer (Agilent.com) was used for analysis. A Luna 3-µm particle size, 25 cm by 4.6 mm C-18 100 A column (Phenomenex, Torrance, CA; http://www.phenomenex.com) at 35 C was used to separate components of interest from the matrix. The mobile phase at 0.7 ml min−1 used a gradient program of acetonitrile and water, and both mobile-phase components were fortified with 0.1% formic acid. Initial conditions were 50% acetonitrile/50% water, followed by a linear gradient to 95% acetonitrile at 4 min, held constant at 95% acetonitrile for 9 min, and then returned to original conditions for equilibration prior to the next injection. The parameters for this MS system were drying-gas flow 12.0 L min−1, nebulizer pressure at 35 bar, drying-gas temperature at 250 C, vaporizer temperature at 200 C, capillary at 2,500 V, corona at 0 V, charging at 1,200 V, and single-ion monitoring at 219.0 from 4.0 to 7.0 min. The retention time of dicamba acid in the system was 5.0 min, with an apparent limit of detection of 0.1 ppb. Once samples were extracted, they were stored in a dark freezer at –20 C and were analyzed within 3 d. Inside the greenhouse, nontreated control sampling media were included to confirm a lack of dicamba contamination. Within each LC MS analytical sequence, numerous solvent blanks were included to verify that dicamba carryover from previous injections was not present.
Descriptive aspects and summary results of the experiments are given in Table 1. There were duplicate samplers at each measurement interval in all experiments. The observed dicamba values were sorted into five temperature ranks from 15 C to 30 C in increments of 5 C (<15 C; 15 to 19.9 C; 20 to 24.9 C; 25 to 30 C, >30 C). The three herbicide treatments were then examined within that temperature range to determine formulation treatment differences. Although there was variation within the 12-h time interval, an average value would provide some indication of the relationship to dicamba concentrations. Showing the minimum and maximum temperature was considered, and these data presentations were misleading. Each experiment was conducted such that the temperature inside a particular humidome was independent from others, but conditions were largely affected by the temperature inside the greenhouse and the amount of sunshine at that time. Temperatures at night tended to be more consistent, as there was less variability in temperature. Also, the temperatures inside the humidomes increased on sunny days but would not increase as much on cloudy days. Relative humidity was also examined, and no clear patterns were apparent in the analysis. This is not to say that humidity does not play a specific role in dicamba volatility, and this is an important area of future investigations. Future research efforts will explore how to relate the observed environmental observations to dicamba concentrations.
Data were analyzed using the GLMMIX procedure of SAS (ver. 9.4; SAS Institute; Cary, NC). Main effects and interactions were tested using the appropriate expected mean square values as recommended by McIntosh (Reference McIntosh1983). Each run was considered an environment sampled at random from a population of environments as suggested by Carmer et al. (Reference Carmer, Nyquist and Walker1989). Considering runs (environments) a random effect permits inferences about treatments to be made over a range of environments (Carmer et al. Reference Carmer, Nyquist and Walker1989; Blouin et al. Reference Blouin, Webster and Bond2011). With this model construction, all runs were pooled together as suggested by Carmer et al. (Reference Carmer, Nyquist and Walker1989). Environments and replication (nested within environments), and all interactions containing these effects, were declared random effects in the model. Herbicide treatments were considered fixed. Type III statistics were used to test the fixed effects, and least square means were separated using Fisher’s protected LSD at P = 0.05.
Data were sorted as described above by herbicide treatment, and the dicamba concentration was regressed against the observed mean temperature for that humidome and that sampling interval. Data were fit to a three-parameter logistical model (Equation 1) as suggested by Thornley and Johnson (Reference Thornley and Johnson1990). The three parameters were A, B, and X0 , where A is the estimate of asymptote or total dicamba detected, X0 is the inflection point or where the curve goes from increasing at an increasing rate to increasing at a decreasing rate, B is the estimate of the duration of change. Data regressions were accomplished using SigmaPlot 14 (SYSTAT Software; Chicago, IL).
 $${\rm{Y }}=A/\left( {1{\rm{ }} + {\rm{ exp }}\left[ {-\left( {{\rm{temp }}-{X_0}} \right)/B} \right]} \right)$$
([1])
$${\rm{Y }}=A/\left( {1{\rm{ }} + {\rm{ exp }}\left[ {-\left( {{\rm{temp }}-{X_0}} \right)/B} \right]} \right)$$
([1])
Results and Discussion
The observed temperature was warmer for the first two runs, with the average temperature being >30 C (Table 1). Temperatures declined as later runs were conducted, which reflects the seasonality of this region. No supplemental heat was added to the greenhouse during this research. The last two runs, which were conducted in November, had an average temperature <15 C. This explains why there were more data points at low temperatures compared with higher ones.
The target dose for each experiment was 0.5 kg ae ha−1. Averaged over all runs, the measured dose was 0.48 kg ae ha−1 (Table 1). This variation within each experiment was deemed acceptable and provided a good foundation for the subsequent chemical collection, sampling, and analysis.
The experiment had three herbicide regimes, all using a DGA salt of dicamba. The DGA+Gly treatment was considered to be a “standard treatment” showing the highest level of dicamba volatility, based on previous field studies.
Dicamba is a weak acid, and the molecular state (whether protonated or deprotonated) may have a substantial impact on the volatility (MacInnes Reference MacInnes2017). The pH of each spray solution was measured (Table 1). The pH of DGA+Gly treatments was always ≤5.0 and ranged from 4.7 to 5.0 (Table 1). The pH of the DGA+VG mixture was lower when the treatment included glyphosate (~6.0 compared to <5.0) (Table 1). These data clearly showed that adding glyphosate lowered the solution pH. The DGA+VG label states that dicamba has the potential to volatilize in lower-pH spray mixtures (Anonymous 2018b). Therefore, the authors suggest that the addition of glyphosate to the DGA+VG spray solution lowered the pH and probably helps to explain why this treatment had higher dicamba volatility (Table 2).
Dicamba concentrations from humidomes as affected by temperature and herbicide mixtures.
a DGA indicates that the diglycolamine salt formulation was used.
b Gly denotes glyphosate formulated product, which in this test was a potassium salt containing additional surfactants.
c DGA+VG denotes the DGA formulation with “VaporGrip® added, which is acetic acid/acetate included as a pH modifier.
d Values that share a letter within a temperature rank are not different at the 5% significance level.
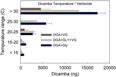
As ambient temperature increased, dicamba concentrations also increased (Table 2, Figure 2). Temperatures below 15 C had <5% dicamba concentrations compared to temperatures >30 C. This direct relationship continued through each temperature range (Table 2). Within each 5 C range, the order of measured dicamba was DGA+VG < DGA+VG+Gly < DGA+Gly, with statistical differences in three of five temperature ranks (Table 2). Observations from 20 C to 30 C followed the same general trend, with dicamba concentrations being intermediate between the lower and higher temperatures. One peculiarity of the dataset was the lack of observations from 25 to 30 C for the DGA+VG treatment. As the temperature was not controlled in this research, those particular treatments were not present in any of the studies as a consequence of greenhouse space and humidome number constraints. With observations directly above and below the 25 to 30 C range, our results still imply a consistent trend over the observed temperature range.
Dicamba measurements in 12-h intervals from within humidomes as affected by herbicide treatments and temperature grouping. Data shown represent mean ± standard error. Actual values and mean separation are given in Table 2.

These data show that the addition of the VG to the DGA formulation reduced dicamba volatility (Table 2, Figure 2). The addition of glyphosate to the DGA+VG increased dicamba concentrations at each temperature range tested, from 2.9 to 9.3 times that of DGA+VG alone. It should be noted that the dicamba concentrations below 15 C were low (708, 361, and 39 ng compared with 17,284, 13,016, and 4,527 ng for the >30 C), part of the reason for the larger relative increase. The DGA formulation in this study always contained glyphosate and consistently had the greatest dicamba measurements.
Regression analysis showed that X0 (the inflection point) was 25 for the DGA+VG, 83 for the DGA+VG+Gly, and 115 for the DGA+Gly treatment (Figure 3). The reason for this parameter estimate to increase with the treatments that contained glyphosate is that the magnitude of dicamba detected as temperature increased with those treatments was much greater and never reached an inflection point. Therefore, the inflection point was estimated to be beyond the temperatures measured. By stretching out the temperature range over 3-fold to reach the inflection point, this parameter estimate would suggest that adding glyphosate to DGA+VG increased dicamba volatility by a factor of 3.3 times (83/25 = 3.3) averaged across all temperatures in this study. Moreover, a 4.6-fold increase in dicamba was detected with the DGA+Gly treatment compared with the DGA+VG treatment. Asymptote values would mirror this, where parameter A from glyphosate-containing treatments was far beyond the data range. The authors are not aware of a mechanism that would involve glyphosate increasing soil particles moving dicamba. As such, the most plausible explanation for the increased detection of dicamba was that glyphosate lowered the solution pH thereby resulting in more dicamba being in acid form, which is known to increase volatility (Anonymous 2018b).
Dicamba measurements in 12-h intervals regressed against average temperature within the humidome for three herbicide regimes. Data points represent individual measurements. Regression equation is fit to a three-parameter sigmoidal model, Y = A/(1 + exp [–(time – X0 )/B]), and parameter X0 is a calculated value where 50% of the observed dicamba would be measured. Goodness of fit of the model to data is shown by r2 value.
Based on these data, it would appear that dicamba volatility would nearly cease at 15 C and lower (Figure 3). Greater dicamba detections at higher temperatures are consistent with previous findings (Behrens and Lueschen Reference Behrens and Lueschen1979; Egan and Mortensen Reference Egan and Mortensen2012). These results would also agree with field observations of dicamba off-target injury by scientists in 2017, where applications made during warmer temperatures in late June and July correlated with more off-target dicamba movement complaints (Hager Reference Hager2017). These results would also be consistent with the dicamba DMA salt label, which states, “do not spray Banvel adjacent to sensitive crops when the temperature of the day of application is expected to exceed 29 C as drift is more likely to occur” (Anonymous 2018c).
The dicamba concentrations detected in this research were not due to aerosol particles directly from the spraying operation, as the applications were made outside of the greenhouse. The dicamba on soil particles could be part of the dicamba that was detected, and the kinetic energy of the system as the temperature increased could have encouraged small soil particles to move upward into the air stream and then into the samplers. However, the addition of glyphosate greatly increased the dicamba detection in this study. This result would point to increased volatilization, as glyphosate added to DGA+VG consistently lowered the solution pH. It would also be in agreement with the registrant label of the DGA+VG formulation that lower pH can increase volatility (Anonymous 2018b). The new 2018 DGA+VG label now has added directions to add a pH modifier if spray solution pH is below 5.0 (Anonymous 2018b). Our research would agree with the solution pH recommendation on the new registrants’ label.
Data generated from this research provide insight into factors that are most influential in dicamba movement following a spray application. Temperature appears to be a major contributor of dicamba volatility, with greater dicamba detections at higher temperatures. The addition of glyphosate and the resulting decrease in spray mixture pH increased dicamba concentrations compared with the DGA+VG formulated product alone. DGA+VG showed lower dicamba compared with the DGA+Gly treatment, although detectable dicamba residues were noted in every sample. The most probable reason for the increased detection of dicamba at higher temperatures and with mixtures of glyphosate is via volatility.
Author ORCIDs
Thomas C. Mueller, https://orcid.org/0000-0001-9907-2853
Acknowledgments
The project was conducted under Hatch project TEN00526 and was partially funded by the Tennessee Soybean Promotion Board. No conflicts of interest have been declared. Technical assistance by Joe Beeler, David Kincer, Trey Clark, and Luke Shoffner is gratefully acknowledged.


 Open access