


INTRODUCTION
Crevasses form in regions of extensional stress by the progressive opening of small near-surface cracks (Nye, Reference Nye1952; Van der Veen, Reference Van der Veen1998), and affect glacial hydrology, glacier calving and in some cases ice-shelf collapse (Benn and others, Reference Benn, Warren and Mottram2007, Reference Benn, Gulley, Luckman, Adamek and Glowacki2009; Scambos and others, Reference Scambos2009). Crevasse depth is determined by the balance of extensional stress and lithostatic stress at the crevasse tip (Nye, Reference Nye1957; Van der Veen, Reference Van der Veen1998). While crevasse depths are typically limited to the upper tens of meters in glaciers and ice sheets (Cuffey and Paterson, Reference Cuffey and Paterson2010), crevasses form the detachment interface in calving events, and the deepening of terminal crevasses is a critical step in the progression of glacier and ice-shelf calving (Benn and others, Reference Benn, Warren and Mottram2007; Scambos and others, Reference Scambos2009). Similarly, the formation and through-ice fracture of crevasses is the principal means by which surface water on ice-sheets drains, a process which has implications for ice-sheet dynamics (Das and others, Reference Das2008; Stevens and others, Reference Stevens2015; Carmichael and others, Reference Carmichael2015).
For grounded ice, glacier and ice-sheet accelerations have been documented in association with enhanced surface melt (e.g Iken and Bindschadler, Reference Iken and Bindschadler1986), subglacial flooding during jökulhlaups (e.g. Sugiyama and Gudmundsson, Reference Sugiyama and Gudmundsson2004), subglacial lake drainage (e.g. Siegfried and others, Reference Siegfried, Fricker, Carter and Tulaczyk2016) and rainfall (e.g. Harrison and others, Reference Harrison, Raymond and MacKeith1986). Glacier and ice-sheet acceleration typically result from a reduction in effective pressure at the bed caused by increases in the subglacial water pressure (Cuffey and Paterson, Reference Cuffey and Paterson2010). In New Zealand, Ka Roimata o Hine Hukatere/Franz Josef Glacier exhibits glacier accelerations associated with large meltwater and rain-water inputs. Here, glacier velocity increases of up to and above 100% occur from such inputs year-round, a result of subglacial water pressures approaching the ice-overburden pressure beneath the lower glacier (Anderson and others, Reference Anderson2014; Kehrl and others, Reference Kehrl, Horgan, Anderson, Dadic and Mackintosh2015). The typical evolution of a subglacial water pressure induced acceleration event begins with the glacier surface lifting coincident with horizontal acceleration (e.g. Iken and Bindschadler, Reference Iken and Bindschadler1986; Harper and others, Reference Harper, Humphrey, Pfeffer and Lazar2007). Once acceleration begins, the accelerating region often migrates down the glacier, usually, but not always, accompanied by a decrease in effective pressure at the glacier bed (e.g. Iken and Bindschadler, Reference Iken and Bindschadler1986; Harper and others, Reference Harper, Humphrey, Pfeffer and Lazar2007).
As crevasses grow in response to elevated extensional strain rates (Nye, Reference Nye1957; Van der Veen, Reference Van der Veen1998), the migration of a localized accelerating region could cause enhanced crevasse growth, either by the opening of new crevasses or the growth of existing crevasses. Such a relationship is suggested by the work of Raymond and Malone (Reference Raymond and Malone1986), who observed enhanced seismicity (of an unknown source) in regions of strain rate change during glacier accelerations, and by Carmichael and others (Reference Carmichael2015) who observed elevated seismicity (associated with fracture growth) in a region of inferred high-extensional strain rate downstream of a drained supraglacial lake. Similarly, changes in the seismically observed crevasse growth rate (the number of seismic events with a crevasse growth source over a given time period) observed during jökulhlaup (e.g. Roux and others, Reference Roux, Walter, Riesen, Sugiyama and Funk2010), and as a result of diurnal variations in surface meltwater supply to the glacier bed, (e.g. Mikesell and others, Reference Mikesell2012; Carmichael and others, Reference Carmichael2015) also suggest such a relationship. Hereafter, we refer to seismic events with a crevasse growth source as icequakes, and the rate of occurrence of such events as the icequake rate.
Passive source seismology provides a suitable method for studying crevasse growth due to its often seismogenic nature (Neave and Savage, Reference Neave and Savage1970; Deichmann and others, Reference Deichmann2000; Roux and others, Reference Roux, Marsan, Métaxian, O'Brien and Moreau2008; Walter and others, Reference Walter, Deichmann and Funk2008; Mikesell and others, Reference Mikesell2012). Crevasse growth produces a seismic waveform with weak, impulsive body-wave arrivals, a dominant Rayleigh wave, a duration typically less than a second, and dominant frequency content between 10 and 50 Hz (Neave and Savage, Reference Neave and Savage1970; Deichmann and others, Reference Deichmann2000; Walter and others, Reference Walter, Deichmann and Funk2008). Here we use passive seismic techniques and geodetic observations to examine crevasse growth following rainfall at Haupapa/Tasman Glacier, a temperate, lake-terminating glacier located in the eastern Southern Alps of New Zealand (Fig. 1). The lower glacier is debris-covered (Purdie and Fitzharris, Reference Purdie and Fitzharris1999), and receives ~4 m of rainfall annually (Henderson and Thompson, Reference Henderson and Thompson1999). Horgan and others (Reference Horgan2015) found that above a certain rain rate Haupapa/Tasman Glacier experiences brief accelerations of up to 15 times its daily background speed, and that such acceleration events occur on average every 1–2 months, making Haupapa/Tasman Glacier an ideal setting to study crevasse growth and its relationship to rainfall and strain rate change.
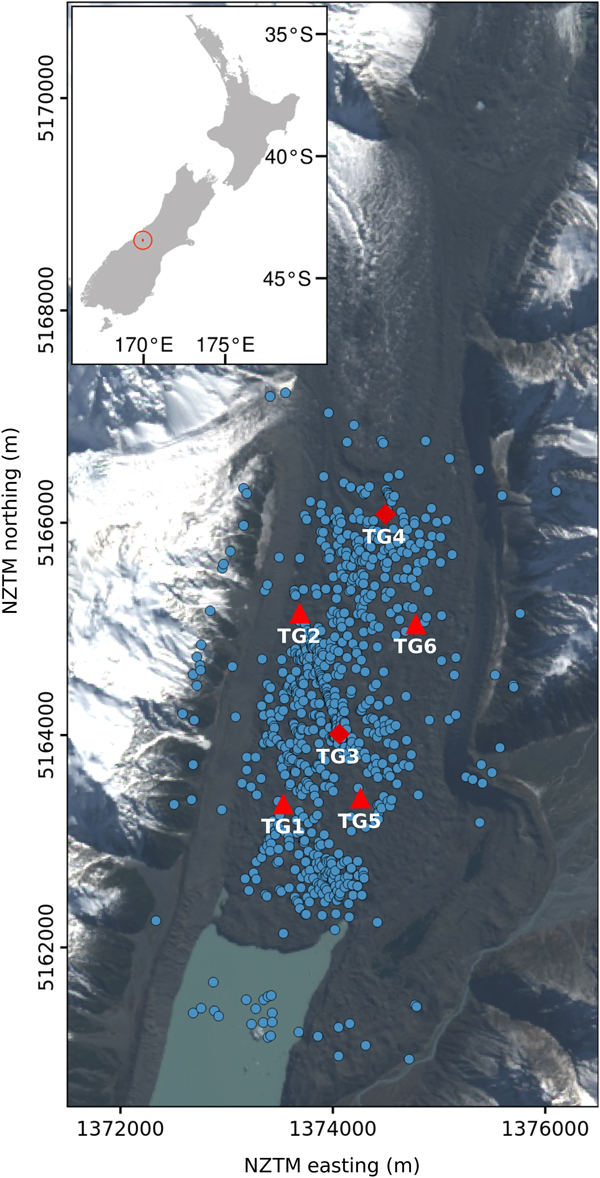
Lower Haupapa/Tasman Glacier overlain with Tasman Glacier Seismic Network (TG) stations (triangles showing geophones, diamonds showing collocated geophones and Global Navigation Satellite System receivers) and seismic event locations (blue circles). The location of the study area is shown by a bullseye in the inset map of New Zealand. Imagery is a Landsat-8 RGB false color composite.

OBSERVATIONS AND METHODS
Seismic observations and analysis
The Tasman Glacier Seismic Network (TG) constituted a temporary deployment of seismic sensors (stations) on the lower Haupapa/Tasman Glacier between 18 April and 24 August 2016. Here we examine data acquired between 1 and 18 May due to the occurrence of several substantial rainfall events during this period. Seismic sensors consisted of six 4.5 Hz three-component geophones (TG1–TG6 in Fig. 1) sampling at 250 Hz and installed either in direct contact with the glacier or within the debris cover. All seismic sensors were covered by a debris mound to reduce noise, substrate melting, and potential damage by avian fauna (kea, Nestor notabilis).
A seismic catalog was generated using a triggering algorithm operating in the frequency domain. Continuous vertical component waveforms were high-pass filtered at 1 Hz, split into 1-second windows, detrended within each window, converted to the frequency domain using a fast Fourier transform and saved into frequency-domain, or spectral amplitude, time series. The algorithm compared data in successive windows of each spectral amplitude time series independently for each station to define triggers, then grouped triggers to define seismic events. A trigger was registered when the spectral amplitude in a 1-second window summed over a given frequency range exceeded 4x that of the preceding (reference) window. Triggers remained on until the summed spectral amplitude in a successive window dropped below 4x that of the reference window. If a trigger remained on for more than 2 seconds it was removed. If three or more triggers occurred at different stations such that each trigger was within 2 seconds of a preceding trigger an event was defined. We define event duration as the complete time window during which any < = 2 second triggers, for a given event and recorded at any of our 6 stations, was on. Using this method, event durations of 1–12 seconds could be defined. However, to avoid duplicates, we discarded any event detections made within 2 seconds of another. In the simplest case, event detection occurred if three stations registered a trigger at approximately the same time with each trigger being 2 seconds or less in duration and the first trigger occurring over 2 seconds after any previously detected event. In this example, an event witha duration 1–2 seconds (depending on the length of the composite triggers) would be defined. If the triggers registered at different times, each within 2 seconds of a previous trigger, a longer event duration would occur. A conventional time-domain frequency-filtered STA:LTA triggering algorithm (e.g. Allen, Reference Allen1978) was also tested, but this approach led to more false detections and many lower signal-to-noise (SNR) events than the frequency-domain algorithm described above.
To determine the best frequency range to use, the event detection algorithm was run with a number of different frequency ranges. Combined manual inspection of spectral amplitude time series and the events output by each run of the detection algorithm identified the 1–20 Hz frequency range as the best for maximizing the number of events with the characteristics of crevasse growth and minimizing the number of events with other characteristics. We used this frequency range in the generation of our seismic event catalog.
To investigate the relationship between our event detection algorithm and noise we calculated the network-average spectral amplitude in each hour. To do this, we summed the 1–20 Hz spectral amplitude values in each 1 second bin for each station over each hour and combined the resultant normalized time series. We expect high values of the network-average spectral amplitude to indicate either period of high seismicity or periods of high noise, with the latter potentially suppressing event detection.
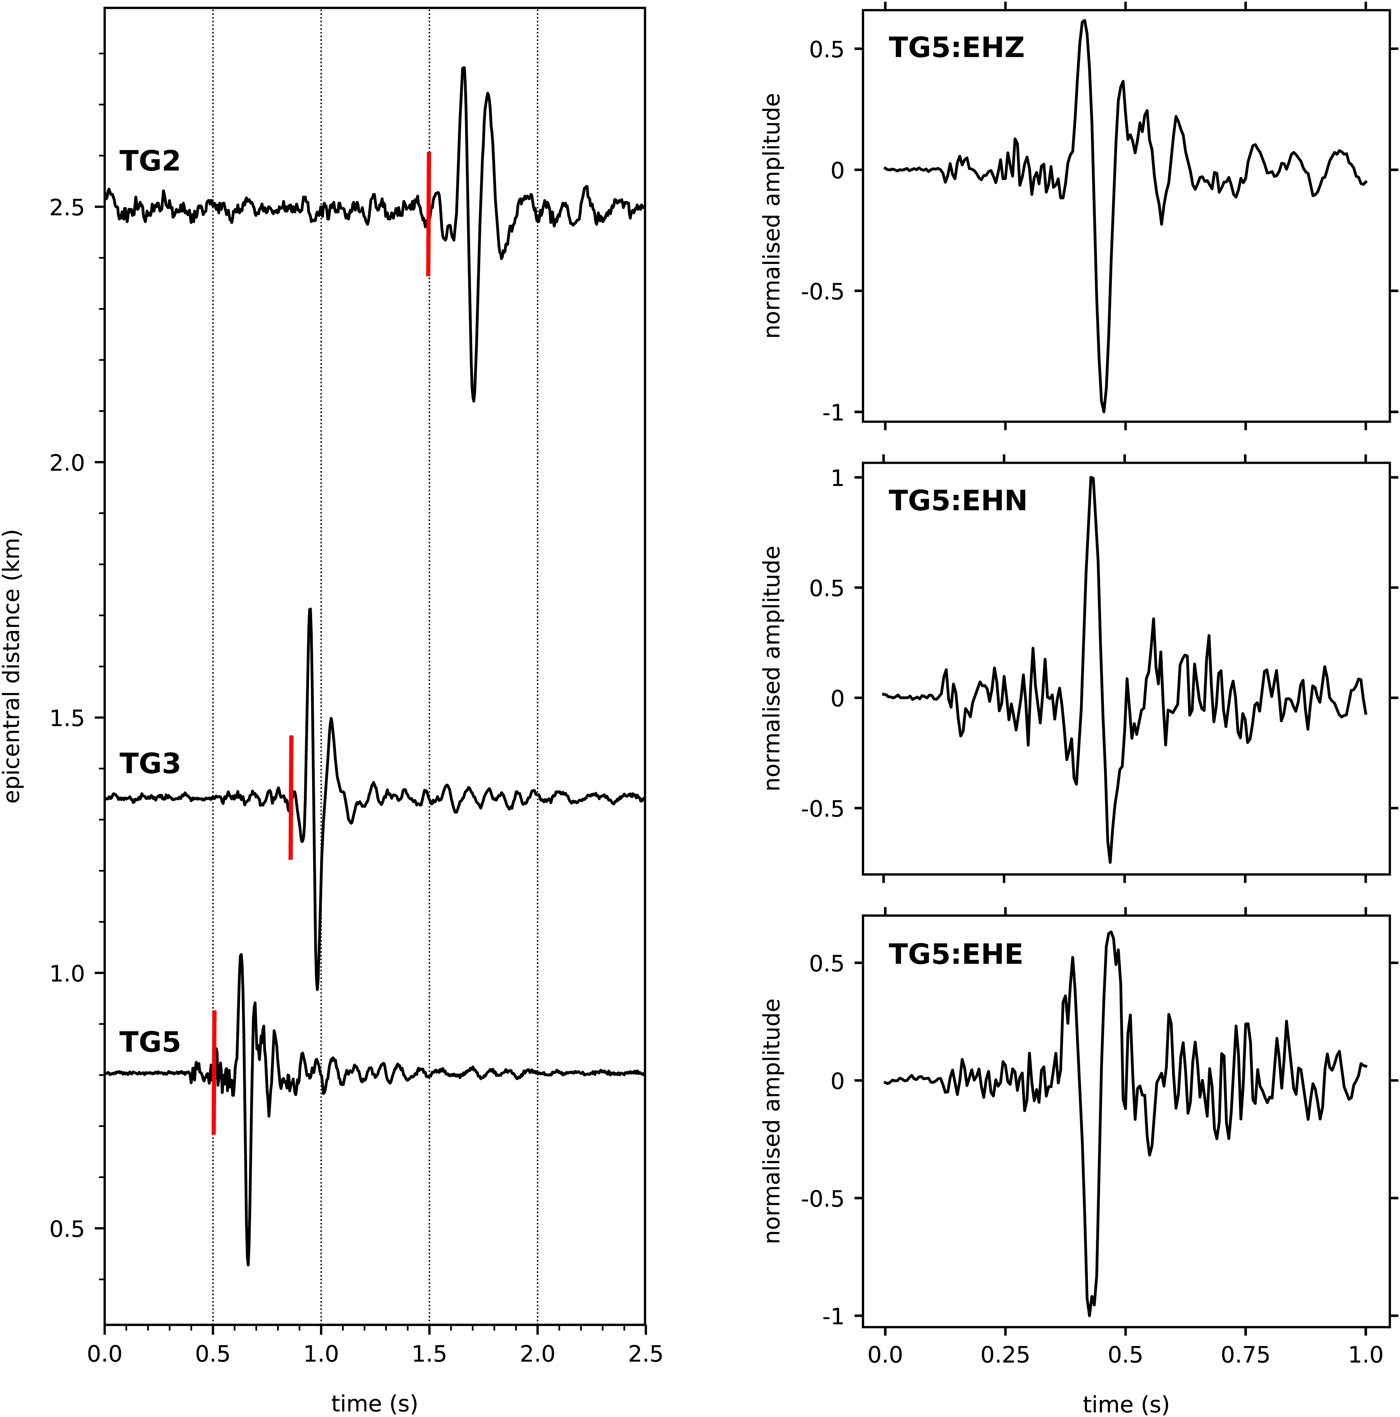
A typical event in the seismic catalog is presented in Fig. 2. The apparent wave-velocity, calculated using the arrival times of the highest amplitude phase at each station, is ~ 1.65 km s−1 (Fig. 2, left). The waveforms recorded at TG5 (Fig. 2, right) show an initial weak, impulsive phase arrival before a high-amplitude phase dominates the signal for ~1.5 wavelengths (0.15 seconds). Energy from the initial phase, which is relatively high frequency compared to that of the high-amplitude phase, continues to arrive after the high-amplitude phase passes (Fig. 2, right). For the high-amplitude phase, the particle motion on each of the three components is consistently out of phase, with EHE 90° ahead of EHZ, and EHZ 90° ahead of EHN (Fig. 2, right). Our initial seismic catalog contains 1676 similar events with 67% of event durations between 1–3 seconds. Based on the similarities between events in our catalog and the characteristics of crevasse growth seismicity (see Introduction), the alignment between the apparent wave velocity measured for events located in-line with three stations (e.g. the event in Fig. 2) and that of the Rayleigh wave in temperate ice (e.g. Roux and others, Reference Roux, Walter, Riesen, Sugiyama and Funk2010), and the out-of-phase particle motion observed in the high-amplitude phase of many events in the seismic catalog, we infer that the source of events in our seismic catalog is crevasse growth, and that the high-amplitude phase we observe in our seismic catalog seismograms is a Rayleigh wave.
Left: record section for a seismic event occurring roughly in-line with TG2, TG3 and TG5. Waveforms are taken from the vertical component recorded at each station and are normalized independently. Vertical red bars overlain on each trace shows the approximate arrival time of the Rayleigh wave. Right: normalized seismograms recorded on each component of TG5 for the seismic event shown in the left panel.
Event locations were computed using a two-dimensional grid search and a nonlinear location algorithm, NonLinLoc (Lomax and others, Reference Lomax, Virieux, Volant, Berge-Thierry, Clifford H. and Nitzan2000). To define the two-dimensional search grid, we fit a plane to the surface of the lower glacier and transformed the station locations to a Cartesian coordinate system in this plane. For each event, seismic arrival times were picked manually on three-component seismograms from the first breaks of the highest amplitude phase. We assume that for the purpose of event location of our catalog, the glacier in our study area can be approximated by a homogeneous halfspace. Thus, we interpret that each arrival time corresponds to that of a Rayleigh wave propagating non-dispersively in the glacier.
Events with <3 clear Rayleigh wave arrivals were discarded. Such events were most often obscured by noise, although some were detections of another seismicity type. The search grid was defined as a 3 × 6 km area in the glacier surface plane centered on TG3 with cells of 10 m width. The Rayleigh wave velocity of Roux and others (Reference Roux, Walter, Riesen, Sugiyama and Funk2010) (1.65 km s−1) was used to determine theoretical arrival times on the search grid, and the method of Tarantola and Valette (Reference Tarantola and Valette1982) was used to determine the likelihood of a given grid cell containing the event location. As the Rayleigh wave is formed only for events whose source falls within 1 wavelength of the free surface (Deichmann and others, Reference Deichmann2000), we assume the error introduced by using a two-dimensional search grid is minor. To accommodate this assumption, a 0.1 second Gaussian model error was introduced in the location inversion.
Event locations and their uncertainties were calculated as the center and half-width of the 95% confidence region, as described by Moser and others (Reference Moser, Eck and Nolet1992). All events for which a 95% confidence region could not be defined were discarded. Such events were considered locatable by NonLinLoc, but showed broad and flat maximum likelihood regions. We infer that these events were located poorly due to our assumption of a two-dimensional location plane, when in-fact such events may have come from deep within or below the glacier. To further quality-check located events, the distribution of epicenter uncertainties was also calculated, and any event with an uncertainty exceeding the 95% value of the distribution was discarded. Of the 1676 detected events, 1125 had three or more arrival times picked and 1123 were located by NonLinLoc. For 930 events a 95% confidence region could be defined, and 791 of these events had uncertainties below the 95% value of the uncertainty distribution.
Lateral and longitudinal distances of located events were calculated relative to the glacier center line, which we approximate by the line joining stations TG3 and TG4 (Fig. 1). The lateral distance was defined as the orthogonal distance between an event location and the center line, while longitudinal distance was defined as the distance from the terminus to the intersection point of the event's orthogonal projection and the center line. Longitudinal and lateral distance uncertainties are given as the maximum uncertainties determined during distance calculations when epicenter uncertainties were considered.
Geodetic and weather observations
Global Navigation Satellite System (GNSS) receivers were colocated with seismic sensors at TG3 and TG4 (Fig. 1). GNSS antennas were positioned on tripods extending 0.9 m (TG3) and 1.6 m (TG4) above the debris cover and recorded at a 15 seconds sampling interval. The GNSS data were processed using the method described by Horgan and others (Reference Horgan2015). Receiver positions were calculated every 30 seconds using kinematic differential carrier wave positioning (Chen and others, Reference Chen, Burkert, Berfelde and Heuer1998) with loosely constrained site motion. Horizontal velocities were calculated at 15-minute intervals using weighted linear regression of position data in 3-hour centered time windows. Regression weights corresponded to the inverse of the square of the processing uncertainties, which in our case were largely governed by satellite geometry. In 95% of cases, linear regression slope uncertainties were <0.027 m d−1 (10–14% of the average daily velocity).
Rain rate data were collected at Aoraki/Mt. Cook Village (43.736 °S, 170.096°E, 765 m elevation), ~13 km from the study area. As large rainfall events occur synchronously within each catchment of the Southern Alps (Henderson and Thompson, Reference Henderson and Thompson1999), we assume that the timing of rainfall at Mount Cook Village represents that of rainfall at Haupapa/Tasman Glacier.
RESULTS
Seismic event locations
The majority of the 791 located events meeting our quality-control criteria occur within or near the seismic network and near the glacier terminus (Fig. 1). Some events locate outside the glacier margins, such as in the proglacial lake or on the adjacent mountains (Fig. 1). Such events appear to have been mislocated to the margins of the search grid due to the weak geometric constraints imposed by the station geometry outside the network. These events are not considered in the subsequent interpretation of the spatial event distribution.
Seismic event timing
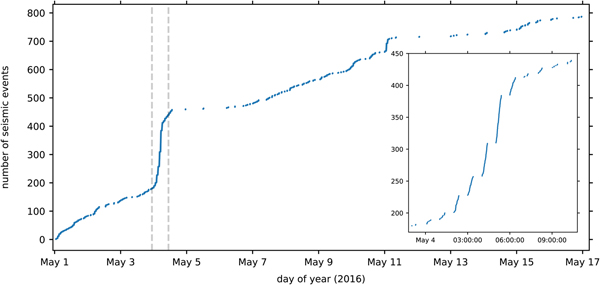
The cumulative number of located seismic events exhibits several notable changes in its slope with respect to time (Fig. 3). We interpret this slope as the apparent seismicity rate, and later as the icequake rate. The first change in the apparent seismicity rate occurs on 4 May when the approximately linear trend of 65 events d−1 changes to one of 793 events d−1. This elevated trend lasts for 7 hours before a rate of 20 events d−1 develops and persists for 3 days. On 11 May, another period of enhanced apparent seismicity rate occurs. This period lasts 1.5 hours and has slope 454 events d−1. Again this period is followed by one of reduced apparent seismicity rate, here with a slope of 7 events d−1 lasting 3 days (Fig. 3). Between the two periods of enhanced apparent seismicity rate a period of broadly linear slope occurs (Fig. 3).
Cumulative number of located seismic events plotted against time. Inset: zoom of cumulative seismic event time series over part of 3/4 May. Inset extent is shown in background figure by dashed gray lines.
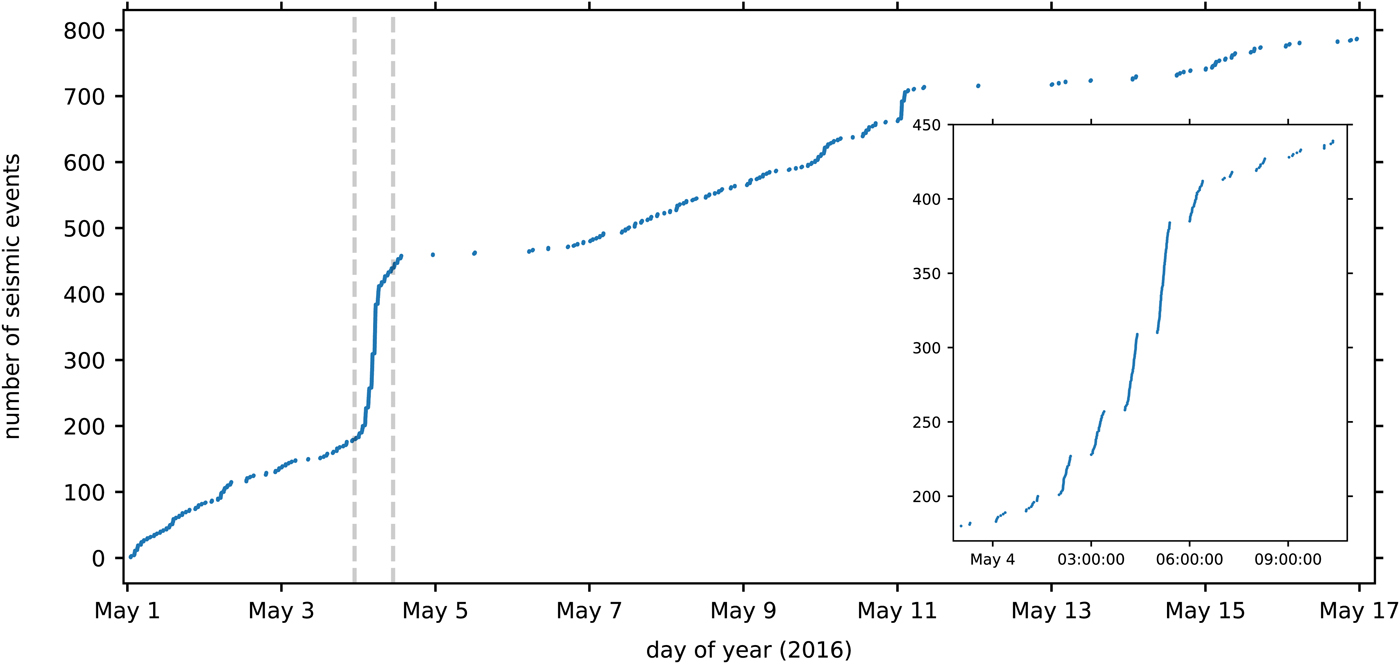
On sub-daily timescales, seismic event occurrence appears temporally clustered during the period of elevated apparent seismicity rate on 4 May (Fig. 3, May 4, 0000–0900 hours). Manual inspection of the spectral amplitude time series over this period (4 May, 0000–0900 hours) shows no undetected events occur during the periods of quiescence between the temporal clusters, indicating either that the temporal clustering we observe is real or that the spectral amplitude time series do not capture events well during this period. Detailed manual inspection of seismograms over this period reveals both temporally clustered and temporally isolated seismic events that were not captured by our event detection algorithm (e.g. Supplementary Fig. 1). We hypothesize that this undetected seismicity, whether temporally clustered or not, is of the same type as that in our event catalog, and that heightened noise during the period (Fig. 4, 4 May, 0000–0900 hours, 1–20 Hz average spectral amplitude) precludes any events within this seismicity from being detected. We, therefore, consider the temporal clusters which are present in our data on 4 May to be the result of increased seismicity and not an artifact of the event detection algorithm, but we also acknowledge that many events were not recorded during this period, and that any conclusions made from this data would be dubious.
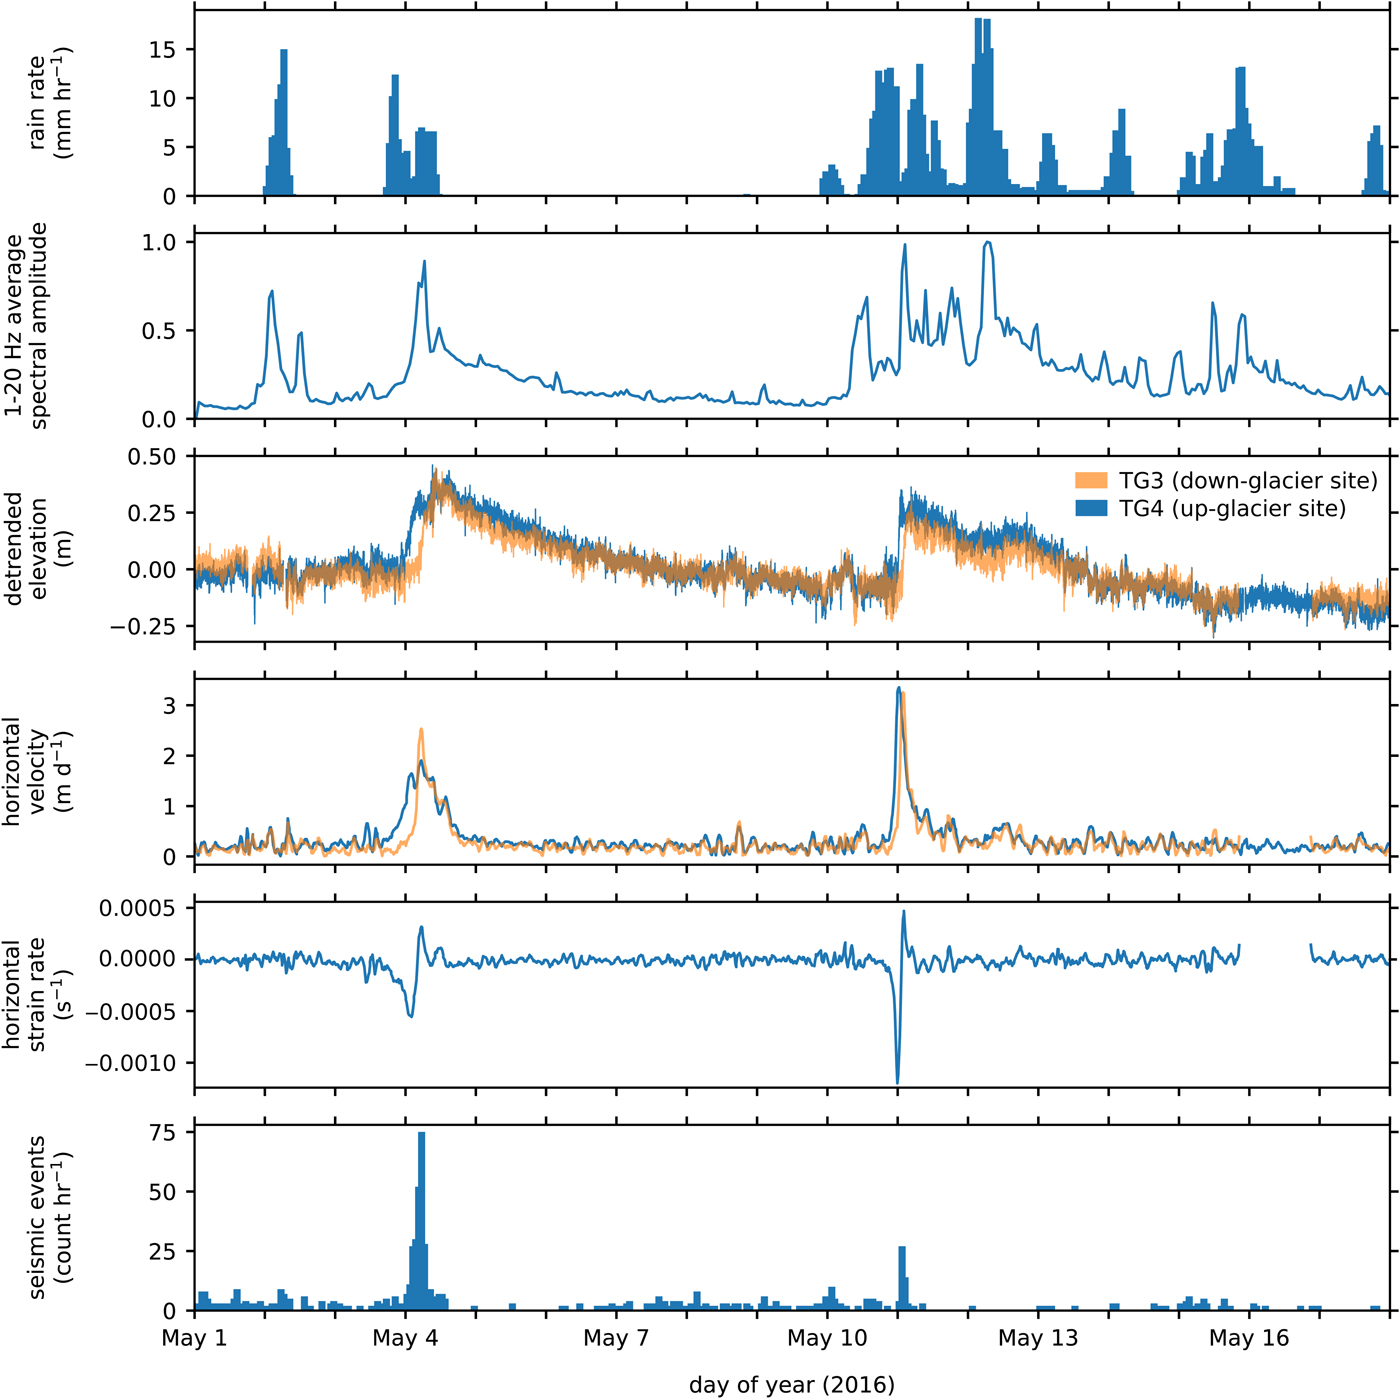
Time series of rain rate, network-averaged hourly 1–20 Hz average spectral amplitude, detrended elevation at TG4 (blue) and TG3 (orange, overlaid), horizontal velocity at TG4 and TG3, horizontal strain rate between TG4 and TG3, and hourly seismic event count. TG4 and TG3 mean elevations are 913.86 and 832.95 m, and horizontal strain rate is positive during extension between the two stations. Data loss occurs at TG3 for ~1 day beginning late on 15 May, causing gaps in related time series.
Rainfall and glacier accelerations
Several episodes of rainfall occur over the study period. The first occurs on 2 May and shows no relationship with most other time series: elevation, horizontal velocity, horizontal strain rate, and seismic event count (Fig. 4). Rainfall events on 13–16 May also occur without notable effect on these time series (Fig. 4). During many periods of rainfall the network-average spectral amplitude increases, although this does not occur in all cases (Fig. 4).
On 3–4 May, a period of rainfall precedes an increase in all other time series: network-average spectral amplitude, glacier elevation, velocity, strain rate and seismic event count (Fig. 4). The same occurs on 11 May (Fig. 4). The relationship between rainfall, glacier elevation, and glacier velocity at Haupapa/Tasman Glacier is explored in detail by Horgan and others (Reference Horgan2015). These authors found that rain rates above 3.2 mm hr−1 (when represented as 24-hour smoothed values) trigger glacier accelerations at Haupapa/Tasman Glacier. We consider both the periods during which rainfall precedes an increase in all other time series (Fig. 4) as rain-induced glacier accelerations, and in both cases we observe 24-hour smoothed rain rates exceeding the 3.2 mm hr−1 threshold defined by Horgan and others (Reference Horgan2015).
The first rain-induced glacier acceleration we observe occurs on 3--4 May following several hours of sustained rainfall on 3 May (Fig. 4). The glacier acceleration is observed initially up-glacier at TG4 with the rising of the glacier surface on 4 May (Fig. 4). Horizontal velocity appears to increase ahead of the surface rising, but this is an artifact of the smoothing used in the velocity calculation method. Horizontal velocity peaks during the most rapid uplift and begins to decrease as uplift continues. Following their respective peaks, the surface elevation and horizontal velocity both remain elevated for several days, each asymptotically approaching their pre-acceleration value, (Fig. 4, 4--10 May) although velocities likely do so in part due to the smoothing applied during their calculation. The same uplift and acceleration trend repeats at the down-glacier site (TG3) 2–3 hours later (Fig. 4), suggesting a propagation rate of ~700–1000 m hr−1 for the zone of acceleration during this glacier acceleration.
During the glacier acceleration, strain rates become elevated between TG3 and TG4. Initially, strain rates are compressive as TG4 moves forward toward the relatively stationary TG3, but as acceleration begins at TG3 and slows at TG4, extensional strain rates develop between the two sites.
During the 11 May event (Fig. 4) maximum velocities are higher and the migration of acceleration down-glacier is almost twice as fast, causing higher strain rates and a shorter period of strain rate change. Again glacier elevation and velocity remain elevated for several days after their respective peaks, although a bump occurs in these time series on 12 May, potentially resulting from increased subglacial water storage following the major rainfall episode on the same day (Fig. 4).
A notable visual correlation between horizontal strain rate and seismic event count is evident in Fig. 4: during both glacier accelerations, the hourly seismic event count becomes elevated during the periods of rapid strain rate change (Fig. 4, 4–10/11 May). In particular, peak hourly seismic event counts are observed during the period of extensional strain rate between TG3 and TG4 (Fig. 4). Following each peak in seismic event count are periods of apparently absent seismicity (Figs 3 and 4). These periods of apparently reduced seismicity occur in the absence of rainfall or changes in strain rate, and each period persists and ends independently of any notable change in the glacier elevation, velocity, or network-average spectral amplitude (Fig. 4).
Spatiotemporal seismic event trends
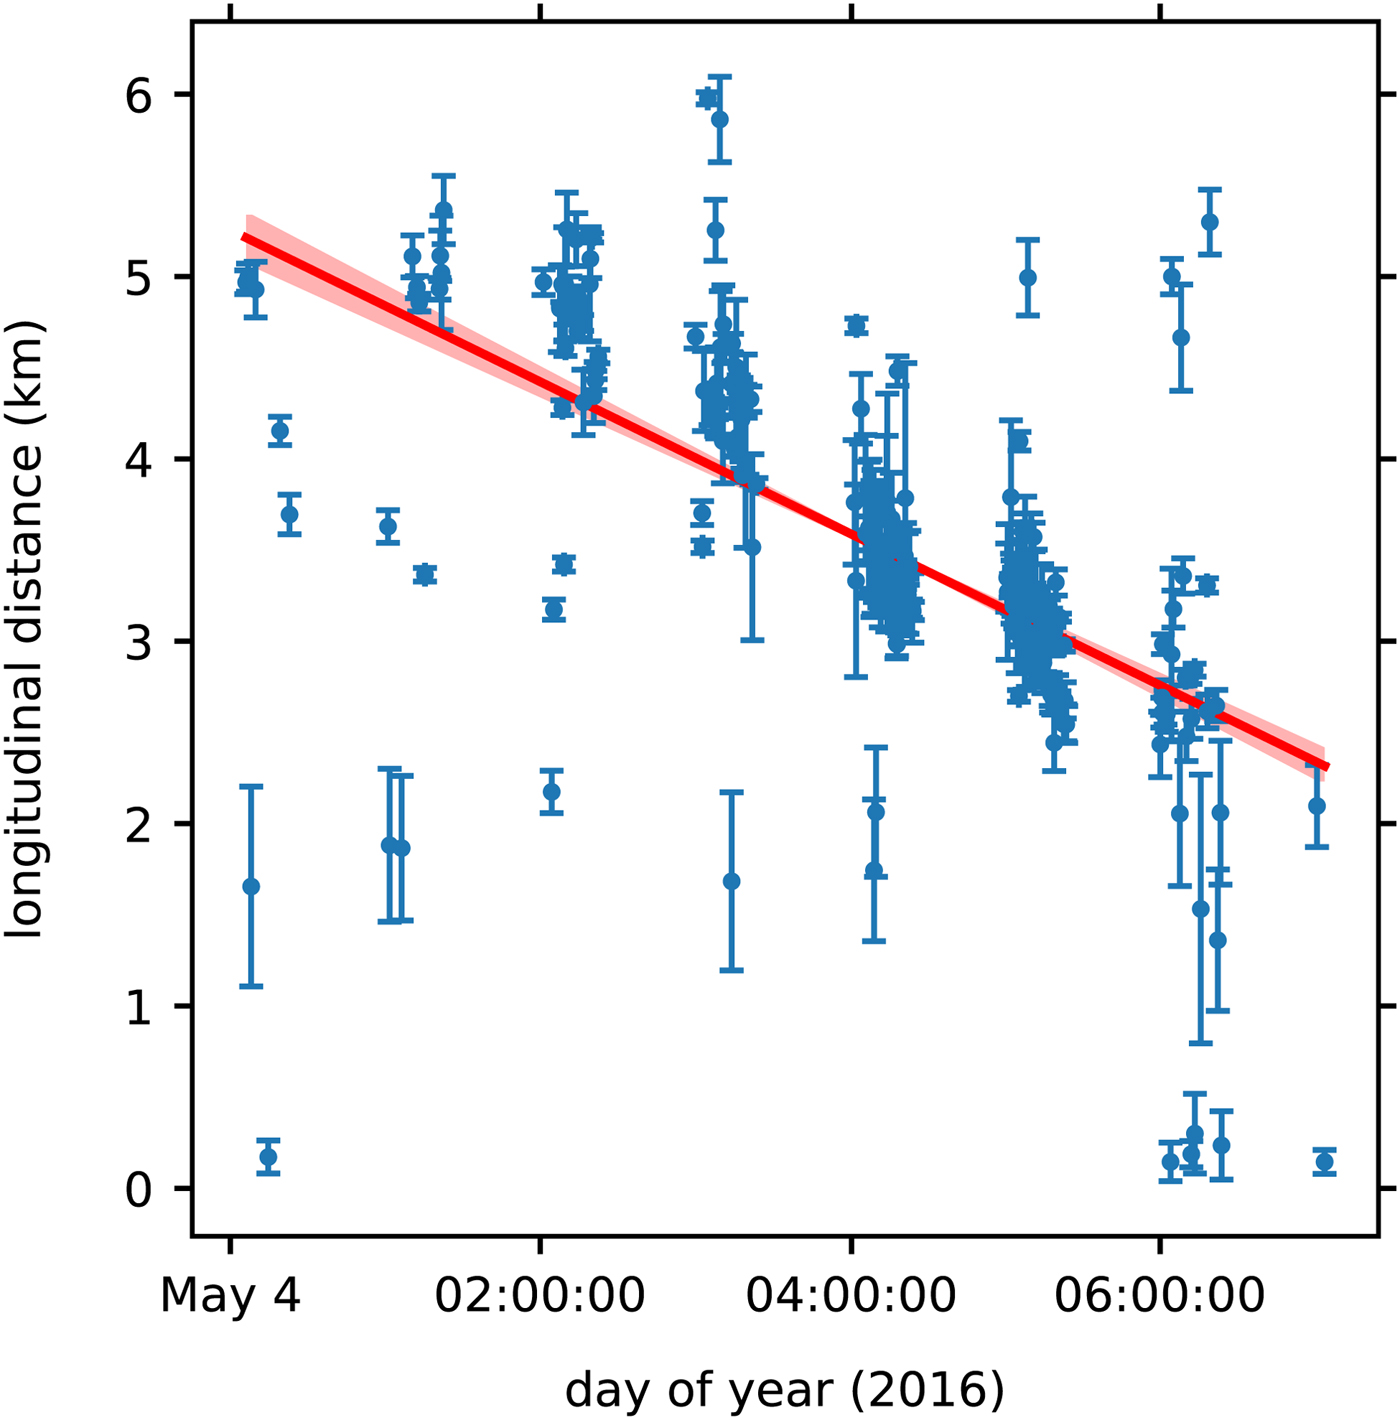
During the period of rapid strain rate change on 4 May, the event catalog displays two prominent patterns. First, the seismic event occurrence shows temporal clustering (Figs 3 and 5). Second, the majority of seismic events are observed to migrate down the glacier (Fig. 5). Linear regression fits of longitudinal event distance against time during this period yield an R2 value of 0.54 and a linear slope of − 440 ± 30 m hr−1 (Fig. 5). Lateral distance temporal relationships during this period demonstrate no notable pattern. Low event counts during the period of rapid strain rate change on 11 May preclude linear regression analysis of event migration. In each linear regression, weights are calculated as the inverse square of the line distance uncertainty.
Longitudinal distance time series for located seismic events on 4 May coincident with the period of rapid strain rate change. The linear regression result is shown by the red line with slope − 440 ± 30 m hr−1 and R2 value 0.54. Red shading about the line denotes its uncertainty.
DISCUSSION
Glacier acceleration source and processes
Glacier accelerations at Haupapa/Tasman Glacier are thought to result from rain-water input increasing subglacial water pressure and reducing effective pressure at the glacier bed (Horgan and others, Reference Horgan2015). Rain-induced glacier accelerations have been reported elsewhere (e.g. Harper and others, Reference Harper, Humphrey, Pfeffer and Lazar2007; Howat and others, Reference Howat, Tulaczyk, Waddington and Björnsson2008; Anderson and others, Reference Anderson2014) and direct observations of subglacial pressures broadly confirm the dependence of sliding velocity on water pressure (e.g. Iken and Bindschadler, Reference Iken and Bindschadler1986; Rada and Schoof, Reference Rada and Schoof2018). The reduction in effective pressure, brought about by high rain rates, partially floats the glacier and reduces points of contact with the bed. Subglacial cavities located in the lee of bedrock bumps fill with water and expand, resulting in surface elevation changes of decimeters and maximum glacier velocities that coincide with maximum rates of cavity growth (Fig. 4). Deceleration mainly occurs while the surface remains elevated, with further deceleration occurring with surface lowering during cavity collapse following peak accelerations (Fig. 4; Horgan and others, Reference Horgan2015). Following the bed separation analysis of Horgan and others (Reference Horgan2015), we infer cavitation to occur during both the glacier accelerations reported here.
Cavitation and acceleration occur first at the up-glacier site (TG4) and ~2–3 hours later at the down-glacier site (TG3; Fig. 4). The propagation of the acceleration, and subsequent deceleration, down-glacier and the resultant asynchronous nature of the high-velocity interval, results in a propagating zone of enhanced compressive and extensional strain down- and up-glacier of the cavitating region (Fig. 4, 4 May strain rate peaks). Anderson and others (Reference Anderson2014) note a similar phenomenon at Ka Roimata o Hine Hukatere/Franz Josef Glacier, but on an annual timescale: here, up-glacier ice thickening leads to enhanced glacier velocities in the thickened region, which then cause enhanced compressive and extensional strain in adjacent down- and up-glacier regions. The end of each glacier acceleration is interpreted as the time of complete cavity collapse and the return of basal water pressures to approximately pre-rainfall values. For the two glacier accelerations we observe, this occurs on 10 and 17 May respectively, ~6 days after the onset of each acceleration event (Fig. 4).
Crevasse growth during glacier accelerations
When rainfall results in a glacier acceleration, an enhanced icequake rate is observed (e.g. Fig. 4, 4 May). Crevasse growth recorded in the seismic event catalog occurs at a roughly linear rate in the absence of rapid strain rate changes (Figs 3 and 4). During periods of rapid strain rate change, crevasse growth occurs at an elevated rate and icequakes are observed to migrate down-glacier at a rate comparable to that of cavitation: 440 m hr−1 vs. ~700–1000 m hr−1 (Figs 4 and 5, 4 May). At the scale we observe strain rate and seismicity changes, it appears that each period of enhanced icequake rate occurs during the period of extensional strain rate across our network (Fig. 4). The similarity in migration velocities between cavitation and crevasse growth, and the known relationship between extensional strain rates and enhanced crevasse growth, suggests that the locus of crevasse growth occurs in the lee of the cavitating zone, and that the cause of enhanced and migratory crevasse growth during glacier acceleration events is the migrating nature of the cavitating zone. A similar relationship was found by Christoffersen and others (Reference Christoffersen2018), who found that crevasse development in the Greenland ice sheet was a likely consequence of supraglacial lake drainage due to the acceleration that these events trigger down-stream of the drained lake.
Temporal clustering of crevasse growth
In the period of rapid strain rate change on 4 May, temporal clusters of seismicity are observed (Fig. 3, 4 May, 0000–0900 hours). Bassis and others (Reference Bassis, Coleman, Fricker and Minster2005) observed a temporal clustering of seismicity during the episodic propagation of a rift in the Amery ice-shelf. These authors suggest that such temporal clustering may result from sub-critical crack growth and that periods of quiescence may occur due to the development of a rift tip cavity which resists further opening. As manual inspection of seismograms over the period of rapid strain rate change on 4 May revealed seismicity that was not registered as events (see Results: Seismic event timing paragraph 2), such an explanation is difficult to apply to the temporal clustering observed in our data. Moreover, the known failure of our event detection algorithm over the period of rapid strain rate change on 4 May makes any conclusions drawn from the temporal clusters observed in our data dubious, and so we choose not to draw any.
Post-acceleration crevasse growth
Following each period of enhanced icequake rate, a period of reduced icequake rate occurs (Fig. 3). While periods of enhanced icequake rate show a clear relationship with elevated extensional strain rates during glacier acceleration (Fig. 4), reduced rate periods show no relationship with rain rate or glacier movement (Fig. 4), and strain rates observed during these periods (Fig. 4, 4--7, 11--14 May) are similar to those observed during times of relatively high icequake rate (Fig. 4, 1--4 May). Noise levels are elevated during this period, but drop off gradually while the apparent seismicity rate does not recover (Fig. 4, 1–20 Hz average spectral amplitude vs. seismic event count), indicating that a failure of the event detection algorithm is unlikely to be the cause of the periods of reduced icequake rate. While it is possible that the event detection algorithm failed to capture low SNR events during the period of reduced icequake rate, manual inspection of seismograms over this period shows that those events which do occur are captured by the detection algorithm. We suggest then that periods of reduced icequake rate result from the precursory periods of enhanced crevasse growth during the periods of enhanced icequake rate. To the authors' knowledge, this is the first observation of a reduction in the icequake rate following an enhanced period of crevasse growth. Similar observations of enhanced seismicity following the delivery of large water volumes to the subglacial drainage system have been reported by Das and others (Reference Das2008), Roux and others (Reference Roux, Walter, Riesen, Sugiyama and Funk2010) and Carmichael and others (Reference Carmichael2015) following the drainage of supraglacial lakes, but none of these studies note a reduction in the seismicity following lake drainage and the termination of the associated glacier acceleration. Periodic increases and reductions in the seismicity rate have been noted by Mikesell and others (Reference Mikesell2012) and Carmichael and others (Reference Carmichael2015) due to diurnal cycles in basal water supply, but in both cases there is a systematic return to background seismicity rates following each period of reduced rate. In our interpretation, icequakes during periods of enhanced icequake rate occur earlier than they would have otherwise due to high extensional strain rates and the period of reduced icequake rate encompasses the time in which these events would have taken place in the absence of the glacier acceleration. A similar phenomena have been observed in earthquake seismology where high transient stresses are observed to initialize slip on faults early, creating a brief period of enhanced seismicity and a subsequent temporal seismicity shadow (e.g. Warren-Smith and others, Reference Warren-Smith, Fry, Kaneko and Chamberlain2018). During this seismicity shadow, faults, or in our case crevasses, reaccumulate the stresses required for rupture.
CONCLUSIONS
Haupapa/Tasman Glacier exhibits glacier accelerations resulting from periods of high rainfall, during which variable icequake rates occur and the locus of crevasse growth migrates down-glacier. Cavitation is inferred following rainwater delivery to the glacier bed. The cavitating region migrates down-glacier, causing elevated extensional strain rates and promoting crevasse development in upstream regions. Crevasse growth during the period of cavitation occurs at ≥10x the pre-cavitation rate and located icequakes occur in temporal clusters that migrate down-glacier at ~ 440 m hr−1. Following the cessation of cavitation, the icequake rate drops to ≤0.3x the pre-cavitation rate and remains low for ~3 days, potentially reflecting the time required for the crevasses grown during glacier acceleration to reaccumulate the stresses required to grow seismically again. Our results resemble those found for grounded ice sheets, suggesting that the relationship between water-induced glacier accelerations and surface crevasse growth is common across grounded glacial environments. This result has implications for both glacier hydrology and glacier dynamics, with the growth of surface crevasses up-glacier of an accelerating region being a potentially important mechanism of surface-water delivery to the subglacial environment, and capable of enhancing glacier accelerations. As surface crevasse development occurs in post-cavitation regions at Haupapa/Tasman Glacier, we are not able to resolve how their development affects the glacier hydrology and whether it influences the glacier acceleration. For future study, we suggest that a combined seismic and geodetic instrument network be established over Haupapa/Tasman Glacier at a higher station density and over a greater glacier extent. Having data from such a network would allow a higher resolution record of the glacier acceleration process to be captured, further developing our understanding of the interplay between surface-water input, glacier acceleration and crevasse growth.
SUPPLEMENTARY MATERIAL
The supplementary material for this article can be found at https://doi.org/10.1017/aog.2019.20
ACKNOWLEDGMENTS
We thank Brian Anderson, Merijn Thornton, Troy Feck and Sean Barberie for their support in the fieldwork required for this study. The seismic instruments were provided by the Incorporated Research Institutions for Seismology (IRIS) through the PASSCAL Instrument Center at New Mexico Tech. Data are available via IRIS at http://ds.iris.edu/mda/2C?timewindow=2016-2017. Funding for this study was provided by Victoria University of Wellington (URF 209829) and the Geoscience Society of New Zealand via the John Beavan Geodetic Fieldwork Award.


 Open access