


In recent years, there have been population-level decreases in household sugar purchasing in Great Britain (GB). Using take-home consumer data, Berger et al. (Reference Berger, Cummins and Smith1) reported a 4·9 g decline in the daily amount of sugar purchased per capita in Britain between 2014 and 2017. The main sources of sugar from which decline was observed were energetic sweeteners (including table sugar) (–18 %), juices (–23 %) and sugar-sweetened beverages (SSB) (–15 %). These reductions in purchases also reflect decreases in free sugar intake measured by the National Diet and Nutrition Survey (NDNS)(2).
However, it remains unclear whether these declines are distributed equally across the socio-economic gradient. We know from previous analyses of socio-economic inequalities in dietary behaviours in the United Kingdom that low socio-economic groups are less likely to adhere to dietary recommendations and tend to consume more free sugar, in particular from SSB and table sugar(2–Reference Maguire and Monsivais7). To our knowledge, no study has investigated the extent of inequalities in the quantity of sugar obtained from a wider range of food groups, nor its change in the recent years.
Understanding the distributional effect of recent declines in sugar purchasing is important in the current policy context. Since 2015 there have been various national policy initiatives in the United Kingdom aimed at tackling obesity(8,9) with reduction in sugar consumption as one of the key priorities, including official recommendation to cut added sugar consumption to <5 % of total dietary energy(10). Public Health England’s Change4Life social marketing campaigns such as ‘sugar swaps’ were initially at the core of the obesity prevention programme(Reference Adams, Mytton and White11), but these were soon followed by a more comprehensive childhood obesity strategy launched in 2016(8). This introduced a sugar reduction programme and a soft drinks industry levy (SDIL) for industry, which were implemented in March 2017 and March 2018, respectively. Both programmes have an underlying objective to encourage industry to reformulate foods and beverages to contain less sugar.
It has been suggested that these recent population-level policy efforts could at least partly explain recent decreases in sugar purchasing(Reference Berger, Cummins and Smith1). Public Health England reported a 2·9 % reduction in average sugar content (sales weighted average in grams per 100 g) of foods targeted by the sugar reduction programme between 2015 and 2018, while the average sugar content of beverages subject to the SDIL was reported to have decreased by 28·8 % in the same period(2).
While these declines in sugar purchases are undoubtedly encouraging, there is a concern that policy activities may also inadvertently increase inequalities(Reference Lorenc, Petticrew and Welch12,Reference White, Adams, Heywood and Salvatore13) . Although the distributional effects of SDIL and the sugar reduction programme have not yet been rigorously evaluated(2), previous research suggests that the types of policy actions currently being implemented may positively or negatively affect inequalities in sugar purchasing. In particular, social marketing campaigns, which rely on a high level of individual agency in decision making, are more likely to decrease prevalence of risky behaviour in high socio-economic groups compared with low socio-economic groups(Reference Lorenc, Petticrew and Welch12,Reference Slama14) . Conversely, the evidence suggests that price-related interventions, such as sugar taxes, can be more effective in more disadvantaged groups and reduce health inequalities(Reference McGill, Anwar and Orton15). The distributional effects of industry-led food reformulations remain unknown and has been little researched(Reference Hashem, He and MacGregor16).
In this context of increasing policy actions targeting sugar consumption in the United Kingdom, the current study aims to appraise the extent of changes in socio-economic inequalities in the amount of sugar from take-home purchases of foods and beverages. While we are not able to evaluate the distributional effects of specific policies, our aims are to (1) analyse the contribution of a broad range of food and beverages to overall sugar purchases across socio-economic groups and (2) assess the distributional effect of recent decreases in population-level sugar purchasing on the socio-economic gradient.
Methods
Study design and participants
Data were obtained from the GB Kantar Fast-Moving Consumer Goods panel, a consumer panel of food and beverages purchased by households in Great Britain and brought into their home. Our data set covers purchases made during 2014–2017. The panel uses an open-panel design, comprising of 31 000 to 34 000 households annually. Households are recruited via stratified sampling, with quotas set for region, household size, age of main shopper, number of children and occupation. Households record purchases continuously throughout the year and are offered incentives to remain in the panel in the form of vouchers with an average value of £100 per household per year. Panel retention is high – participating households in 2014 had median follow-up time of 2·6 years. Approximately 3000–4000 new households are enrolled each year to maintain national representativeness. Panellists provide socio-demographic data when joining the panel (including age, sex, occupation, ethnicity, household composition, income and others) followed by annual updates.
Food and beverage purchase data
Households record food and beverage purchases brought back into the home using hand-held barcode scanners. Place of purchase includes supermarkets, convenience stores, newsagents and specialist stores such as butchers or greengrocers. Non-barcoded products, such as loose fruits and vegetables, are recorded using barcodes created for each type of product by Kantar (e.g. ‘organic banana’). Participants additionally provide price information from till receipts. Kantar Fast-Moving Consumer Goods collects nutritional data on products purchased through direct measurement in outlets twice a year, or using product images provided by Brandbank, a third-party supplier. Where Kantar is unable to gather direct information, nutritional values are either copied across from similar products or an average value for the category or product type is calculated and used instead. For sugar content, the proportion of imputed values was 13·0 %. Data available for analyses included n 151 277 801 item-level observations of food and beverage product purchases made over four 52-week periods.
Data cleaning
We screened for, and identified, potential incorrect values for volumes and units reported as well as for nutritional content using logic checks and summary statistics. Overall, after consultation with Kantar, we corrected one variable or more in 1·3 % of all transactions. The majority of corrections related to nutritional information, but for a small number of observations, measurement units and pack numbers were also modified to ensure consistency. Finally, we investigated the products with corrected transactions and excluded products with inconsistent time series (5 % of observations) to ensure data quality. We estimated that these products could account for up to 7 g of sugar (and 130 kcal) per capita/d.
Exclusion criteria
Our analyses are restricted to households consistently reporting purchases over time. We aggregated across purchases made by households within each quarter and, following criteria used before with these data(Reference Griffith, O’Connell and Smith17,Reference Berger, Cummins and Allen18) , we dropped households that did not record any purchase for at least 14 d in a quarter, and households who were present for fewer than two quarters in a year. Households reporting more than 500 g of sugar purchased per household member per day on average over at least one quarter were further excluded (see online supplementary material, Supplemental Figure S1).
Food group classification
We grouped products into twenty-three distinct categories based on a previously used food group classification (see online supplementary material, Supplemental Table S1)(Reference Berger, Cummins and Smith1,Reference Pechey, Jebb and Kelly5,Reference Johnson, Mander and Jones19) that separates products into pre-defined categories (e.g. breakfast cereals, biscuits and juices). The classification was adapted to be relevant to the analysis of the sugar content of products and to closely align with the classification used by Public Health England’s sugar reduction programme(Reference Tedstone, Coulton and Targett20). We further separated healthier from less healthy products within each category using the UK Department of Health & Social Care nutrient profiling model, a model widely used for policy actions and supported by the UK Scientific Advisory Committee on Nutrition(21). The nutrient profiling model assigns points to products based on the content of energy, sugar, saturated fat, salt, NSP fibre, protein and fruit and vegetables. Food products scoring four points and above and beverages scoring one point and above are classified as less healthy (see(21) for details of score calculation). For some categories such as biscuits or vegetables, the differentiation was not necessary due to more than 90 % of products falling into either healthier or less healthy categories. Alcoholic beverages and juices were not scored and were classified as less healthy(Reference Heyman and Abrams22). Products with a low sugar content (e.g. fish, rice and oil) were grouped in an ‘other’ category and excluded from the food group analyses. The final classification included ten healthier food groups and thirteen less healthy food groups (see Table S1 in Supplementary File).
Socio-economic position
Socio-economic position is a multi-dimensional concept that is often characterised through a combination of separate measures of occupation, education and income, which all influence food choices and diet quality and serve as approximation for further determinants such as culture, knowledge and skills or external environments including neighbourhood characteristics(Reference Maguire and Monsivais7,Reference Darmon and Drewnowski23) . Following previous studies describing socio-economic inequalities in dietary behaviours in the GB, data on occupational social grade of the main respondent were used as a marker of household socio-economic position(2,Reference Yau, Adams and Monsivais3,Reference Pechey, Jebb and Kelly5,Reference Berger, Cummins and Allen18,Reference Cornelsen, Berger and Cummins24) . This was provided in five categories: higher and intermediate managerial, administrative or professional occupations (grade A&B); supervisory, clerical and junior managerial administrative or professional occupations (grade C1); skilled manual workers (grade C2); semi- or unskilled manual workers (grade D) and state pensioners, casual or lowest grade workers and those unemployed with state benefits (grade E)(25).
Statistical analysis
We aggregated across purchases made by households within each quarter and calculated overall mean daily sugar purchased (g) per household member in each quarter. We also estimated this by food group and for healthier/less healthy beverages/foods separately. We applied weights provided by Kantar to account for differences in the frequency of purchase of products across different places of purchase. This ensured that product-specific purchases reported in the panel were representative of the GB market. To estimate changes in sugar purchases over time, we used generalised linear models with a log-link function(Reference Nichols26) using generalised estimating equations to account for the hierarchical structure of the data at household level (observations nested within households)(Reference Fitzmaurice, Laird and Ware27). We used unstructured working correlation structures, unless the model failed to converge, in which case we used exchangeable working correlations. We adjusted for age of the main shopper (18–29, 30–39, 40–49, 50–59, 60–69, 70+), number of children (0, 1, 2, 3+) and number of adults (1, 2, 3, 4+) in the household, region of residence (ten regions in Britain) and season (i.e. quarter). We specified interactions between social grade measure (grades A&B, C1, C2, D and E) with year dummies to allow for differences in time trends in sugar purchasing by social grade. These socio-demographic covariates were almost time-invariant (not presented). Based on the estimated coefficients, we then predicted mean amount of sugar (g) purchased by social grade and year at fixed values of the other covariates. These were defined using distributions from the GB population for each of the covariate in order to obtain estimates representative of the GB population average (see online supplementary material, Supplemental Table S2). Inequalities in sugar purchasing were examined for 2014 and 2017 using (i) a test of overall evidence of difference between the five social grades and (ii) estimated differences between the lowest (grade E) and the highest social grades (grade A&B). Data analyses were performed using Stata MP version 15.1(28).
Sensitivity analysis
Sensitivity analyses were conducted to ensure that changes in the composition of the panel did not affect the results. These additional analyses were restricted to households who participated (i.e. reported at least 14 d of purchases) across at least twelve quarters.
Results
We analysed 281 635 quarterly observations from 28 033 eligible households (see online supplementary material, Supplemental Figure S1). Table 1 summarises household socio-demographic characteristics. About 20·7 % of the main shoppers had highest social grade (grade A&B) and 8·9 % had lowest social grade (grade E). In total, 15·2 % of households were living in London, 57·3 % had two adults and 71·0 % had no children. Households with younger main shopper were under-represented (3·1 % were <30 years). The panel composition was stable over time (see online supplementary material, Supplemental Table S3).
Household characteristics: GB Kantar FMCG panel 2014–2017 (n 281 635 quarter-observations from n 28 033 households)
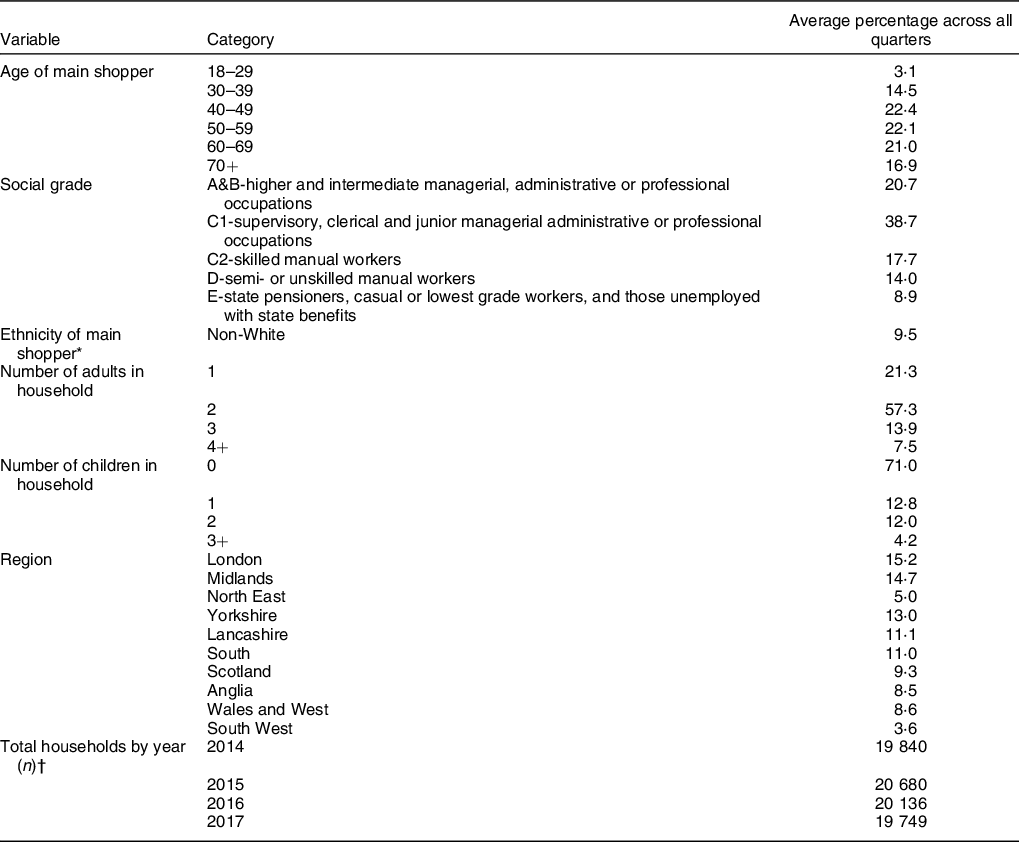
* Ethnicity is missing for 3·4 % of households.
† The total number of households is smaller than the sum of households of each year because most households stayed in the panel for longer than a year.
Total sugar purchased
The total sugar obtained from food and beverages purchased decreased in all social grades by between 6·5 and 7·8 percentage points between 2014 and 2017 (Fig. 1). This is primarily explained by small decreases in the sugar obtained from less healthy products. Sources of household sugar were similar across social grades and remained relatively constant over time: less healthy food contributed to 46–50 % of the total sugar purchased, healthier food to 25–31 % and healthier and less healthy beverages to 12–13 % and 11–14 %, respectively (Fig. 1).
Mean daily sugar amount from food (panel (a)) and beverage (panel (b)) purchases in 2014 and 2017 by occupational social grade*. The totals provided on the top of each bar are the totals across less healthy and healthier sources. The percentage represents the proportion of the total sugar purchased obtained from the category. ![]() , less healthy;
, less healthy; ![]() , healthier. Some puddings, biscuits and bread products, as well as all bacon and sausages, slimming products and milkshake mixes were excluded because of inconsistent nutrient information reported at product-level (5 % of all products)
, healthier. Some puddings, biscuits and bread products, as well as all bacon and sausages, slimming products and milkshake mixes were excluded because of inconsistent nutrient information reported at product-level (5 % of all products)
Results are from generalised linear models with a log-link function estimated with generalised estimating equations.
*Occupation of the main shopper: higher and intermediate managerial, administrative or professional occupations (A&B); supervisory, clerical and junior managerial administrative or professional occupations (C1); skilled manual workers (C2); semi- or unskilled manual workers (D); state pensioners, casual or lowest grade workers, and those unemployed with state benefits (E)
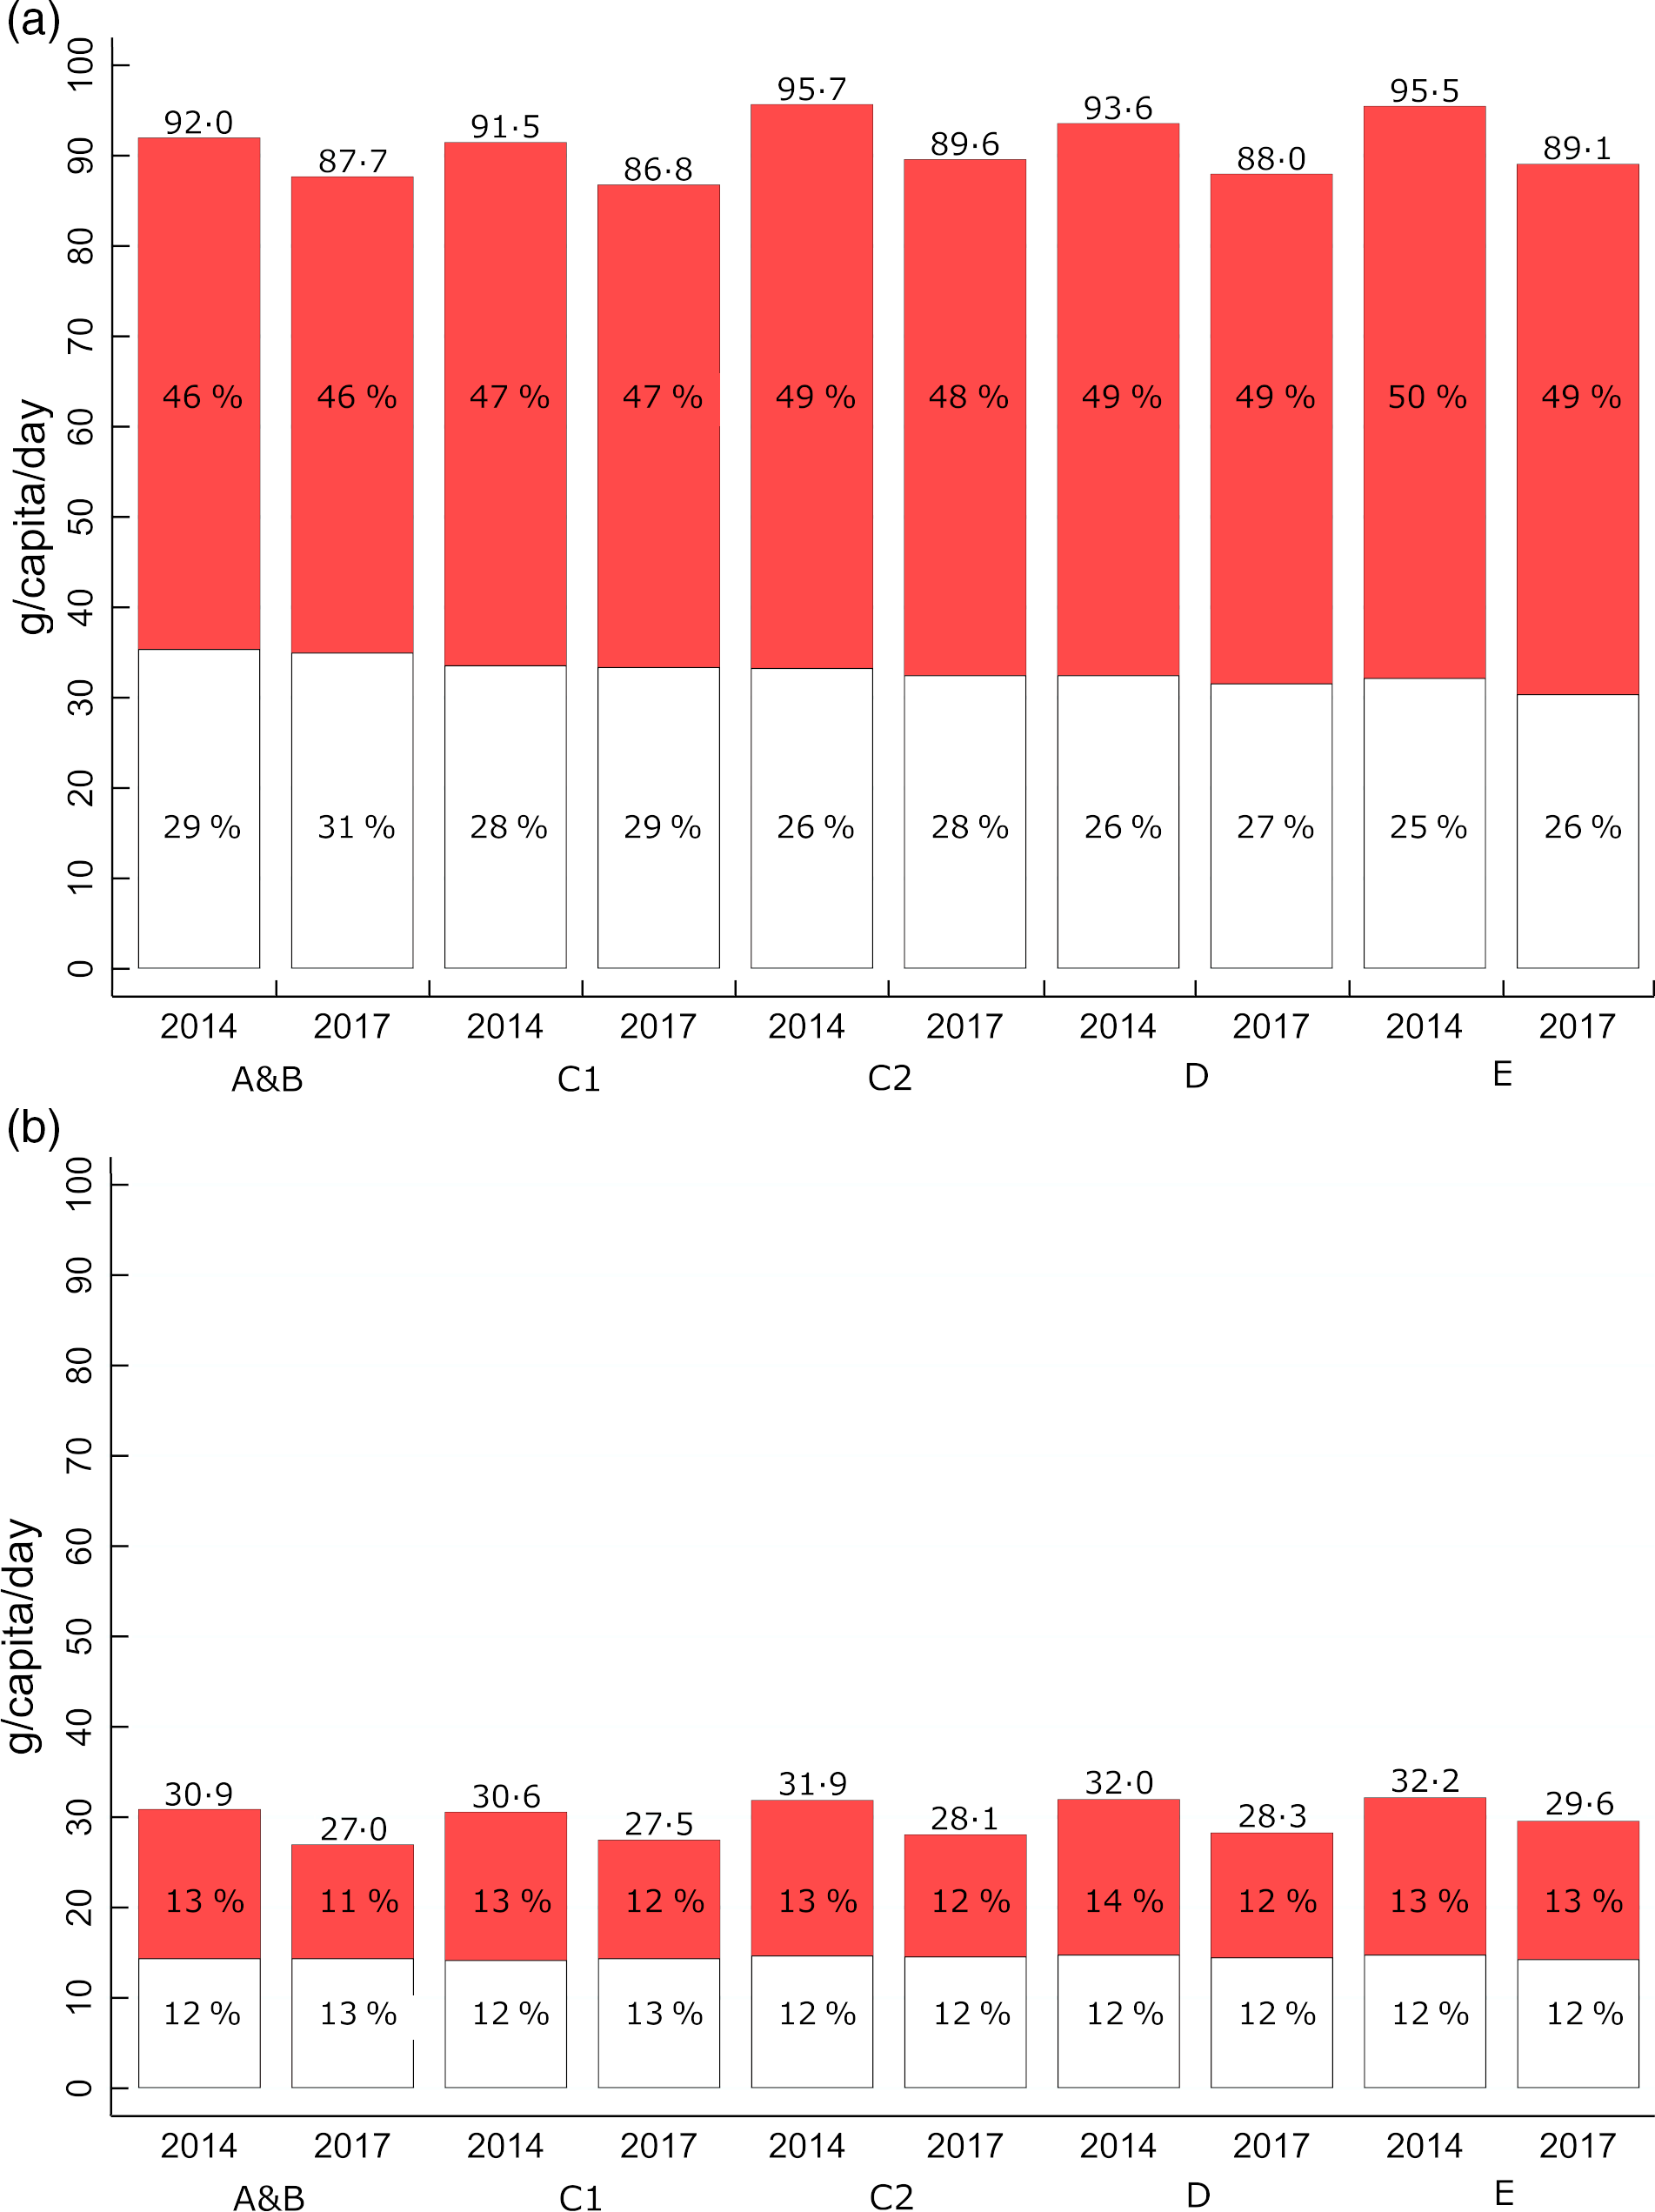
Lower social grades obtained both a lower amount and proportion of sugar from healthier foods. In 2017, the lowest social grade (grade E) obtained 26 % (95 % CI 25, 26) of its sugar from healthier foods, compared with 31 % (95 % CI 30, 31) for the highest social grade (grade A&B). Lower social grades conversely obtained a higher amount and proportion of sugar from less healthy foods and beverages (49 % (95 % CI 49, 49) from less healthy foods and 13 % (95 % CI 12, 13) from less healthy beverages, respectively, for grade E compared to 46 % (95 % CI 45, 46) and 11 % (95 % CI 11, 11) for grade A&B).
Food group contributions to total sugar reduction
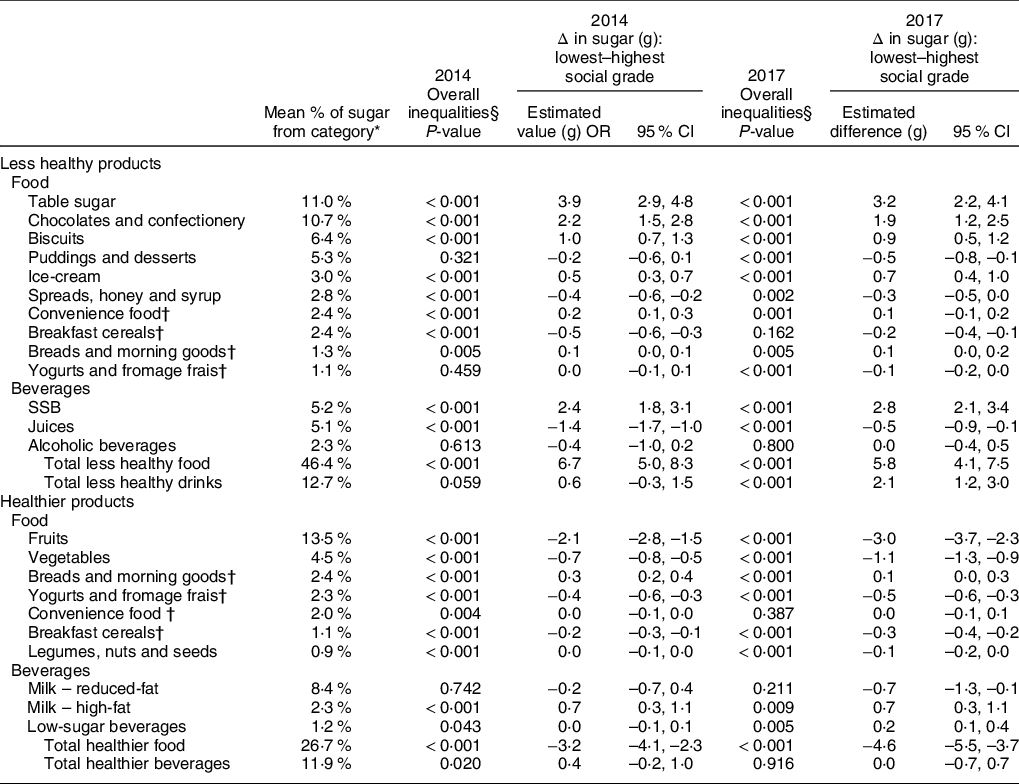
A small number of food groups accounted for most of the decreases in the total sugar purchased between 2014 and 2017. These were very similar across social grades (Table 2). Table sugar was the primary food group for which decreases in sugar were observed in all social grades (–1·9 g to –2·6 g/capita per d (or –15·6 % to –18·8 %) at population mean). It was followed by SSB (–0·9 g to –1·7 g (or –11·3 % to –22·6 %); ranked second or third in all occupation grades) and juices (–0·5 g to –1·4 g (or –9·3 % to –19·8 %); ranked second or third; and seventh for grade E). Alcohol, less healthy breakfast cereals, puddings and desserts and reduced-fat milk followed were all consistently ranked in the top ten food groups for which reductions in sugar purchased were observed.
Changes in sugar purchasing between 2014 and 2017 across occupational social grades* (GB Kantar FMCG panel 2014–2017)
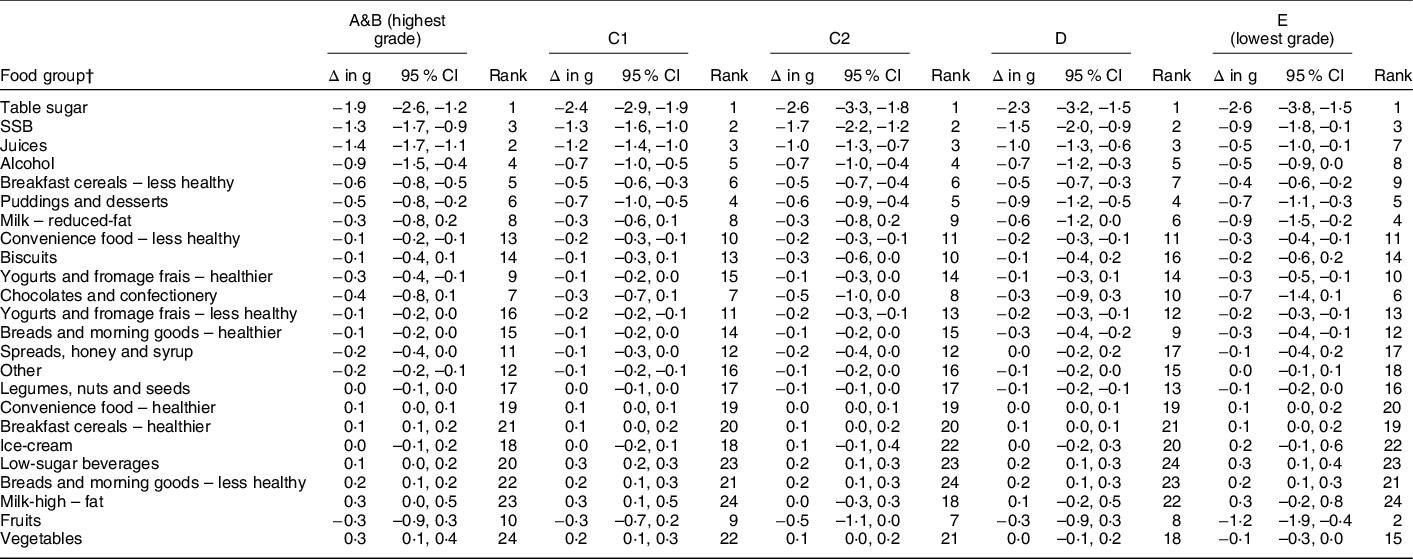
Results are from generalised linear models with a log-link function estimated with generalised estimating equations.
* Occupation of the main shopper: higher and intermediate managerial, administrative or professional occupations (A&B); supervisory, clerical and junior managerial administrative or professional occupations (C1); skilled manual workers (C2); semi- or unskilled manual workers (D); state pensioners, casual or lowest grade workers, and those unemployed with state benefits (E).
† Food groups are ranked according to the estimated change at population-level between 2017 and 2014 as done in(Reference Berger, Cummins and Smith1).
Extent of social inequalities in 2014
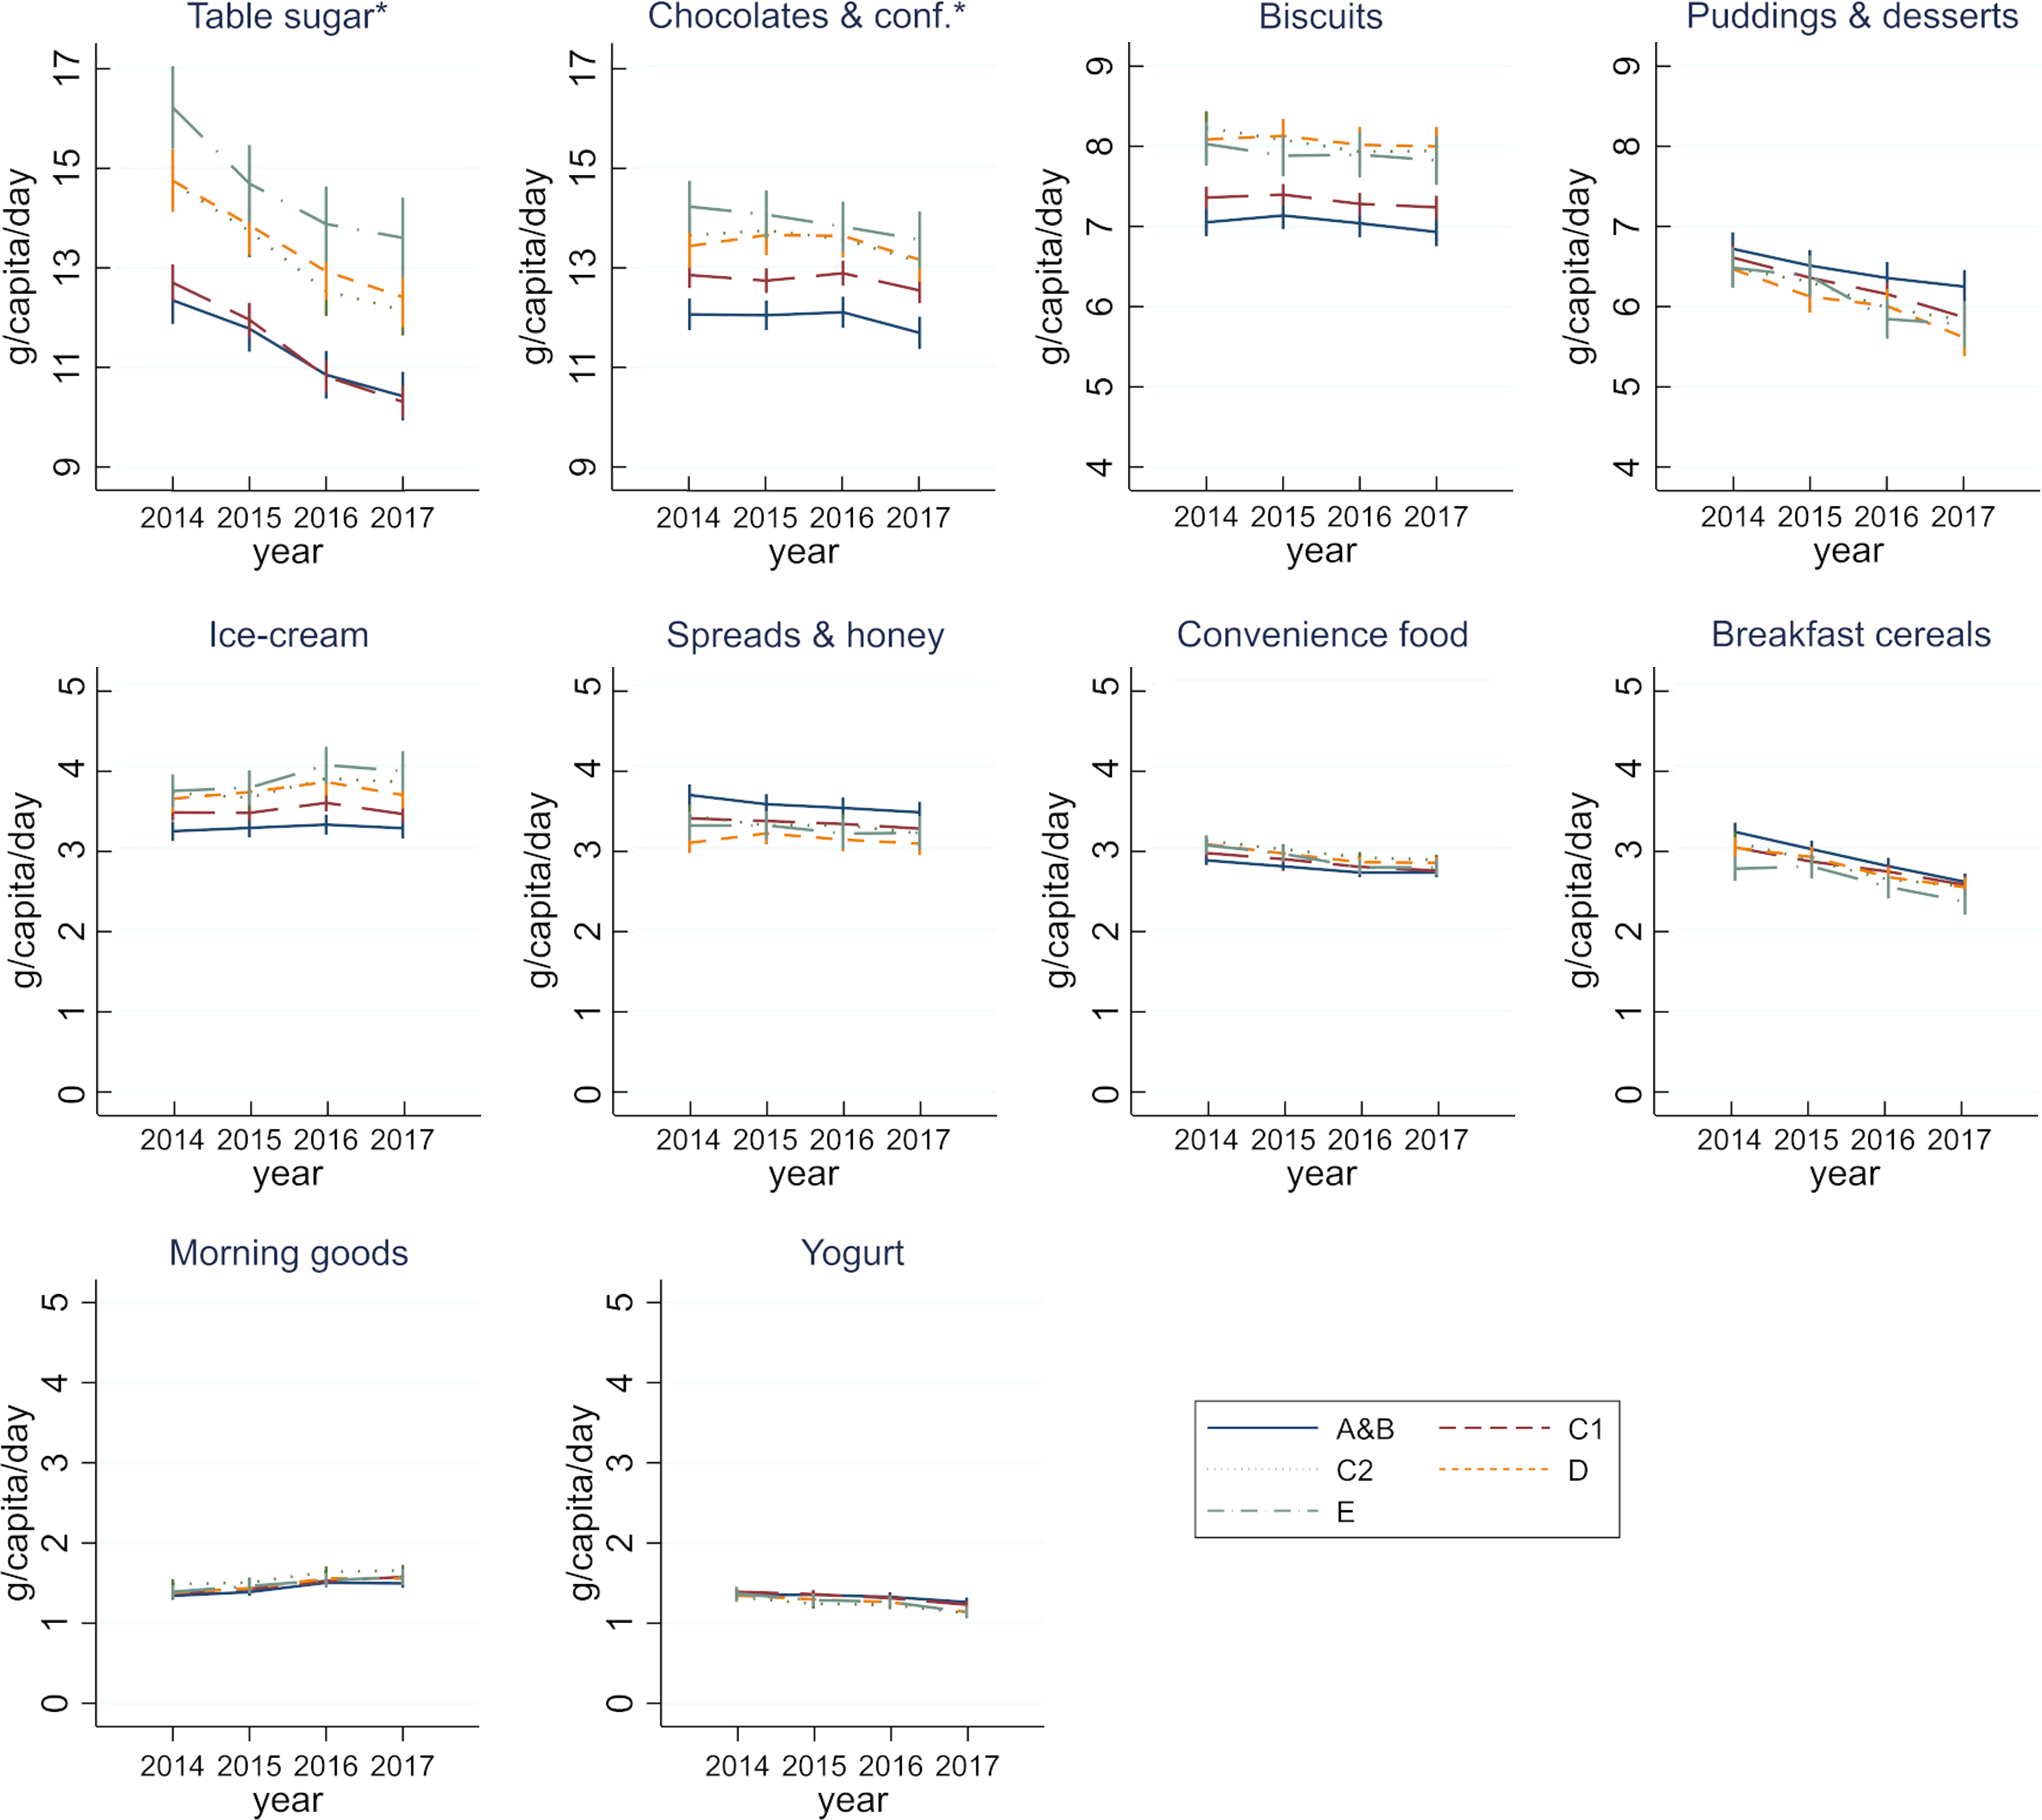
In 2014, strong evidence of overall inequalities between social grades in the sugar purchased was observed for eighteen of the twenty-three food groups (P < 0·01) (Table 3). There was a clear social gradient for most of the food groups (Figures 2 and 3). That is, lower social grades purchased a greater quantity of sugar from a less healthy food group (e.g. biscuits) or a lower quantity of sugar from a healthier food group (e.g. vegetables) compared with those in higher social grades. Differences between the lowest grade (grade E) and the highest grade (grade A&B) were >1 g of sugar/d for five of the food groups (i.e. table sugar, chocolate and confectionery, biscuits, SSB and fruits) (Table 3). A reversed social gradient (i.e. where higher social grades purchased less of healthier or more of less healthy sugar in comparison to lowest social grade) was observed for five food groups (i.e. less healthy breakfast cereals, spreads, honey and syrup, juices, healthier bread and morning goods and high-fat milk). However, differences in this case were smaller in magnitude (the difference between the lowest and the highest social grade was >1 g/d for juices only).
Mean sugar purchases (g) per capita per day for less healthy food by occupational social grade† (GB Kantar FMCG panel 2014–2017). Results are from generalised linear models with a log-link function estimated with generalised estimating equations. Estimated values and 95 % CI are available in Supplementary File
*Y-axis has a different scale than in the other food groups of the figure
†Occupation of the main shopper: higher and intermediate managerial, administrative or professional occupations (A&B); supervisory, clerical and junior managerial administrative or professional occupations (C1); skilled manual workers (C2); semi- or unskilled manual workers (D); state pensioners, casual or lowest grade workers, and those unemployed with state benefits (E)
Summary of changes in social inequalities in sugar purchasing, by food group‡ (GB Kantar FMCG panel 2014–2017)
Results are from generalised linear models with a log-link function estimated with generalised estimating equations.
* 2014–2017 average population-level estimate as done in(Reference Berger, Cummins and Smith1).
† Products separated into healthier v. less healthy groups based on Nutrient Profiling Model.
‡ Less relevant food groups accounting for a total of 2.3 % of sugar purchased are not presented.
§ Statistical test on difference between any of the five occupational social grades (A&B, C1, C2, D, E).
The greatest social gradients were observed for the main sources of sugar (Table 3 and Figs 2 and 3). Differences in sugar purchased between the lowest and the highest social grades (i.e. grades E and A&B, respectively) were 3·9 g (95 % CI 2·9, 4·8) for table sugar, 2·4 g (95 % CI 1·8, 3·1) for SSB, 2·2 g (95 % CI 1·5, 2·8) for chocolate and confectionery and 1·0 g (95 % CI 0·7, 1·3) for biscuits. Conversely, the amount of sugar obtained from healthier products was mostly lower for lower social grades, in particular for fruits and vegetables which were, respectively, 2·1 g (95 % CI 1·5, 2·8) and 0·7 g (95 % CI 0·5, 0·8) lower in grade E compared with A&B (Fig. 4 and Table 3). A reversed noteworthy gradient was observed for high-fat milk which counted for 0·7 g (95 % CI 0·3, 1·1) more of sugar in grade E in comparison with grade A&B (Fig. 3 and Table 3).
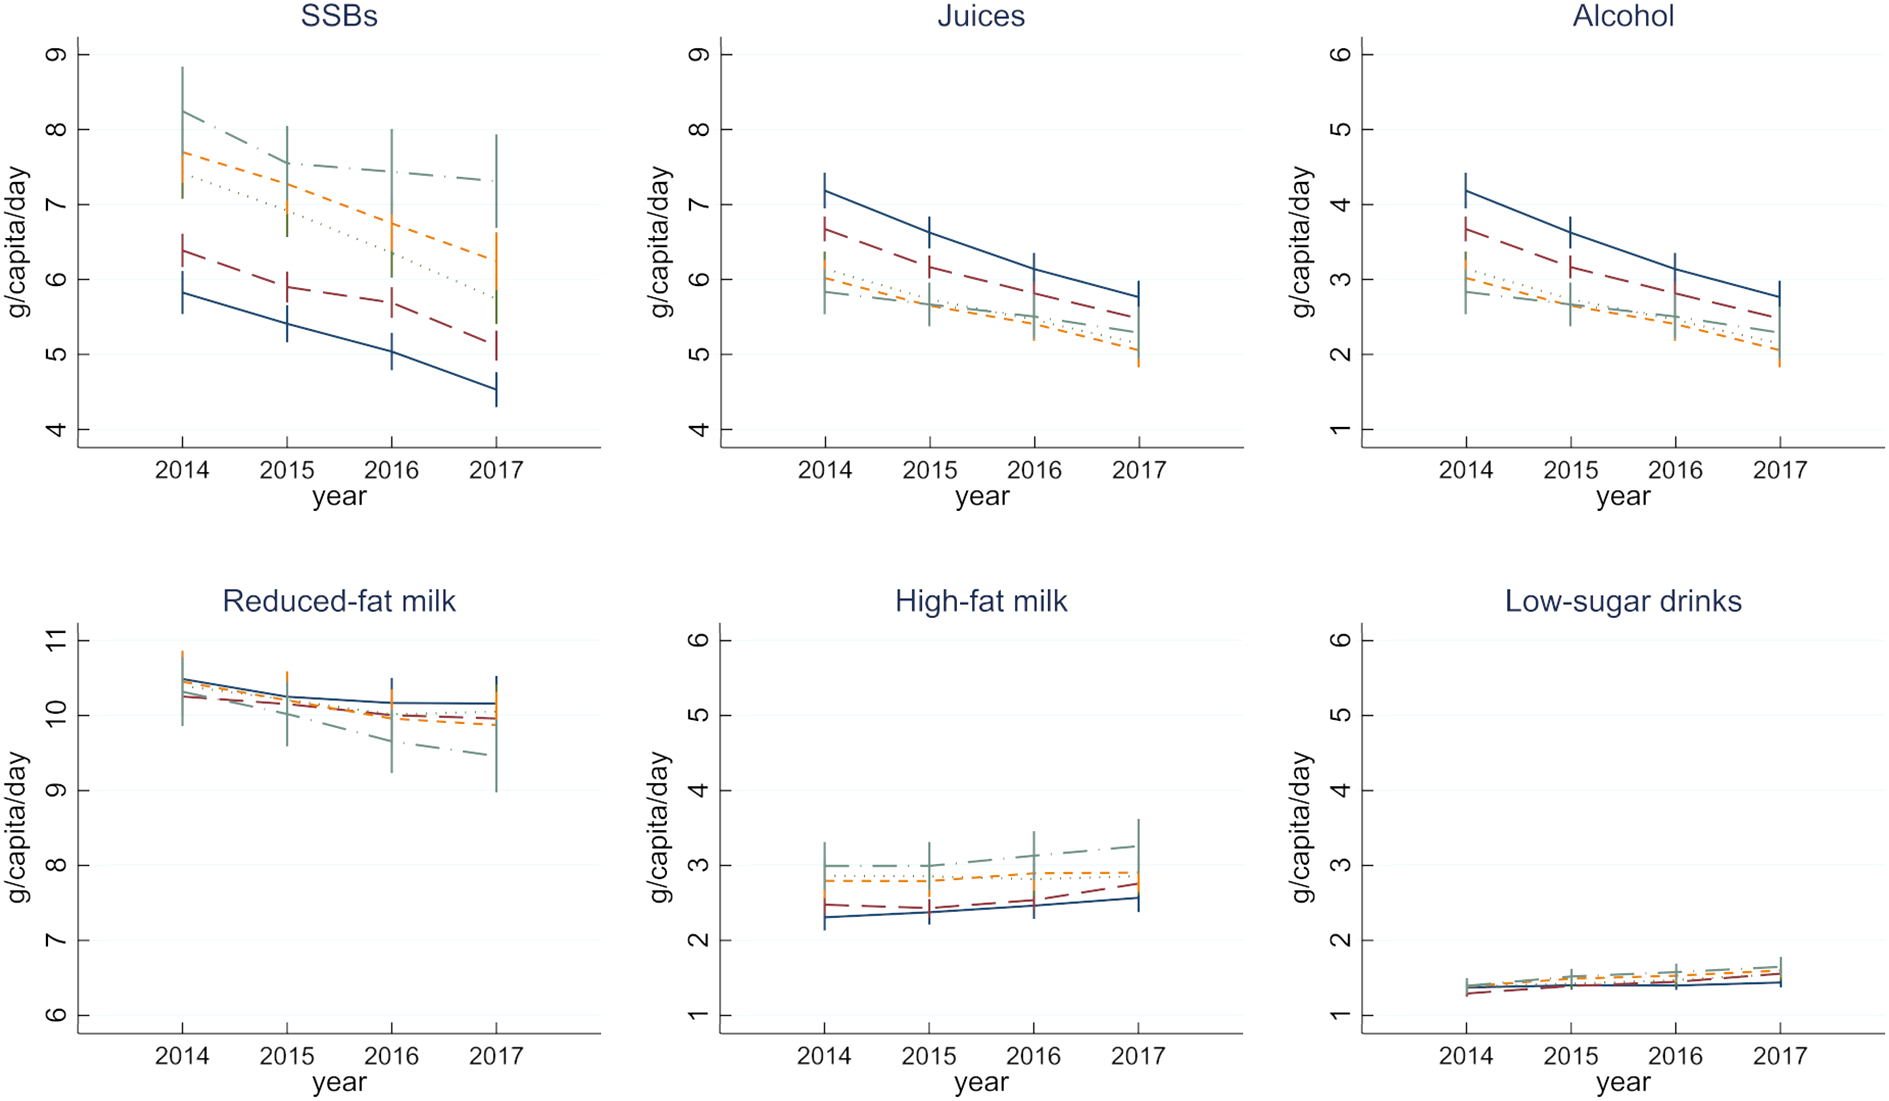
Mean sugar purchases (g) per capita per day for beverages (less healthy and healthy) by occupational social grade† (GB Kantar FMCG panel 2014–2017)
Results are from generalised linear models with a log-link function estimated with generalised estimating equations. Estimated values and 95 % CI are available in Supplementary File
*Y-axis has a different scale than in the other food groups of the figure
†Occupation of the main shopper: higher and intermediate managerial, administrative or professional occupations (A&B); supervisory, clerical and junior managerial administrative or professional occupations (C1); skilled manual workers (C2); semi- or unskilled manual workers (D); state pensioners, casual or lowest grade workers, and those unemployed with state benefits (E)
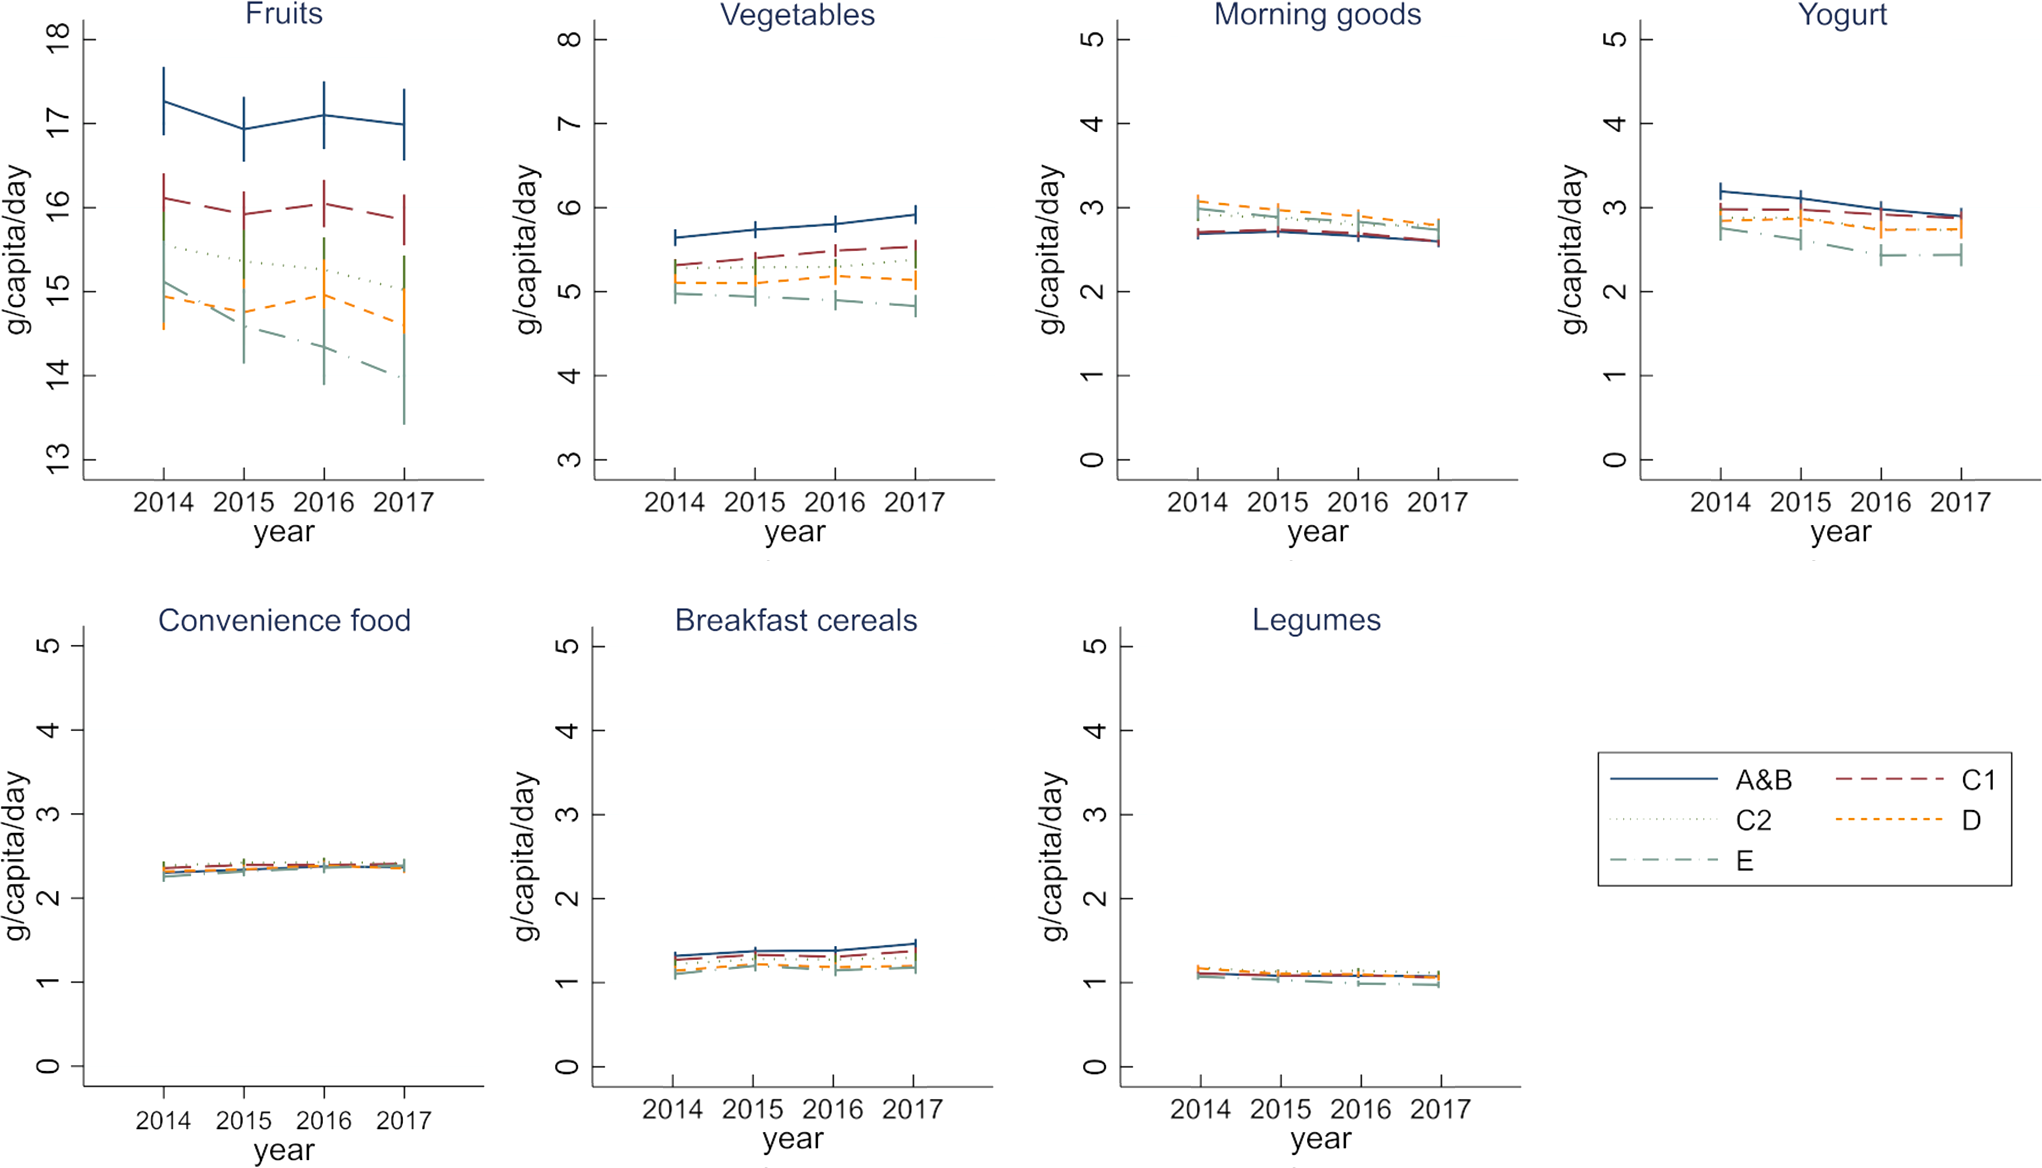
Mean sugar purchases (g) per capita per day for healthier food by occupational social grade† (GB Kantar FMCG panel 2014–2017)
Results are from generalised linear models with a log-link function estimated with generalised estimating equations. Estimated values and 95 % CI are available in Supplementary File
*Y-axis has a different scale than in the other food groups of the figure
†Occupation of the main shopper: higher and intermediate managerial, administrative or professional occupations (A&B); supervisory, clerical and junior managerial administrative or professional occupations (C1); skilled manual workers (C2); semi- or unskilled manual workers (D); state pensioners, casual or lowest grade workers, and those unemployed with state benefits (E)
Effects of declining sugar purchases on social inequalities
In 2017, the patterns of differences between social grades remained similar to those of 2014, with strong evidence of overall inequalities for nineteen of the twenty-three food groups (Table 3). Food groups that were socially patterned remained largely unchanged, with a few exceptions. Small overall inequalities observed in 2014 for less healthy breakfast cereals were not evident in 2017 (overall P = 0·162 in 2017 compared with < 0·001 in 2014), resulting in a small decrease in inequalities between the lowest and the highest social grades from –0·5 g (95 % CI –0·6, 0·3) to –0·2 g (95 % CI –0·4, –0·1). Conversely, reversed social gradients unapparent in 2014 appeared in 2017 for puddings and desserts (–0·5 g (95 % CI –0·8, –0·1)) and less healthy yogurts and fromage frais (–0·1 g (95 % CI –0·2, 0·0)).
There was some indication that inequalities might have increased for all less healthy beverages combined, allowing a social gradient to emerge by 2017. In particular, the lowest social grade (grade E) did not reduce sugar purchases from SSB and juices at the same pace as other groups, resulting in a 2·1 g (95 % CI 1·2, 3·0) difference for less healthy beverages between the lowest and the highest social grades, compared with 0·6 g (95 % CI –0·3, 1·5) in 2014 (Table 3 and Fig. 3).
Evidence for changes in inequalities was observed for some healthier food groups (Table 3). In particular, there was a slight worsening in the gradient in sugar purchased from vegetables, such that in 2017 the sugar purchased by grade E was 1·1 g (95 % CI 0·9, 1·3) lower than in grade A&B (compared with 0·7 g (95 % CI 0·5, 0·8) in 2014, Table 3 and Fig. 4). Other differences in time trends (e.g. healthier breads and morning goods) were of smaller magnitude or did not indicate clear change in the extent of the social gradient. Overall, there was some evidence of differential trends in the purchase of sugar from all categories of healthier food combined, such that by 2017 the lowest social grade obtained 4·6 g (95 % CI 3·7, 5·5) less of sugar than the highest social grade (compared with 3·2 g (95 % CI 2·3, 4·1) in 2014).
Sensitivity analyses
Sensitivity analyses restricted to households who participated across at least twelve quarters (n 13 718) are presented in Supplemental Table S8 in Supplementary File. Results regarding social inequalities are unchanged, and estimated differences between lowest and highest social grades were of similar magnitude across all food groups.
Discussion
We explored changes in the amount of sugar in take-home food and beverage purchases by occupational social grade from 2014 to 2017. At baseline, we observed small inequalities in sugar purchasing such that, overall, lower social grades obtained less, and a lower proportion of sugar from healthier foods. Lower social grades also obtained a higher amount and greater proportion of sugar from less healthy foods and beverages. We found that declines in household sugar purchasing were distributed equally across social grades, so that overall inequalities did neither widen nor reduce. At food-group level, we nonetheless found some evidence that inequalities might have slightly increased, in particular for sugar from SSB and vegetables. Generally, the extent of inequalities across social grades was relatively small, in particular for sugar purchasing from less healthy products. That is, differences between the highest and lowest occupational groups were smaller than the changes between 2014 and 2017 within each group.
The observed decline in the amount of sugar purchased has coincided with a period of heightened policy activity to reduce sugar consumption in the United Kingdom, which might partly explain these trends(Reference Berger, Cummins and Smith1). Notable policy actions include social marketing campaigns to make ‘sugar swaps’ as well as ‘upstream’ interventions, such as the SDIL and Public Health England’s sugar reduction programme. Whereas social marketing campaigns – which rely on a high level of individual agency – are known to be more likely to decrease prevalence of risky behaviour in high socio-economic groups, there is little available evidence to suggest how recent product reformulation might affect socio-economic inequalities(Reference McGill, Anwar and Orton15). Although the purpose of the current study was not to evaluate current policy interventions, one of the main implications of our findings is that recent policy activity overall does not appear to be increasing dietary inequalities, and therefore it is reasonable to suggest that these policies may be equally effective across the social gradient.
A caveat to this overall result is that we found some possible indication that the lowest social grade did not reduce its sugar purchasing from SSB and juices at the same pace as other social grades. This result is corroborated by analyses conducted by Public Health England which noted a smaller relative reduction in the purchase of beverages subject to the SDIL in more disadvantage groups compared with less disadvantaged groups between 2015 and 2018(2). However, the SDIL led to relatively widespread reformulation and replacement of sugar in beverages by non-energetic sweeteners, so that the number of beverages in the levied category decreased over time, which complicates the interpretation of the policy implications of these data. Also, while the reformulations of beverages were already ongoing in 2016 and 2017, the SDIL came into force only in 2018. It is thus important to further analyse whether and how social marketing campaigns, tax and reformulation each contribute to sugar reduction across the social gradient and, in particular, whether they will effectively reduce sugar intake in the most deprived groups in the long run.
Another key finding from the current study is that the majority of the reduction in sugar purchases came from table sugar. In particular, we found that the declines in table sugar purchases were equally distributed across the social gradient. As table sugar is unlikely to be directly affected by price-related policies or product reformulation, this result could either reflect changing macro-trends in food practices (e.g. reduction of home-cooking; decrease in hot beverage consumption) or indicate that the ‘sugar swaps’ campaign, which featured sugar cubes in most of its visuals, might have been effective across social grades, despite the expectation that it might have less of an impact on disadvantaged groups(Reference Adams, Mytton and White11).
Finally, whereas inequalities in fruit and vegetable consumption have been previously documented in GB(Reference Yau, Adams and Monsivais3), the widening social gradient in sugar obtained from vegetables is more difficult to explain and/or to attribute to policy actions because we reported the total sugar amount which does not account for varying sugar content in different vegetable varieties. Therefore, future analyses should focus on the volume and the full nutritional content of vegetables purchased in order to better understand the extent to which changes in sugar obtained from vegetables reflect changes in the quantity and/or quality of vegetables purchased across the social gradient.
Limitations and strengths
The main limitation of our analysis is, in common with other studies, that we were unable to account for out-of-home purchases. These, on average, account for 25 % of total food expenditures in low social grades and 39 % in high social grades(Reference Cornelsen, Berger and Cummins24). Depending on whether types of foods consumed out-of-home by lower socio-economic groups are healthier or less healthy than those consumed by higher socio-economic groups(Reference Williams, Thornton and Ball29), the gradients described in the current study might either be further amplified or reduced. Regardless, trends in inequalities might not be affected because expenditure shared between take-home and out-of-home purchases has been stable during the study period(30), and inflation-adjusted expenditure in take-home purchases has not decreased. It remains possible that the composition of out-of-home food purchased, which tends to be energy-rich and incompatible with dietary guidelines(Reference Lachat, Nago and Verstraeten31,Reference Ziauddeen, Almiron-Roig and Penney32) , might also have changed overall and by socio-economic groups. However, the lack of comparable data on the nutritional content of out-of-home purchases at this level of detail inhibits further analyses of this potential issue.
As we only looked at household-level purchases, we were unable to explore within-household differences or to make inference on sugar intake. In particular, food waste could be a critical issue if reductions or increases in nutrients consumed were not as large as found in the reductions or increases in nutrients sold or purchased. Although the results of waste collection study in GB indicate no statistically significant change in the estimated levels of household food waste between 2012 and 2015(Reference Quested and Parry33), there have been no studies on socio-economic difference in food wastage and little is known whether overall trends in food waste might depend on socio-economic position.
There are also potential limitations related to the type of data used as participants might suffer from fatigue bias, and with reporting becoming less accurate over time. Kantar monitors these potential biases by identifying and excluding problematic panelists, and we have further restricted the analysis to household consistently reporting purchases(Reference Griffith, O’Connell and Smith17). We further applied weights to account for under-reporting of some specific products. Previous studies showed that GB Kantar Fast-Moving Consumer Goods panel data followed the patterns and trends seen in other data sources(Reference Leicester and Oldfield34,Reference Griffith and O’Connell35) .
Finally, we only studied one marker of socio-economic position, which is a limitation in understanding the full role of the combination of markers that are each understood to have a role in determining food choice and diet quality(Reference Darmon and Drewnowski23). Although social grade is known to be a good predictor of purchasing behaviours, further work should also explore whether changes in sugar purchases might be more heterogeneous according to income or education(Reference Smith, Cornelsen and Quirmbach36).
A main strength of the current study is the use of longitudinal product-specific data on daily sugar purchases of a large panel of the Great Britain population. To our knowledge, this is the first study of its kind in GB. Other strengths include objective scanning of purchases that avoids bias inherent in self-reported dietary intake(Reference Lennox, Bluck and Page37,Reference Murakami and Livingstone38) , the large nation-wide sample of households and the ability to monitor yearly trends at detailed food group level.
Conclusion
While the total amount of sugar from take-home purchases of foods and beverages gradually decreased across all socio-economic groups between 2014 and 2017, we found little evidence of widening of socio-economic inequalities in total sugar purchases. This suggests that recent population-level policy activity to reduce sugar consumption in GB does not appear to exacerbate existing socio-economic inequalities in sugar purchasing. Low agency, population-level policies may be the best solution to improving population diet without increasing inequalities.
Acknowledgements
Financial support: This work was supported by the UK Medical Research Council (N.B. and L.C., grant number MR/P021999/1). The funder had no role in the design, analysis or writing of this article. Conflict of interest: None. Authorship: The authors’ responsibilities were as follows – research questions: N.B., S.C., R.D.S. and L.C.; design: N.B., S.C., R.D.S. and L.C.; statistical analysis: N.B.; initial write-up of results: N.B.; writing: N.B., S.C., R.D.S. and L.C.; overall review: N.B., S.C., R.D.S. and L.C. All authors read and approved the final manuscript. Ethics of human subject participation: Ethical approval was not required as the data were obtained in anonymised format. Upon joining the panel, participants agree to the terms and conditions of Kantar Fast-Moving Consumer Goods (see www.kantarworldpanel.com/en for contact details).
Supplementary material
For supplementary material accompanying this paper visit https://doi.org/10.1017/S1368980020005029


