


Multiple socio-environmental determinants of obesity have been previously reported, including social relationships(Reference Holt-Lunstad, Smith and Layton1–Reference Barth, Schneider and Von Känel3). Previous research suggests that more social connections are linked to reduced obesity(Reference Kamiya, Whelan and Timonen4–Reference Hosseini, Veenstra and Khan7). Social tie deficits have been linked to biomarkers of metabolic dysregulation, and both poor marital quality (i.e. one’s global perception of partnership/marriage(Reference Robles, Slatcher and Trombello8)) and lack of perceived social support (i.e. functional or thriving relationships(Reference Feeney and Collins9)) have been found to be associated with obesity(Reference Davidson10,Reference Hessler, Jia and Madsen11) . This research is based on Berkman’s conceptual framework which includes multilevel phenomena to explain how social networks impact health status(Reference Berkman, Glass and Brissette12). This framework indicates four major pathways by which social networks impact an individual’s behaviour including social support(Reference Berkman, Glass and Brissette12) which has not been comprehensively studied.
Current evidence on social ties and obesity is, however, limited by the use of composite measures of social ties and a lack of consideration of gender. Gender is likely an important effect modifier since women and men not only differ in their obesity trajectories(Reference Wang, Yi and Roebothan13) but also differ in their social ties(Reference Fuhrer, Stansfeld and Chemali14) and consequent health impacts(Reference Hessler, Jia and Madsen11). To date, few studies of social ties and obesity report data on women(Reference Lee, Youm and Rhee5,Reference Hosseini, Veenstra and Khan7,Reference Oliveira, Rostila and de Leon15–Reference Shye, Mullooly and Freeborn17) and none considers multiple functional aspects of relationships(Reference Kamiya, Whelan and Timonen4,Reference Oliveira, Rostila and de Leon15,Reference Yang, Li and Ji18–Reference Tymoszuk, Kumari and Batterham21) . One gender-based study assessed emotional support and found that its absence increased obesity risk among men(Reference Oliveira, Rostila and de Leon15). Great scope exists to examine other types of social support (e.g. tangible, informational, belonging) in relation to anthropometric measures and whether and how women and men differ in the way social resources shape weight status. In addition, there is a need to understand the role and relative contribution of different social supports on adiposity in women and men. Previous research on social support has combined functional and structural measures into a composite score(Reference Rutledge, Matthews and Lui16,Reference Kobayashi and Steptoe22,Reference Yang, Boen and Gerken23) , despite the fact that social support is distinct from structural connections (e.g. marital status)(Reference Holt-Lunstad, Smith and Layton1) and has unique influences on health(Reference Holt-Lunstad, Smith and Layton1,Reference Barth, Schneider and Von Känel3,Reference Berkman, Glass and Brissette12) .
This population-based observational study aimed to assess the associations between four types of social support and objectively measured adiposity among women and men. We hypothesise that less social support is linked to greater levels of adiposity in older adults and that the link between each type of social support and adiposity is different between women and men depending on the type of support.
Methods
Study design and population
This cross-sectional study used baseline Comprehensive cohort data (version 4.2, 2012–2015) from the Canadian Longitudinal Study on Aging (CLSA) that included in-home interview, physical assessment and biological sampling (the latter two were conducted at the Data Collection Sites)(Reference Raina, Wolfson and Kirkland24). Clinical examination at Data Collection Sites provided anthropometric measures, and in-home face-to-face computer-assisted interviews provided demographic and social support data on 30 094 community-dwelling Canadian women and men aged 45–85 years. Due to the technical demand for such data collection, random sampling was done to select respondents from Canadians residing within a 25–50 km of the eleven Data Collection Sites which were located in major academic centres in seven provinces and represented the four regions of Canada including the Pacific Coast (Victoria, Vancouver and Surrey), the Prairies (Calgary and Winnipeg), Central Canada (Hamilton, Ottawa, Montréal and Sherbrooke) and the Atlantic Region (Halifax and St. John’s)(Reference Raina, Wolfson and Kirkland24,Reference Raina, Wolfson and Kirkland25) . A target sample size of 30 000 requires each of the Data Collection Sites to collect data from 3000 respondents except for Vancouver and Surrey which each had 1500 respondents. Sampling frames used for the CLSA included provincial healthcare registration databases and random digit dialling(Reference Raina, Wolfson and Kirkland24). Excluded from the CLSA are residents from federal First Nations reserves and other First Nations settlements, the three territories, some remote regions, Canadian Armed Forces full-time members, residents living in institutions, individuals with cognitive impairment and individuals that are not able to respond in English nor French(Reference Raina, Wolfson and Kirkland24).
Anthropometric outcomes
Objectively measured anthropometry included waist circumference (WC), from half-way between last rib and the iliac crest bone in cm, and standing shoeless height (m) and weight (kg) to calculate BMI (kg/m2). The 140-10 Health weigh physician scale and Seca stadiometer 213 were used to measure weight and height at two time points(Reference Raina, Wolfson and Kirkland24). Central obesity was determined by WC ≥ 88 for women and WC ≥ 102 cm for men, and general obesity assessed by BMI ≥ 30 kg/m2(Reference Raina, Wolfson and Kirkland24).
Functional aspects of social ties: social support
Four types of perceived availability of social support were used to assess the functional dimension of social ties. The CLSA used social support questions of the Medical Outcomes Study survey; the validated instrument is reliable and is distinct from measurement of structural social ties (e.g. network size, social activities)(Reference Sherbourne and Stewart26). Participants responded to multiple questions about their perceived availability of informational, tangible, emotional and belonging support using five response options (1 = ‘none’; 2 = ‘a little’; 3 = ‘some’; 4 = ‘most of the time’; 5 = ‘all of the time’)(Reference Sherbourne and Stewart26). A score for informational support (range: 4–20 points) was calculated by summing responses to questions about having someone to give advice for a crisis, to give information to help, to turn to for suggestions about how to deal with a personal problem and someone whose advice is really wanted. Tangible support (range: 4–20 points) concerned availability of help if confined to a bed, someone to take to the doctor, to prepare meals if unable to do so alone or to help with daily chores if sick. Emotional support (range: 6–30 points) comprised questions about having someone who can be counted on to listen when needing to talk, someone to confide in about oneself or problems, someone who shows love and affection, someone who hugs them, someone to share their most private worries and fears with and someone to love and make them feel wanted. Finally, belonging support (range: 4–20 points) reflected having someone to have a good time with, to relax with, to do things to help get one’s mind off things, to do something enjoyable with and who understands one’s problems. For each type of support, the total score was calculated for each respondent and scores were categorised into four levels with the maximum score assigned to those with the ‘highest’ level of support and the remaining distribution being divided into tertiles using gender-specific cut-points for ‘middle-high’, ‘middle-low’ and ‘lowest’.
Co-variables
All analyses included co-variables known to be associated with both the exposure and outcome(Reference Vozikaki, Papadaki and Linardakis6,Reference Yang, Boen and Gerken23–Reference Raina, Wolfson and Kirkland25) , namely age (n 28 799), age squared, education (n 28 799) (less than secondary school; secondary school; some post-secondary education including degree/diploma; university degree), smoking status (n 28 799) (ever/never) and province (n 28 799). Gender-based differences were investigated using self-reported male/female for stratification.
Results were checked for robustness in the sensitivity analysis for other factors that may be additional confounders or are sex-specific biological determinants of obesity(Reference Kamiya, Whelan and Timonen4–Reference Vozikaki, Papadaki and Linardakis6): Indigenous status (Y/N)(Reference Hankivsky and Christoffersen30); chronic conditions (hyper- and hypothyroidism; rheumatoid arthritis; asthma; CVD; cancer, osteoporosis; diabetes; Parkinson’s; and stroke; or relevant medications); blood pressure (systolic and diastolic, mmHg); lifestyle factors (e.g. weekly alcohol intake; daily servings of fruits and vegetables; sleep duration and quality; amount of daily physical activity(Reference Dogra, Good and Buman31)); psychological factors (Center for Epidemiological Studies Depression scale(Reference Radloff and Teri32), life satisfaction and depression medication), and, for women only, reproductive status (i.e. number of biological children (continuous), menopause status (Y/N) and hormone replacement therapy use (ever/never)).
Statistical analysis
Means and standard deviations, and frequencies were used to describe the characteristics of complete cases (n 28 779) across levels of four functional social ties with each continuous and binary outcome variable. Relationships between four measures of social support were tested with relevant statistics. The survey weights were not used as the CLSA Comprehensive cohort only included the Canadian population that resided within 25 km of the Data Collection Sites(Reference Raina, Wolfson and Kirkland24).
The main objective aimed to examine main and independent associations of different types of functional ties with each outcome separately for women and men. We used a series of multivariable linear and logistic regression models stratified by the sex/gender variable (man/woman). We assessed the main associations (i.e. partly adjusted) for each functional tie with each outcome by conditioning on key confounders (age, age squared, education, smoking and province). We further investigated the independent associations for each functional tie with each outcome by also adjusting for all other functional tie variables in addition to co-variables.
To identify the association between each type of support independent of other types of supports, we had to address the high multicollinearity issue between the functional ties (variance inflation factors > 5). Specifically, we performed a principal component analysis on the functional tie variables and then used a subset of these independent principal components from the principal component analysis in the regression models as predictors. Root mean squared error of prediction and R 2 were used to determine how many principal components are required to explain at least 90 % of the data variation. Finally, we back-transformed the estimated coefficients of the principal components to the coefficient estimates of the social support variables and their standard errors using principal components’ scores from the principal component analysis and the delta method(Reference Dunteman, Niemi and Sullivan33) which enabled us to obtain mutually adjusted coefficients for every type of support.
For BMI and WC outcomes, we used a post-estimation analysis to calculate their adjusted mean levels along with their 95 % CI for women and men. We used OR and 95 % CI to report results of abdominal and general obesity. Sensitivity analyses were done on models of the independent associations. Analyses were carried out using R version 4.0.2 (a language and environment for statistical computing. R Foundation for Statistical Computing, 2020).
Results
The mean age of the study participants was 63 (sd 10) years with 51 % of them women (online supplementary material, Supplemental Table 1). Only 45–47 % of women but nearly 55–60 % of men reported the highest level of support, depending on the type (Table 1). Over a third of women were non-smokers, 41 % had the highest education level and nearly half (47 %) had abdominal obesity, whereas over a quarter of men were non-smokers, 50 % had the highest education and 41 % had abdominal obesity. Differences between the highest and lowest levels of each social support were seen for all characteristics, and more so for women than men (Table 1).
Descriptive characteristics across functional social ties among older women and men in the CLSA (2012–2015)

* Abdominal obesity cut-off: males, WC ≥ 102 cm; females, WC ≥ 88.
† General obesity cut-off: BMI ≥ 30 kg/m2.
Main and independent associations between functional social ties and adiposity, in women
After conditioning on known confounders, the lowest amount of each type of social support was associated with higher odds of both general obesity and abdominal obesity in women. Table 2 shows that the odds of general obesity were significantly higher in women with the least informational support (OR = 1·28, 95 % CI 1·16, 1·42), least tangible support (OR = 1·21, 95 % CI 1·09, 1·33), least emotional support (OR = 1·21, 95 % CI 1·03, 1·34) and least belonging support (OR = 1·23, 95 % CI 1·12, 1·36), compared to women with the highest support. Similar results were observed for abdominal obesity in women. In addition, the second lowest amount of emotional support and belonging support was significantly linked to higher odds of abdominal obesity in women (respectively, OR = 1·14 (95 % CI 1·04, 1·25) and OR = 1·10 (95 % CI 1·00, 1·21)), compared with the highest quartile of support (Table 2). When associations were mutually adjusted for all the functional ties, the lowest amount of informational support and the second lowest amount of emotional support remained significantly linked to higher odds of both general obesity (OR = 1·16, 95 % CI 1·02, 1·32) and abdominal obesity (OR = 1·19, 95 % CI 1·10, 1·28).
Main and independent associations between functional social ties and odds of obesity in older women in the CLSA (n 14 627)

* P < 0 05.
† P < 0 01.
‡ P < 0 001.
Gender-specific OR (95 % CI) estimated by multivariable logistic regression analysis adjusted for age, age2, education, smoking and province (main effects).
A PCR model used to eliminate multicollinearity between functional social ties in the analysis of independent effects.
Abdominal obesity cut-off: WC ≥ 88.
General obesity cut-off: BMI ≥ 30 kg/m2.
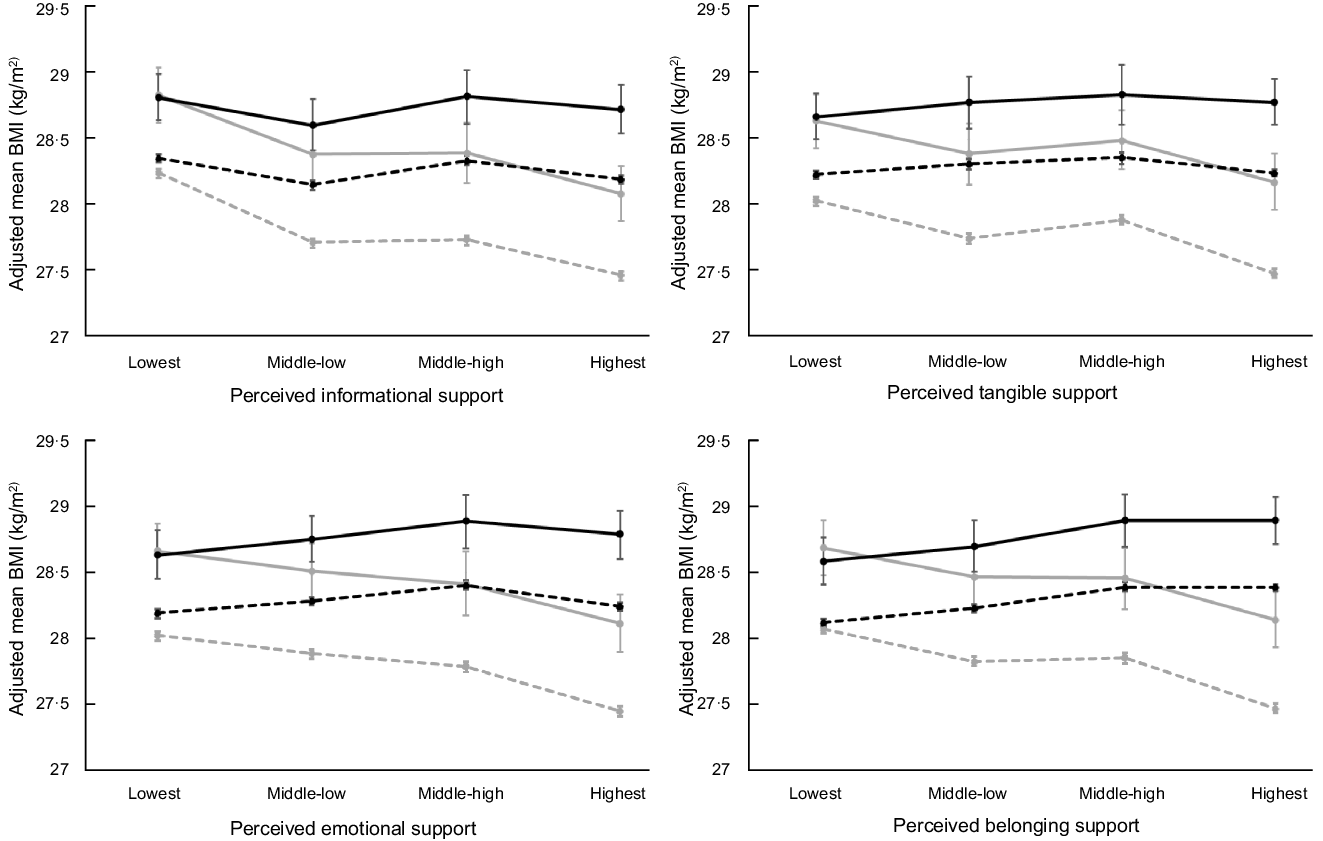
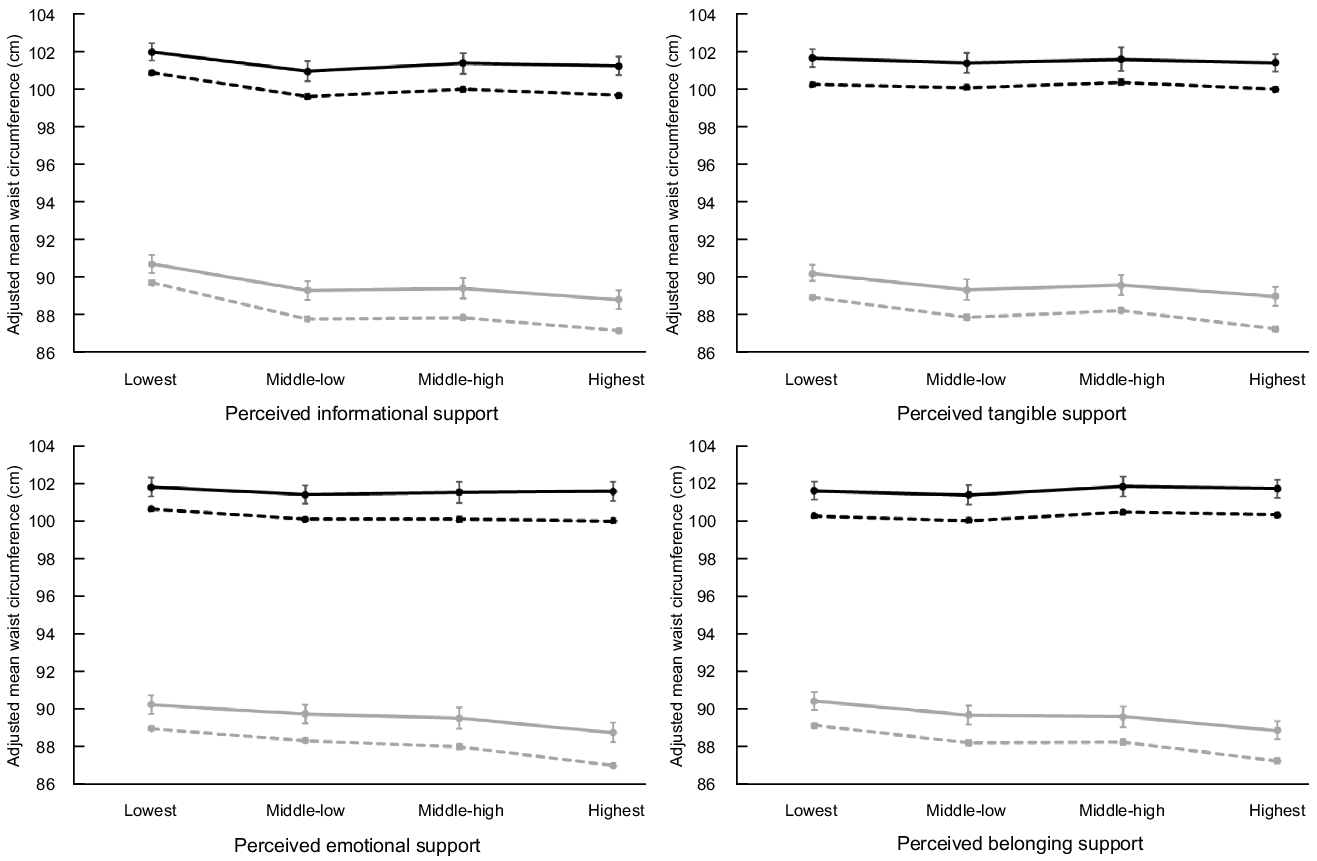
There was also a trend of higher adjusted mean BMI and WC levels in women with less perceived availability of informational support, tangible support, emotional support and belonging support (Figs 1 and 2). The largest differences in adjusted mean BMI (0·75 kg/m2) and WC (1·89 cm) in women were seen for informational support and then for belonging support. Women with the lowest informational support had an average BMI of 28·84 kg/m2 (95 % CI 28·63, 29·05) and an average WC of 90·81 cm (95 % CI 90·31, 91·30) compared to women with the highest informational support (respectively, 28·09 kg/m2 (95 % CI 27·88, 28·30) and 88·92 cm (95 % CI 88·43, 89·4)). Each functional tie remained associated with adjusted mean BMI and WC, with larger differences between extremes, independent of mutually adjusting for all types of social support.
Main and independent associations between social support and predicted mean BMI by gender. Solid lines are predicted mean values for main associations between social support and BMI (adjusted only for co-variables). Dashed lines are predicted mean values for independent associations between social support and BMI (adjusted for co-variables and all supports). Women, grey; men, black. ![]() , covariable-adjusted in women;
, covariable-adjusted in women; ![]() , covariable-adjusted in men;
, covariable-adjusted in men; ![]() , mutually adjusted in women;
, mutually adjusted in women; ![]() , mutually adjusted in men
, mutually adjusted in men
Main and independent associations between social support and predicted mean WC by gender. Solid lines are predicted mean values for main associations between social support and BMI (adjusted only for co-variables). Dashed lines are predicted mean values for independent associations between social support and BMI (adjusted for co-variables and all supports). Women, grey; men, black. ![]() , covariable-adjusted in women;
, covariable-adjusted in women; ![]() , covariable-adjusted in men;
, covariable-adjusted in men; ![]() , mutually adjusted in women;
, mutually adjusted in women; ![]() , mutually adjusted in men
, mutually adjusted in men
Main and independent associations between functional social ties and adiposity, in men
Few main and independent associations were observed in men between each type of social support and adiposity. Compared to men with the highest support, the odds of abdominal obesity were significantly higher when men had the least amount of informational support (OR = 1·22, 95 % CI 1·11, 1·34), tangible support (OR = 1·10, 95 % CI 1·01, 1·20) or emotional support (OR = 1·11, 95 % CI 1·01, 1·23), and general obesity was also more likely in men with the least informational support (OR = 1·14, 95 % CI 1·03, 1·26) compared with the reference (Table 3). However, only informational support was significantly associated with general and abdominal obesity in men, independent of other social supports. General obesity was also independently associated with the two lowest quartiles of tangible support in men (Table 3).
Main and independent associations between functional social ties and odds of obesity in older men in the CLSA (n 14 152)

* P < 0 05.
† P < 0 01.
‡ P < 0 001.
Gender-specific OR (95 % CI) estimated by multivariable logistic regression analysis adjusted for age, age2, education, smoking and province (main effects).
A PCR model used to eliminate multicollinearity between functional social ties in the analysis of independent effects.
Abdominal obesity cut-off: WC ≥ 102 cm.
General obesity cut-off: BMI ≥ 30 kg/m2.
The main and independent associations between each type of support and adjusted mean BMI were less clear and sometimes opposite in men, and there did not appear to be any differences in the adjusted mean WC levels in men across levels of perceived availability of support other than informational (Figs 1 and 2). Notably, adjusted mean BMI levels appeared highest for men with the second highest and/or highest levels of support, with the highest BMI in men with the highest amount of perceived belonging support (28·38 kg/m2 (95 % CI 28·35, 28·4)) rather than the lowest support (28·11 kg/m2 (95 % CI 28·08, 28·14)).
Results of independent associations were robust to multiple model re-specifications adding blood pressure, chronic conditions, Indigenous identity and, for women, reproductive status (online supplementary material, Supplemental Tables 1–4). Additional adjustment for health behaviours attenuated the associations for women between emotional or belonging support and both obesity outcomes; associations with belonging support also became non-significant after adding psychological factors. Among men, lowest quartile of informational support became significantly associated with central obesity after adjusting for health behaviours; however, including health behaviours, psychological factors and blood pressure attenuated associations of tangible support with general obesity in men.
Discussion
This study examined four types of perceived social support in relation to measured adiposity from a gendered perspective. Overall, our hypothesis was that less support of each type would be linked to greater levels of adiposity in older adults and that the link between each type of support and adiposity would differ between women and men depending on the type of support. Our findings largely confirmed that low levels of support were associated with high levels of adiposity, with more significant associations observed among women than men. However, our results also suggested that men with high belonging support were more likely to be obese.
Findings in the context of previous research
The paucity of obesity literature on the functional aspects of social ties is limited to a few European and one American study of only one type of perceived social support (emotional support) or proxies of relationship quality such as social exclusion and negative close relationships(Reference Kamiya, Whelan and Timonen4,Reference Oliveira, Rostila and de Leon15,Reference Hajek and König19–Reference Tymoszuk, Kumari and Batterham21,Reference Yang, Boen and Gerken23) . A cross-sectional(Reference Kamiya, Whelan and Timonen4) and a longitudinal(Reference Tymoszuk, Kumari and Batterham21) study of similarly older-aged British adults found no significant association between emotional support and obesity, except in a subsample of those with a history of CVD in the cross-sectional study for whom lower emotional support was associated with lower odds of obesity(Reference Kamiya, Whelan and Timonen4). By contrast, a longitudinal study in the general Swedish population reported lower emotional support increased obesity risk in men only(Reference Oliveira, Rostila and de Leon15). In this study, main results showed that emotional support (and two other support types) was associated with obesity in men (as well as women), with only informational support independently associated with obesity in both. In a longitudinal US study, researchers found high emotional support from family, friends and spouse resulted in lower WC and BMI in middle and older ages, but results were not gender specific(Reference Yang, Boen and Gerken23). Similar to our results, other European research indicates that poor relationship quality increases WC and BMI in middle-aged working adults(Reference Kouvonen, Stafford and De Vogli20), and social exclusion (a surrogate for belonging support) is linked to obesity only in women(Reference Hajek and König19).
In the broader literature on structural connections, the magnitudes of association for different structural ties and adiposity in the CLSA(Reference Hosseini, Veenstra and Khan7) or other population data(Reference Kamiya, Whelan and Timonen4,Reference Yang, Boen and Gerken23) are larger than those observed for different functional ties in this study. A US study considering both structural and functional indicators in similarly aged adults also found stronger associations with obesity for structural than functional connections that showed modestly variable magnitudes(Reference Yang, Boen and Gerken23). However, they combine very few components of either structural or functional relationships into a summary score, with only emotional support-related questions assessing functional connections. Smaller effect sizes for functional than structural connections are also reported in relation to mortality in two meta-analyses(Reference Holt-Lunstad, Smith and Layton1,Reference Holt-Lunstad, Smith and Baker2) .
We found striking differences in the relationship between social support and adiposity by gender. Fewer significant associations were seen among men. Perceived informational support and emotional support were meaningful for women’s adiposity, whereas only informational support appeared relevant in men. Previous literature has either adjusted for sex/gender as a co-variable in pooled data(Reference Kamiya, Whelan and Timonen4,Reference Yang, Boen and Gerken23) or studies report mixed results(Reference Oliveira, Rostila and de Leon15,Reference Hajek and König19) . Although Oliveira et al. (Reference Oliveira, Rostila and de Leon15) found lower emotional support was linked to BMI only in Swedish men, we only found this association in Canadian women. Notably, this study defined emotional support using six questions and focused on older adults compared with the Swedish study that used only one question and included all adults (18–75 years).
The relatively short Medical Outcomes Study questionnaire has been developed and validated to investigate various dimensions of social support which is essential in the multi-dimensional context of the social support(Reference Sherbourne and Stewart26); these questions are easy to understand and represent unique constructs(Reference Sherbourne and Stewart26). Whereas the Medical Outcomes Study questionnaire combines emotional and informational support, the present study considered the potential gendered nature of these support types, and thus investigated each separately to determine their distinct link to obesity in women and men. Our results support the need to examine emotional support separately from informational and other types since women and men have different preferences for different types of support across the lifespan(Reference Reblin and Uchino34).
Our recent paper on different structural relationships found more pronounced independent associations with adiposity in Canadian women compared with men(Reference Hosseini, Veenstra and Khan7) which parallels this study. One explanation may be that there is a more direct pathway between psychosocial factors and physical health in women. A study of older adults in Brazil found lower social support predicted lower self-rated health, which is strongly correlated with somatic health status only in women(Reference Caetano, Silva and Vettore35). There are numerous gender-based socialisation processes which suggest that older women and men differentially gain metabolic health benefits from social support(Reference Caetano, Silva and Vettore35,Reference Calasanti, Calasanti and Slevin36) . As belonging support resembles having close relationships or friendships to have a good time with(Reference Sherbourne and Stewart26), the quality of this type of relationship may be different for women and men and may explain our finding of why greater belonging support was linked to higher obesity levels in men. This may be due to shared unhealthy habits or behaviours such as diet, alcohol or smoking that may define the masculine experience of belonging support(Reference West37,Reference Courtenay38) . An alternative explanation for our results is the potential for weight to shape the perceived availability of social support more so for women than men in this cross-sectional study, and there is ethnographic evidence supporting the gendered experience of women’s body weights as an expected identifier for suitability as a romantic partner(Reference Ellison, McPhail and Mitchinson39).
The absence or presence of social support is postulated to indirectly link reduced structural connections and survival through physiological dysregulation(Reference Smith, Uchino and Florsheim40). Social support can be important for metabolic outcomes since support can bring access to instrumental aid and informational resources or buffer the effects of stressful life events through emotional or tangible support(Reference Berkman, Glass and Brissette12,Reference Cohen and Wills41) . This study showed informational support was consistently independently associated with adiposity in both women and men. By contrast, emotional and tangible support were linked to obesity in a gendered way, depending on the measures. This study’s unique consideration of mutually reinforcing supports adds distinct value to this under-developed literature that traditionally only assess emotional support. The relative contribution of informational support to adiposity has implications for improving clinical care and community strategies for people living with obesity. Moreover, the fact that emotional support was also relatively important for adiposity outcomes in women further implies that effective obesity prevention and management in women will require strategies to provide both information and emotional support.
Strengths and limitations
This study’s cross-sectional design limits causal inference so it is plausible that obesity caused low levels of support. Estimates of association may be biased from measurement error of self-reported variables including perceived availability of social support. The multi-faceted social construct of gender could not be assessed, though our study contributes estimates specific to women and men using self-reported male/female which represents sex and/or gender identity in the CLSA(Reference Ismail, Hammond and Wilson42). The population included in CLSA reflects seniors who are healthy and independent and thus may have limited need for tangible support. Despite considering many different co-variables in main and sensitivity analyses, residual confounding remains a limitation. Our results are also limited to the CLSA Comprehensive cohort which is nationally representative of Canadians residing within 25–50 km from one of the ten Data Collection Sites in only seven provinces. Finally, the study population of middle- and older-aged Canadians living near urban centres limits generalisability to other settings and populations.
The large sample size, gender-sensitive analysis, multivariable adjustment, objectively measured obesity and multiple exposures were major study strengths. The most important strength of this study is that we considered both the main and independent associations of four types of functional connections in relation to multiple adiposity measures. Another significant strength is reporting results separately for women and men to improve the targeting of obesity prevention.
Conclusions
Findings showed four types of social support were associated with abdominal and general obesity, especially among middle- and older-aged women in Canada. If validated in prospective studies, this would have implications for weight management interventions to include informational support for both women and men as well as emotional support for women. Policy-makers may consider the potential role of informational support in healthy ageing and therefore facilitating community-based interventions that provide informational support for older women and men. This study adds novel empirical evidence in a sparse literature that lacks specificity of social support and attention to gender. Further studies are warranted to prospectively investigate the link between social support and metabolic health and how effects may vary for women compared with men.
Acknowledgements
Acknowledgements: This research was made possible using the data/biospecimens collected by the Canadian Longitudinal Study on Aging (CLSA). Funding for the Canadian Longitudinal Study on Aging (CLSA) is provided by the Government of Canada through the Canadian Institutes of Health Research (CIHR) under grant reference: LSA 94473 and the Canada Foundation for Innovation. This research has been conducted using the CLSA Baseline Comprehensive Dataset version 4.0, under Application Number 19CA003. The CLSA is led by Drs. Parminder Raina, Christina Wolfson and Susan Kirkland. Financial support: This study was funded by the Canadian Institutes of Health Research (grant #162987). The funders had no role in study design, data collection and analysis, decision to publish or writing of the manuscript. Conflict of interest: There are no conflicts of interest. Authorship: A.C., Z.H., N.K. and G.V. formulated the research questions and the designing of the study, A.S., Z.H. and A.C. carried it out and analysed the data, A.C., Z.H. and A.S. wrote the article, all authors contributed in revising the article and A.C. supervised the study. Ethics of human subject participation: All CLSA participants gave written informed consent. This secondary analysis study was approved by the University of British Columbia Behavioural Research Ethics Board (H19-00971).
Supplementary material
For supplementary material accompanying this paper visit https://doi.org/10.1017/S1368980021003724


