1 Introduction
The space and astrophysical plasmas that fill the heliosphere, and other more remote astrophysical environments, are found generally to be both magnetized and turbulent. Understanding the removal of energy from turbulent fluctuations in a magnetized plasma and the consequent energization of the constituent plasma particles is a major goal of heliophysics and astrophysics. Although plasma heating and particle energization are governed by microscopic processes typically occurring at kinetic length scales in the plasma, these important energy transport mechanisms can have a significant impact on the macroscopic evolution of the systems. For example, the diffuse plasma of the solar corona is found to be nearly three orders of magnitude hotter than the solar photosphere. The dissipation of turbulent fluctuations, through a physical mechanism, that is poorly understood at present, is believed to be responsible for this dramatic heating of the coronal plasma. This very high coronal temperature leads to the supersonic solar wind that pervades the entire heliosphere (Parker Reference Parker1958), so the kinetic plasma physics governing the heating of the coronal plasma at small scales indeed impacts the global structure of the heliosphere.
The low density and high temperature conditions of the plasma in many astrophysical systems lead to a mean free path for collisions among the constituent charged particles that is often much longer than the length scales of the turbulent fluctuations. Under such weakly collisional plasma conditions, the dynamics of the turbulence and its dissipation is governed by kinetic plasma physics. Unlike in the more well-known case of fluid systems (which corresponds to the strongly collisional regime), in weakly collisional plasmas, the dissipation of turbulent energy into plasma heat is inherently a two-step process (Howes Reference Howes2017). First, energy is removed from the turbulent electromagnetic fluctuations through collisionless interactions between the fields and particles, transferring that energy to non-thermal fluctuations in the particle velocity distribution functions, a process that is reversible. Subsequently, arbitrarily weak collisions can smooth out the small fluctuations in velocity space, leading to entropy increase and irreversible heating of the plasma (Howes et al. Reference Howes, Cowley, Dorland, Hammett, Quataert and Schekochihin2006; Howes Reference Howes2008; Schekochihin et al. Reference Schekochihin, Cowley, Dorland, Hammett, Howes, Quataert and Tatsuno2009). In this two-step process, the removal of energy from turbulent fluctuations and the subsequent conversion of that energy into plasma heat may even occur at different locations (Navarro et al. Reference Navarro, Teaca, Told, Groselj, Crandall and Jenko2016).
In fluid simulations of plasma turbulence using the magnetohydrodynamic (MHD) approximation – a strongly collisional limit of the large-scale dynamics (relative to the characteristic kinetic plasma length scales) – the nonlinear evolution leads to the development of intermittent current sheets (Matthaeus & Montgomery Reference Matthaeus and Montgomery1980; Meneguzzi, Frisch & Pouquet Reference Meneguzzi, Frisch and Pouquet1981). Furthermore, it has been found that the dissipation of turbulent energy is largely concentrated in these intermittent current sheets (Uritsky et al. Reference Uritsky, Pouquet, Rosenberg, Mininni and Donovan2010; Osman et al. Reference Osman, Matthaeus, Greco and Servidio2011; Zhdankin et al. Reference Zhdankin, Uzdensky, Perez and Boldyrev2013). Numerous studies have recently sought evidence for the spatial localization of plasma heating by the dissipation of turbulence in current sheets through statistical analyses of solar wind observations (Borovsky & Denton Reference Borovsky and Denton2011; Osman et al. Reference Osman, Matthaeus, Greco and Servidio2011, Reference Osman, Matthaeus, Wan and Rappazzo2012; Perri et al. Reference Perri, Goldstein, Dorelli and Sahraoui2012; Wang et al. Reference Wang, Tu, He, Marsch and Wang2013; Wu et al. Reference Wu, Perri, Osman, Wan, Matthaeus, Shay, Goldstein, Karimabadi and Chapman2013; Osman et al. Reference Osman, Matthaeus, Gosling, Greco, Servidio, Hnat, Chapman and Phan2014) and numerical simulations (Wan et al. Reference Wan, Matthaeus, Karimabadi, Roytershteyn, Shay, Wu, Daughton, Loring and Chapman2012; Karimabadi et al. Reference Karimabadi, Roytershteyn, Wan, Matthaeus, Daughton, Wu, Shay, Loring, Borovsky and Leonardis2013; TenBarge & Howes Reference TenBarge and Howes2013; Wu et al. Reference Wu, Perri, Osman, Wan, Matthaeus, Shay, Goldstein, Karimabadi and Chapman2013; Zhdankin et al. Reference Zhdankin, Uzdensky, Perez and Boldyrev2013).
The mechanisms of the spatially localized dissipation found in MHD simulations are resistive (ohmic) heating and viscous heating (Zhdankin et al. Reference Zhdankin, Uzdensky, Perez and Boldyrev2013; Brandenburg Reference Brandenburg2014; Zhdankin, Uzdensky & Boldyrev Reference Zhdankin, Uzdensky and Boldyrev2015). However, resistivity and viscosity arise from microscopic collisions in the strongly collisional (or small mean free path) limit, a limit that is not applicable to the dynamics of dissipation in many space and astrophysical environments (Howes Reference Howes2017). Under the weakly collisional conditions appropriate for most space and astrophysical plasmas, which physical mechanisms are responsible for the damping of the turbulent fluctuations and the consequent energization of the plasma particles remains an open question. Our aim here is to identify the mechanisms governing the damping of the turbulent fluctuations and the particle energization using a kinetic simulation code that follows the three-dimensional evolution of a weakly collisional plasma in which current sheets develop self-consistently.
Early research on incompressible MHD turbulence in the 1960s (Iroshnikov Reference Iroshnikov1963; Kraichnan Reference Kraichnan1965) emphasized the wave-like nature of turbulent plasma motions, suggesting that nonlinear interactions between counterpropagating Alfvén waves – or simply Alfvén wave collisions – mediate the turbulent cascade of energy from large to small scales. In fact, the physics of the nonlinear interactions among Alfvén waves provides the foundation for modern scaling theories of plasma turbulence that explain the anisotropic nature of the turbulent cascade (Goldreich & Sridhar Reference Goldreich and Sridhar1995) and the dynamic alignment of velocity and magnetic field fluctuations (Boldyrev Reference Boldyrev2006).
Following a number of previous investigations of weak incompressible MHD turbulence (Sridhar & Goldreich Reference Sridhar and Goldreich1994; Ng & Bhattacharjee Reference Ng and Bhattacharjee1996; Galtier et al. Reference Galtier, Nazarenko, Newell and Pouquet2000), the nonlinear energy transfer in Alfvén wave collisions in the weakly nonlinear limit has been solved analytically (Howes & Nielson Reference Howes and Nielson2013), confirmed numerically with gyrokinetic numerical simulations (Nielson, Howes & Dorland Reference Nielson, Howes and Dorland2013), and verified experimentally in the laboratory (Howes et al. Reference Howes, Drake, Nielson, Carter, Kletzing and Skiff2012, Reference Howes, Nielson, Drake, Schroeder, Skiff, Kletzing and Carter2013; Drake et al. Reference Drake, Schroeder, Howes, Kletzing, Skiff, Carter and Auerbach2013), establishing Alfvén wave collisions as the fundamental building block of astrophysical plasma turbulence. More recent research has found that Alfvén wave collisions in the strongly nonlinear limit naturally generate current sheets (Howes Reference Howes2016), providing a first-principles explanation for the ubiquitous development of spatially localized current sheets in plasma turbulence. This self-consistent generation of current sheets is found to persist even in the more realistic case of strong collisions between localized Alfvén wavepackets (Verniero, Howes & Klein Reference Verniero, Howes and Klein2018).
Here we explore the damping of the electromagnetic fluctuations and the associated energization of particles that occurs in current sheets that are generated self-consistently by strong Alfvén wave collisions. Previous work using a simulation of kinetic Alfvén wave turbulence has shown that, although enhanced plasma heating rates are well correlated with the presence of current sheets, the rate of heating as a function of wavenumber is well predicted by assuming that linear Landau damping is entirely responsible for the removal of energy from the turbulence (TenBarge & Howes Reference TenBarge and Howes2013). This result suggests that the physical mechanism governing the removal of energy from turbulent fluctuations, even in spatially localized current sheets, is Landau damping. Using nonlinear gyrokinetic simulations of strong Alfvén wave collisions, we aim to answer two questions:
-
(i) Is the dissipation associated with current sheets that are generated by strong Alfvén wave collisions spatially localized?
-
(ii) What is the physical mechanism governing the removal of energy from the turbulence and the consequent energization of the particles?
In § 2, we describe the set-up of this nonlinear gyrokinetic simulation of a strong Alfvén wave collision. Section 3 presents a detailed look at the evolution of the energy in the simulation, in particular introducing a simple model of the energy flow in this weakly collisional plasma system, shown in figure 4, and applying that model to interpret the flow of energy from turbulence to ion and electron heat. The development of current sheets and spatial localization of particle energization is explored in § 4, followed by a detailed investigation of the physical mechanism of energy transfer from turbulent fluctuations to particle energy using the field–particle correlation technique in § 5. We conclude in § 6 by summarizing the results of our investigation, demonstrating that Landau damping plays a key role in the spatially non-uniform energization of plasma particles near current sheets arising from strong Alfvén wave collisions.
2 Simulation
Similar to a previous study showing the development of current sheets in strong Alfvén wave collisions (Howes Reference Howes2016), we employ the astrophysical gyrokinetics code AstroGK (Numata et al.
Reference Numata, Howes, Tatsuno, Barnes and Dorland2010) to perform a gyrokinetic simulation of the nonlinear interaction between two counterpropagating Alfvén waves in the strongly nonlinear limit. AstroGK evolves the perturbed gyroaveraged distribution function
 $h_{s}(x,y,z,\unicode[STIX]{x1D706},\unicode[STIX]{x1D700})$
for each species
$h_{s}(x,y,z,\unicode[STIX]{x1D706},\unicode[STIX]{x1D700})$
for each species
 $s$
, the scalar potential
$s$
, the scalar potential
 $\unicode[STIX]{x1D711}$
, the parallel vector potential
$\unicode[STIX]{x1D711}$
, the parallel vector potential
 $A_{\Vert }$
and the parallel magnetic field perturbation
$A_{\Vert }$
and the parallel magnetic field perturbation
 $\unicode[STIX]{x1D6FF}B_{\Vert }$
according to the gyrokinetic equation and the gyroaveraged Maxwell’s equations (Frieman & Chen Reference Frieman and Chen1982; Howes et al.
Reference Howes, Cowley, Dorland, Hammett, Quataert and Schekochihin2006). Velocity-space coordinates are
$\unicode[STIX]{x1D6FF}B_{\Vert }$
according to the gyrokinetic equation and the gyroaveraged Maxwell’s equations (Frieman & Chen Reference Frieman and Chen1982; Howes et al.
Reference Howes, Cowley, Dorland, Hammett, Quataert and Schekochihin2006). Velocity-space coordinates are
 $\unicode[STIX]{x1D706}=v_{\bot }^{2}/v^{2}$
and
$\unicode[STIX]{x1D706}=v_{\bot }^{2}/v^{2}$
and
 $\unicode[STIX]{x1D700}=v^{2}/2$
. The domain is a periodic box of size
$\unicode[STIX]{x1D700}=v^{2}/2$
. The domain is a periodic box of size
 $L_{\bot }^{2}\times L_{\Vert }$
, elongated along the straight, uniform mean magnetic field
$L_{\bot }^{2}\times L_{\Vert }$
, elongated along the straight, uniform mean magnetic field
 $\boldsymbol{B}_{0}=B_{0}\hat{\boldsymbol{z}}$
, where all quantities may be rescaled to any parallel dimension satisfying
$\boldsymbol{B}_{0}=B_{0}\hat{\boldsymbol{z}}$
, where all quantities may be rescaled to any parallel dimension satisfying
 $L_{\Vert }/L_{\bot }\gg 1$
. Uniform Maxwellian equilibria for ions (protons) and electrons are chosen, with a reduced mass ratio
$L_{\Vert }/L_{\bot }\gg 1$
. Uniform Maxwellian equilibria for ions (protons) and electrons are chosen, with a reduced mass ratio
 $m_{i}/m_{e}=36$
such that, even with the modest spatial resolution of this simulation, the collisionless damping by ions and electrons is sufficiently strong within the resolved range of length scales to terminate the nonlinear transfer of energy to small scales. In appendix A, we discuss the implications of this reduced mass ratio on the relative collisionless damping between ions and electrons. Spatial dimensions
$m_{i}/m_{e}=36$
such that, even with the modest spatial resolution of this simulation, the collisionless damping by ions and electrons is sufficiently strong within the resolved range of length scales to terminate the nonlinear transfer of energy to small scales. In appendix A, we discuss the implications of this reduced mass ratio on the relative collisionless damping between ions and electrons. Spatial dimensions
 $(x,y)$
perpendicular to the mean field are treated pseudospectrally; an upwind finite-difference scheme is used in the parallel direction,
$(x,y)$
perpendicular to the mean field are treated pseudospectrally; an upwind finite-difference scheme is used in the parallel direction,
 $z$
. Collisions employ a fully conservative, linearized collision operator with energy diffusion and pitch-angle scattering (Abel et al.
Reference Abel, Barnes, Cowley, Dorland and Schekochihin2008; Barnes et al.
Reference Barnes, Abel, Dorland, Ernst, Hammett, Ricci, Rogers, Schekochihin and Tatsuno2009).
$z$
. Collisions employ a fully conservative, linearized collision operator with energy diffusion and pitch-angle scattering (Abel et al.
Reference Abel, Barnes, Cowley, Dorland and Schekochihin2008; Barnes et al.
Reference Barnes, Abel, Dorland, Ernst, Hammett, Ricci, Rogers, Schekochihin and Tatsuno2009).
To set-up the simulation of an Alfvén wave collision, following Nielson et al. (Reference Nielson, Howes and Dorland2013), we initialize two perpendicularly polarized, counterpropagating plane Alfvén waves,
 $\boldsymbol{z}^{+}=z_{+}\cos (k_{\bot }x-k_{\Vert }z-\unicode[STIX]{x1D714}_{0}t)\hat{\boldsymbol{y}}$
and
$\boldsymbol{z}^{+}=z_{+}\cos (k_{\bot }x-k_{\Vert }z-\unicode[STIX]{x1D714}_{0}t)\hat{\boldsymbol{y}}$
and
 $\boldsymbol{z}^{-}=z_{-}\cos (k_{\bot }y+k_{\Vert }z-\unicode[STIX]{x1D714}_{0}t)\hat{\boldsymbol{x}}$
, where
$\boldsymbol{z}^{-}=z_{-}\cos (k_{\bot }y+k_{\Vert }z-\unicode[STIX]{x1D714}_{0}t)\hat{\boldsymbol{x}}$
, where
 $\unicode[STIX]{x1D714}_{0}=k_{\Vert }v_{A}$
,
$\unicode[STIX]{x1D714}_{0}=k_{\Vert }v_{A}$
,
 $k_{\bot }=2\unicode[STIX]{x03C0}/L_{\bot }$
,
$k_{\bot }=2\unicode[STIX]{x03C0}/L_{\bot }$
,
 $k_{\Vert }=2\unicode[STIX]{x03C0}/L_{\Vert }$
and perpendicular and parallel are determined relative to the equilibrium magnetic field. Here
$k_{\Vert }=2\unicode[STIX]{x03C0}/L_{\Vert }$
and perpendicular and parallel are determined relative to the equilibrium magnetic field. Here
 $\boldsymbol{z}^{\pm }=\boldsymbol{u}\pm \unicode[STIX]{x1D6FF}\boldsymbol{B}/\sqrt{4\unicode[STIX]{x03C0}(n_{i}m_{i}+n_{e}m_{e})}$
are the Elsasser fields (Elsasser Reference Elsasser1950) which represent Alfvén waves that propagate up or down the mean magnetic field at the Alfvén velocity
$\boldsymbol{z}^{\pm }=\boldsymbol{u}\pm \unicode[STIX]{x1D6FF}\boldsymbol{B}/\sqrt{4\unicode[STIX]{x03C0}(n_{i}m_{i}+n_{e}m_{e})}$
are the Elsasser fields (Elsasser Reference Elsasser1950) which represent Alfvén waves that propagate up or down the mean magnetic field at the Alfvén velocity
 $v_{A}=B_{0}/\sqrt{4\unicode[STIX]{x03C0}(n_{i}m_{i}+n_{e}m_{e})}$
in the MHD limit,
$v_{A}=B_{0}/\sqrt{4\unicode[STIX]{x03C0}(n_{i}m_{i}+n_{e}m_{e})}$
in the MHD limit,
 $k_{\bot }\unicode[STIX]{x1D70C}_{i}\ll 1$
. We specify a balanced collision with equal counterpropagating wave amplitudes,
$k_{\bot }\unicode[STIX]{x1D70C}_{i}\ll 1$
. We specify a balanced collision with equal counterpropagating wave amplitudes,
 $z_{+}=z_{-}$
, such that the nonlinearity parameter is
$z_{+}=z_{-}$
, such that the nonlinearity parameter is
 $\unicode[STIX]{x1D712}=k_{\bot }z_{\pm }/(k_{\Vert }v_{A})=1$
, relevant to the regime of strong turbulence (Goldreich & Sridhar Reference Goldreich and Sridhar1995). To study the nonlinear evolution in the limit
$\unicode[STIX]{x1D712}=k_{\bot }z_{\pm }/(k_{\Vert }v_{A})=1$
, relevant to the regime of strong turbulence (Goldreich & Sridhar Reference Goldreich and Sridhar1995). To study the nonlinear evolution in the limit
 $k_{\bot }\unicode[STIX]{x1D70C}_{i}\ll 1$
, we choose a perpendicular simulation domain size
$k_{\bot }\unicode[STIX]{x1D70C}_{i}\ll 1$
, we choose a perpendicular simulation domain size
 $L_{\bot }=8\unicode[STIX]{x03C0}\unicode[STIX]{x1D70C}_{i}$
with simulation resolution
$L_{\bot }=8\unicode[STIX]{x03C0}\unicode[STIX]{x1D70C}_{i}$
with simulation resolution
 $(n_{x},n_{y},n_{z},n_{\unicode[STIX]{x1D706}},n_{\unicode[STIX]{x1D700}},n_{s})=(64,64,32,128,32,2)$
. The fully resolved perpendicular range in this dealiased pseudospectral method covers
$(n_{x},n_{y},n_{z},n_{\unicode[STIX]{x1D706}},n_{\unicode[STIX]{x1D700}},n_{s})=(64,64,32,128,32,2)$
. The fully resolved perpendicular range in this dealiased pseudospectral method covers
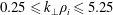 $0.25\leqslant k_{\bot }\unicode[STIX]{x1D70C}_{i}\leqslant 5.25$
, or
$0.25\leqslant k_{\bot }\unicode[STIX]{x1D70C}_{i}\leqslant 5.25$
, or
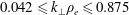 $0.042\leqslant k_{\bot }\unicode[STIX]{x1D70C}_{e}\leqslant 0.875$
given the chosen mass ratio
$0.042\leqslant k_{\bot }\unicode[STIX]{x1D70C}_{e}\leqslant 0.875$
given the chosen mass ratio
 $m_{i}/m_{e}=36$
and temperature ratio
$m_{i}/m_{e}=36$
and temperature ratio
 $T_{i}/T_{e}=1$
. Here the ion thermal Larmor radius is
$T_{i}/T_{e}=1$
. Here the ion thermal Larmor radius is
 $\unicode[STIX]{x1D70C}_{i}=v_{ti}/\unicode[STIX]{x1D6FA}_{i}$
, the ion thermal velocity is
$\unicode[STIX]{x1D70C}_{i}=v_{ti}/\unicode[STIX]{x1D6FA}_{i}$
, the ion thermal velocity is
 $v_{ti}^{2}=2T_{i}/m_{i}$
, the ion cyclotron frequency is
$v_{ti}^{2}=2T_{i}/m_{i}$
, the ion cyclotron frequency is
 $\unicode[STIX]{x1D6FA}_{i}=q_{i}B_{0}/(m_{i}c)$
and the temperature is given in energy units. The plasma parameters of the simulation are
$\unicode[STIX]{x1D6FA}_{i}=q_{i}B_{0}/(m_{i}c)$
and the temperature is given in energy units. The plasma parameters of the simulation are
 $\unicode[STIX]{x1D6FD}_{i}=1$
and
$\unicode[STIX]{x1D6FD}_{i}=1$
and
 $T_{i}/T_{e}=1$
, typical of near-Earth solar wind conditions. The linearized Landau collision operator (Abel et al.
Reference Abel, Barnes, Cowley, Dorland and Schekochihin2008; Barnes et al.
Reference Barnes, Abel, Dorland, Ernst, Hammett, Ricci, Rogers, Schekochihin and Tatsuno2009) is employed with collisional coefficients
$T_{i}/T_{e}=1$
, typical of near-Earth solar wind conditions. The linearized Landau collision operator (Abel et al.
Reference Abel, Barnes, Cowley, Dorland and Schekochihin2008; Barnes et al.
Reference Barnes, Abel, Dorland, Ernst, Hammett, Ricci, Rogers, Schekochihin and Tatsuno2009) is employed with collisional coefficients
 $\unicode[STIX]{x1D708}_{i}=\unicode[STIX]{x1D708}_{e}=6\times 10^{-4}k_{\Vert }v_{A}$
, yielding weakly collisional dynamics with
$\unicode[STIX]{x1D708}_{i}=\unicode[STIX]{x1D708}_{e}=6\times 10^{-4}k_{\Vert }v_{A}$
, yielding weakly collisional dynamics with
 $\unicode[STIX]{x1D708}_{s}/\unicode[STIX]{x1D714}\ll 1$
. With these parameters, the two initial, perpendicularly polarized, counterpropagating Alfvén waves have
$\unicode[STIX]{x1D708}_{s}/\unicode[STIX]{x1D714}\ll 1$
. With these parameters, the two initial, perpendicularly polarized, counterpropagating Alfvén waves have
 $k_{\bot }\unicode[STIX]{x1D70C}_{i}=0.25$
and
$k_{\bot }\unicode[STIX]{x1D70C}_{i}=0.25$
and
 $k_{\Vert }\unicode[STIX]{x1D70C}_{i}\ll 1$
, since
$k_{\Vert }\unicode[STIX]{x1D70C}_{i}\ll 1$
, since
 $k_{\Vert }L_{\Vert }=2\unicode[STIX]{x03C0}$
and
$k_{\Vert }L_{\Vert }=2\unicode[STIX]{x03C0}$
and
 $L_{\bot }/L_{\Vert }=\unicode[STIX]{x1D716}\ll 1$
, where
$L_{\bot }/L_{\Vert }=\unicode[STIX]{x1D716}\ll 1$
, where
 $\unicode[STIX]{x1D716}$
is the small gyrokinetic expansion parameter.
$\unicode[STIX]{x1D716}$
is the small gyrokinetic expansion parameter.
To prepare the simulation, the two initial Alfvén wave modes are evolved linearly for five periods with enhanced collision frequencies
 $\unicode[STIX]{x1D708}_{i}=\unicode[STIX]{x1D708}_{e}=0.01k_{\Vert }v_{A}$
to eliminate any transient behaviour arising from the initialization that does not agree with the properties of the Alfvén wave mode (Nielson et al.
Reference Nielson, Howes and Dorland2013). The simulation is then restarted with the nonlinear terms enabled, beginning the nonlinear evolution of the strong Alfvén wave collision. Note that the two Alfvén waves are already overlapping at the beginning of this simulation before the nonlinear evolution begins, an idealized case which facilitates the comparison to an asymptotic analytical solution in the weakly nonlinear limit (Howes & Nielson Reference Howes and Nielson2013; Howes Reference Howes2016). The nonlinear evolution of the development of current sheets is found to persist in the more realistic case of collisions between two initially separated Alfvén wavepackets of finite parallel extent (Verniero & Howes Reference Verniero and Howes2017; Verniero et al.
Reference Verniero, Howes and Klein2018).
$\unicode[STIX]{x1D708}_{i}=\unicode[STIX]{x1D708}_{e}=0.01k_{\Vert }v_{A}$
to eliminate any transient behaviour arising from the initialization that does not agree with the properties of the Alfvén wave mode (Nielson et al.
Reference Nielson, Howes and Dorland2013). The simulation is then restarted with the nonlinear terms enabled, beginning the nonlinear evolution of the strong Alfvén wave collision. Note that the two Alfvén waves are already overlapping at the beginning of this simulation before the nonlinear evolution begins, an idealized case which facilitates the comparison to an asymptotic analytical solution in the weakly nonlinear limit (Howes & Nielson Reference Howes and Nielson2013; Howes Reference Howes2016). The nonlinear evolution of the development of current sheets is found to persist in the more realistic case of collisions between two initially separated Alfvén wavepackets of finite parallel extent (Verniero & Howes Reference Verniero and Howes2017; Verniero et al.
Reference Verniero, Howes and Klein2018).
(a) The normalized frequency
 $\unicode[STIX]{x1D714}/k_{\Vert }v_{A}$
and (b) total collisionless damping rate
$\unicode[STIX]{x1D714}/k_{\Vert }v_{A}$
and (b) total collisionless damping rate
 $\unicode[STIX]{x1D6FE}_{\text{tot}}/\unicode[STIX]{x1D714}$
(black solid) versus
$\unicode[STIX]{x1D6FE}_{\text{tot}}/\unicode[STIX]{x1D714}$
(black solid) versus
 $k_{\bot }\unicode[STIX]{x1D70C}_{i}$
for Alfvén and kinetic Alfvén waves with
$k_{\bot }\unicode[STIX]{x1D70C}_{i}$
for Alfvén and kinetic Alfvén waves with
 $m_{i}/m_{e}=36$
from the linear collisionless gyrokinetic dispersion relation, including the separate contributions to the linear collisionless damping rate from the ions
$m_{i}/m_{e}=36$
from the linear collisionless gyrokinetic dispersion relation, including the separate contributions to the linear collisionless damping rate from the ions
 $\unicode[STIX]{x1D6FE}_{i}/\unicode[STIX]{x1D714}$
(red dotted) and the electrons
$\unicode[STIX]{x1D6FE}_{i}/\unicode[STIX]{x1D714}$
(red dotted) and the electrons
 $\unicode[STIX]{x1D6FE}_{e}/\unicode[STIX]{x1D714}$
(blue dashed). Squares indicate values computed from linear runs of AstroGK. Solid vertical lines indicate the limits of the fully resolved perpendicular scales of the nonlinear simulation at
$\unicode[STIX]{x1D6FE}_{e}/\unicode[STIX]{x1D714}$
(blue dashed). Squares indicate values computed from linear runs of AstroGK. Solid vertical lines indicate the limits of the fully resolved perpendicular scales of the nonlinear simulation at
 $k_{\bot }\unicode[STIX]{x1D70C}_{i}=0.25$
and
$k_{\bot }\unicode[STIX]{x1D70C}_{i}=0.25$
and
 $k_{\bot }\unicode[STIX]{x1D70C}_{i}=5.25$
. The vertical dashed line indicates the highest
$k_{\bot }\unicode[STIX]{x1D70C}_{i}=5.25$
. The vertical dashed line indicates the highest
 $k_{\bot }\unicode[STIX]{x1D70C}_{i}$
value,
$k_{\bot }\unicode[STIX]{x1D70C}_{i}$
value,
 $k_{\bot }\unicode[STIX]{x1D70C}_{i}=5.25\sqrt{2}\simeq 7.42$
, of the modes in the corner of Fourier space.
$k_{\bot }\unicode[STIX]{x1D70C}_{i}=5.25\sqrt{2}\simeq 7.42$
, of the modes in the corner of Fourier space.
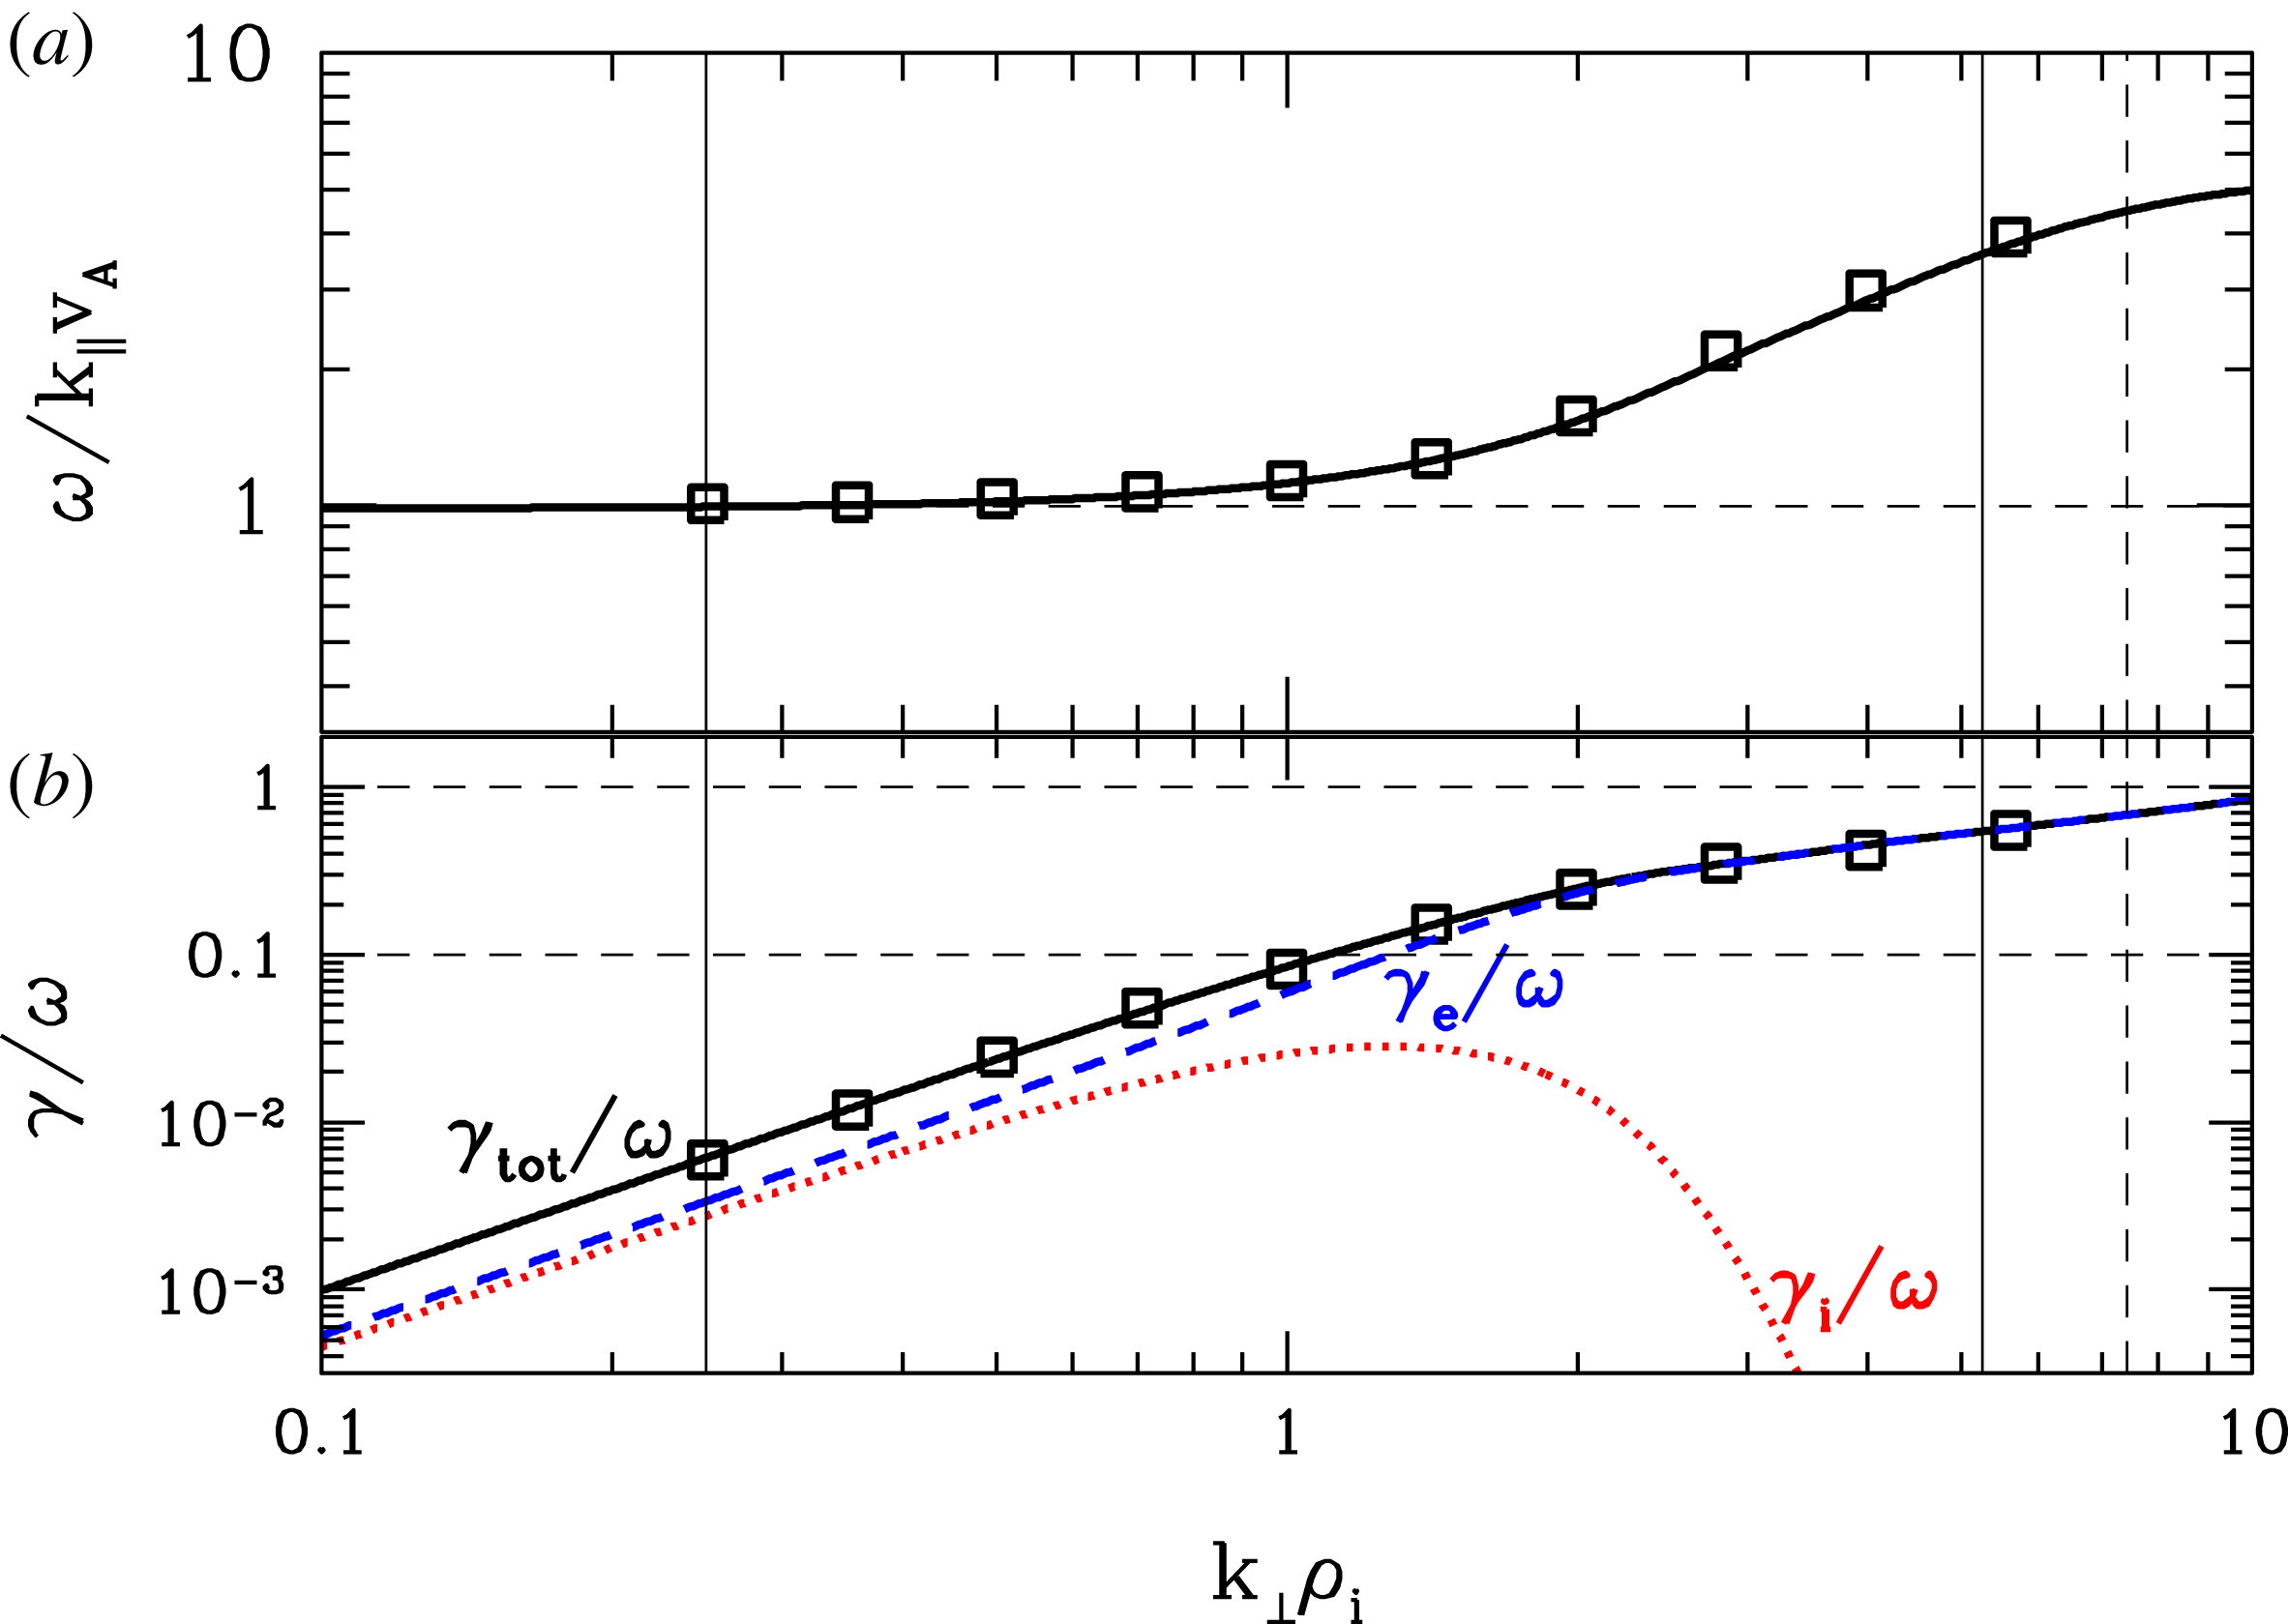
For the plasma parameters of this gyrokinetic simulation, we solve the linear collisionless gyrokinetic dispersion relation (Howes et al.
Reference Howes, Cowley, Dorland, Hammett, Quataert and Schekochihin2006) for the Alfvén/kinetic Alfvén wave mode to determine the linear frequency and collisionless damping rate for this mode as a function of perpendicular wavenumber. Note that the collisionless damping of this mode is due to the Landau resonances with the ions and electrons. Figure 1(a) plots the normalized real frequency
 $\unicode[STIX]{x1D714}/k_{\Vert }v_{A}$
versus the normalized perpendicular wavenumber
$\unicode[STIX]{x1D714}/k_{\Vert }v_{A}$
versus the normalized perpendicular wavenumber
 $k_{\bot }\unicode[STIX]{x1D70C}_{i}$
and (b) plots the total collisionless damping rate normalized to the wave frequency
$k_{\bot }\unicode[STIX]{x1D70C}_{i}$
and (b) plots the total collisionless damping rate normalized to the wave frequency
 $\unicode[STIX]{x1D6FE}/\unicode[STIX]{x1D714}$
(solid black), as well as the separate contributions to this linear collisionless damping rate from the ions (red dotted) and electrons (blue dashed). These gyrokinetic results have been verified by comparison with the solutions of the full Vlasov–Maxwell linear dispersion relation using the PLUME solver (Klein & Howes Reference Klein and Howes2015). Since gyrokinetic theory resolves the Landau resonances but not the cyclotron resonances, this agreement between the gyrokinetic and the Vlasov–Maxwell results confirms that the linear collisionless damping is due to the Landau resonance.
$\unicode[STIX]{x1D6FE}/\unicode[STIX]{x1D714}$
(solid black), as well as the separate contributions to this linear collisionless damping rate from the ions (red dotted) and electrons (blue dashed). These gyrokinetic results have been verified by comparison with the solutions of the full Vlasov–Maxwell linear dispersion relation using the PLUME solver (Klein & Howes Reference Klein and Howes2015). Since gyrokinetic theory resolves the Landau resonances but not the cyclotron resonances, this agreement between the gyrokinetic and the Vlasov–Maxwell results confirms that the linear collisionless damping is due to the Landau resonance.
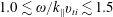
Figure 1 shows that the collisional damping by the ions (red dotted) has a relatively broad peak over the range
 $0.5\lesssim k_{\bot }\unicode[STIX]{x1D70C}_{i}\lesssim 2.0$
. The range of resonant parallel phase velocities
$0.5\lesssim k_{\bot }\unicode[STIX]{x1D70C}_{i}\lesssim 2.0$
. The range of resonant parallel phase velocities
 $\unicode[STIX]{x1D714}/k_{\Vert }$
associated with this broad peak in damping, normalized in terms of the ion thermal velocity, is
$\unicode[STIX]{x1D714}/k_{\Vert }$
associated with this broad peak in damping, normalized in terms of the ion thermal velocity, is
 $1.0\lesssim \unicode[STIX]{x1D714}/k_{\Vert }v_{ti}\lesssim 1.5$
. Therefore, if Landau damping with the ions is active, the energy transfer should be dominated by resonant ions with parallel velocities in the range
$1.0\lesssim \unicode[STIX]{x1D714}/k_{\Vert }v_{ti}\lesssim 1.5$
. Therefore, if Landau damping with the ions is active, the energy transfer should be dominated by resonant ions with parallel velocities in the range
 $1.0\lesssim v_{\Vert }/v_{ti}\lesssim 1.5$
. The collisionless damping by the electrons, on the other hand, increases monotonically with perpendicular wavenumber, becoming sufficiently strong with
$1.0\lesssim v_{\Vert }/v_{ti}\lesssim 1.5$
. The collisionless damping by the electrons, on the other hand, increases monotonically with perpendicular wavenumber, becoming sufficiently strong with
 $\unicode[STIX]{x1D6FE}_{e}/\unicode[STIX]{x1D714}\gtrsim 0.1$
at
$\unicode[STIX]{x1D6FE}_{e}/\unicode[STIX]{x1D714}\gtrsim 0.1$
at
 $k_{\bot }\unicode[STIX]{x1D70C}_{i}\gtrsim 1.2$
. From this point, up to the maximum fully resolved perpendicular scale of
$k_{\bot }\unicode[STIX]{x1D70C}_{i}\gtrsim 1.2$
. From this point, up to the maximum fully resolved perpendicular scale of
 $k_{\bot }\unicode[STIX]{x1D70C}_{i}=5.25$
, the range of resonant parallel phase velocities
$k_{\bot }\unicode[STIX]{x1D70C}_{i}=5.25$
, the range of resonant parallel phase velocities
 $\unicode[STIX]{x1D714}/k_{\Vert }$
in terms of the electron thermal velocity is
$\unicode[STIX]{x1D714}/k_{\Vert }$
in terms of the electron thermal velocity is
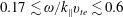 $0.17\lesssim \unicode[STIX]{x1D714}/k_{\Vert }v_{te}\lesssim 0.6$
. Therefore, if the collisionless energy transfer from the turbulent electromagnetic fields to the plasma particles is governed by a Landau resonant mechanism, we would expect to see the transfer of energy localized at parallel velocities within this range of resonant values.
$0.17\lesssim \unicode[STIX]{x1D714}/k_{\Vert }v_{te}\lesssim 0.6$
. Therefore, if the collisionless energy transfer from the turbulent electromagnetic fields to the plasma particles is governed by a Landau resonant mechanism, we would expect to see the transfer of energy localized at parallel velocities within this range of resonant values.
3 Evolution of energy
Under weakly collisional plasma conditions typical of many heliospheric and astrophysical plasmas, the removal of energy from turbulent fluctuations and the eventual conversion of that energy into plasma heat, unlike in the more familiar fluid limit, is a two-step process (Howes Reference Howes2017). Specifically, the turbulent fluctuations are first damped through reversible, collisionless interactions between the electromagnetic fields and the plasma particles, leading to energization of the particles. This non-thermal energization of the particle velocity distributions is subsequently thermalized by arbitrarily weak collisions, thereby accomplishing the ultimate conversion of the turbulent energy into particle heat. An analysis of the flow of energy in this Alfvén wave collision simulation illustrates these two distinct steps of the turbulent dissipation.
In a gyrokinetic system, the total fluctuating energy
 $\unicode[STIX]{x1D6FF}W$
(Howes et al.
Reference Howes, Cowley, Dorland, Hammett, Quataert and Schekochihin2006; Brizard & Hahm Reference Brizard and Hahm2007; Schekochihin et al.
Reference Schekochihin, Cowley, Dorland, Hammett, Howes, Quataert and Tatsuno2009) is given byFootnote
1
$\unicode[STIX]{x1D6FF}W$
(Howes et al.
Reference Howes, Cowley, Dorland, Hammett, Quataert and Schekochihin2006; Brizard & Hahm Reference Brizard and Hahm2007; Schekochihin et al.
Reference Schekochihin, Cowley, Dorland, Hammett, Howes, Quataert and Tatsuno2009) is given byFootnote
1
 $$\begin{eqnarray}\unicode[STIX]{x1D6FF}W=\int \text{d}^{3}\boldsymbol{r}\left[\frac{|\unicode[STIX]{x1D6FF}\boldsymbol{B}|^{2}+|\unicode[STIX]{x1D6FF}\boldsymbol{E}|^{2}}{8\unicode[STIX]{x03C0}}+\mathop{\sum }_{s}\int \text{d}^{3}\boldsymbol{v}\frac{T_{0s}\unicode[STIX]{x1D6FF}f_{s}^{2}}{2F_{0s}}\right],\end{eqnarray}$$
where the index
 $s$
indicates the plasma species and
$s$
indicates the plasma species and
 $T_{0s}$
is the temperature of each species’ Maxwellian equilibrium. The left-hand term represents the electromagnetic energy and the right-hand term represents the microscopic fluctuating kinetic energy of the particles of each plasma species
$T_{0s}$
is the temperature of each species’ Maxwellian equilibrium. The left-hand term represents the electromagnetic energy and the right-hand term represents the microscopic fluctuating kinetic energy of the particles of each plasma species
 $s$
. Note that the elimination of the parallel nonlinearityFootnote
2
in the standard form of gyrokinetic theory means that the appropriate conserved quadratic quantity in gyrokinetics is the Kruskal–Obermann energy,
$s$
. Note that the elimination of the parallel nonlinearityFootnote
2
in the standard form of gyrokinetic theory means that the appropriate conserved quadratic quantity in gyrokinetics is the Kruskal–Obermann energy,
 $E_{s}^{(\unicode[STIX]{x1D6FF}f)}\equiv \int \text{d}^{3}\boldsymbol{r}\int \text{d}^{3}\boldsymbol{v}~T_{0s}\unicode[STIX]{x1D6FF}f_{s}^{2}/2F_{0s}$
(Kruskal & Oberman Reference Kruskal and Oberman1958; Morrison Reference Morrison1994), in contrast to the usual kinetic theory definition of microscopic kinetic energy,
$E_{s}^{(\unicode[STIX]{x1D6FF}f)}\equiv \int \text{d}^{3}\boldsymbol{r}\int \text{d}^{3}\boldsymbol{v}~T_{0s}\unicode[STIX]{x1D6FF}f_{s}^{2}/2F_{0s}$
(Kruskal & Oberman Reference Kruskal and Oberman1958; Morrison Reference Morrison1994), in contrast to the usual kinetic theory definition of microscopic kinetic energy,
 $\int \text{d}^{3}\boldsymbol{r}\int \text{d}^{3}\boldsymbol{v}(m_{s}v^{2}/2)f_{s}$
. Note also that
$\int \text{d}^{3}\boldsymbol{r}\int \text{d}^{3}\boldsymbol{v}(m_{s}v^{2}/2)f_{s}$
. Note also that
 $\unicode[STIX]{x1D6FF}W$
includes neither the equilibrium thermal energy,
$\unicode[STIX]{x1D6FF}W$
includes neither the equilibrium thermal energy,
 $\int \text{d}^{3}\boldsymbol{r}(3/2)n_{0s}T_{0s}=\int \text{d}^{3}\boldsymbol{r}\int \text{d}^{3}\boldsymbol{v}(1/2)m_{s}v^{2}F_{0s}$
, nor the equilibrium magnetic field energy,
$\int \text{d}^{3}\boldsymbol{r}(3/2)n_{0s}T_{0s}=\int \text{d}^{3}\boldsymbol{r}\int \text{d}^{3}\boldsymbol{v}(1/2)m_{s}v^{2}F_{0s}$
, nor the equilibrium magnetic field energy,
 $\int \text{d}^{3}\boldsymbol{r}B_{0}^{2}/8\unicode[STIX]{x03C0}$
. Thus, the terms of
$\int \text{d}^{3}\boldsymbol{r}B_{0}^{2}/8\unicode[STIX]{x03C0}$
. Thus, the terms of
 $\unicode[STIX]{x1D6FF}W$
in (3.1) represent the perturbed electromagnetic field energies and the microscopic kinetic energy of the deviations from the Maxwellian velocity distribution for each species.
$\unicode[STIX]{x1D6FF}W$
in (3.1) represent the perturbed electromagnetic field energies and the microscopic kinetic energy of the deviations from the Maxwellian velocity distribution for each species.
A more intuitive form of the total fluctuating energy
 $\unicode[STIX]{x1D6FF}W$
can be obtained by separating out the kinetic energy of the bulk motion of the plasma species from the non-thermal energy in the distribution function that is not associated with bulk flows (Li et al.
Reference Li, Howes, Klein and TenBarge2016),
$\unicode[STIX]{x1D6FF}W$
can be obtained by separating out the kinetic energy of the bulk motion of the plasma species from the non-thermal energy in the distribution function that is not associated with bulk flows (Li et al.
Reference Li, Howes, Klein and TenBarge2016),
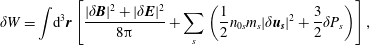 $$\begin{eqnarray}\unicode[STIX]{x1D6FF}W=\int \text{d}^{3}\boldsymbol{r}\left[\frac{|\unicode[STIX]{x1D6FF}\boldsymbol{B}|^{2}+|\unicode[STIX]{x1D6FF}\boldsymbol{E}|^{2}}{8\unicode[STIX]{x03C0}}+\mathop{\sum }_{s}\left(\frac{1}{2}n_{0s}m_{s}|\unicode[STIX]{x1D6FF}\boldsymbol{u}_{\boldsymbol{s}}|^{2}+\frac{3}{2}\unicode[STIX]{x1D6FF}P_{s}\right)\right],\end{eqnarray}$$
where
 $n_{0s}$
is the equilibrium density,
$n_{0s}$
is the equilibrium density,
 $m_{s}$
is mass and
$m_{s}$
is mass and
 $\unicode[STIX]{x1D6FF}\boldsymbol{u}_{\boldsymbol{s}}$
is the fluctuating bulk flow velocity. The non-thermal energy in the distribution function (not including the bulk kinetic energy) is defined by (TenBarge et al.
Reference TenBarge, Daughton, Karimabadi, Howes and Dorland2014)
$\unicode[STIX]{x1D6FF}\boldsymbol{u}_{\boldsymbol{s}}$
is the fluctuating bulk flow velocity. The non-thermal energy in the distribution function (not including the bulk kinetic energy) is defined by (TenBarge et al.
Reference TenBarge, Daughton, Karimabadi, Howes and Dorland2014)
 $$\begin{eqnarray}E_{s}^{(nt)}\equiv \int \text{d}^{3}\boldsymbol{r}\frac{3}{2}\unicode[STIX]{x1D6FF}P_{s}\equiv \int \text{d}^{3}\boldsymbol{r}\left[\int \text{d}^{3}\boldsymbol{v}\left(\frac{T_{0s}\unicode[STIX]{x1D6FF}f_{s}^{2}}{2F_{0s}}\right)-\frac{1}{2}n_{0s}m_{s}|\unicode[STIX]{x1D6FF}\boldsymbol{u}_{\boldsymbol{s}}|^{2}\right].\end{eqnarray}$$
The turbulent energy is defined as the sum of the electromagnetic field and the bulk flow kinetic energies (Howes Reference Howes2015; Li et al. Reference Li, Howes, Klein and TenBarge2016),
 $$\begin{eqnarray}E^{(\text{turb})}\equiv \int \text{d}^{3}\boldsymbol{r}\left[\frac{|\unicode[STIX]{x1D6FF}\boldsymbol{B}|^{2}+|\unicode[STIX]{x1D6FF}\boldsymbol{E}|^{2}}{8\unicode[STIX]{x03C0}}+\mathop{\sum }_{s}\frac{1}{2}n_{0s}m_{s}|\unicode[STIX]{x1D6FF}\boldsymbol{u}_{\boldsymbol{s}}|^{2}\right].\end{eqnarray}$$
Therefore the total fluctuating energy is simply the sum of the turbulent energy and species non-thermal energies,
 $\unicode[STIX]{x1D6FF}W=E^{(\text{turb})}+E_{i}^{(nt)}+E_{e}^{(nt)}$
.
$\unicode[STIX]{x1D6FF}W=E^{(\text{turb})}+E_{i}^{(nt)}+E_{e}^{(nt)}$
.
3.1 Evolution of turbulent and non-thermal energies
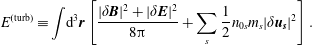
In figure 2, we plot the evolution of these three different contributions to the total fluctuating energy normalized to the total initial fluctuating energy
 $\unicode[STIX]{x1D6FF}W_{0}\equiv \unicode[STIX]{x1D6FF}W(t=0)$
. In figure 2(a), we plot the total fluctuating energy
$\unicode[STIX]{x1D6FF}W_{0}\equiv \unicode[STIX]{x1D6FF}W(t=0)$
. In figure 2(a), we plot the total fluctuating energy
 $\unicode[STIX]{x1D6FF}W/\unicode[STIX]{x1D6FF}W_{0}$
(black), the turbulent energy
$\unicode[STIX]{x1D6FF}W/\unicode[STIX]{x1D6FF}W_{0}$
(black), the turbulent energy
 $E^{(\text{turb})}/\unicode[STIX]{x1D6FF}W_{0}$
(purple), the ion non-thermal energy
$E^{(\text{turb})}/\unicode[STIX]{x1D6FF}W_{0}$
(purple), the ion non-thermal energy
 $E_{i}^{(nt)}/\unicode[STIX]{x1D6FF}W_{0}$
(red) and the electron non-thermal energy
$E_{i}^{(nt)}/\unicode[STIX]{x1D6FF}W_{0}$
(red) and the electron non-thermal energy
 $E_{e}^{(nt)}/\unicode[STIX]{x1D6FF}W_{0}$
(blue). Note that collisions in AstroGK, as well as in real plasma systems, convert non-thermal to thermal energy, representing irreversible plasma heating with an associated increase of entropy. The energy lost from
$E_{e}^{(nt)}/\unicode[STIX]{x1D6FF}W_{0}$
(blue). Note that collisions in AstroGK, as well as in real plasma systems, convert non-thermal to thermal energy, representing irreversible plasma heating with an associated increase of entropy. The energy lost from
 $\unicode[STIX]{x1D6FF}W$
by collisions is tracked by AstroGK and represents thermal heating of the plasma species, but this energy is not fed back into the code to evolve the equilibrium thermal temperature,
$\unicode[STIX]{x1D6FF}W$
by collisions is tracked by AstroGK and represents thermal heating of the plasma species, but this energy is not fed back into the code to evolve the equilibrium thermal temperature,
 $T_{0s}$
(Howes et al.
Reference Howes, Cowley, Dorland, Hammett, Quataert and Schekochihin2006; Numata et al.
Reference Numata, Howes, Tatsuno, Barnes and Dorland2010; Li et al.
Reference Li, Howes, Klein and TenBarge2016). The evolution in figure 2(a) makes clear that, over 7.5 periods of the initial Alfvén waves, more than 60 % of the initial fluctuating energy in the simulation is lost to collisional heating.
$T_{0s}$
(Howes et al.
Reference Howes, Cowley, Dorland, Hammett, Quataert and Schekochihin2006; Numata et al.
Reference Numata, Howes, Tatsuno, Barnes and Dorland2010; Li et al.
Reference Li, Howes, Klein and TenBarge2016). The evolution in figure 2(a) makes clear that, over 7.5 periods of the initial Alfvén waves, more than 60 % of the initial fluctuating energy in the simulation is lost to collisional heating.
(a) Evolution of the normalized energy
 $E/\unicode[STIX]{x1D6FF}W_{0}$
as a function of time
$E/\unicode[STIX]{x1D6FF}W_{0}$
as a function of time
 $t/T_{0}$
for the total fluctuating energy
$t/T_{0}$
for the total fluctuating energy
 $\unicode[STIX]{x1D6FF}W$
(black), the turbulent energy
$\unicode[STIX]{x1D6FF}W$
(black), the turbulent energy
 $E^{(\text{turb})}$
(purple), the ion non-thermal energy
$E^{(\text{turb})}$
(purple), the ion non-thermal energy
 $E_{i}^{(nt)}$
(red) and the electron non-thermal energy
$E_{i}^{(nt)}$
(red) and the electron non-thermal energy
 $E_{e}^{(nt)}$
(blue). (b) Evolution of the different components of the turbulent energy
$E_{e}^{(nt)}$
(blue). (b) Evolution of the different components of the turbulent energy
 $E^{(\text{turb})}$
(purple), dominated by the perpendicular magnetic field energy
$E^{(\text{turb})}$
(purple), dominated by the perpendicular magnetic field energy
 $E_{B_{\bot }}$
(green dashed) and the perpendicular ion bulk flow kinetic energy
$E_{B_{\bot }}$
(green dashed) and the perpendicular ion bulk flow kinetic energy
 $E_{i,u_{\bot }}$
(red dashed), with successively smaller contributions by the perpendicular electron bulk kinetic energy
$E_{i,u_{\bot }}$
(red dashed), with successively smaller contributions by the perpendicular electron bulk kinetic energy
 $E_{e,u_{\bot }}$
(blue dashed), the parallel magnetic field energy
$E_{e,u_{\bot }}$
(blue dashed), the parallel magnetic field energy
 $E_{B_{\Vert }}$
(green dotted), the parallel ion bulk flow kinetic energy
$E_{B_{\Vert }}$
(green dotted), the parallel ion bulk flow kinetic energy
 $E_{i,u_{\Vert }}$
(red dotted) and the parallel electron bulk flow kinetic energy
$E_{i,u_{\Vert }}$
(red dotted) and the parallel electron bulk flow kinetic energy
 $E_{e,u_{\Vert }}$
(blue dotted).
$E_{e,u_{\Vert }}$
(blue dotted).
In figure 2(b), we plot the different components that contribute to the turbulent energy
 $E^{(\text{turb})}$
. In order of decreasing magnitude, these contributions are the perpendicular magnetic energy
$E^{(\text{turb})}$
. In order of decreasing magnitude, these contributions are the perpendicular magnetic energy
 $E_{B_{\bot }}$
(green dashed), perpendicular ion kinetic energy
$E_{B_{\bot }}$
(green dashed), perpendicular ion kinetic energy
 $E_{u_{i,\bot }}$
(red dashed), perpendicular electron kinetic energy
$E_{u_{i,\bot }}$
(red dashed), perpendicular electron kinetic energy
 $E_{u_{e,\bot }}$
(blue dashed), parallel magnetic energy
$E_{u_{e,\bot }}$
(blue dashed), parallel magnetic energy
 $E_{B_{\Vert }}$
(green dotted), parallel ion kinetic energy
$E_{B_{\Vert }}$
(green dotted), parallel ion kinetic energy
 $E_{u_{i,\Vert }}$
(red dotted) and parallel electron kinetic energy
$E_{u_{i,\Vert }}$
(red dotted) and parallel electron kinetic energy
 $E_{u_{e,\Vert }}$
(blue dotted). The turbulent energy is dominated by the perpendicular magnetic energy and perpendicular ion kinetic energy. This is expected for Alfvénic fluctuations at
$E_{u_{e,\Vert }}$
(blue dotted). The turbulent energy is dominated by the perpendicular magnetic energy and perpendicular ion kinetic energy. This is expected for Alfvénic fluctuations at
 $k_{\bot }\unicode[STIX]{x1D70C}_{i}\ll 1$
: transverse motion of the plasma dominated by ion kinetic energy is first arrested by magnetic tension, followed by the acceleration of the plasma back toward the equilibrium point by magnetic tension, thereby leading to the oscillatory transfer of energy back and forth between perpendicular magnetic energy and perpendicular ion kinetic energy, as evident in figure 2(b). Note that this energy is integrated over the entire simulation domain, so neither of these energies is expected to drop to zero, as would occur for the energy density at a single point in space as an Alfvén wave passes through that point. In the MHD limit
$k_{\bot }\unicode[STIX]{x1D70C}_{i}\ll 1$
: transverse motion of the plasma dominated by ion kinetic energy is first arrested by magnetic tension, followed by the acceleration of the plasma back toward the equilibrium point by magnetic tension, thereby leading to the oscillatory transfer of energy back and forth between perpendicular magnetic energy and perpendicular ion kinetic energy, as evident in figure 2(b). Note that this energy is integrated over the entire simulation domain, so neither of these energies is expected to drop to zero, as would occur for the energy density at a single point in space as an Alfvén wave passes through that point. In the MHD limit
 $k_{\bot }\unicode[STIX]{x1D70C}_{i}\ll 1$
, Alfvénic fluctuations also have very little parallel motion,
$k_{\bot }\unicode[STIX]{x1D70C}_{i}\ll 1$
, Alfvénic fluctuations also have very little parallel motion,
 $u_{\Vert }\ll u_{\bot }$
and a very small parallel magnetic field fluctuation,
$u_{\Vert }\ll u_{\bot }$
and a very small parallel magnetic field fluctuation,
 $\unicode[STIX]{x1D6FF}B_{\Vert }\ll \unicode[STIX]{x1D6FF}B_{\bot }$
. Furthermore, the electron kinetic energies are down from the respective ion kinetic energies approximately by a factor of the mass ratio,
$\unicode[STIX]{x1D6FF}B_{\Vert }\ll \unicode[STIX]{x1D6FF}B_{\bot }$
. Furthermore, the electron kinetic energies are down from the respective ion kinetic energies approximately by a factor of the mass ratio,
 $m_{e}/m_{i}=1/36$
, so electrons make a subdominant contribution to the turbulent energy. Finally, note that although the volume-integrated energy of each component of
$m_{e}/m_{i}=1/36$
, so electrons make a subdominant contribution to the turbulent energy. Finally, note that although the volume-integrated energy of each component of
 $E^{(\text{turb})}$
shows oscillations with the period
$E^{(\text{turb})}$
shows oscillations with the period
 $T_{0}$
, their sum varies smoothly in time, suggesting that this definition of turbulent energy is physically well motivated.
$T_{0}$
, their sum varies smoothly in time, suggesting that this definition of turbulent energy is physically well motivated.
3.2 Evolution of collisional heating
In figure 3, we present the evolution of the collisional heating rate per unit volume of ions
 $Q_{i}$
(red) and electrons
$Q_{i}$
(red) and electrons
 $Q_{e}$
(blue) as well as the total collisional heating rate
$Q_{e}$
(blue) as well as the total collisional heating rate
 $Q_{\text{tot}}=Q_{i}+Q_{e}$
(black) for this nonlinear Alfvén wave collision simulation (thick lines). The heating rates are normalized by a characteristic heating rate per unit volume,
$Q_{\text{tot}}=Q_{i}+Q_{e}$
(black) for this nonlinear Alfvén wave collision simulation (thick lines). The heating rates are normalized by a characteristic heating rate per unit volume,
 $Q_{0}=(n_{0i}T_{0i}v_{ti}/L_{\Vert })(\unicode[STIX]{x03C0}/8)(L_{\bot }/L_{\Vert })^{2}$
. The total fluctuating energy
$Q_{0}=(n_{0i}T_{0i}v_{ti}/L_{\Vert })(\unicode[STIX]{x03C0}/8)(L_{\bot }/L_{\Vert })^{2}$
. The total fluctuating energy
 $\unicode[STIX]{x1D6FF}W$
in figure 2(a) diminishes in time due to thermalization by collisions. This collisional energy loss from
$\unicode[STIX]{x1D6FF}W$
in figure 2(a) diminishes in time due to thermalization by collisions. This collisional energy loss from
 $\unicode[STIX]{x1D6FF}W$
is tracked in AstroGK by this collisional heating rate, enabling energy conservation to be measured in the simulation.
$\unicode[STIX]{x1D6FF}W$
is tracked in AstroGK by this collisional heating rate, enabling energy conservation to be measured in the simulation.
Ion collisional heating rate
 $Q_{i}/Q_{0}$
(red), electron collisional heating rate
$Q_{i}/Q_{0}$
(red), electron collisional heating rate
 $Q_{e}/Q_{0}$
(blue) and total collisional heating rate
$Q_{e}/Q_{0}$
(blue) and total collisional heating rate
 $Q_{\text{tot}}=Q_{i}+Q_{e}$
(black) and as a function of time
$Q_{\text{tot}}=Q_{i}+Q_{e}$
(black) and as a function of time
 $t/T_{0}$
for the nonlinear simulation (thick lines). Also plotted (thin lines) is the linear evolution from the same initial conditions.
$t/T_{0}$
for the nonlinear simulation (thick lines). Also plotted (thin lines) is the linear evolution from the same initial conditions.
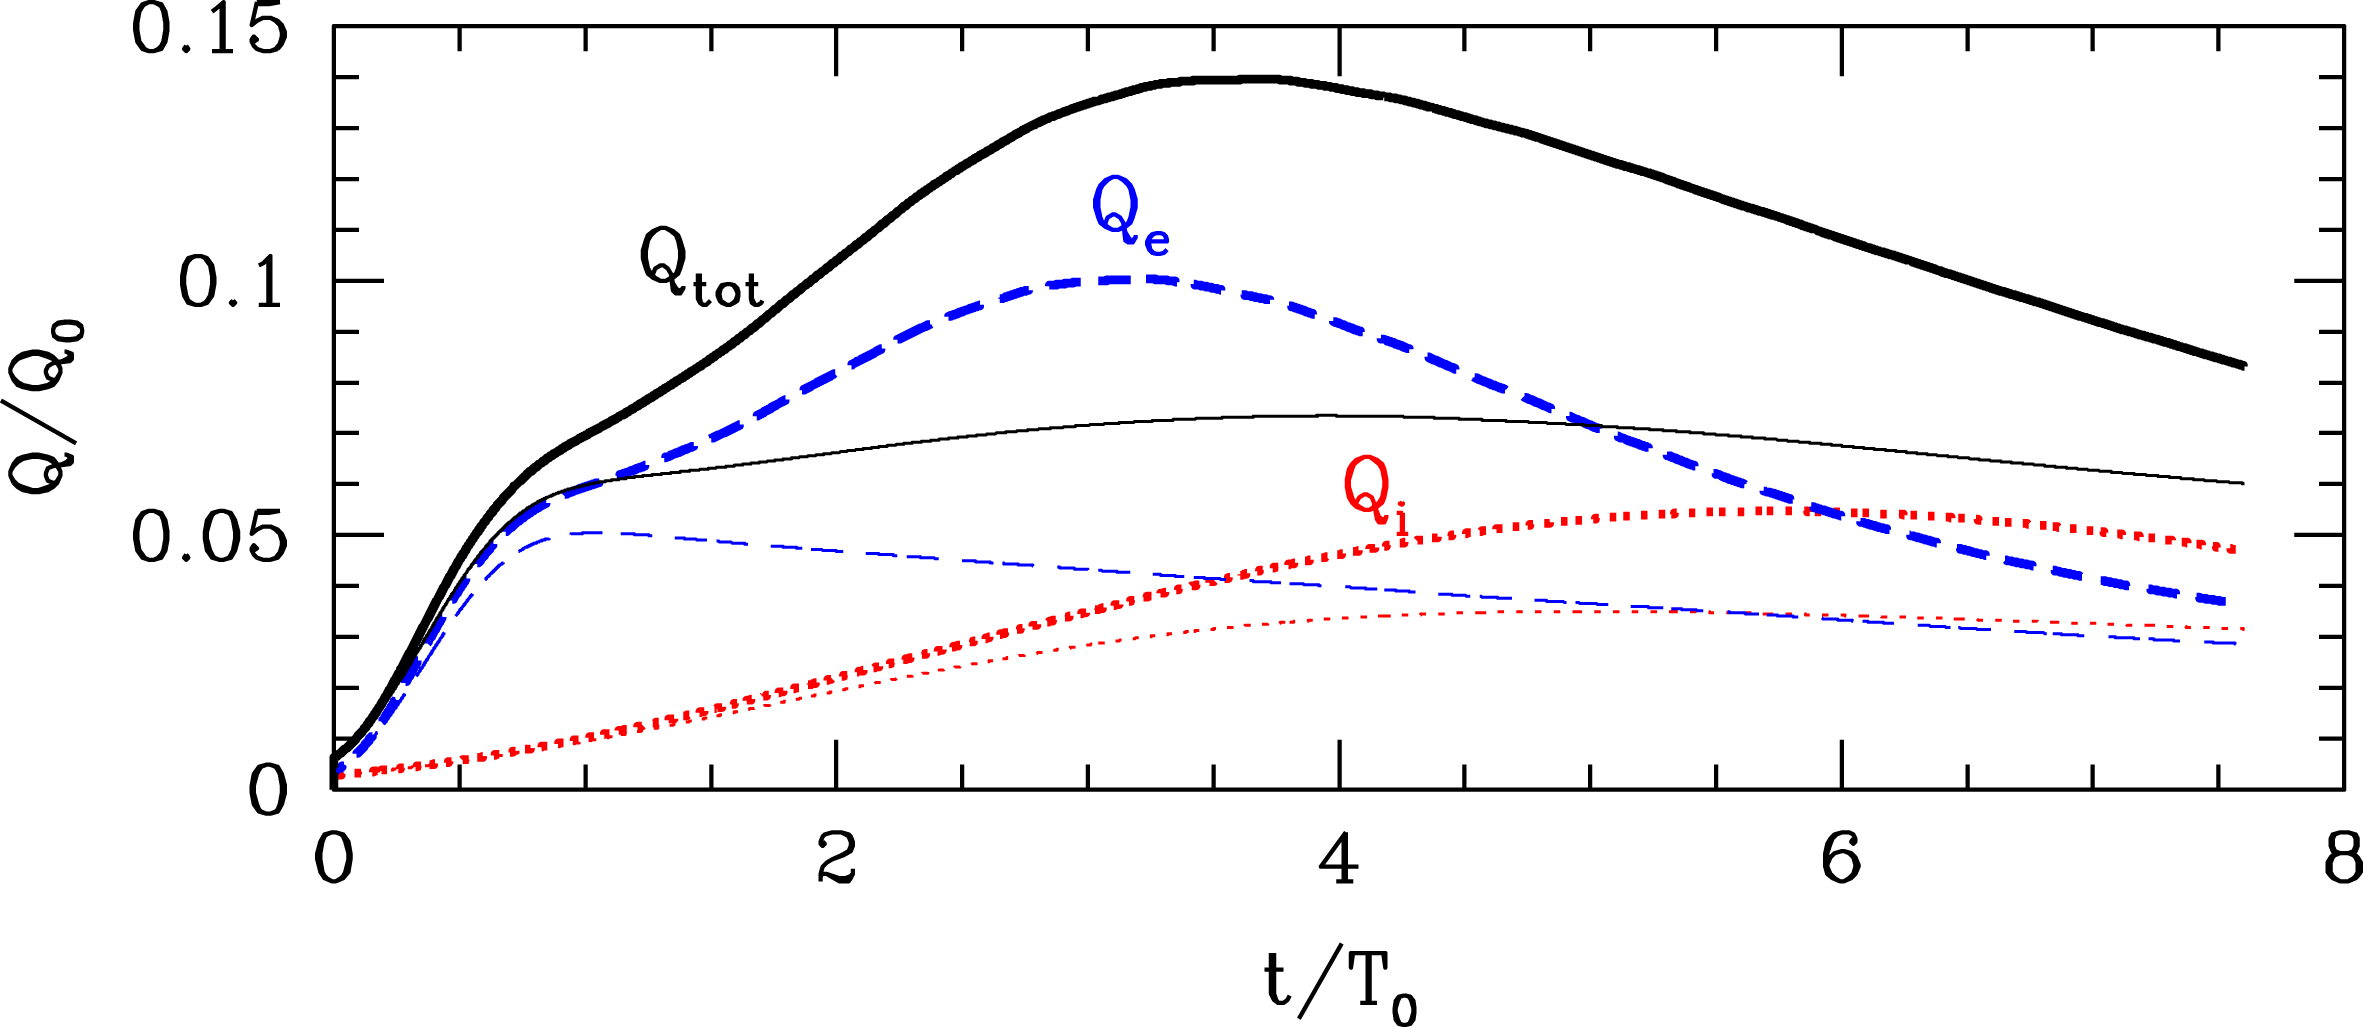
Note that the rapid initial rise in the collisional damping rate for the electrons
 $Q_{e}$
at
$Q_{e}$
at
 $t/T_{0}\lesssim 0.5$
in figure 3 is due to the fact that the linear initialization uses higher collision coefficients,
$t/T_{0}\lesssim 0.5$
in figure 3 is due to the fact that the linear initialization uses higher collision coefficients,
 $\unicode[STIX]{x1D708}_{s}=0.01k_{\Vert }v_{A}$
, than the subsequent nonlinear evolution,
$\unicode[STIX]{x1D708}_{s}=0.01k_{\Vert }v_{A}$
, than the subsequent nonlinear evolution,
 $\unicode[STIX]{x1D708}_{s}=6\times 10^{-4}k_{\Vert }v_{A}$
. When the collisional coefficients are reduced, smaller velocity scale structures in the velocity distribution must develop (through the kinetic evolution) before the collisional heating is able to effectively thermalize the non-thermal energy contained in those fluctuations.
$\unicode[STIX]{x1D708}_{s}=6\times 10^{-4}k_{\Vert }v_{A}$
. When the collisional coefficients are reduced, smaller velocity scale structures in the velocity distribution must develop (through the kinetic evolution) before the collisional heating is able to effectively thermalize the non-thermal energy contained in those fluctuations.
Also plotted in figure 3 is the evolution of the collisional heating rates in a linear simulation (thin lines), where the simulation is started from the same initial conditions but the nonlinear terms are turned off. In this linear simulation, there is no nonlinear transfer of energy to other Fourier modes – meaning that there is no nonlinear turbulent cascade of energy to small scales – so the evolution of the energy is solely due to linear Landau damping of the initial Alfvén waves and the subsequent collisional thermalization of the fluctuations in the velocity distribution functions that were generated by this linear Landau damping. It is important to note that the nonlinear evolution eventually leads to a higher collisional heating rate, presumably through the nonlinear transfer of energy to smaller-scale fluctuations that have higher collisionless damping rates than the initial Alfvén waves, although we do not directly analyse that nonlinear cascade of energy in this study.
3.3 Model of energy flow
A physical interpretation of the two-step energy flow in this strong Alfvén wave collision simulation is illustrated by the diagram in figure 4. The energy of turbulent fluctuations
 $E^{(\text{turb})}$
, consisting of the sum of the electromagnetic field fluctuations and the kinetic energy of the bulk flows (first velocity moment) of each plasma species (Howes Reference Howes2015, Reference Howes2017), can be removed by collisionless interactions
$E^{(\text{turb})}$
, consisting of the sum of the electromagnetic field fluctuations and the kinetic energy of the bulk flows (first velocity moment) of each plasma species (Howes Reference Howes2015, Reference Howes2017), can be removed by collisionless interactions
 ${\dot{E}}_{s}^{(fp)}$
between the electromagnetic fields and the plasma particles. This energy is converted to non-thermal energy of the ions and electrons,
${\dot{E}}_{s}^{(fp)}$
between the electromagnetic fields and the plasma particles. This energy is converted to non-thermal energy of the ions and electrons,
 $E_{s}^{(nt)}$
. This non-thermal energy is represented by fluctuations in the particle velocity distribution functions that have no associated bulk flow (first moment), and therefore do not contribute to the turbulent motions. A key property of this collisionless energy transfer
$E_{s}^{(nt)}$
. This non-thermal energy is represented by fluctuations in the particle velocity distribution functions that have no associated bulk flow (first moment), and therefore do not contribute to the turbulent motions. A key property of this collisionless energy transfer
 ${\dot{E}}_{s}^{(fp)}$
is that it is reversible (two-headed arrows in figure 4), representing the electromagnetic work done on the particles by the fields, which can be positive or negative. Note that this diagram of the energy flow applies to any collisionless damping process: resonant processes, such as Landau damping (Landau Reference Landau1946; Mouhot & Villani Reference Mouhot and Villani2011), transit-time damping (Barnes Reference Barnes1966) or cyclotron damping (Coleman Reference Coleman1968; Isenberg & Hollweg Reference Isenberg and Hollweg1983); non-resonant processes, such as stochastic ion heating (Chen, Lin & White Reference Chen, Lin and White2001; Chandran et al.
Reference Chandran, Li, Rogers, Quataert and Germaschewski2010); or particle energization associated with collisionless magnetic reconnection (Birn et al.
Reference Birn, Drake, Shay, Rogers, Denton, Hesse, Kuznetsova, Ma, Bhattacharjee and Otto2001; Treumann & Baumjohann Reference Treumann and Baumjohann2015).
${\dot{E}}_{s}^{(fp)}$
is that it is reversible (two-headed arrows in figure 4), representing the electromagnetic work done on the particles by the fields, which can be positive or negative. Note that this diagram of the energy flow applies to any collisionless damping process: resonant processes, such as Landau damping (Landau Reference Landau1946; Mouhot & Villani Reference Mouhot and Villani2011), transit-time damping (Barnes Reference Barnes1966) or cyclotron damping (Coleman Reference Coleman1968; Isenberg & Hollweg Reference Isenberg and Hollweg1983); non-resonant processes, such as stochastic ion heating (Chen, Lin & White Reference Chen, Lin and White2001; Chandran et al.
Reference Chandran, Li, Rogers, Quataert and Germaschewski2010); or particle energization associated with collisionless magnetic reconnection (Birn et al.
Reference Birn, Drake, Shay, Rogers, Denton, Hesse, Kuznetsova, Ma, Bhattacharjee and Otto2001; Treumann & Baumjohann Reference Treumann and Baumjohann2015).
Diagram of the energy flow in weakly collisional turbulent plasmas, showing that interactions between the electromagnetic fields and plasma particles
 ${\dot{E}}_{s}^{(fp)}$
can reversibly transfer energy between the turbulent energy
${\dot{E}}_{s}^{(fp)}$
can reversibly transfer energy between the turbulent energy
 $E^{(\text{turb})}$
and the non-thermal energy in the velocity distribution function of each species
$E^{(\text{turb})}$
and the non-thermal energy in the velocity distribution function of each species
 $E_{s}^{(nt)}$
. Collisional heating
$E_{s}^{(nt)}$
. Collisional heating
 $Q_{s}$
then can irreversibly convert this non-thermal energy, represented by fluctuations in velocity space of each species, into heat of each plasma species
$Q_{s}$
then can irreversibly convert this non-thermal energy, represented by fluctuations in velocity space of each species, into heat of each plasma species
 $s$
. This is the two-step process of reversible particle energization and subsequent irreversible thermalization of that particle energy.
$s$
. This is the two-step process of reversible particle energization and subsequent irreversible thermalization of that particle energy.
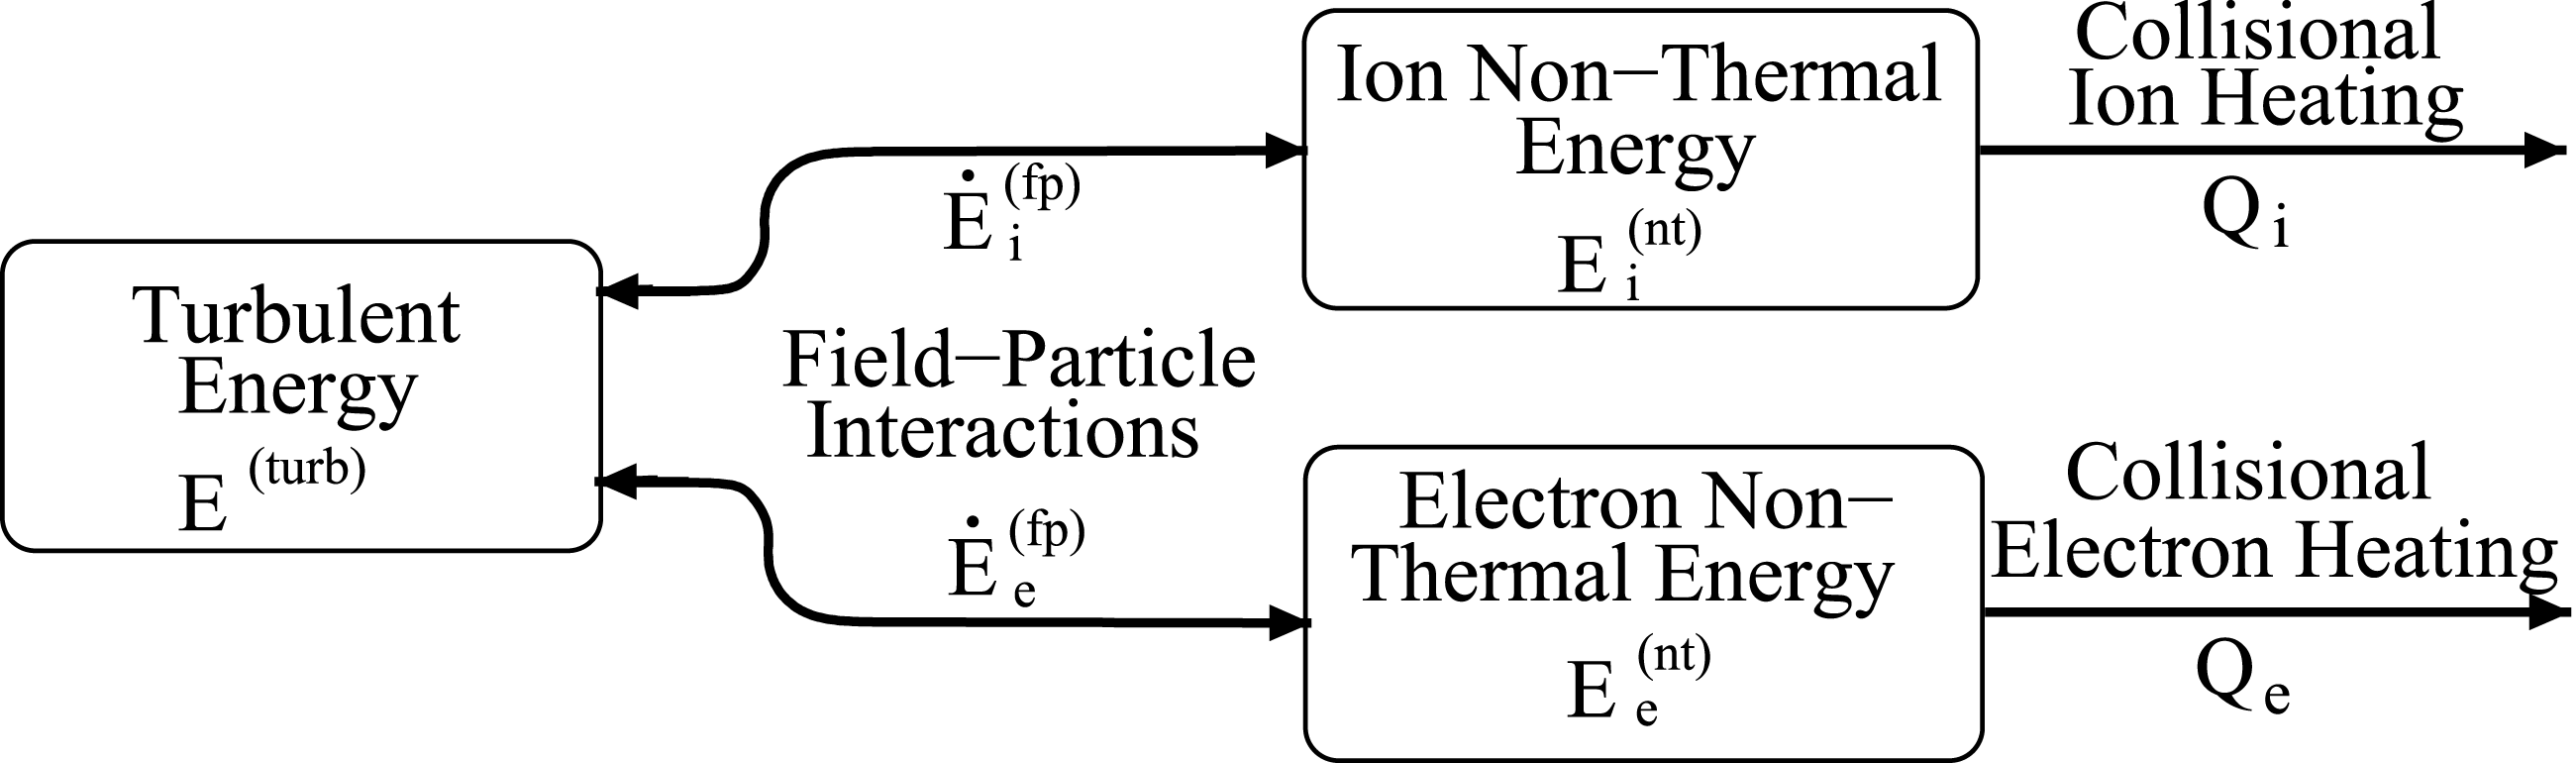
The non-thermal energy
 $E_{s}^{(nt)}$
is contained in fluctuations in velocity space of the particle velocity distribution functions for each species,
$E_{s}^{(nt)}$
is contained in fluctuations in velocity space of the particle velocity distribution functions for each species,
 $\unicode[STIX]{x1D6FF}f_{s}(\boldsymbol{v})$
. If these fluctuations reach sufficiently small scales in velocity space, arbitrarily weak collisions can smooth out those fluctuations, thermalizing their energy and thereby realizing irreversible plasma heating,
$\unicode[STIX]{x1D6FF}f_{s}(\boldsymbol{v})$
. If these fluctuations reach sufficiently small scales in velocity space, arbitrarily weak collisions can smooth out those fluctuations, thermalizing their energy and thereby realizing irreversible plasma heating,
 $Q_{s}$
. The kinetic equation for each species governs two mechanisms that facilitate the transfer of energy to ever smaller scales in velocity space: linear phase mixing and nonlinear phase mixing.
$Q_{s}$
. The kinetic equation for each species governs two mechanisms that facilitate the transfer of energy to ever smaller scales in velocity space: linear phase mixing and nonlinear phase mixing.
The first mechanism is linear phase mixing governed by the ballistic term in the kinetic equation, which couples spatial variations with velocity-space fluctuations and can lead to the transfer of energy to small scales in velocity space.Footnote
3
In linear Landau damping, for example, the energy of a damped wave is first transferred collisionlessly into non-thermal velocity-space fluctuations, which subsequently phase mix linearly to small enough scales in velocity space that weak collisions can irreversibly convert the non-thermal energy into plasma heat. Boltzmann’s
 $H$
theorem proves that the entropy increase associated with irreversible plasma heating is ultimately collisional (Howes et al.
Reference Howes, Cowley, Dorland, Hammett, Quataert and Schekochihin2006).
$H$
theorem proves that the entropy increase associated with irreversible plasma heating is ultimately collisional (Howes et al.
Reference Howes, Cowley, Dorland, Hammett, Quataert and Schekochihin2006).
In addition to this linear phase-mixing process, at perpendicular spatial scales comparable to the particle thermal Larmor radii,
 $k_{\bot }\unicode[STIX]{x1D70C}_{s}\gtrsim 1$
, a nonlinear phase-mixing process (Dorland & Hammett Reference Dorland and Hammett1993), also known as the entropy cascade (Schekochihin et al.
Reference Schekochihin, Cowley, Dorland, Hammett, Howes, Quataert and Tatsuno2009; Tatsuno et al.
Reference Tatsuno, Schekochihin, Dorland, Plunk, Barnes, Cowley and Howes2009; Plunk et al.
Reference Plunk, Cowley, Schekochihin and Tatsuno2010; Plunk & Tatsuno Reference Plunk and Tatsuno2011; Kawamori Reference Kawamori2013), can be very effective at transferring energy to ever smaller scales in velocity space. Ultimately, when the non-thermal particle energy in the velocity distribution functions
$k_{\bot }\unicode[STIX]{x1D70C}_{s}\gtrsim 1$
, a nonlinear phase-mixing process (Dorland & Hammett Reference Dorland and Hammett1993), also known as the entropy cascade (Schekochihin et al.
Reference Schekochihin, Cowley, Dorland, Hammett, Howes, Quataert and Tatsuno2009; Tatsuno et al.
Reference Tatsuno, Schekochihin, Dorland, Plunk, Barnes, Cowley and Howes2009; Plunk et al.
Reference Plunk, Cowley, Schekochihin and Tatsuno2010; Plunk & Tatsuno Reference Plunk and Tatsuno2011; Kawamori Reference Kawamori2013), can be very effective at transferring energy to ever smaller scales in velocity space. Ultimately, when the non-thermal particle energy in the velocity distribution functions
 $\unicode[STIX]{x1D6FF}f_{s}(\boldsymbol{v})$
has reached sufficiently small scales in velocity, due to some combination of linear and nonlinear phase mixing, collisions may thermalize that particle energy, completing the final step in the conversion of turbulent energy into plasma heat. In AstroGK, this collisional heating removes energy from fluctuating energy in the plasma,
$\unicode[STIX]{x1D6FF}f_{s}(\boldsymbol{v})$
has reached sufficiently small scales in velocity, due to some combination of linear and nonlinear phase mixing, collisions may thermalize that particle energy, completing the final step in the conversion of turbulent energy into plasma heat. In AstroGK, this collisional heating removes energy from fluctuating energy in the plasma,
 $\unicode[STIX]{x1D6FF}W$
.
$\unicode[STIX]{x1D6FF}W$
.
It is worthwhile to contrast this two-step mechanism in weakly collisional plasmas – collisionless particle energization followed by collisional thermalization – with the more familiar picture of turbulent dissipation in the fluid (strongly collisional) limit. A dimensionless measure of the collisionality is the ratio of the thermal collision rate to the frequency of typical fluctuations in the plasma,
 $\unicode[STIX]{x1D708}/\unicode[STIX]{x1D714}$
. In the strongly collisional limit,
$\unicode[STIX]{x1D708}/\unicode[STIX]{x1D714}$
. In the strongly collisional limit,
 $\unicode[STIX]{x1D708}/\unicode[STIX]{x1D714}\gg 1$
, collisions can directly remove energy from both the bulk plasma flows through viscosity and the plasma currents through resistivity. Because both viscosity and resistivity are collisional, entropy increases through these mechanisms, and the energy from the turbulent electromagnetic field and plasma flow fluctuations is immediately thermalized to plasma heat. Thus, the dissipation of turbulence in the strongly collisional, fluid limit is a single-step process. Consider the example of resistive MHD, where Ohm’s law gives the electric field in terms of the plasma fluid velocity, magnetic field and current density,
$\unicode[STIX]{x1D708}/\unicode[STIX]{x1D714}\gg 1$
, collisions can directly remove energy from both the bulk plasma flows through viscosity and the plasma currents through resistivity. Because both viscosity and resistivity are collisional, entropy increases through these mechanisms, and the energy from the turbulent electromagnetic field and plasma flow fluctuations is immediately thermalized to plasma heat. Thus, the dissipation of turbulence in the strongly collisional, fluid limit is a single-step process. Consider the example of resistive MHD, where Ohm’s law gives the electric field in terms of the plasma fluid velocity, magnetic field and current density,
 $\boldsymbol{E}+\boldsymbol{U}/c\times \boldsymbol{B}=\unicode[STIX]{x1D702}\boldsymbol{j}$
(Spitzer Reference Spitzer1962; Kulsrud Reference Kulsrud, Galeev and Sudan1983). The work done by the electric field is
$\boldsymbol{E}+\boldsymbol{U}/c\times \boldsymbol{B}=\unicode[STIX]{x1D702}\boldsymbol{j}$
(Spitzer Reference Spitzer1962; Kulsrud Reference Kulsrud, Galeev and Sudan1983). The work done by the electric field is
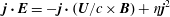 $\boldsymbol{j}\boldsymbol{\cdot }\boldsymbol{E}=-\boldsymbol{j}\boldsymbol{\cdot }(\boldsymbol{U}/c\times \boldsymbol{B})+\unicode[STIX]{x1D702}\boldsymbol{j}^{2}$
, where the second term is the non-negative ohmic heating due to resistive dissipation of the current, showing that the resistivity leads directly to plasma heating.
$\boldsymbol{j}\boldsymbol{\cdot }\boldsymbol{E}=-\boldsymbol{j}\boldsymbol{\cdot }(\boldsymbol{U}/c\times \boldsymbol{B})+\unicode[STIX]{x1D702}\boldsymbol{j}^{2}$
, where the second term is the non-negative ohmic heating due to resistive dissipation of the current, showing that the resistivity leads directly to plasma heating.
The strong Alfvén wave collision simulation presented here has
 $\unicode[STIX]{x1D708}/\unicode[STIX]{x1D714}\sim 6\times 10^{-4}\ll 1$
, firmly in the weakly collisional limit. Unlike in the MHD Ohm’s law above, where the current density
$\unicode[STIX]{x1D708}/\unicode[STIX]{x1D714}\sim 6\times 10^{-4}\ll 1$
, firmly in the weakly collisional limit. Unlike in the MHD Ohm’s law above, where the current density
 $\boldsymbol{j}$
and electric field
$\boldsymbol{j}$
and electric field
 $\boldsymbol{E}$
due to the resistive term are in phase, and thereby yield a zero or positive change in energy, in the weakly collisional case the current density
$\boldsymbol{E}$
due to the resistive term are in phase, and thereby yield a zero or positive change in energy, in the weakly collisional case the current density
 $\boldsymbol{j}$
and electric field
$\boldsymbol{j}$
and electric field
 $\boldsymbol{E}$
need not be in phase, enabling the work done by collisionless interactions between the fields and particles to give energy to or take energy from the particles. In fact, if the current and electric field are exactly 90 degrees out of phase, there is zero net energy transfer between fields and particles over one complete oscillation, corresponding to undamped wave motion. The bottom line, a point that cannot be overstated, is that in a weakly collisional plasma, the electromagnetic work
$\boldsymbol{E}$
need not be in phase, enabling the work done by collisionless interactions between the fields and particles to give energy to or take energy from the particles. In fact, if the current and electric field are exactly 90 degrees out of phase, there is zero net energy transfer between fields and particles over one complete oscillation, corresponding to undamped wave motion. The bottom line, a point that cannot be overstated, is that in a weakly collisional plasma, the electromagnetic work
 $\boldsymbol{j}\boldsymbol{\cdot }\boldsymbol{E}$
does not correspond to irreversible plasma heating, but rather to reversible work done on the particles by the fields, or vice versa.
$\boldsymbol{j}\boldsymbol{\cdot }\boldsymbol{E}$
does not correspond to irreversible plasma heating, but rather to reversible work done on the particles by the fields, or vice versa.
Developing a detailed understanding of particle energization and plasma heating in heliospheric plasmas is grand challenge problem in heliophysics, and this simple model of the energy flow provides important constraints to focus efforts in that endeavour. Note that the final step of the process in figure 4, the thermalization of the particle energy, is fundamentally collisional, independent of what mechanism (which we have not specified here) removed energy from the turbulent fluctuations initially. The key question in understanding particle energization and plasma heating in heliospheric plasmas is therefore to understand the first step: what collisionless and reversible mechanism is responsible for the removal of energy from the turbulent fluctuations and conversion of that energy into non-thermal energy of the plasma species?
3.4 Rate of energy transfer
Now we use the strong Alfvén wave collision simulation presented here to analyse the channels of energy transfer shown in figure 4. For each species, the rate of change of non-thermal energy is given by
 $$\begin{eqnarray}{\dot{E}}_{s}^{(nt)}={\dot{E}}_{s}^{(fp)}-Q_{s},\end{eqnarray}$$
where the irreversible collisional heating
 $Q_{s}\geqslant 0$
but the reversible collisionless field–particle energy transfer
$Q_{s}\geqslant 0$
but the reversible collisionless field–particle energy transfer
 ${\dot{E}}_{s}^{(fp)}$
can be either positive or negative. In addition, the rate of change of turbulent energy must be the sum of the collisionless field–particle energy transfer for each species,
${\dot{E}}_{s}^{(fp)}$
can be either positive or negative. In addition, the rate of change of turbulent energy must be the sum of the collisionless field–particle energy transfer for each species,
 $$\begin{eqnarray}-{\dot{E}}^{(\text{turb})}={\dot{E}}_{i}^{(fp)}+{\dot{E}}_{e}^{(fp)}.\end{eqnarray}$$
Note that we have not specified the physical mechanism governing the field–particle energy transfer, but we are simply showing that the transfers of energy indeed follow the diagram in figure 4.
Numerically, the collisional heating
 $Q_{s}$
is evaluated for each species in AstroGK by multiplying the linearized Landau collision operator (Abel et al.
Reference Abel, Barnes, Cowley, Dorland and Schekochihin2008; Barnes et al.
Reference Barnes, Abel, Dorland, Ernst, Hammett, Ricci, Rogers, Schekochihin and Tatsuno2009) by
$Q_{s}$
is evaluated for each species in AstroGK by multiplying the linearized Landau collision operator (Abel et al.
Reference Abel, Barnes, Cowley, Dorland and Schekochihin2008; Barnes et al.
Reference Barnes, Abel, Dorland, Ernst, Hammett, Ricci, Rogers, Schekochihin and Tatsuno2009) by
 $m_{s}v^{2}/2$
and then integrating over velocity space and over the simulation domain. The rate of change of non-thermal energy
$m_{s}v^{2}/2$
and then integrating over velocity space and over the simulation domain. The rate of change of non-thermal energy
 ${\dot{E}}_{s}^{(nt)}$
is determined by numerically evaluating
${\dot{E}}_{s}^{(nt)}$
is determined by numerically evaluating
 $E_{s}^{(nt)}$
as a function of time using (3.3) and then differencing to obtain the time derivative. Similarly, the rate of change of turbulent energy
$E_{s}^{(nt)}$
as a function of time using (3.3) and then differencing to obtain the time derivative. Similarly, the rate of change of turbulent energy
 ${\dot{E}}^{(\text{turb})}$
is determined by numerically evaluating
${\dot{E}}^{(\text{turb})}$
is determined by numerically evaluating
 $E^{(\text{turb})}$
as a function of time using (3.4) and then taking the time derivative. The rate of energy transfer by collisionless field–particle interactions for each species
$E^{(\text{turb})}$
as a function of time using (3.4) and then taking the time derivative. The rate of energy transfer by collisionless field–particle interactions for each species
 ${\dot{E}}_{s}^{(fp)}$
is then computed using (3.5).
${\dot{E}}_{s}^{(fp)}$
is then computed using (3.5).
The rate of energy transfer by field–particle interactions
 ${\dot{E}}_{s}^{(fp)}$
(solid), the rate of change of non-thermal energy
${\dot{E}}_{s}^{(fp)}$
(solid), the rate of change of non-thermal energy
 ${\dot{E}}_{s}^{(nt)}$
(dotted) and the collisional heating rate
${\dot{E}}_{s}^{(nt)}$
(dotted) and the collisional heating rate
 $Q_{s}$
(dashed) for (a) ions (red) and (b) electrons (blue). (c) The energy balance between the loss of turbulent energy
$Q_{s}$
(dashed) for (a) ions (red) and (b) electrons (blue). (c) The energy balance between the loss of turbulent energy
 $-{\dot{E}}^{(\text{turb})}$
(purple solid) and the summed transfer of energy to both ions and electrons,
$-{\dot{E}}^{(\text{turb})}$
(purple solid) and the summed transfer of energy to both ions and electrons,
 ${\dot{E}}_{i}^{(fp)}+{\dot{E}}_{e}^{(fp)}$
(black dashed).
${\dot{E}}_{i}^{(fp)}+{\dot{E}}_{e}^{(fp)}$
(black dashed).
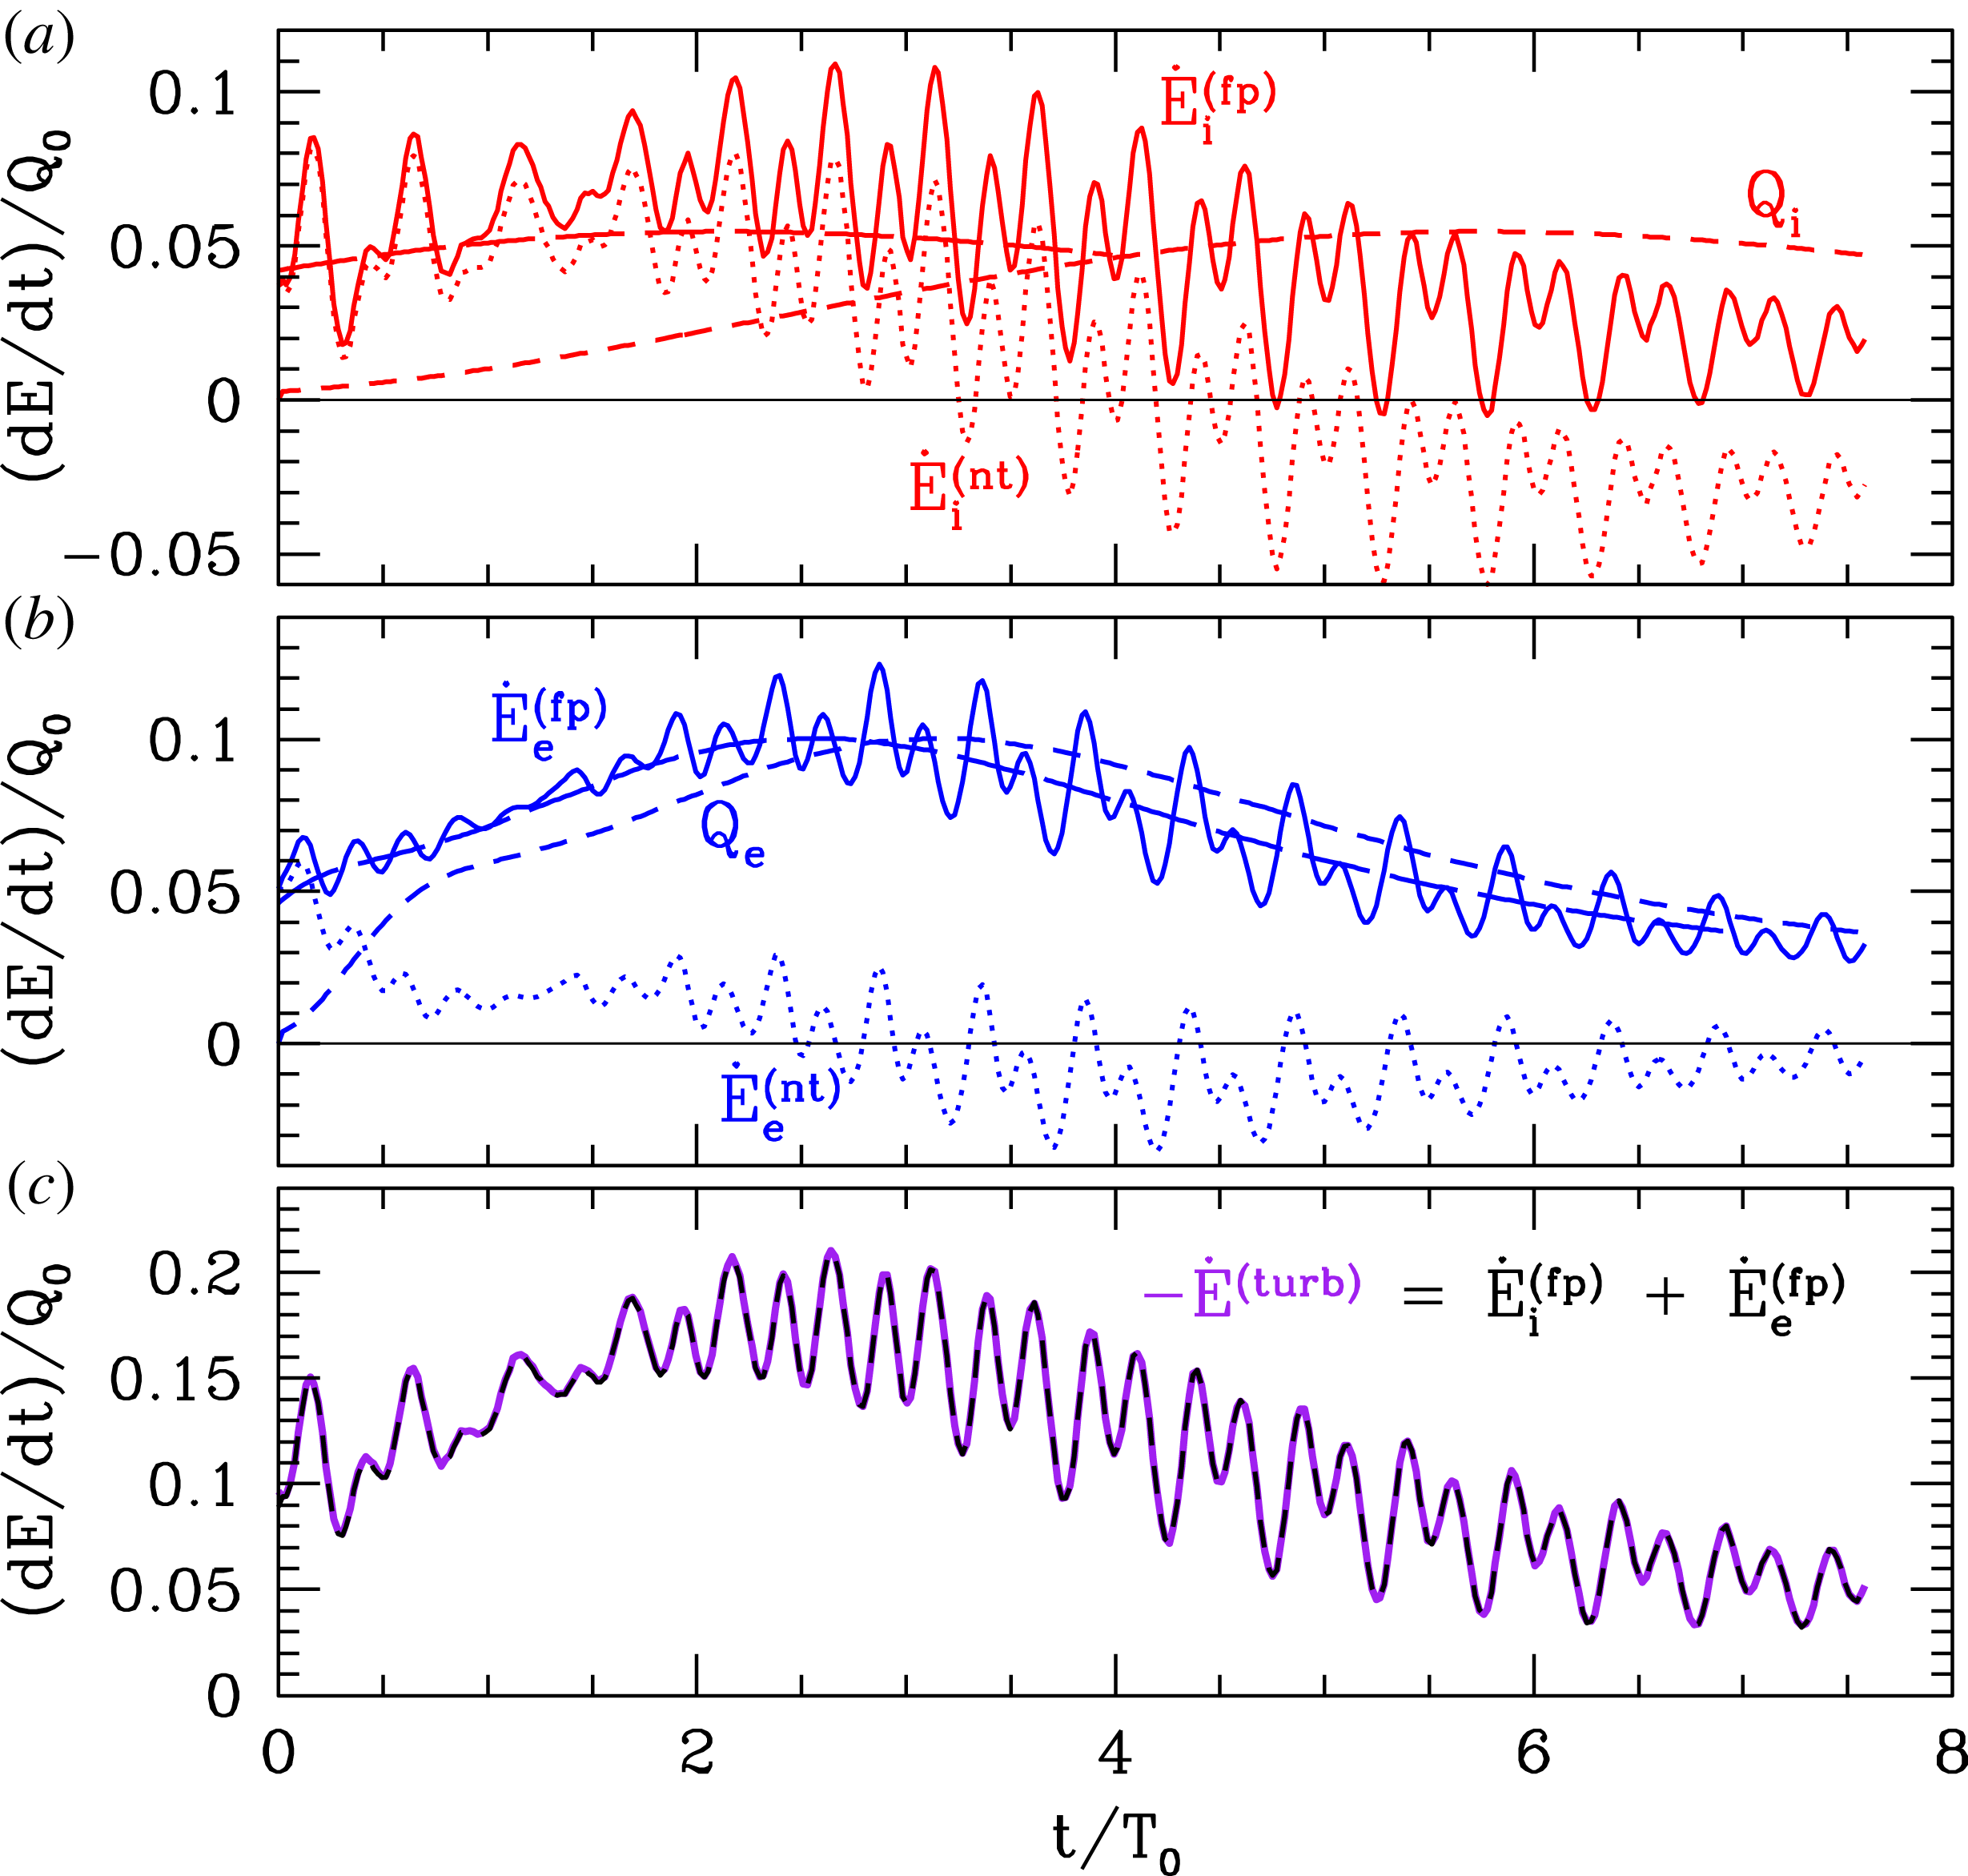
In figure 5, we present the terms of these energy transfer relations for the (a) ions and (b) electrons, as well as (c) the balance between the loss of turbulent energy and the field–particle energy transfer to each species. A few very interesting aspects of figure 5 are worth highlighting. First, although the change of turbulent energy
 $E^{(\text{turb})}$
and non-thermal energies
$E^{(\text{turb})}$
and non-thermal energies
 $E_{s}^{(nt)}$
in figure 2 appears to be smooth, the time derivative, which gives the rate of change, indeed varies rapidly, including a significant fluctuation with period
$E_{s}^{(nt)}$
in figure 2 appears to be smooth, the time derivative, which gives the rate of change, indeed varies rapidly, including a significant fluctuation with period
 $T_{0}/2$
.Footnote
4
$T_{0}/2$
.Footnote
4
Second, in figure 5(b), the energy transferred into electron non-thermal energy at the rate
 ${\dot{E}}_{e}^{(fp)}$
(solid) is very quickly thermalized by collisions into electron heat (dashed); the time lag between these two curves is
${\dot{E}}_{e}^{(fp)}$
(solid) is very quickly thermalized by collisions into electron heat (dashed); the time lag between these two curves is
 $\unicode[STIX]{x0394}t=0.6T_{0}$
(not shown), suggesting that non-thermal energy transferred into the electron velocity distribution is rapidly transferred by phase mixing to sufficiently small velocity-space scales to be thermalized by the weak collisions. For the ions in figure 5(a), on the other hand, the time lag between the energy transferred into non-thermal ion energy
$\unicode[STIX]{x0394}t=0.6T_{0}$
(not shown), suggesting that non-thermal energy transferred into the electron velocity distribution is rapidly transferred by phase mixing to sufficiently small velocity-space scales to be thermalized by the weak collisions. For the ions in figure 5(a), on the other hand, the time lag between the energy transferred into non-thermal ion energy
 ${\dot{E}}_{i}^{(fp)}$
and the thermalization of that ion energy is approximately
${\dot{E}}_{i}^{(fp)}$
and the thermalization of that ion energy is approximately
 $\unicode[STIX]{x0394}t=3.6T_{0}$
, a factor of
$\unicode[STIX]{x0394}t=3.6T_{0}$
, a factor of
 $\sqrt{m_{i}/m_{e}}=6$
longer, suggesting that the phase mixing occurs more slowly for ions by the ratio of the electron-to-ion thermal velocity. Note also that the collisionless field–particle energy transfer to ions indeed becomes negative at a few points in time, as allowed for a reversible process.
$\sqrt{m_{i}/m_{e}}=6$
longer, suggesting that the phase mixing occurs more slowly for ions by the ratio of the electron-to-ion thermal velocity. Note also that the collisionless field–particle energy transfer to ions indeed becomes negative at a few points in time, as allowed for a reversible process.
Furthermore, note that the magnitudes of
 ${\dot{E}}_{i}^{(fp)}$
and
${\dot{E}}_{i}^{(fp)}$
and
 ${\dot{E}}_{e}^{(fp)}$
are fairly similar, as expected because the linear damping rates, shown in figure 1, are fairly similar for ions and electrons,
${\dot{E}}_{e}^{(fp)}$
are fairly similar, as expected because the linear damping rates, shown in figure 1, are fairly similar for ions and electrons,
 $\unicode[STIX]{x1D6FE}_{i}\simeq \unicode[STIX]{x1D6FE}_{e}$
, over the range of spatial scales
$\unicode[STIX]{x1D6FE}_{i}\simeq \unicode[STIX]{x1D6FE}_{e}$
, over the range of spatial scales
 $k_{\bot }\unicode[STIX]{x1D70C}_{i}<1$
that contain most of the energy in the simulation. Finally, in figure 5(c), we see that the energy lost by the turbulence
$k_{\bot }\unicode[STIX]{x1D70C}_{i}<1$
that contain most of the energy in the simulation. Finally, in figure 5(c), we see that the energy lost by the turbulence
 $-{\dot{E}}^{(\text{turb})}$
(purple solid) is indeed balanced by the sum of the field–particle energy transfer to ions and electrons (black dashed).
$-{\dot{E}}^{(\text{turb})}$
(purple solid) is indeed balanced by the sum of the field–particle energy transfer to ions and electrons (black dashed).
3.5 Evolution of the total energy budget
Plots of the total energy budget as a function of time in the simulation nicely summarize the flow of energy in the simulation. First, we account for the energy lost from
 $\unicode[STIX]{x1D6FF}W$
in the AstroGK simulation to collisional plasma heating by accumulating the thermalized energy in each species over time,
$\unicode[STIX]{x1D6FF}W$
in the AstroGK simulation to collisional plasma heating by accumulating the thermalized energy in each species over time,
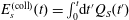 $E_{s}^{(\text{coll})}(t)=\int _{0}^{t}\text{d}t^{\prime }Q_{S}(t^{\prime })$
.
$E_{s}^{(\text{coll})}(t)=\int _{0}^{t}\text{d}t^{\prime }Q_{S}(t^{\prime })$
.
(a) The energy budget of the simulation versus time, showing the turbulent energy
 $E^{(\text{turb})}$
, non-thermal ion energy
$E^{(\text{turb})}$
, non-thermal ion energy
 $E_{i}^{(nt)}$
, non-thermal electron energy
$E_{i}^{(nt)}$
, non-thermal electron energy
 $E_{e}^{(nt)}$
, ion heat
$E_{e}^{(nt)}$
, ion heat
 $E_{i}^{(\text{coll})}$
and electron heat
$E_{i}^{(\text{coll})}$
and electron heat
 $E_{e}^{(\text{coll})}$
. (b) The same energy budget decomposed according to (3.1), showing the perpendicular magnetic field energy
$E_{e}^{(\text{coll})}$
. (b) The same energy budget decomposed according to (3.1), showing the perpendicular magnetic field energy
 $E_{B_{\bot }}$
, parallel magnetic field energy
$E_{B_{\bot }}$
, parallel magnetic field energy
 $E_{B_{\Vert }}$
(cyan, not labelled, appearing between
$E_{B_{\Vert }}$
(cyan, not labelled, appearing between
 $E_{B_{\bot }}$
and
$E_{B_{\bot }}$
and
 $E_{i}^{(\unicode[STIX]{x1D6FF}f)}$
), total fluctuating ion kinetic energy
$E_{i}^{(\unicode[STIX]{x1D6FF}f)}$
), total fluctuating ion kinetic energy
 $E_{i}^{(\unicode[STIX]{x1D6FF}f)}$
, total fluctuating electron kinetic energy
$E_{i}^{(\unicode[STIX]{x1D6FF}f)}$
, total fluctuating electron kinetic energy
 $E_{e}^{(\unicode[STIX]{x1D6FF}f)}$
, ion heat
$E_{e}^{(\unicode[STIX]{x1D6FF}f)}$
, ion heat
 $E_{i}^{(\text{coll})}$
and electron heat
$E_{i}^{(\text{coll})}$
and electron heat
 $E_{e}^{(\text{coll})}$
. The total fluctuating energy
$E_{e}^{(\text{coll})}$
. The total fluctuating energy
 $\unicode[STIX]{x1D6FF}W$
is shown in both panels (thick black line).
$\unicode[STIX]{x1D6FF}W$
is shown in both panels (thick black line).
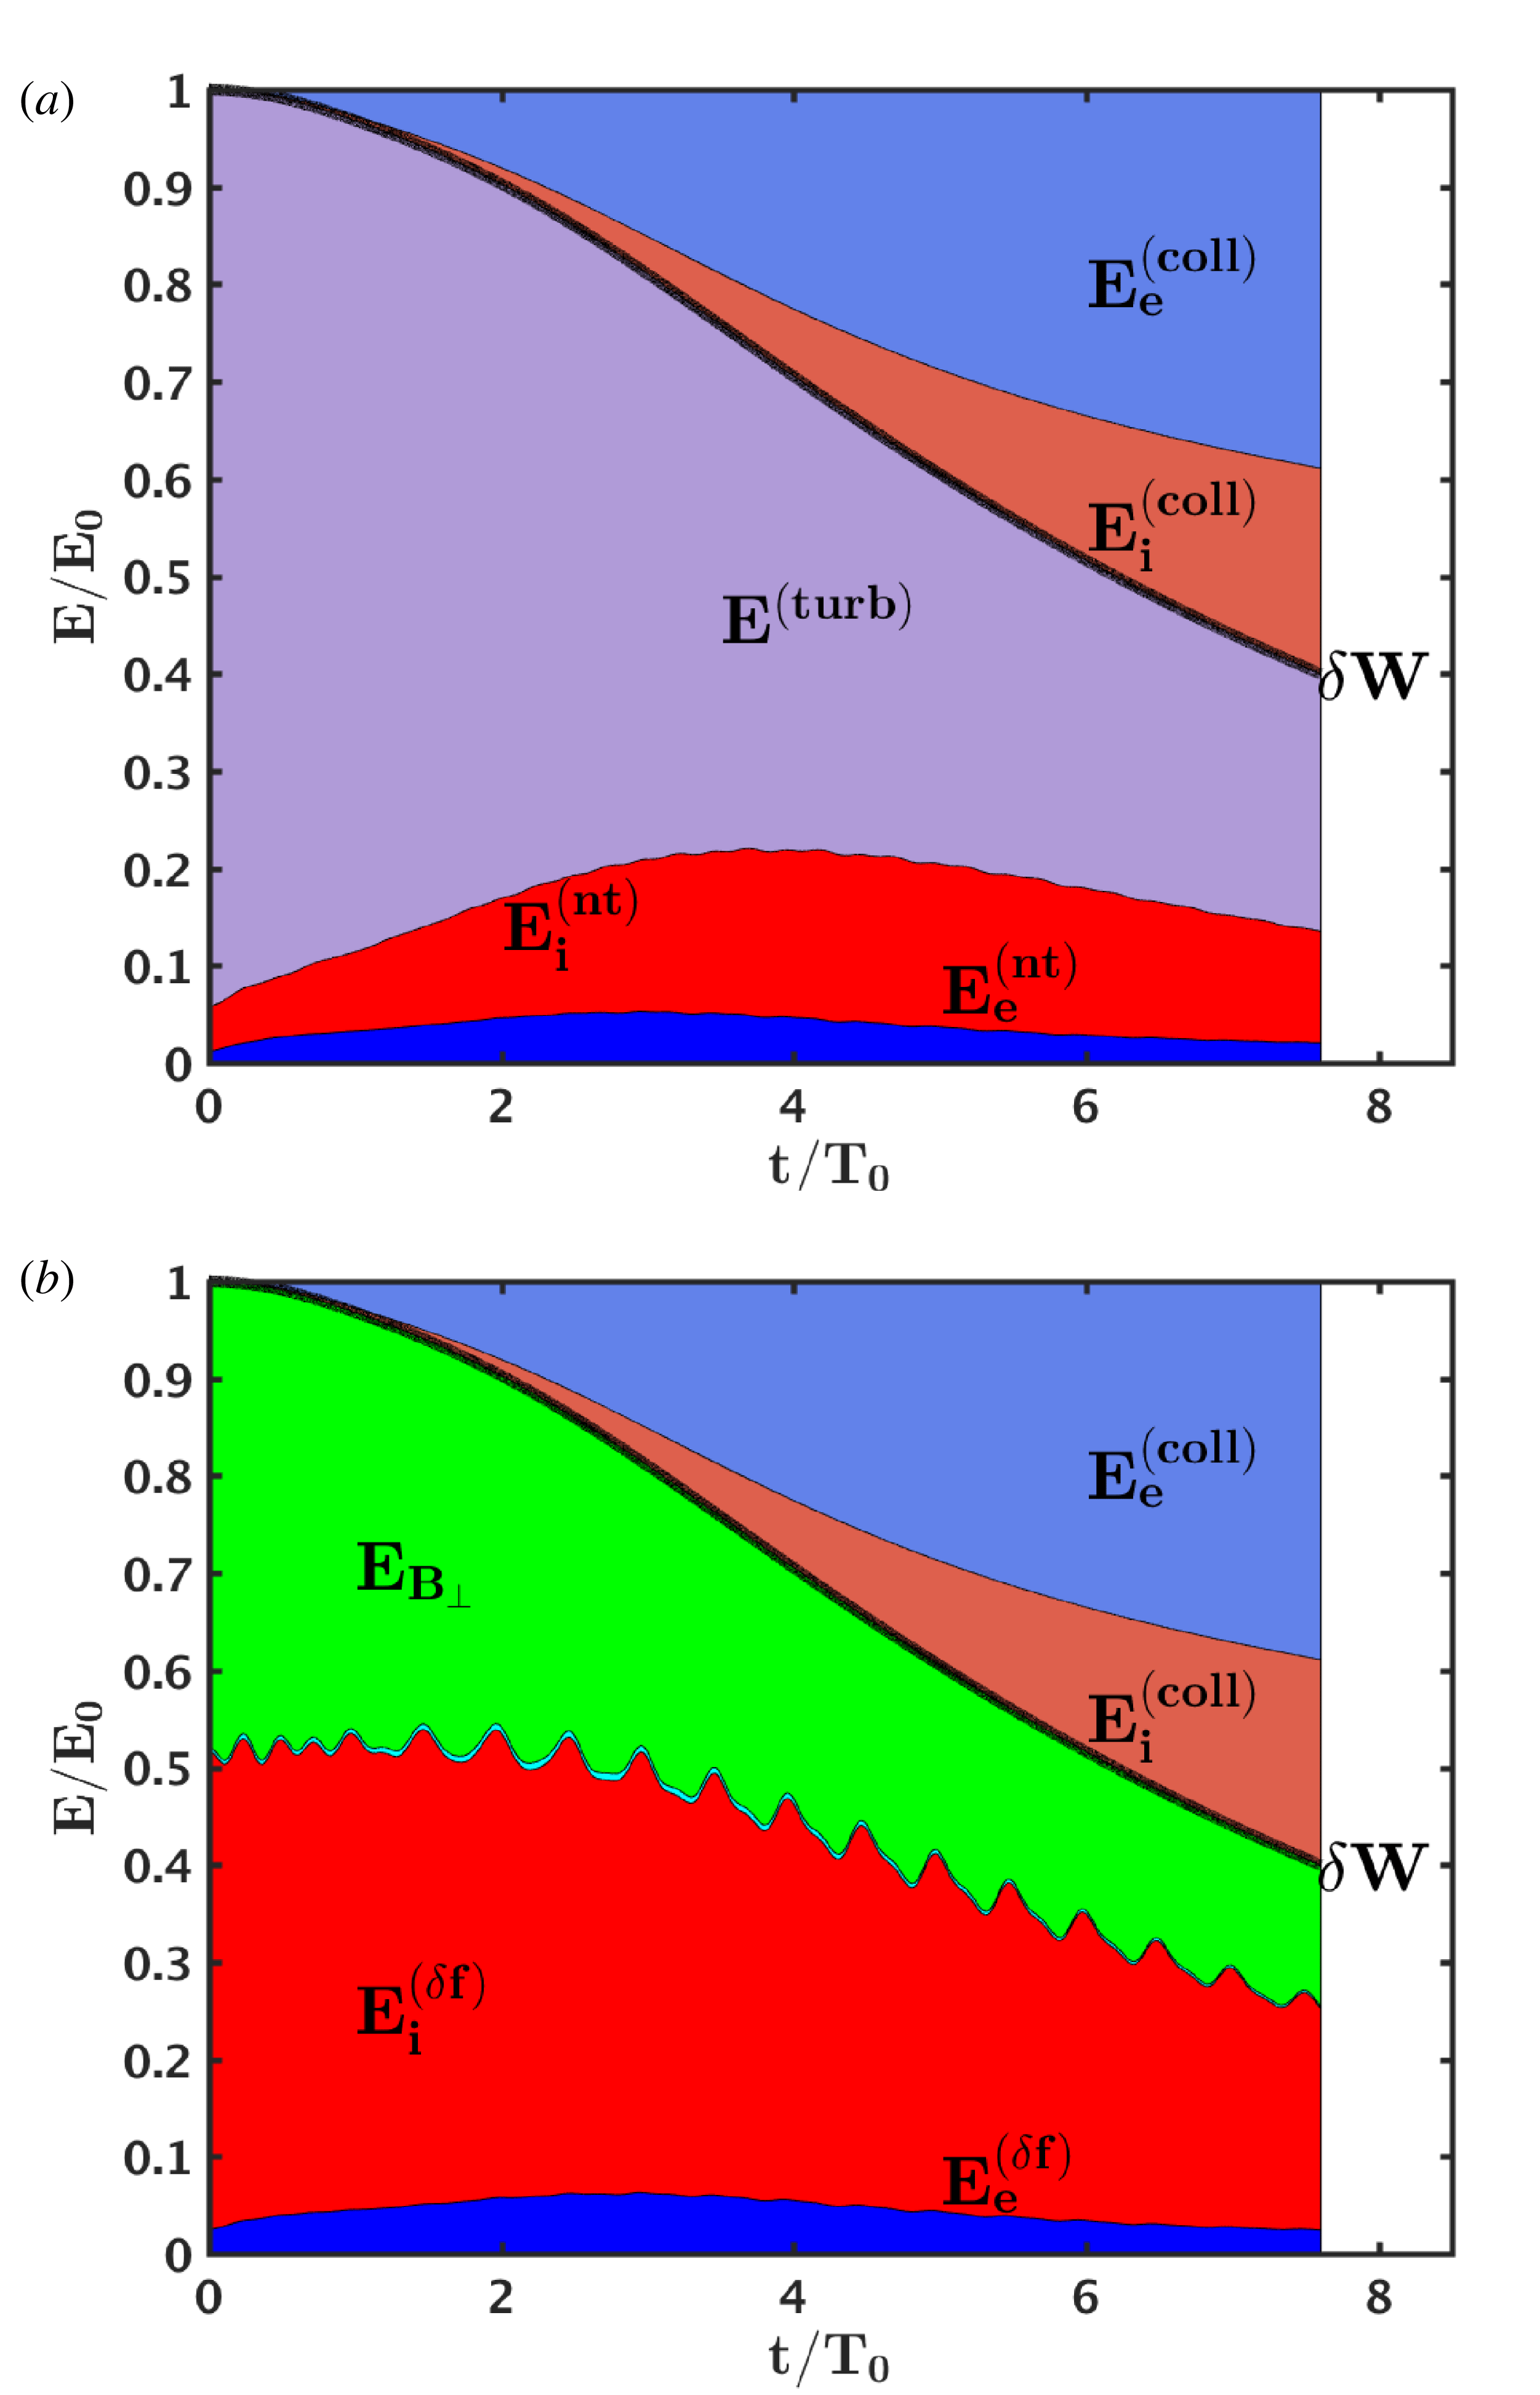
In figure 6(a), we plot the evolution of the energy budget over the course of the simulation, showing that turbulent energy
 $E^{(\text{turb})}$
, which dominates at the beginning of the simulation, is largely converted to ion heat
$E^{(\text{turb})}$
, which dominates at the beginning of the simulation, is largely converted to ion heat
 $E_{i}^{(\text{coll})}$
and electron heat
$E_{i}^{(\text{coll})}$
and electron heat
 $E_{e}^{(\text{coll})}$
by the end of the simulation, with a smaller fraction of the lost turbulent energy persisting as non-thermal ion energy
$E_{e}^{(\text{coll})}$
by the end of the simulation, with a smaller fraction of the lost turbulent energy persisting as non-thermal ion energy
 $E_{i}^{(nt)}$
and electron energy
$E_{i}^{(nt)}$
and electron energy
 $E_{e}^{(nt)}$
. Also indicated in figure 6(a) is the evolution of the total fluctuating energy
$E_{e}^{(nt)}$
. Also indicated in figure 6(a) is the evolution of the total fluctuating energy
 $\unicode[STIX]{x1D6FF}W$
(thick black line), showing that 60 % of this energy has been lost to plasma heating over 7.5 periods of the initial Alfvén waves. Another interesting point is that, although electrons are heated twice as much as ions, the non-thermal electron energy content of the simulation always remains very small. This point is consistent with the idea, introduced in § 3.4 above, that non-thermal energy transferred into the electron velocity distribution function by collisionless damping of the turbulence is very rapidly thermalized into electron heat. This analysis of the evolution of the total energy budget shows that energy is conserved to within 0.1 % over the course of the simulation.
$\unicode[STIX]{x1D6FF}W$
(thick black line), showing that 60 % of this energy has been lost to plasma heating over 7.5 periods of the initial Alfvén waves. Another interesting point is that, although electrons are heated twice as much as ions, the non-thermal electron energy content of the simulation always remains very small. This point is consistent with the idea, introduced in § 3.4 above, that non-thermal energy transferred into the electron velocity distribution function by collisionless damping of the turbulence is very rapidly thermalized into electron heat. This analysis of the evolution of the total energy budget shows that energy is conserved to within 0.1 % over the course of the simulation.
One can alternatively divide the contributions to the energy budget in terms of (3.1), as shown in figure 6(b), showing the perpendicular magnetic field energy
 $E_{B_{\bot }}$
(green), the parallel magnetic field energy
$E_{B_{\bot }}$
(green), the parallel magnetic field energy
 $E_{B_{\Vert }}$
(cyan), the total fluctuating ion kinetic energy
$E_{B_{\Vert }}$
(cyan), the total fluctuating ion kinetic energy
 $E_{i}^{(\unicode[STIX]{x1D6FF}f)}$
(red) and the total fluctuating electron kinetic energy
$E_{i}^{(\unicode[STIX]{x1D6FF}f)}$
(red) and the total fluctuating electron kinetic energy
 $E_{e}^{(\unicode[STIX]{x1D6FF}f)}$
(blue). Note that, as anticipated from the contributions to the turbulent energy in figure 2(b), the turbulent energy in figure 6(a) is largely composed of perpendicular magnetic energy
$E_{e}^{(\unicode[STIX]{x1D6FF}f)}$
(blue). Note that, as anticipated from the contributions to the turbulent energy in figure 2(b), the turbulent energy in figure 6(a) is largely composed of perpendicular magnetic energy
 $E_{B_{\bot }}$
and kinetic energy of the perpendicular ion bulk flows
$E_{B_{\bot }}$
and kinetic energy of the perpendicular ion bulk flows
 $E_{i,u_{\bot }}$
. The wiggly boundary between
$E_{i,u_{\bot }}$
. The wiggly boundary between
 $E_{B_{\bot }}$
and
$E_{B_{\bot }}$
and
 $E_{i,u_{\bot }}$
is a consequence of the Alfvénic fluctuations, and their nonlinear interactions, in the simulation.
$E_{i,u_{\bot }}$
is a consequence of the Alfvénic fluctuations, and their nonlinear interactions, in the simulation.
One final point is that, although one may choose to decompose the different contributions to the energy using (3.1) in figure 6(b), by organizing the energies instead according to the turbulent energy
 $E^{(\text{turb})}=\int \text{d}^{3}\boldsymbol{r}[(|\unicode[STIX]{x1D6FF}\boldsymbol{B}|^{2}+|\unicode[STIX]{x1D6FF}\boldsymbol{E}|^{2})/8\unicode[STIX]{x03C0}+\sum _{s}(1/2)n_{0s}m_{s}|\unicode[STIX]{x1D6FF}\boldsymbol{u}_{\boldsymbol{s}}|^{2}]$
and the species non-thermal energies
$E^{(\text{turb})}=\int \text{d}^{3}\boldsymbol{r}[(|\unicode[STIX]{x1D6FF}\boldsymbol{B}|^{2}+|\unicode[STIX]{x1D6FF}\boldsymbol{E}|^{2})/8\unicode[STIX]{x03C0}+\sum _{s}(1/2)n_{0s}m_{s}|\unicode[STIX]{x1D6FF}\boldsymbol{u}_{\boldsymbol{s}}|^{2}]$
and the species non-thermal energies
 $E_{s}^{(nt)}$
, the interpretation of the energy flow is much more physically motivated, as illustrated by figure 4. By simply plotting
$E_{s}^{(nt)}$
, the interpretation of the energy flow is much more physically motivated, as illustrated by figure 4. By simply plotting
 $E_{i}^{(\unicode[STIX]{x1D6FF}f)}$
as a function of time, one does not see the important split between the large fraction of the total fluctuating ion kinetic energy
$E_{i}^{(\unicode[STIX]{x1D6FF}f)}$
as a function of time, one does not see the important split between the large fraction of the total fluctuating ion kinetic energy
 $E_{i}^{(\unicode[STIX]{x1D6FF}f)}$
that is associated with turbulent fluctuations of the bulk ion velocity and the remainder that corresponds to the non-thermal energy that is not associated with those turbulent fluctuations.
$E_{i}^{(\unicode[STIX]{x1D6FF}f)}$
that is associated with turbulent fluctuations of the bulk ion velocity and the remainder that corresponds to the non-thermal energy that is not associated with those turbulent fluctuations.
4 Development of current sheets and spatially localized particle energization
In the limit of strong nonlinearity,
 $\unicode[STIX]{x1D712}\sim 1$
– corresponding to the important case of critically balanced, strong MHD turbulence (Goldreich & Sridhar Reference Goldreich and Sridhar1995) – recent work has shown that Alfvén wave collisions self-consistently develop spatially localized current sheets (Howes Reference Howes2016). This finding may indeed explain the ubiquitous current sheets found to develop in simulations of plasma turbulence (Wan et al.
Reference Wan, Matthaeus, Karimabadi, Roytershteyn, Shay, Wu, Daughton, Loring and Chapman2012; Karimabadi et al.
Reference Karimabadi, Roytershteyn, Wan, Matthaeus, Daughton, Wu, Shay, Loring, Borovsky and Leonardis2013; TenBarge & Howes Reference TenBarge and Howes2013; Wu et al.
Reference Wu, Perri, Osman, Wan, Matthaeus, Shay, Goldstein, Karimabadi and Chapman2013; Zhdankin et al.
Reference Zhdankin, Uzdensky, Perez and Boldyrev2013) and inferred from spacecraft observations of the solar wind (Borovsky & Denton Reference Borovsky and Denton2011; Osman et al.
Reference Osman, Matthaeus, Greco and Servidio2011, Reference Osman, Matthaeus, Wan and Rappazzo2012; Perri et al.
Reference Perri, Goldstein, Dorelli and Sahraoui2012; Wang et al.
Reference Wang, Tu, He, Marsch and Wang2013; Wu et al.
Reference Wu, Perri, Osman, Wan, Matthaeus, Shay, Goldstein, Karimabadi and Chapman2013; Osman et al.
Reference Osman, Matthaeus, Gosling, Greco, Servidio, Hnat, Chapman and Phan2014). Yet how this self-consistent development of current sheets influences the physical mechanisms that remove energy from plasma turbulence remains unanswered. We show in this section that the simulation reported here indeed develops localized current sheets (localized in both time and space), and in § 5 we employ the field–particle correlation technique to examine the physical mechanism that removes energy from the turbulent fluctuations.
$\unicode[STIX]{x1D712}\sim 1$
– corresponding to the important case of critically balanced, strong MHD turbulence (Goldreich & Sridhar Reference Goldreich and Sridhar1995) – recent work has shown that Alfvén wave collisions self-consistently develop spatially localized current sheets (Howes Reference Howes2016). This finding may indeed explain the ubiquitous current sheets found to develop in simulations of plasma turbulence (Wan et al.
Reference Wan, Matthaeus, Karimabadi, Roytershteyn, Shay, Wu, Daughton, Loring and Chapman2012; Karimabadi et al.
Reference Karimabadi, Roytershteyn, Wan, Matthaeus, Daughton, Wu, Shay, Loring, Borovsky and Leonardis2013; TenBarge & Howes Reference TenBarge and Howes2013; Wu et al.
Reference Wu, Perri, Osman, Wan, Matthaeus, Shay, Goldstein, Karimabadi and Chapman2013; Zhdankin et al.
Reference Zhdankin, Uzdensky, Perez and Boldyrev2013) and inferred from spacecraft observations of the solar wind (Borovsky & Denton Reference Borovsky and Denton2011; Osman et al.
Reference Osman, Matthaeus, Greco and Servidio2011, Reference Osman, Matthaeus, Wan and Rappazzo2012; Perri et al.
Reference Perri, Goldstein, Dorelli and Sahraoui2012; Wang et al.
Reference Wang, Tu, He, Marsch and Wang2013; Wu et al.
Reference Wu, Perri, Osman, Wan, Matthaeus, Shay, Goldstein, Karimabadi and Chapman2013; Osman et al.
Reference Osman, Matthaeus, Gosling, Greco, Servidio, Hnat, Chapman and Phan2014). Yet how this self-consistent development of current sheets influences the physical mechanisms that remove energy from plasma turbulence remains unanswered. We show in this section that the simulation reported here indeed develops localized current sheets (localized in both time and space), and in § 5 we employ the field–particle correlation technique to examine the physical mechanism that removes energy from the turbulent fluctuations.
Plots of parallel current
 $j_{\Vert }/j_{0}$
(colour bar) and contours of the parallel vector potential
$j_{\Vert }/j_{0}$
(colour bar) and contours of the parallel vector potential
 $A_{\Vert }$
(contours, positive black, negative white) at times
$A_{\Vert }$
(contours, positive black, negative white) at times
 $t/T_{0}=$
(a) 1.38, (b) 1.75, (c) 1.86 and (d) 2.03.
$t/T_{0}=$
(a) 1.38, (b) 1.75, (c) 1.86 and (d) 2.03.

In figure 7 we plot the current density parallel to the mean magnetic field
 $j_{\Vert }/j_{0}$
(colour bar) and contours of parallel vector potential
$j_{\Vert }/j_{0}$
(colour bar) and contours of parallel vector potential
 $A_{\Vert }$
(positive black, negative white) in the plane
$A_{\Vert }$
(positive black, negative white) in the plane
 $z/L_{\Vert }=-0.25$
, where the simulation domain spans
$z/L_{\Vert }=-0.25$
, where the simulation domain spans
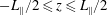 $-L_{\Vert }/2\leqslant z\leqslant L_{\Vert }/2$
and
$-L_{\Vert }/2\leqslant z\leqslant L_{\Vert }/2$
and
 $j_{0}=n_{0}q_{i}v_{ti}L_{\bot }/L_{\Vert }$
. We plot the evolution of the current in this plane at four different times in the evolution of the strong Alfvén wave collision,
$j_{0}=n_{0}q_{i}v_{ti}L_{\bot }/L_{\Vert }$
. We plot the evolution of the current in this plane at four different times in the evolution of the strong Alfvén wave collision,
 $t/T_{0}=$
(a) 1.38, (b) 1.62, (c) 1.86 and (d) 2.10. Here
$t/T_{0}=$
(a) 1.38, (b) 1.62, (c) 1.86 and (d) 2.10. Here
 $T_{0}=2\unicode[STIX]{x03C0}/\unicode[STIX]{x1D714}$
is the period of the initial Alfvén waves, where the gyrokinetic linear dispersion relation gives
$T_{0}=2\unicode[STIX]{x03C0}/\unicode[STIX]{x1D714}$
is the period of the initial Alfvén waves, where the gyrokinetic linear dispersion relation gives
 $\unicode[STIX]{x1D714}/k_{\Vert }v_{A}=0.995$
and
$\unicode[STIX]{x1D714}/k_{\Vert }v_{A}=0.995$
and
 $\unicode[STIX]{x1D6FE}/k_{\Vert }v_{A}=-6.10\times 10^{-3}$
. These plots show the presence of spatially non-uniform, elongated sheets of localized current density. Over a single initial Alfvén wave period
$\unicode[STIX]{x1D6FE}/k_{\Vert }v_{A}=-6.10\times 10^{-3}$
. These plots show the presence of spatially non-uniform, elongated sheets of localized current density. Over a single initial Alfvén wave period
 $T_{0}$
, two current sheets form at slightly different times, become thinner and more intense, and then disappear. One of these current sheets appears in the upper right quadrant of the plane
$T_{0}$
, two current sheets form at slightly different times, become thinner and more intense, and then disappear. One of these current sheets appears in the upper right quadrant of the plane
 $z/L_{\Vert }=-0.25$
, and the other in the lower left quadrant, as shown in figure 7. During this time, their cross-sections in the plane plotted in figure 7 moves slowly across the quadrant of the domain in which each appears (but these spatially localized current sheets do not cross the entire domain, as would be expected from a strictly linear fluctuation). The general picture of current sheet development and evolution in a strong Alfvén wave collision is described in more quantitative detail by Howes (Reference Howes2016); although the parameters of this simulation are slightly different, the evolution of the current sheets is qualitatively similar here.
$z/L_{\Vert }=-0.25$
, and the other in the lower left quadrant, as shown in figure 7. During this time, their cross-sections in the plane plotted in figure 7 moves slowly across the quadrant of the domain in which each appears (but these spatially localized current sheets do not cross the entire domain, as would be expected from a strictly linear fluctuation). The general picture of current sheet development and evolution in a strong Alfvén wave collision is described in more quantitative detail by Howes (Reference Howes2016); although the parameters of this simulation are slightly different, the evolution of the current sheets is qualitatively similar here.
4.1 Spatial distribution of parallel electromagnetic work,
 $j_{\Vert }E_{\Vert }$

As shown in § 3, over the full time of the simulation,
 $7.5T_{0}$
, 60 % of the fluctuating energy
$7.5T_{0}$
, 60 % of the fluctuating energy
 $\unicode[STIX]{x1D6FF}W$
of the initial Alfvén waves is removed from the fluctuations in the plasma. Figure 3 shows that this energy is ultimately irreversibly converted into electron and ion heat through the weak but finite collisionality in the plasma. As the model of energy flow illustrated in figure 4 shows, this energy is initially removed from the turbulent electromagnetic fluctuations (Howes Reference Howes2015, Reference Howes2017) through collisionless interactions between the electromagnetic fields and the individual plasma particles. In a kinetic plasma, the rate of electromagnetic work done on the particles by the fields is given by
$\unicode[STIX]{x1D6FF}W$
of the initial Alfvén waves is removed from the fluctuations in the plasma. Figure 3 shows that this energy is ultimately irreversibly converted into electron and ion heat through the weak but finite collisionality in the plasma. As the model of energy flow illustrated in figure 4 shows, this energy is initially removed from the turbulent electromagnetic fluctuations (Howes Reference Howes2015, Reference Howes2017) through collisionless interactions between the electromagnetic fields and the individual plasma particles. In a kinetic plasma, the rate of electromagnetic work done on the particles by the fields is given by
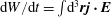 $\text{d}W/\text{d}t=\int \text{d}^{3}\boldsymbol{r}\boldsymbol{j}\boldsymbol{\cdot }\boldsymbol{E}$
(Howes, Klein & Li Reference Howes, Klein and Li2017; Klein Reference Klein2017). Therefore, plotting the rate of electromagnetic work
$\text{d}W/\text{d}t=\int \text{d}^{3}\boldsymbol{r}\boldsymbol{j}\boldsymbol{\cdot }\boldsymbol{E}$
(Howes, Klein & Li Reference Howes, Klein and Li2017; Klein Reference Klein2017). Therefore, plotting the rate of electromagnetic work
 $\boldsymbol{j}\boldsymbol{\cdot }\boldsymbol{E}$
as a function of position provides useful insights into the particle energization in the plasma.
$\boldsymbol{j}\boldsymbol{\cdot }\boldsymbol{E}$
as a function of position provides useful insights into the particle energization in the plasma.
Plots of
 $j_{\Vert }E_{\Vert }$
(colour bar) and contours of the parallel vector potential
$j_{\Vert }E_{\Vert }$
(colour bar) and contours of the parallel vector potential
 $A_{\Vert }$
(contours, positive solid, negative dashed) at times
$A_{\Vert }$
(contours, positive solid, negative dashed) at times
 $t/T_{0}=$
(a) 1.75, (b) 1.86, and (c) 2.03, as well as (d)
$t/T_{0}=$
(a) 1.75, (b) 1.86, and (c) 2.03, as well as (d)
 $\langle j_{\Vert }E_{\Vert }\rangle _{\unicode[STIX]{x1D70F}}$
, the rate of electromagnetic work per unit volume averaged over approximately one full wave period,
$\langle j_{\Vert }E_{\Vert }\rangle _{\unicode[STIX]{x1D70F}}$
, the rate of electromagnetic work per unit volume averaged over approximately one full wave period,
 $\unicode[STIX]{x1D70F}=0.992T_{0}$
, centred at time
$\unicode[STIX]{x1D70F}=0.992T_{0}$
, centred at time
 $t/T_{0}=1.86$
.
$t/T_{0}=1.86$
.

As shown in appendix B, in this simulation the dominant electromagnetic work is done by the component of the electric field parallel to the magnetic field,
 $E_{\Vert }$
, so in figure 8 we plot the instantaneous value of dimensionless rate of work per unit volume
$E_{\Vert }$
, so in figure 8 we plot the instantaneous value of dimensionless rate of work per unit volume
 $j_{\Vert }E_{\Vert }/Q_{0}$
as a function of position in the plane
$j_{\Vert }E_{\Vert }/Q_{0}$
as a function of position in the plane
 $z/L_{\Vert }=-0.25$
at three different times during the simulation
$z/L_{\Vert }=-0.25$
at three different times during the simulation
 $t/T_{0}=$
(a) 1.75, (b) 1.86 and (c) 2.03. Note that the value of
$t/T_{0}=$
(a) 1.75, (b) 1.86 and (c) 2.03. Note that the value of
 $j_{\Vert }E_{\Vert }$
is physically interpreted as the rate of transfer of spatial energy density between the parallel electric field
$j_{\Vert }E_{\Vert }$
is physically interpreted as the rate of transfer of spatial energy density between the parallel electric field
 $E_{\Vert }$
and the plasma ions and electrons. Since this electromagnetic work is reversible, its value can be positive or negative, where positive means work done on the particles by the field, and negative means work done on the field by the particles.
$E_{\Vert }$
and the plasma ions and electrons. Since this electromagnetic work is reversible, its value can be positive or negative, where positive means work done on the particles by the field, and negative means work done on the field by the particles.
As emphasized in Howes et al. (Reference Howes, Klein and Li2017), the instantaneous energy transfer between fields and particles has two components: (i) an oscillating energy transfer back and forth between fields and particles that is typical of undamped linear wave motion in a kinetic plasma, and (ii) a secular energy transfer that represents the energy lost from the electromagnetic fluctuations to the plasma particles through collisionless damping. To determine the particle energization, it is the secular energy transfer that is of interest, but the challenge is that the oscillating energy transfer often has a much larger amplitude than the secular energy transfer. However, if a time average is taken over a suitably chosen averaging interval, the oscillating energy transfer will largely cancel out, exposing the smaller secular energy transfer that is sought. In this strong Alfvén wave collision simulation, the linear period
 $T_{0}$
of the initial Alfvén waves is an appropriate choice for this time averaging, and we plot in figure 8(d) the time average of
$T_{0}$
of the initial Alfvén waves is an appropriate choice for this time averaging, and we plot in figure 8(d) the time average of
 $\langle j_{\Vert }E_{\Vert }\rangle _{\unicode[STIX]{x1D70F}}$
over an interval
$\langle j_{\Vert }E_{\Vert }\rangle _{\unicode[STIX]{x1D70F}}$
over an interval
 $\unicode[STIX]{x1D70F}=0.992T_{0}$
centred at time
$\unicode[STIX]{x1D70F}=0.992T_{0}$
centred at time
 $t/T_{0}=1.86$
.
$t/T_{0}=1.86$
.
The plots shown in figure 8 convey a number of valuable insights into the particle energization in this simulation. First, the plots in figure 8(a–c) show clearly that the instantaneous rate of energy transfer is both spatially and temporally non-uniform, with the energy transfer localized in sheet-like structures reminiscent of the current sheets plotted in figure 7. An example of the temporal variation is illustrated by observing the changes in the instantaneous energy transfer rate at point A marked on each plot. At (a)
 $t/T_{0}=1.75$
, the plasma is energized by
$t/T_{0}=1.75$
, the plasma is energized by
 $E_{\Vert }$
, but later at (b)
$E_{\Vert }$
, but later at (b)
 $t/T_{0}=1.86$
the plasma is losing energy to
$t/T_{0}=1.86$
the plasma is losing energy to
 $E_{\Vert }$
and finally at (c)
$E_{\Vert }$
and finally at (c)
 $t/T_{0}=2.03$
there is very little energy transfer either direction. Averaged over one period, figure 8(d) shows that the plasma gains energy from the parallel electric field at point A. Curiously, the instantaneous energy transfer from fields to particles at
$t/T_{0}=2.03$
there is very little energy transfer either direction. Averaged over one period, figure 8(d) shows that the plasma gains energy from the parallel electric field at point A. Curiously, the instantaneous energy transfer from fields to particles at
 $t/T_{0}=1.86$
in figure 8(b) is negative at point A, but the single-period average, centred at that same time
$t/T_{0}=1.86$
in figure 8(b) is negative at point A, but the single-period average, centred at that same time
 $t/T_{0}=1.86$
in figure 8(d) shows a positive transfer of energy to the particles at the same position. This plot stresses the importance of appropriate time averaging to properly understand the net particle energization in a turbulent plasma.
$t/T_{0}=1.86$
in figure 8(d) shows a positive transfer of energy to the particles at the same position. This plot stresses the importance of appropriate time averaging to properly understand the net particle energization in a turbulent plasma.
Plots of
 $\langle j_{\Vert }E_{\Vert }\rangle _{\unicode[STIX]{x1D70F}}$
averaged over approximately one full wave period,
$\langle j_{\Vert }E_{\Vert }\rangle _{\unicode[STIX]{x1D70F}}$
averaged over approximately one full wave period,
 $\unicode[STIX]{x1D70F}=0.992T_{0}$
, centred at times
$\unicode[STIX]{x1D70F}=0.992T_{0}$
, centred at times
 $t/T_{0}=$
(a) 1.75, (b) 2.03 and (c) 2.85 and (d) 3.84, showing that the qualitative spatial pattern of time-averaged particle energization is remarkably static over the evolution of the simulation.
$t/T_{0}=$
(a) 1.75, (b) 2.03 and (c) 2.85 and (d) 3.84, showing that the qualitative spatial pattern of time-averaged particle energization is remarkably static over the evolution of the simulation.

Second, the net plasma energization over one period in figure 8(d) is also spatially localized, with plasma energization at point A, a net loss of energy at point B and little energy change at point C. It is also worthwhile pointing out that the magnitude of the time-averaged energy transfer is smaller in magnitude than the instantaneous energy transfer, as expected if some fraction of this energy transfer is oscillatory and largely cancels out when averaged over one period
 $T_{0}$
. Together, the four panels demonstrate the key point that that the particle energization is spatially non-uniform, both instantaneously as well as when averaged over one period
$T_{0}$
. Together, the four panels demonstrate the key point that that the particle energization is spatially non-uniform, both instantaneously as well as when averaged over one period
 $T_{0}$
of the initial Alfvén waves.
$T_{0}$
of the initial Alfvén waves.
Third, something that cannot be appreciated by the single time slice in figure 8(d), is the surprising result that the single-period-averaged plasma energization has very little temporal variation as the centre of the time-average window is advanced over one period. In figure 9, we present
 $\langle j_{\Vert }E_{\Vert }\rangle _{\unicode[STIX]{x1D70F}}$
time averaged over an interval
$\langle j_{\Vert }E_{\Vert }\rangle _{\unicode[STIX]{x1D70F}}$
time averaged over an interval
 $\unicode[STIX]{x1D70F}=0.992T_{0}$
centred at times
$\unicode[STIX]{x1D70F}=0.992T_{0}$
centred at times
 $t/T_{0}=$
(a) 1.75, (b) 2.03 and (c) 2.85 and (d) 3.84. Although the instantaneous spatial distribution of
$t/T_{0}=$
(a) 1.75, (b) 2.03 and (c) 2.85 and (d) 3.84. Although the instantaneous spatial distribution of
 $j_{\Vert }E_{\Vert }$
changes significantly over the wave period, for example shown at
$j_{\Vert }E_{\Vert }$
changes significantly over the wave period, for example shown at
 $t/T_{0}=$
(a) 1.75, (b) 1.86 and (c) 2.03 in figure 8, the corresponding single-period-averaged plasma energization
$t/T_{0}=$
(a) 1.75, (b) 1.86 and (c) 2.03 in figure 8, the corresponding single-period-averaged plasma energization
 $\langle j_{\Vert }E_{\Vert }\rangle _{\unicode[STIX]{x1D70F}}$
centred at the same times changes little, shown in figure 9(a) at
$\langle j_{\Vert }E_{\Vert }\rangle _{\unicode[STIX]{x1D70F}}$
centred at the same times changes little, shown in figure 9(a) at
 $t/T_{0}=1.75$
, figure 8(d) at
$t/T_{0}=1.75$
, figure 8(d) at
 $t/T_{0}=1.86$
and figure 9(b) at
$t/T_{0}=1.86$
and figure 9(b) at
 $t/T_{0}=2.03$
. In fact, one observes only a very slow evolution of this particle energization pattern over a number of periods, as seen in figure 8(d) at
$t/T_{0}=2.03$
. In fact, one observes only a very slow evolution of this particle energization pattern over a number of periods, as seen in figure 8(d) at
 $t/T_{0}=1.86$
, in figure 9(c) at
$t/T_{0}=1.86$
, in figure 9(c) at
 $t/T_{0}=2.85$
and in figure 9(d) at
$t/T_{0}=2.85$
and in figure 9(d) at
 $t/T_{0}=3.84$
. The very small variations are in large part due to the long-term evolution which involves the inevitable accumulated loss of fluctuating energy
$t/T_{0}=3.84$
. The very small variations are in large part due to the long-term evolution which involves the inevitable accumulated loss of fluctuating energy
 $\unicode[STIX]{x1D6FF}W$
over the course of the simulation.
$\unicode[STIX]{x1D6FF}W$
over the course of the simulation.
A final point is that the plasma energization – the sum of the energy transfer to both ions and electrons – has a net positive value when integrated over the entire simulation domain, as demonstrated by the sum
 ${\dot{E}}_{i}^{(fp)}+{\dot{E}}_{e}^{(fp)}$
plotted in figure 5(c). Therefore, although there is a loss of plasma energy in some regions of the domain, the net effect is that plasma species gain energy at the expense of the turbulent electromagnetic field and bulk plasma flow fluctuations, as depicted in the energy flow diagram in figure 4.
${\dot{E}}_{i}^{(fp)}+{\dot{E}}_{e}^{(fp)}$
plotted in figure 5(c). Therefore, although there is a loss of plasma energy in some regions of the domain, the net effect is that plasma species gain energy at the expense of the turbulent electromagnetic field and bulk plasma flow fluctuations, as depicted in the energy flow diagram in figure 4.
Comparison of time averaged
 $\langle j_{\Vert }E_{\Vert }\rangle _{\unicode[STIX]{x1D70F}}$
over an interval
$\langle j_{\Vert }E_{\Vert }\rangle _{\unicode[STIX]{x1D70F}}$
over an interval
 $\unicode[STIX]{x1D70F}=0.992T_{0}$
centred at time
$\unicode[STIX]{x1D70F}=0.992T_{0}$
centred at time
 $t/T_{0}=1.86$
for both (a) a nonlinear run and (b) a linear run, starting from identical initial conditions, showing a much more spatially localized distribution of plasma energization in the nonlinear case.
$t/T_{0}=1.86$
for both (a) a nonlinear run and (b) a linear run, starting from identical initial conditions, showing a much more spatially localized distribution of plasma energization in the nonlinear case.

Further insight into the effect of the nonlinear evolution on the resulting plasma energization can be gained by comparing a linear simulation starting from identical initial conditions. The AstroGK code has the capability of simply turning off the nonlinear term in the gyrokinetic equation (Howes et al.
Reference Howes, Cowley, Dorland, Hammett, Quataert and Schekochihin2006; Numata et al.
Reference Numata, Howes, Tatsuno, Barnes and Dorland2010), enabling strictly linear evolution from identical conditions with the same simulation code. In the linear case, no energy is transferred to other Fourier modes, and all of the particle energization is due to linear collisionless damping via the Landau resonance. In figure 10, we plot the time averaged
 $\langle j_{\Vert }E_{\Vert }\rangle _{\unicode[STIX]{x1D70F}}$
over an interval
$\langle j_{\Vert }E_{\Vert }\rangle _{\unicode[STIX]{x1D70F}}$
over an interval
 $\unicode[STIX]{x1D70F}=0.992T_{0}$
centred at time
$\unicode[STIX]{x1D70F}=0.992T_{0}$
centred at time
 $t/T_{0}=1.86$
for both (a) the nonlinear run and (b) the linear run. This figure directly demonstrates the striking fact that the spatial non-uniformity of particle energization arises due to the nonlinear transfer of energy to other Fourier modes. This is fully consistent with the picture of current sheet generation by constructive interference among the initial Alfvén wave modes and the nonlinearly generated fluctuations (Howes Reference Howes2016). In § 5, the field–particle correlation technique will be used to identify the nature of the collisionless energy transfer that yields this spatially non-uniform particle energization.
$t/T_{0}=1.86$
for both (a) the nonlinear run and (b) the linear run. This figure directly demonstrates the striking fact that the spatial non-uniformity of particle energization arises due to the nonlinear transfer of energy to other Fourier modes. This is fully consistent with the picture of current sheet generation by constructive interference among the initial Alfvén wave modes and the nonlinearly generated fluctuations (Howes Reference Howes2016). In § 5, the field–particle correlation technique will be used to identify the nature of the collisionless energy transfer that yields this spatially non-uniform particle energization.
The rate of plasma energization is the sum of the rates of ion and electron energization,
 $j_{\Vert }E_{\Vert }=j_{\Vert i}E_{\Vert }+j_{\Vert e}E_{\Vert }$
, and, in appendix B, we plot in figures 18 and 19 the separate ion and electron energization contributing to figure 8. In this simulation, the single-period-averaged particle energization in the plane
$j_{\Vert }E_{\Vert }=j_{\Vert i}E_{\Vert }+j_{\Vert e}E_{\Vert }$
, and, in appendix B, we plot in figures 18 and 19 the separate ion and electron energization contributing to figure 8. In this simulation, the single-period-averaged particle energization in the plane
 $z/L_{\Vert }=-0.25$
shown in figure 8 yields approximately twice the energy transfer to electrons relative to the ions at
$z/L_{\Vert }=-0.25$
shown in figure 8 yields approximately twice the energy transfer to electrons relative to the ions at
 $t/T_{0}=1.86$
.
$t/T_{0}=1.86$
.
5 Analysis of energy transfer mechanism using field–particle correlations
The rates of total energy transfer as a function of time between the turbulent fluctuations and the ions and electrons, plotted in figure 5, give the desired information about the net collisionless particle energization over the entire simulation domain. However, this simple approach cannot be applied to the analysis of spacecraft measurements to understand heating in heliospheric plasmas, because spacecraft measure the particle velocity distributions and electromagnetic fields at only one or a few points in space, so it is not possible to integrate the plasma heating over the entire plasma volume. In addition, such an energy flow analysis alone, such as that given in the diagram in figure 4, tells us nothing of the mechanism leading to the particle energization.
The electromagnetic work,
 $\boldsymbol{j}\boldsymbol{\cdot }\boldsymbol{E}$
, can be computed with single-point measurements, providing more insight into the nature of the particle energization mechanism and the spatial distribution of energy transfer than an energy analysis alone, but the newly developed field–particle correlation technique (Klein & Howes Reference Klein and Howes2016; Howes et al.
Reference Howes, Klein and Li2017), which yields the distribution of the energy transfer as a function of particle velocity, gives far greater detail about the nature of the energy transfer mechanism. This technique requires only a single-point time series of both field and velocity distribution function measurements, which can be obtained using modern spacecraft instrumentation.
$\boldsymbol{j}\boldsymbol{\cdot }\boldsymbol{E}$
, can be computed with single-point measurements, providing more insight into the nature of the particle energization mechanism and the spatial distribution of energy transfer than an energy analysis alone, but the newly developed field–particle correlation technique (Klein & Howes Reference Klein and Howes2016; Howes et al.
Reference Howes, Klein and Li2017), which yields the distribution of the energy transfer as a function of particle velocity, gives far greater detail about the nature of the energy transfer mechanism. This technique requires only a single-point time series of both field and velocity distribution function measurements, which can be obtained using modern spacecraft instrumentation.
The field–particle correlation technique has been successfully applied to examine the electron energization due to the damping of electrostatic fluctuations in a one dimension in space-one dimension in velocity space (1D-1V) Vlasov–Poisson plasma (Klein & Howes Reference Klein and Howes2016; Howes et al. Reference Howes, Klein and Li2017), to determine the transfer of free energy in kinetic instabilities from unstable particle velocity distributions to electrostatic fluctuations (Klein Reference Klein2017), and to explore the particle energization caused by the collisionless damping of strong, broadband, gyrokinetic plasma turbulence (Klein, Howes & TenBarge Reference Klein, Howes and TenBarge2017). Here we apply the technique to discover the nature of the physical mechanism responsible for the spatially non-uniform transfer of energy from the turbulent fluctuations to the non-thermal energy of the ions and electrons in the plasma.
Specifically, since we know from figure 17 in appendix B that the net energy transfer is dominated by the parallel electric field, we will evaluate the correlation of the ion and electron fluctuations with the parallel electric field. The correlation of the parallel electric field,
 $E_{\Vert }$
, with a species
$E_{\Vert }$
, with a species
 $s$
is defined by
$s$
is defined by
 $$\begin{eqnarray}C_{E_{\Vert },s}(\boldsymbol{v},t,\unicode[STIX]{x1D70F})=C\left(-q_{s}\frac{v_{\Vert }^{2}}{2}\frac{\unicode[STIX]{x2202}f_{s}(\boldsymbol{r}_{0},\boldsymbol{v},t)}{\unicode[STIX]{x2202}v_{\Vert }},E_{\Vert }(\boldsymbol{r}_{0},t)\right).\end{eqnarray}$$
This unnormalized correlation is taken over an appropriately chosen correlation interval
 $\unicode[STIX]{x1D70F}$
to suppress the signal of the oscillatory energy transfer relative to the secular energy transfer (Howes et al.
Reference Howes, Klein and Li2017). Defining the phase-space energy density by
$\unicode[STIX]{x1D70F}$
to suppress the signal of the oscillatory energy transfer relative to the secular energy transfer (Howes et al.
Reference Howes, Klein and Li2017). Defining the phase-space energy density by
 $w_{s}(\boldsymbol{r},\boldsymbol{v},t)=m_{s}v^{2}f_{s}(\boldsymbol{r},\boldsymbol{v},t)/2$
, this unnormalized correlation yields the phase-space energy transfer rate between the parallel electric field
$w_{s}(\boldsymbol{r},\boldsymbol{v},t)=m_{s}v^{2}f_{s}(\boldsymbol{r},\boldsymbol{v},t)/2$
, this unnormalized correlation yields the phase-space energy transfer rate between the parallel electric field
 $E_{\Vert }$
and species
$E_{\Vert }$
and species
 $s$
given by the Lorentz term in the Vlasov equation (Howes Reference Howes2017; Klein et al.
Reference Klein, Howes and TenBarge2017). A key aspect of this novel analysis method is that it retains the dependence of the energy transfer on velocity space. Note that integrating this correlation over velocity space simply yields the parallel contribution to the electromagnetic work,
$s$
given by the Lorentz term in the Vlasov equation (Howes Reference Howes2017; Klein et al.
Reference Klein, Howes and TenBarge2017). A key aspect of this novel analysis method is that it retains the dependence of the energy transfer on velocity space. Note that integrating this correlation over velocity space simply yields the parallel contribution to the electromagnetic work,
 $j_{\Vert }E_{\Vert }=\int \text{d}\boldsymbol{v}C_{E_{\Vert }}(\boldsymbol{v},t,\unicode[STIX]{x1D70F})$
(Howes et al.
Reference Howes, Klein and Li2017; Klein et al.
Reference Klein, Howes and TenBarge2017).
$j_{\Vert }E_{\Vert }=\int \text{d}\boldsymbol{v}C_{E_{\Vert }}(\boldsymbol{v},t,\unicode[STIX]{x1D70F})$
(Howes et al.
Reference Howes, Klein and Li2017; Klein et al.
Reference Klein, Howes and TenBarge2017).
For the application of this technique to data from our gyrokinetic simulation using AstroGK, we note that the gyrokinetic distribution function
 $h_{s}(x,y,z,v_{\bot },v_{\Vert })$
is related to the total distribution function
$h_{s}(x,y,z,v_{\bot },v_{\Vert })$
is related to the total distribution function
 $f_{s}$
via (Howes et al.
Reference Howes, Cowley, Dorland, Hammett, Quataert and Schekochihin2006)
$f_{s}$
via (Howes et al.
Reference Howes, Cowley, Dorland, Hammett, Quataert and Schekochihin2006)
 $$\begin{eqnarray}f_{s}(\boldsymbol{r},\boldsymbol{v},t)=F_{0s}(v)\left(1-\frac{q_{s}\unicode[STIX]{x1D719}(\boldsymbol{r},t)}{T_{0s}}\right)+h_{s}(\boldsymbol{r},v_{\Vert },v_{\bot },t),\end{eqnarray}$$
where the
 $F_{0s}(v)$
is the Maxwellian equilibrium distribution function. As a technical step, we transform from the gyrokinetic distribution function
$F_{0s}(v)$
is the Maxwellian equilibrium distribution function. As a technical step, we transform from the gyrokinetic distribution function
 $h_{s}$
to the complementary perturbed distribution function
$h_{s}$
to the complementary perturbed distribution function
 $$\begin{eqnarray}g_{s}(\boldsymbol{r},v_{\Vert },v_{\bot })=h_{s}(\boldsymbol{r},v_{\Vert },v_{\bot })-\frac{q_{s}F_{0s}}{T_{0s}}\left\langle \unicode[STIX]{x1D719}-\frac{\boldsymbol{v}_{\bot }\boldsymbol{\cdot }\boldsymbol{A}_{\bot }}{c}\right\rangle _{\boldsymbol{R}_{s}},\end{eqnarray}$$
where
 $\langle \,\cdots \,\rangle$
is the gyroaveraging operator (Schekochihin et al.
Reference Schekochihin, Cowley, Dorland, Hammett, Howes, Quataert and Tatsuno2009). The complementary distribution function
$\langle \,\cdots \,\rangle$
is the gyroaveraging operator (Schekochihin et al.
Reference Schekochihin, Cowley, Dorland, Hammett, Howes, Quataert and Tatsuno2009). The complementary distribution function
 $g_{s}$
describes perturbations to the background distribution in the frame of reference moving with the transverse oscillations of an Alfvén wave. Field–particle correlations calculated using
$g_{s}$
describes perturbations to the background distribution in the frame of reference moving with the transverse oscillations of an Alfvén wave. Field–particle correlations calculated using
 $h_{s}$
or
$h_{s}$
or
 $f_{s}$
yield qualitatively and quantitatively similar results to those computed with
$f_{s}$
yield qualitatively and quantitatively similar results to those computed with
 $g_{s}$
(Klein et al.
Reference Klein, Howes and TenBarge2017).
$g_{s}$
(Klein et al.
Reference Klein, Howes and TenBarge2017).
Below, we present the correlations between the complementary perturbed distribution function and the parallel electric field
 $E_{\Vert }$
at a single point
$E_{\Vert }$
at a single point
 $\boldsymbol{r}_{0}$
 $$\begin{eqnarray}C_{E_{\Vert },s}(v_{\Vert },v_{\bot },t,\unicode[STIX]{x1D70F})=C\left(-q_{s}\frac{v_{\Vert }^{2}}{2}\frac{\unicode[STIX]{x2202}g_{s}(\boldsymbol{r}_{0},v_{\Vert },v_{\bot },t)}{\unicode[STIX]{x2202}v_{\Vert }},E_{\Vert }(\boldsymbol{r}_{0},t)\right).\end{eqnarray}$$
To explore the particle energization over time, we can also integrate over the perpendicular velocity
 $v_{\bot }$
to obtain a reduced parallel correlation
$v_{\bot }$
to obtain a reduced parallel correlation
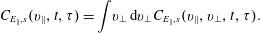 $$\begin{eqnarray}C_{E_{\Vert },s}(v_{\Vert },t,\unicode[STIX]{x1D70F})=\int v_{\bot }\,\text{d}v_{\bot }C_{E_{\Vert },s}(v_{\Vert },v_{\bot },t,\unicode[STIX]{x1D70F}).\end{eqnarray}$$
This reduced parallel correlation
 $C_{E_{\Vert },s}(v_{\Vert },t,\unicode[STIX]{x1D70F})$
can be plotted as a function of
$C_{E_{\Vert },s}(v_{\Vert },t,\unicode[STIX]{x1D70F})$
can be plotted as a function of
 $(v_{\Vert },t)$
to illustrate the time evolution particle energization using a timestack plot of the energy transfer as a function of the parallel velocity of the particles.
$(v_{\Vert },t)$
to illustrate the time evolution particle energization using a timestack plot of the energy transfer as a function of the parallel velocity of the particles.
5.1 Timestack plots of field–particle correlations
Here we present the results of the field–particle technique applied at three points in the simulation domain, labelled A, B and C in figure 8. From figure 8(d), we see that, averaged over one period
 $\unicode[STIX]{x1D70F}/T_{0}=0.992$
centred at
$\unicode[STIX]{x1D70F}/T_{0}=0.992$
centred at
 $t/T_{0}=1.86$
, there is a net gain of energy by the plasma at point A, a net loss of energy by the plasma at point B and little net change in the plasma energy at point C. Note that the reduced parallel correlation
$t/T_{0}=1.86$
, there is a net gain of energy by the plasma at point A, a net loss of energy by the plasma at point B and little net change in the plasma energy at point C. Note that the reduced parallel correlation
 $C_{E_{\Vert },s}(v_{\Vert },t,\unicode[STIX]{x1D70F})$
in the plots presented in this section is normalized by the energy transfer rate per unit volume per unit velocity,
$C_{E_{\Vert },s}(v_{\Vert },t,\unicode[STIX]{x1D70F})$
in the plots presented in this section is normalized by the energy transfer rate per unit volume per unit velocity,
 $Q_{0}/v_{ti}$
.
$Q_{0}/v_{ti}$
.
Timestack plots of ion and electron energization at position A for a correlation interval
 $\unicode[STIX]{x1D70F}/T_{0}=0.992$
. (a) Velocity-space integrated correlation, giving the rate of ion energization
$\unicode[STIX]{x1D70F}/T_{0}=0.992$
. (a) Velocity-space integrated correlation, giving the rate of ion energization
 $\unicode[STIX]{x2202}w_{i}/\unicode[STIX]{x2202}t$
due to ion interactions with
$\unicode[STIX]{x2202}w_{i}/\unicode[STIX]{x2202}t$
due to ion interactions with
 $E_{\Vert }$
. (b) The reduced parallel field–particle correlation for the ions
$E_{\Vert }$
. (b) The reduced parallel field–particle correlation for the ions
 $C_{E_{\Vert },i}(v_{\Vert },t,\unicode[STIX]{x1D70F})$
. (c) Velocity-space integrated correlation, giving the rate of electron energization
$C_{E_{\Vert },i}(v_{\Vert },t,\unicode[STIX]{x1D70F})$
. (c) Velocity-space integrated correlation, giving the rate of electron energization
 $\unicode[STIX]{x2202}w_{e}/\unicode[STIX]{x2202}t$
due to electron interactions with
$\unicode[STIX]{x2202}w_{e}/\unicode[STIX]{x2202}t$
due to electron interactions with
 $E_{\Vert }$
. (d) The reduced parallel field–particle correlation for the electrons
$E_{\Vert }$
. (d) The reduced parallel field–particle correlation for the electrons
 $C_{E_{\Vert },e}(v_{\Vert },t,\unicode[STIX]{x1D70F})$
. Vertical solid black indicate resonant velocities for a parallel phase velocity at the Alfvén speed
$C_{E_{\Vert },e}(v_{\Vert },t,\unicode[STIX]{x1D70F})$
. Vertical solid black indicate resonant velocities for a parallel phase velocity at the Alfvén speed
 $\unicode[STIX]{x1D714}/(k_{\Vert }v_{ts})=v_{A}/v_{ts}.$
Vertical dashed lines indicate the highest parallel phase velocities for modes with significant collisionless damping in the simulation.
$\unicode[STIX]{x1D714}/(k_{\Vert }v_{ts})=v_{A}/v_{ts}.$
Vertical dashed lines indicate the highest parallel phase velocities for modes with significant collisionless damping in the simulation.

In figure 11(b), we present a timestack plot of the reduced parallel field–particle correlation for the ions
 $C_{E_{\Vert },i}(v_{\Vert },t,\unicode[STIX]{x1D70F})$
at position A with a correlation interval
$C_{E_{\Vert },i}(v_{\Vert },t,\unicode[STIX]{x1D70F})$
at position A with a correlation interval
 $\unicode[STIX]{x1D70F}/T_{0}=0.992$
, showing the distribution of the energy transfer to the ions as a function of the parallel velocity
$\unicode[STIX]{x1D70F}/T_{0}=0.992$
, showing the distribution of the energy transfer to the ions as a function of the parallel velocity
 $v_{\Vert }/v_{ti}$
versus normalized time
$v_{\Vert }/v_{ti}$
versus normalized time
 $t/T_{0}$
. Vertical solid and dashed black lines indicate the limits of resonant parallel phase velocities from figure 1,
$t/T_{0}$
. Vertical solid and dashed black lines indicate the limits of resonant parallel phase velocities from figure 1,
 $1.0\lesssim |\unicode[STIX]{x1D714}/k_{\Vert }v_{ti}|\lesssim 1.5$
for ions; there are both positive and negative ranges of parallel phase velocities, corresponding to Alfvén waves travelling up or down the mean magnetic field. Also plotted in figure 11(a) is the velocity-space-integrated correlation,
$1.0\lesssim |\unicode[STIX]{x1D714}/k_{\Vert }v_{ti}|\lesssim 1.5$
for ions; there are both positive and negative ranges of parallel phase velocities, corresponding to Alfvén waves travelling up or down the mean magnetic field. Also plotted in figure 11(a) is the velocity-space-integrated correlation,
 $\unicode[STIX]{x2202}w_{i}/\unicode[STIX]{x2202}t=\int \text{d}v_{\Vert }C_{E_{\Vert }i}(v_{\Vert },t,\unicode[STIX]{x1D70F})$
, equivalent to the parallel ion contribution of the electromagnetic work
$\unicode[STIX]{x2202}w_{i}/\unicode[STIX]{x2202}t=\int \text{d}v_{\Vert }C_{E_{\Vert }i}(v_{\Vert },t,\unicode[STIX]{x1D70F})$
, equivalent to the parallel ion contribution of the electromagnetic work
 $j_{\Vert i}E_{\Vert }$
at position A, showing a net energization of the ions over the course of the simulation.
$j_{\Vert i}E_{\Vert }$
at position A, showing a net energization of the ions over the course of the simulation.
The distribution of the energy transfer as a function of
 $v_{\Vert }/v_{ti}$
in figure 11(b) is the velocity-space signature of the energy transfer mechanism. The localization of the energy transfer in the marked range of resonant parallel phase velocities for kinetic Alfvén waves clearly indicates that the energy transfer is resonant. The specific distribution of this energy transfer, with a transfer of energy from
$v_{\Vert }/v_{ti}$
in figure 11(b) is the velocity-space signature of the energy transfer mechanism. The localization of the energy transfer in the marked range of resonant parallel phase velocities for kinetic Alfvén waves clearly indicates that the energy transfer is resonant. The specific distribution of this energy transfer, with a transfer of energy from
 $E_{\Vert }$
to the ions (red) at
$E_{\Vert }$
to the ions (red) at
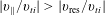 $|v_{\Vert }/v_{ti}|>|v_{\text{res}}/v_{ti}|$
and a loss of energy from the ions (blue) at
$|v_{\Vert }/v_{ti}|>|v_{\text{res}}/v_{ti}|$
and a loss of energy from the ions (blue) at
 $|v_{\Vert }/v_{ti}|<|v_{\text{res}}/v_{ti}|$
is the characteristic signature of the Landau damping of kinetic Alfvén waves (Howes Reference Howes2017; Klein et al.
Reference Klein, Howes and TenBarge2017). The change of sign in the energy transfer occurs at the resonant phase velocity for the collisionlessly damped wave. Here the change of sign occurs at
$|v_{\Vert }/v_{ti}|<|v_{\text{res}}/v_{ti}|$
is the characteristic signature of the Landau damping of kinetic Alfvén waves (Howes Reference Howes2017; Klein et al.
Reference Klein, Howes and TenBarge2017). The change of sign in the energy transfer occurs at the resonant phase velocity for the collisionlessly damped wave. Here the change of sign occurs at
 $v_{\Vert }/v_{ti}=\unicode[STIX]{x1D714}/k_{\Vert }v_{ti}\simeq v_{A}/v_{ti}=\pm 1$
, indicating that larger-scale Alfvén waves with
$v_{\Vert }/v_{ti}=\unicode[STIX]{x1D714}/k_{\Vert }v_{ti}\simeq v_{A}/v_{ti}=\pm 1$
, indicating that larger-scale Alfvén waves with
 $k_{\bot }\unicode[STIX]{x1D70C}_{i}\ll 1$
, which have a parallel phase velocity
$k_{\bot }\unicode[STIX]{x1D70C}_{i}\ll 1$
, which have a parallel phase velocity
 $\unicode[STIX]{x1D714}/k_{\Vert }=v_{A}$
, appear to dominate the energy transfer at point A. This is consistent with the fact the energy in the electromagnetic and plasma bulk flow fluctuations in this simulation is dominated by the low
$\unicode[STIX]{x1D714}/k_{\Vert }=v_{A}$
, appear to dominate the energy transfer at point A. This is consistent with the fact the energy in the electromagnetic and plasma bulk flow fluctuations in this simulation is dominated by the low
 $k_{\bot }\unicode[STIX]{x1D70C}_{i}\ll 1$
modes. This novel field–particle correlation analysis shows definitively the key result that ion Landau damping contributes to the energization of ions at position A in this strong Alfvén wave collision simulation.
$k_{\bot }\unicode[STIX]{x1D70C}_{i}\ll 1$
modes. This novel field–particle correlation analysis shows definitively the key result that ion Landau damping contributes to the energization of ions at position A in this strong Alfvén wave collision simulation.
In figure 11(d), we plot the reduced parallel field–particle correlation for the electrons
 $C_{E_{\Vert },e}(v_{\Vert },t,\unicode[STIX]{x1D70F})$
at position A with the same correlation interval
$C_{E_{\Vert },e}(v_{\Vert },t,\unicode[STIX]{x1D70F})$
at position A with the same correlation interval
 $\unicode[STIX]{x1D70F}/T_{0}=0.992$
, where vertical solid and dashed black lines indicate the range of resonant parallel velocities from figure 1,
$\unicode[STIX]{x1D70F}/T_{0}=0.992$
, where vertical solid and dashed black lines indicate the range of resonant parallel velocities from figure 1,
 $0.17\lesssim \unicode[STIX]{x1D714}/k_{\Vert }v_{te}\lesssim 0.6$
for electrons. Also plotted in figure 11(c) is the velocity-space-integrated correlation,
$0.17\lesssim \unicode[STIX]{x1D714}/k_{\Vert }v_{te}\lesssim 0.6$
for electrons. Also plotted in figure 11(c) is the velocity-space-integrated correlation,
 $\unicode[STIX]{x2202}w_{e}/\unicode[STIX]{x2202}t=\int \text{d}v_{\Vert }C_{E_{\Vert }e}(v_{\Vert },t,\unicode[STIX]{x1D70F})$
, equivalent to the parallel electron contribution of the electromagnetic work
$\unicode[STIX]{x2202}w_{e}/\unicode[STIX]{x2202}t=\int \text{d}v_{\Vert }C_{E_{\Vert }e}(v_{\Vert },t,\unicode[STIX]{x1D70F})$
, equivalent to the parallel electron contribution of the electromagnetic work
 $j_{\Vert e}E_{\Vert }$
, showing a net energization of the electrons at position A.
$j_{\Vert e}E_{\Vert }$
, showing a net energization of the electrons at position A.
The velocity-space signature of the electron energization in figure 11(d) also shows the typical characteristics of electron Landau damping, with a slight difference from the ion case. Because kinetic Alfvén waves are dispersive, with a parallel phase velocity that increases for
 $k_{\bot }\unicode[STIX]{x1D70C}_{i}\gtrsim 1$
given approximately by
$k_{\bot }\unicode[STIX]{x1D70C}_{i}\gtrsim 1$
given approximately by
 $\unicode[STIX]{x1D714}=k_{\Vert }v_{A}\sqrt{1+(k_{\bot }\unicode[STIX]{x1D70C}_{i})^{2}/[\unicode[STIX]{x1D6FD}_{i}+2/(1+T_{e}/T_{i})]}$
(Howes, Klein & TenBarge Reference Howes, Klein and TenBarge2014), the parallel resonant velocity will increase for kinetic Alfvén waves with larger
$\unicode[STIX]{x1D714}=k_{\Vert }v_{A}\sqrt{1+(k_{\bot }\unicode[STIX]{x1D70C}_{i})^{2}/[\unicode[STIX]{x1D6FD}_{i}+2/(1+T_{e}/T_{i})]}$
(Howes, Klein & TenBarge Reference Howes, Klein and TenBarge2014), the parallel resonant velocity will increase for kinetic Alfvén waves with larger
 $k_{\bot }\unicode[STIX]{x1D70C}_{i}$
. The velocity-space signature of linear Landau damping typically shows the change of sign of the energy transfer at the resonant velocity. In figure 11(d), that change of sign for
$k_{\bot }\unicode[STIX]{x1D70C}_{i}$
. The velocity-space signature of linear Landau damping typically shows the change of sign of the energy transfer at the resonant velocity. In figure 11(d), that change of sign for
 $1\leqslant t/T_{0}\leqslant 3$
occurs at a resonant velocity slightly larger than
$1\leqslant t/T_{0}\leqslant 3$
occurs at a resonant velocity slightly larger than
 $v_{A}/v_{te}$
(vertical black line), suggesting that the kinetic Alfvén wave involved in the electron Landau damping has a value of
$v_{A}/v_{te}$
(vertical black line), suggesting that the kinetic Alfvén wave involved in the electron Landau damping has a value of
 $k_{\bot }\unicode[STIX]{x1D70C}_{i}\gtrsim 1$
leading to a higher resonant parallel velocity. Despite this minor detail, the energy transfer still shows that the electron energization is mediated by resonant electrons, with a velocity-space signature typical of electron Landau damping (Howes Reference Howes2017). Therefore, this analysis definitively yields a second key result, that electron Landau damping contributes to the energization of electrons at position A in this strong Alfvén wave collision simulation.
$k_{\bot }\unicode[STIX]{x1D70C}_{i}\gtrsim 1$
leading to a higher resonant parallel velocity. Despite this minor detail, the energy transfer still shows that the electron energization is mediated by resonant electrons, with a velocity-space signature typical of electron Landau damping (Howes Reference Howes2017). Therefore, this analysis definitively yields a second key result, that electron Landau damping contributes to the energization of electrons at position A in this strong Alfvén wave collision simulation.
Plots of the same field–particle correlation analysis as figure 11, but taken at point B.

We can also investigate the regions in the simulation domain where the plasma loses energy to the parallel electric field at point B, plotted in figure 12. The (a) velocity-integrated ion energization
 $\unicode[STIX]{x2202}w_{i}/\unicode[STIX]{x2202}t$
due to
$\unicode[STIX]{x2202}w_{i}/\unicode[STIX]{x2202}t$
due to
 $E_{\Vert }$
and (c) velocity-integrated electron energization
$E_{\Vert }$
and (c) velocity-integrated electron energization
 $\unicode[STIX]{x2202}w_{e}/\unicode[STIX]{x2202}t$
due to
$\unicode[STIX]{x2202}w_{e}/\unicode[STIX]{x2202}t$
due to
 $E_{\Vert }$
both show that the net energy transfer to ions and electrons at point B is negative. Here, as in figure 11, we see that the energy transfer for both ions in (b) and electrons in (d) is dominated by particles with velocities that fall within the range of parallel velocities expected to be resonant with the parallel phase velocity of Alfvén waves, demonstrating directly that energy transfer between the particles and the parallel electric field
$E_{\Vert }$
both show that the net energy transfer to ions and electrons at point B is negative. Here, as in figure 11, we see that the energy transfer for both ions in (b) and electrons in (d) is dominated by particles with velocities that fall within the range of parallel velocities expected to be resonant with the parallel phase velocity of Alfvén waves, demonstrating directly that energy transfer between the particles and the parallel electric field
 $E_{\Vert }$
is governed by Landau resonant interactions.
$E_{\Vert }$
is governed by Landau resonant interactions.
Plots of the same field–particle correlation analysis as figure 11, but taken at point C.

At point C in the simulation domain, there is very little net energy transfer from the parallel electric field to the plasma particles. The same field–particle correlation analysis at point C, presented in figure 13, shows that the velocity-integrated (a) ion energization
 $\unicode[STIX]{x2202}w_{i}/\unicode[STIX]{x2202}t$
and (c) electron energization
$\unicode[STIX]{x2202}w_{i}/\unicode[STIX]{x2202}t$
and (c) electron energization
 $\unicode[STIX]{x2202}w_{e}/\unicode[STIX]{x2202}t$
due to
$\unicode[STIX]{x2202}w_{e}/\unicode[STIX]{x2202}t$
due to
 $E_{\Vert }$
yield a very small positive transfer of energy to the particles over the first couple of periods
$E_{\Vert }$
yield a very small positive transfer of energy to the particles over the first couple of periods
 $T_{0}$
, with an amplitude approximately an order of magnitude smaller than the energy transfer at points A and B. The reduced parallel field–particle correlation
$T_{0}$
, with an amplitude approximately an order of magnitude smaller than the energy transfer at points A and B. The reduced parallel field–particle correlation
 $C_{E_{\Vert },s}(v_{\Vert },t,\unicode[STIX]{x1D70F})$
for (b) the ions and (d) the electrons shows that the majority of this very small amount of energy transfer is still dominated by resonant particles.
$C_{E_{\Vert },s}(v_{\Vert },t,\unicode[STIX]{x1D70F})$
for (b) the ions and (d) the electrons shows that the majority of this very small amount of energy transfer is still dominated by resonant particles.
But there is a very significant difference between the reduced parallel field–particle correlation
 $C_{E_{\Vert },s}$
at point C for both ions and electrons compared to the same correlation at points A and B: the pattern of energy transfer at point C is dominantly odd in
$C_{E_{\Vert },s}$
at point C for both ions and electrons compared to the same correlation at points A and B: the pattern of energy transfer at point C is dominantly odd in
 $v_{\Vert }$
, whereas the patterns at points A and B are dominantly even in
$v_{\Vert }$
, whereas the patterns at points A and B are dominantly even in
 $v_{\Vert }$
. When integrated over the parallel velocity to obtain the net change of energy of a species, an odd pattern largely cancels out, whereas an even pattern does not. Therefore, there is little net particle energization at point C, even though individual particles do gain and lose energy through resonant interactions with
$v_{\Vert }$
. When integrated over the parallel velocity to obtain the net change of energy of a species, an odd pattern largely cancels out, whereas an even pattern does not. Therefore, there is little net particle energization at point C, even though individual particles do gain and lose energy through resonant interactions with
 $E_{\Vert }$
. Particles with
$E_{\Vert }$
. Particles with
 $v_{\Vert }>0$
gain nearly the same amount of energy as that lost by particles with
$v_{\Vert }>0$
gain nearly the same amount of energy as that lost by particles with
 $v_{\Vert }<0$
, yielding little net change of particle energy.
$v_{\Vert }<0$
, yielding little net change of particle energy.
The important point that the field–particle correlation analysis here demonstrates is that collisionless interactions of the Landau resonance between
 $E_{\Vert }$
and the ions and electrons contribute to the spatially non-uniform pattern of time-averaged particle energization, shown in figure 8(d). This result disproves by counterexample the commonly stated belief that Landau damping can only lead to spatially uniform particle energization. Rather, we see clearly here that collisionless damping via the Landau resonance can indeed be responsible for spatially localized particle energization, as previously suggested in the literature (TenBarge & Howes Reference TenBarge and Howes2013; Howes Reference Howes2015, Reference Howes2016). Furthermore, the nonlinear energy transfer by collisionless damping via the Landau resonance is not inhibited by the strong nonlinear interactions that play an important role in this strong Alfvén wave collision simulation. Indeed, nonlinear gyrokinetic simulations of strong, broadband plasma turbulence have indeed shown that the collisionless transfer of energy between fields and ions is dominated by particles approximately in Landau resonance with the parallel phase velocity of Alfvénic fluctuations (Klein et al.
Reference Klein, Howes and TenBarge2017).
$E_{\Vert }$
and the ions and electrons contribute to the spatially non-uniform pattern of time-averaged particle energization, shown in figure 8(d). This result disproves by counterexample the commonly stated belief that Landau damping can only lead to spatially uniform particle energization. Rather, we see clearly here that collisionless damping via the Landau resonance can indeed be responsible for spatially localized particle energization, as previously suggested in the literature (TenBarge & Howes Reference TenBarge and Howes2013; Howes Reference Howes2015, Reference Howes2016). Furthermore, the nonlinear energy transfer by collisionless damping via the Landau resonance is not inhibited by the strong nonlinear interactions that play an important role in this strong Alfvén wave collision simulation. Indeed, nonlinear gyrokinetic simulations of strong, broadband plasma turbulence have indeed shown that the collisionless transfer of energy between fields and ions is dominated by particles approximately in Landau resonance with the parallel phase velocity of Alfvénic fluctuations (Klein et al.
Reference Klein, Howes and TenBarge2017).
5.2 Particle energization in gyrotropic velocity space
Finally, we can examine the distribution of particle energization in gyrotropic velocity space
 $(v_{\Vert },v_{\bot })$
(Howes Reference Howes2017) using the field–particle correlation
$(v_{\Vert },v_{\bot })$
(Howes Reference Howes2017) using the field–particle correlation
 $C_{E_{\Vert },s}(v_{\Vert },v_{\bot },t,\unicode[STIX]{x1D70F})$
. Although plots of this analysis are limited to the correlation centred at just a single point in time, by not integrating over perpendicular velocity
$C_{E_{\Vert },s}(v_{\Vert },v_{\bot },t,\unicode[STIX]{x1D70F})$
. Although plots of this analysis are limited to the correlation centred at just a single point in time, by not integrating over perpendicular velocity
 $v_{\bot }$
one obtains complete information about which particles in gyrotropic velocity space
$v_{\bot }$
one obtains complete information about which particles in gyrotropic velocity space
 $(v_{\Vert },v_{\bot })$
participate in the collisionless transfer of energy. Note that the parallel correlation in gyrotropic velocity space,
$(v_{\Vert },v_{\bot })$
participate in the collisionless transfer of energy. Note that the parallel correlation in gyrotropic velocity space,
 $C_{E_{\Vert },s}(v_{\Vert },v_{\bot },t,\unicode[STIX]{x1D70F})$
in the plots presented in this section is normalized by the energy transfer rate per unit volume per unit velocity squared,
$C_{E_{\Vert },s}(v_{\Vert },v_{\bot },t,\unicode[STIX]{x1D70F})$
in the plots presented in this section is normalized by the energy transfer rate per unit volume per unit velocity squared,
 $Q_{0}/v_{ti}^{2}$
.
$Q_{0}/v_{ti}^{2}$
.
In figure 14, we plot
 $C_{E_{\Vert },s}(v_{\Vert },v_{\bot },t,\unicode[STIX]{x1D70F})$
for the same correlation interval
$C_{E_{\Vert },s}(v_{\Vert },v_{\bot },t,\unicode[STIX]{x1D70F})$
for the same correlation interval
 $\unicode[STIX]{x1D70F}/T_{0}=0.992$
centred at time
$\unicode[STIX]{x1D70F}/T_{0}=0.992$
centred at time
 $t/T_{0}=2.10$
: (a) ion and (b) electron energization at point A, (c) ion and (d) electron energization at point B and (e) ion and (f) electron energization at point C. As before, vertical solid and dashed black lines denote the range of resonant parallel velocities for Alfvén waves. Three important points can be inferred from these gyrotropic velocity-space plots. First, other than a steady decrease of the amplitude of the signal with increasing
$t/T_{0}=2.10$
: (a) ion and (b) electron energization at point A, (c) ion and (d) electron energization at point B and (e) ion and (f) electron energization at point C. As before, vertical solid and dashed black lines denote the range of resonant parallel velocities for Alfvén waves. Three important points can be inferred from these gyrotropic velocity-space plots. First, other than a steady decrease of the amplitude of the signal with increasing
 $v_{\bot }$
– as expected because the equilibrium Maxwellian distribution drops off exponentially as
$v_{\bot }$
– as expected because the equilibrium Maxwellian distribution drops off exponentially as
 $\exp (-v^{2}/v_{ts}^{2})$
, so the amplitude of fluctuations
$\exp (-v^{2}/v_{ts}^{2})$
, so the amplitude of fluctuations
 $\unicode[STIX]{x1D6FF}f(\boldsymbol{v})$
would be expected to have a similar drop off in amplitude – the energy transfer shows very little variation with
$\unicode[STIX]{x1D6FF}f(\boldsymbol{v})$
would be expected to have a similar drop off in amplitude – the energy transfer shows very little variation with
 $v_{\bot }$
. The variation in the energy transfer is organized almost entirely by
$v_{\bot }$
. The variation in the energy transfer is organized almost entirely by
 $v_{\Vert }$
, as expected for a Landau resonant energy transfer process. Second, this energy transfer is dominated by particles with parallel velocities resonant with Alfvénic fluctuations,
$v_{\Vert }$
, as expected for a Landau resonant energy transfer process. Second, this energy transfer is dominated by particles with parallel velocities resonant with Alfvénic fluctuations,
 $v_{\Vert }\simeq v_{A}$
, demonstrating that the energy transfer is governed by the Landau resonance. Third, the odd or even character in
$v_{\Vert }\simeq v_{A}$
, demonstrating that the energy transfer is governed by the Landau resonance. Third, the odd or even character in
 $v_{\Vert }$
at the different points A, B and C seen in the timestack plots is also clearly apparent here in these gyrotropic velocity-space plots.
$v_{\Vert }$
at the different points A, B and C seen in the timestack plots is also clearly apparent here in these gyrotropic velocity-space plots.
Plots of the field–particle correlation
 $C_{E_{\Vert }}(v_{\Vert },v_{\bot },t,\unicode[STIX]{x1D70F})$
on gyrotropic velocity space
$C_{E_{\Vert }}(v_{\Vert },v_{\bot },t,\unicode[STIX]{x1D70F})$
on gyrotropic velocity space
 $(v_{\Vert },v_{\bot })$
for a correlation interval
$(v_{\Vert },v_{\bot })$
for a correlation interval
 $\unicode[STIX]{x1D70F}/T_{0}=0.992$
centred at time
$\unicode[STIX]{x1D70F}/T_{0}=0.992$
centred at time
 $t/T_{0}=2.10$
: (a) ion and (b) electron energization at point A, (c) ion and (d) electron energization at point B and (e) ion and (f) electron energization at point C. Vertical solid lines denote the resonant parallel velocities for a parallel phase velocity at the Alfvén speed
$t/T_{0}=2.10$
: (a) ion and (b) electron energization at point A, (c) ion and (d) electron energization at point B and (e) ion and (f) electron energization at point C. Vertical solid lines denote the resonant parallel velocities for a parallel phase velocity at the Alfvén speed
 $\unicode[STIX]{x1D714}/(k_{\Vert }v_{ts})=v_{A}/v_{ts}$
.
$\unicode[STIX]{x1D714}/(k_{\Vert }v_{ts})=v_{A}/v_{ts}$
.

Summarizing, the gyrotropic velocity space
 $(v_{\Vert },v_{\bot })$
plots in figure 14 demonstrate how the field–particle correlation technique maximizes the use of the full particle velocity distribution function information, enabling the physical mechanism responsible for the removal of energy from turbulent fluctuations and consequent particle energization to be identified definitively. In this case, the velocity-space signature of the field–particle correlation is unmistakably that of Landau damping of a kinetic Alfvén wave (Howes Reference Howes2017), proving that Landau damping indeed plays a role in the spatially non-uniform removal of the energy of electromagnetic and bulk plasma flow fluctuations, even in the presence of strong nonlinearity.
$(v_{\Vert },v_{\bot })$
plots in figure 14 demonstrate how the field–particle correlation technique maximizes the use of the full particle velocity distribution function information, enabling the physical mechanism responsible for the removal of energy from turbulent fluctuations and consequent particle energization to be identified definitively. In this case, the velocity-space signature of the field–particle correlation is unmistakably that of Landau damping of a kinetic Alfvén wave (Howes Reference Howes2017), proving that Landau damping indeed plays a role in the spatially non-uniform removal of the energy of electromagnetic and bulk plasma flow fluctuations, even in the presence of strong nonlinearity.
6 Conclusion
Using a nonlinear gyrokinetic simulation of a strong Alfvén wave collisions, we examine here the damping of the electromagnetic fluctuations and the associated energization of particles that occurs in current sheets that are generated self-consistently during the nonlinear evolution.
The flow of energy due to the collisionless damping and the associated particle energization, as well as the subsequent thermalization of the particle energy by collisions, provides an important framework for interpreting the nonlinear dynamics and dissipation. Figure 4 presents a simple model of the energy flow from turbulent energy to plasma heat in the simulation, with the following two key stages: (i) the turbulent fluctuation energy is removed by collisionless field–particle interactions, transferring that energy reversibly into non-thermal energy of the plasma species; and (ii) the non-thermal energy, represented by fluctuations in the particle velocity distribution functions, is driven to sufficiently small velocity-space scales that weak collisions can thermalize that energy, irreversibly heating the plasma species. In the strong Alfvén wave collision simulated here, this two-step processes ultimately leads to more than 60 % of the original fluctuation energy being dissipated collisionally as thermal ion and electron energy.
It has long been appreciated that the nonlinear evolution of plasma turbulence leads to the development of intermittent current sheets (Matthaeus & Montgomery Reference Matthaeus and Montgomery1980; Meneguzzi et al.
Reference Meneguzzi, Frisch and Pouquet1981), and a recent study has shown that strong Alfvén wave collisions – nonlinear interactions between counterpropagating Alfvén waves – self-consistently develop spatially localized current sheets through the constructive interference of the original Alfvén waves and nonlinearly generated fluctuations (Howes Reference Howes2016). MHD turbulence simulations have shown that the dissipation of turbulent energy is largely concentrated in these intermittent current sheets (Uritsky et al.
Reference Uritsky, Pouquet, Rosenberg, Mininni and Donovan2010; Osman et al.
Reference Osman, Matthaeus, Greco and Servidio2011; Zhdankin et al.
Reference Zhdankin, Uzdensky, Perez and Boldyrev2013), so a natural question is whether the collisionless damping of current sheets generated by strong Alfvén wave collisions leads to such spatially localized particle energization. Plotting the spatial distribution of the electromagnetic work done by the parallel electric field
 $E_{\Vert }$
, shown in figure 8(a–c), shows that the instantaneous particle energization is indeed spatially non-uniform with a sheet-like morphology.
$E_{\Vert }$
, shown in figure 8(a–c), shows that the instantaneous particle energization is indeed spatially non-uniform with a sheet-like morphology.
A key point, however, is that much of this reversible electromagnetic work leads to an oscillatory transfer of energy to and from the particles associated with undamped wave motion. Only by averaging over a suitable time interval, in this case an averaging interval that is approximately a single wave period
 $\unicode[STIX]{x1D70F}\simeq T_{0}$
, can we determine the secular particle energization
$\unicode[STIX]{x1D70F}\simeq T_{0}$
, can we determine the secular particle energization
 $\langle j_{\Vert }E_{\Vert }\rangle _{\unicode[STIX]{x1D70F}}$
associated with the net removal of energy from the turbulent fluctuations. Figure 8(d) shows that the secular particle energization
$\langle j_{\Vert }E_{\Vert }\rangle _{\unicode[STIX]{x1D70F}}$
associated with the net removal of energy from the turbulent fluctuations. Figure 8(d) shows that the secular particle energization
 $\langle j_{\Vert }E_{\Vert }\rangle _{\unicode[STIX]{x1D70F}}$
in this strong Alfvén wave collision indeed remains spatially non-uniform, although less localized than the instantaneous rates of energy transfer in figure 8(a–c). The bottom line is that the current sheets arising in strong Alfvén wave collisions indeed generate spatially localized particle energization, consistent with that found in simulations of plasma turbulence (Wan et al.
Reference Wan, Matthaeus, Karimabadi, Roytershteyn, Shay, Wu, Daughton, Loring and Chapman2012; Karimabadi et al.
Reference Karimabadi, Roytershteyn, Wan, Matthaeus, Daughton, Wu, Shay, Loring, Borovsky and Leonardis2013; TenBarge & Howes Reference TenBarge and Howes2013; Wu et al.
Reference Wu, Perri, Osman, Wan, Matthaeus, Shay, Goldstein, Karimabadi and Chapman2013; Zhdankin et al.
Reference Zhdankin, Uzdensky, Perez and Boldyrev2013) and inferred from spacecraft observations of the solar wind (Osman et al.
Reference Osman, Matthaeus, Greco and Servidio2011, Reference Osman, Matthaeus, Wan and Rappazzo2012; Perri et al.
Reference Perri, Goldstein, Dorelli and Sahraoui2012; Wang et al.
Reference Wang, Tu, He, Marsch and Wang2013; Wu et al.
Reference Wu, Perri, Osman, Wan, Matthaeus, Shay, Goldstein, Karimabadi and Chapman2013; Osman et al.
Reference Osman, Matthaeus, Gosling, Greco, Servidio, Hnat, Chapman and Phan2014).
$\langle j_{\Vert }E_{\Vert }\rangle _{\unicode[STIX]{x1D70F}}$
in this strong Alfvén wave collision indeed remains spatially non-uniform, although less localized than the instantaneous rates of energy transfer in figure 8(a–c). The bottom line is that the current sheets arising in strong Alfvén wave collisions indeed generate spatially localized particle energization, consistent with that found in simulations of plasma turbulence (Wan et al.
Reference Wan, Matthaeus, Karimabadi, Roytershteyn, Shay, Wu, Daughton, Loring and Chapman2012; Karimabadi et al.
Reference Karimabadi, Roytershteyn, Wan, Matthaeus, Daughton, Wu, Shay, Loring, Borovsky and Leonardis2013; TenBarge & Howes Reference TenBarge and Howes2013; Wu et al.
Reference Wu, Perri, Osman, Wan, Matthaeus, Shay, Goldstein, Karimabadi and Chapman2013; Zhdankin et al.
Reference Zhdankin, Uzdensky, Perez and Boldyrev2013) and inferred from spacecraft observations of the solar wind (Osman et al.
Reference Osman, Matthaeus, Greco and Servidio2011, Reference Osman, Matthaeus, Wan and Rappazzo2012; Perri et al.
Reference Perri, Goldstein, Dorelli and Sahraoui2012; Wang et al.
Reference Wang, Tu, He, Marsch and Wang2013; Wu et al.
Reference Wu, Perri, Osman, Wan, Matthaeus, Shay, Goldstein, Karimabadi and Chapman2013; Osman et al.
Reference Osman, Matthaeus, Gosling, Greco, Servidio, Hnat, Chapman and Phan2014).
The next obvious question is what is the physical mechanism governing the removal of energy from the turbulence and the consequent spatially non-uniform energization of the particles? Using the recently developed field–particle correlation technique (Klein & Howes Reference Klein and Howes2016; Howes et al.
Reference Howes, Klein and Li2017), we examine how the energy transfer to ions and electrons by the parallel electric field
 $E_{\Vert }$
is distributed in velocity space. In other words, which particles in velocity space receive the energy transferred collisionlessly from the electromagnetic fields? The results, exemplified by figure 11, show that the particles that are resonant with the parallel velocity of the Alfvén waves in the simulation dominate the energy transfer, demonstrating conclusively that Landau damping plays a role in the damping of the electromagnetic fluctuations and consequent energization of the particles in this strongly nonlinear simulation.
$E_{\Vert }$
is distributed in velocity space. In other words, which particles in velocity space receive the energy transferred collisionlessly from the electromagnetic fields? The results, exemplified by figure 11, show that the particles that are resonant with the parallel velocity of the Alfvén waves in the simulation dominate the energy transfer, demonstrating conclusively that Landau damping plays a role in the damping of the electromagnetic fluctuations and consequent energization of the particles in this strongly nonlinear simulation.
Based on the plane-wave decomposition typically used to derive linear Landau damping analytically, one may naively expect that Landau damping leads to spatially uniform energization. Together, the results presented here definitively show instead that Landau damping can indeed lead to spatially localized particle energization. The comparison to a strictly linear simulation from identical initial conditions, presented in figure 10, shows that the nonlinear energy transfer to other Fourier modes is essential for the localization of the particle energization. This is consistent with the model for current sheet generation in Alfvén wave collisions in which nonlinearly generated modes constructively interfere with the initial Alfvén waves to create spatially localized current sheets; linear Landau damping of each of these modes, which occurs spatially locally, leads to the non-uniform spatial pattern of the energization, as previously suggested (Howes Reference Howes2015, Reference Howes2016).
Our result here, that Landau damping is effective even in a plasma where strong nonlinear interactions are playing an important role, also addresses the important question of whether Landau damping is effective in a strongly turbulent plasma (Plunk Reference Plunk2013; Schekochihin et al. Reference Schekochihin, Parker, Highcock, Dellar, Dorland and Hammett2016). Our results here complement a recent field–particle correlation analysis of gyrokinetic turbulence simulations showing that Landau damping indeed persists as an effective physical mechanism for ion energization in broadband, strong plasma turbulence (Klein et al. Reference Klein, Howes and TenBarge2017).
We emphasize here that we have not shown that Landau damping is the only damping mechanism, but we have provided conclusive evidence that Landau damping does play a role in the collisionless damping of turbulence in spatially localized current sheets that arise from strong Alfvén wave collisions. As mentioned in appendix B, transit-time damping (Barnes Reference Barnes1966; Quataert Reference Quataert1998) – which does work on particles via their magnetic moment through the magnetic mirror force arising from fluctuations in the magnetic field magnitude – is another effective physical mechanism for collisionless damping and energization of particles via the Landau resonance in gyrokinetics. Here we have focused only on the contribution to the particle energization by the parallel electric field
 $E_{\Vert }$
; future work will address the additional contribution by the magnetic mirror force arising from
$E_{\Vert }$
; future work will address the additional contribution by the magnetic mirror force arising from
 $\unicode[STIX]{x1D735}_{\Vert }|\boldsymbol{B}|$
.
$\unicode[STIX]{x1D735}_{\Vert }|\boldsymbol{B}|$
.
Another important question is whether collisionless magnetic reconnection (Birn et al.
Reference Birn, Drake, Shay, Rogers, Denton, Hesse, Kuznetsova, Ma, Bhattacharjee and Otto2001; Shay et al.
Reference Shay, Drake, Rogers and Denton2001; Ricci et al.
Reference Ricci, Brackbill, Daughton and Lapenta2004; Drake, Shay & Swisdak Reference Drake, Shay and Swisdak2008; Ji & Daughton Reference Ji and Daughton2011), possibly involving the emergence of the plasmoid instability (Shibata & Tanuma Reference Shibata and Tanuma2001; Loureiro, Schekochihin & Cowley Reference Loureiro, Schekochihin and Cowley2007; Bhattacharjee et al.
Reference Bhattacharjee, Huang, Yang and Rogers2009), plays any role in the removal of energy from these current sheets that arise self-consistently from strong Alfvén wave collisions (Howes Reference Howes2016; Verniero et al.
Reference Verniero, Howes and Klein2018; Verniero & Howes Reference Verniero and Howes2017). Further numerical investigations varying the simulation resolution and the ion plasma
 $\unicode[STIX]{x1D6FD}_{i}$
, in particular for
$\unicode[STIX]{x1D6FD}_{i}$
, in particular for
 $\unicode[STIX]{x1D6FD}_{i}\ll 1$
where the drive for magnetic reconnection is sufficiently stronger (TenBarge et al.
Reference TenBarge, Daughton, Karimabadi, Howes and Dorland2014), will be necessary to better understand the role that magnetic reconnection may play in the dissipation of plasma turbulence.
$\unicode[STIX]{x1D6FD}_{i}\ll 1$
where the drive for magnetic reconnection is sufficiently stronger (TenBarge et al.
Reference TenBarge, Daughton, Karimabadi, Howes and Dorland2014), will be necessary to better understand the role that magnetic reconnection may play in the dissipation of plasma turbulence.
The comparison of the time evolution of the field–particle energy transfer
 ${\dot{E}}_{s}^{(fp)}$
and the collisional heating
${\dot{E}}_{s}^{(fp)}$
and the collisional heating
 $Q_{s}$
for each species in figure 5 also raises important questions about the relative rates of linear and nonlinear phase-mixing processes that enable the non-thermal energy, represented by fluctuations in the particle velocity distribution function, to reach sufficiently small velocity-space scales to be thermalized by arbitrarily weak collisions. In particular, recent work suggests that for sufficiently low collisionality, turbulent anti-phase-mixing can inhibit the thermalization of energy removed by Landau damping (Parker et al.
Reference Parker, Highcock, Schekochihin and Dellar2016; Schekochihin et al.
Reference Schekochihin, Parker, Highcock, Dellar, Dorland and Hammett2016), meriting a further investigation of the sensitivity of the results presented here on the species collisionality. These questions, and more, about the flow of energy in weakly collisional heliospheric plasmas, lie at the forefront of kinetic heliophysics (Howes Reference Howes2017), and will drive research efforts by the next generation of space plasma physicists.
$Q_{s}$
for each species in figure 5 also raises important questions about the relative rates of linear and nonlinear phase-mixing processes that enable the non-thermal energy, represented by fluctuations in the particle velocity distribution function, to reach sufficiently small velocity-space scales to be thermalized by arbitrarily weak collisions. In particular, recent work suggests that for sufficiently low collisionality, turbulent anti-phase-mixing can inhibit the thermalization of energy removed by Landau damping (Parker et al.
Reference Parker, Highcock, Schekochihin and Dellar2016; Schekochihin et al.
Reference Schekochihin, Parker, Highcock, Dellar, Dorland and Hammett2016), meriting a further investigation of the sensitivity of the results presented here on the species collisionality. These questions, and more, about the flow of energy in weakly collisional heliospheric plasmas, lie at the forefront of kinetic heliophysics (Howes Reference Howes2017), and will drive research efforts by the next generation of space plasma physicists.
Acknowledgements
This work was supported by NSF CAREER Award AGS-1054061, NASA HSR grant NNX16AM23G, DOE grant DE-SC0014599 and the University of Iowa Mathematical and Physical Sciences Funding Program. This work used the Extreme Science and Engineering Discovery Environment (XSEDE), which is supported by National Science Foundation grant no. ACI-1053575, through NSF XSEDE Award PHY090084.
Appendix A. Collisionless damping rate as a function of mass ratio
Here we present in figure 15 a comparison of the linear physics of the Alfvén/kinetic Alfvén wave mode for the reduced mass ratio used here
 $m_{i}/m_{e}=36$
(thick lines) to that for a realistic proton-to-electron mass ratio
$m_{i}/m_{e}=36$
(thick lines) to that for a realistic proton-to-electron mass ratio
 $m_{i}/m_{e}=1836$
(thin lines). Specifically, for a plasma with
$m_{i}/m_{e}=1836$
(thin lines). Specifically, for a plasma with
 $\unicode[STIX]{x1D6FD}_{i}=1$
and
$\unicode[STIX]{x1D6FD}_{i}=1$
and
 $T_{i}/T_{e}=1$
, we solve the linear collisionless gyrokinetic dispersion relation (Howes et al.
Reference Howes, Cowley, Dorland, Hammett, Quataert and Schekochihin2006) for the (a) normalized wave frequency
$T_{i}/T_{e}=1$
, we solve the linear collisionless gyrokinetic dispersion relation (Howes et al.
Reference Howes, Cowley, Dorland, Hammett, Quataert and Schekochihin2006) for the (a) normalized wave frequency
 $\unicode[STIX]{x1D714}/k_{\Vert }v_{A}$
and (b) total collisionless damping rate
$\unicode[STIX]{x1D714}/k_{\Vert }v_{A}$
and (b) total collisionless damping rate
 $\unicode[STIX]{x1D6FE}_{\text{tot}}/\unicode[STIX]{x1D714}$
(black solid) as a function of the perpendicular wavenumber
$\unicode[STIX]{x1D6FE}_{\text{tot}}/\unicode[STIX]{x1D714}$
(black solid) as a function of the perpendicular wavenumber
 $k_{\bot }\unicode[STIX]{x1D70C}_{i}$
. In addition, in (b) we also show the separate contributions of the ions (red dotted) and electrons (blue dashed) to the collisionless damping rate.
$k_{\bot }\unicode[STIX]{x1D70C}_{i}$
. In addition, in (b) we also show the separate contributions of the ions (red dotted) and electrons (blue dashed) to the collisionless damping rate.
The comparison shows that the linear wave frequency
 $\unicode[STIX]{x1D714}/k_{\Vert }v_{A}$
begins to differ only slightly between the two cases at
$\unicode[STIX]{x1D714}/k_{\Vert }v_{A}$
begins to differ only slightly between the two cases at
 $k_{\bot }\unicode[STIX]{x1D70C}_{i}\gtrsim 5$
. Note that the fully resolved perpendicular range of the dealiased pseudospectral method for the strong Alfvén wave collision simulation covers
$k_{\bot }\unicode[STIX]{x1D70C}_{i}\gtrsim 5$
. Note that the fully resolved perpendicular range of the dealiased pseudospectral method for the strong Alfvén wave collision simulation covers
 $0.25\leqslant k_{\bot }\unicode[STIX]{x1D70C}_{i}\leqslant 5.25$
, denoted by the two vertical solid black lines; modes in the corner of
$0.25\leqslant k_{\bot }\unicode[STIX]{x1D70C}_{i}\leqslant 5.25$
, denoted by the two vertical solid black lines; modes in the corner of
 $(k_{x},k_{y})$
Fourier space represent perpendicular wavenumbers out to
$(k_{x},k_{y})$
Fourier space represent perpendicular wavenumbers out to
 $k_{\bot }\unicode[STIX]{x1D70C}_{i}=5.25\sqrt{2}\simeq 7.42$
, denoted by the vertical dashed black line. Therefore, there is very little difference in the linear wave frequency over the perpendicular range of the simulation between
$k_{\bot }\unicode[STIX]{x1D70C}_{i}=5.25\sqrt{2}\simeq 7.42$
, denoted by the vertical dashed black line. Therefore, there is very little difference in the linear wave frequency over the perpendicular range of the simulation between
 $m_{i}/m_{e}=36$
and
$m_{i}/m_{e}=36$
and
 $m_{i}/m_{e}=1836$
.
$m_{i}/m_{e}=1836$
.
Comparison of the results from the linear collisionless gyrokinetic dispersion relation for the reduced mass ratio
 $m_{i}/m_{e}=36$
(thick) and a realistic proton-to-electron mass ratio
$m_{i}/m_{e}=36$
(thick) and a realistic proton-to-electron mass ratio
 $m_{i}/m_{e}=1836$
(thin): (a) normalized frequency
$m_{i}/m_{e}=1836$
(thin): (a) normalized frequency
 $\unicode[STIX]{x1D714}/k_{\Vert }v_{A}$
and (b) total collisionless damping rate
$\unicode[STIX]{x1D714}/k_{\Vert }v_{A}$
and (b) total collisionless damping rate
 $\unicode[STIX]{x1D6FE}_{\text{tot}}/\unicode[STIX]{x1D714}$
(black solid), ion collisionless damping rate
$\unicode[STIX]{x1D6FE}_{\text{tot}}/\unicode[STIX]{x1D714}$
(black solid), ion collisionless damping rate
 $\unicode[STIX]{x1D6FE}_{i}/\unicode[STIX]{x1D714}$
(red dotted), and electron collisionless damping rate
$\unicode[STIX]{x1D6FE}_{i}/\unicode[STIX]{x1D714}$
(red dotted), and electron collisionless damping rate
 $\unicode[STIX]{x1D6FE}_{e}/\unicode[STIX]{x1D714}$
(blue dashed). Solid and dashed vertical lines are the same as in figure 1.
$\unicode[STIX]{x1D6FE}_{e}/\unicode[STIX]{x1D714}$
(blue dashed). Solid and dashed vertical lines are the same as in figure 1.
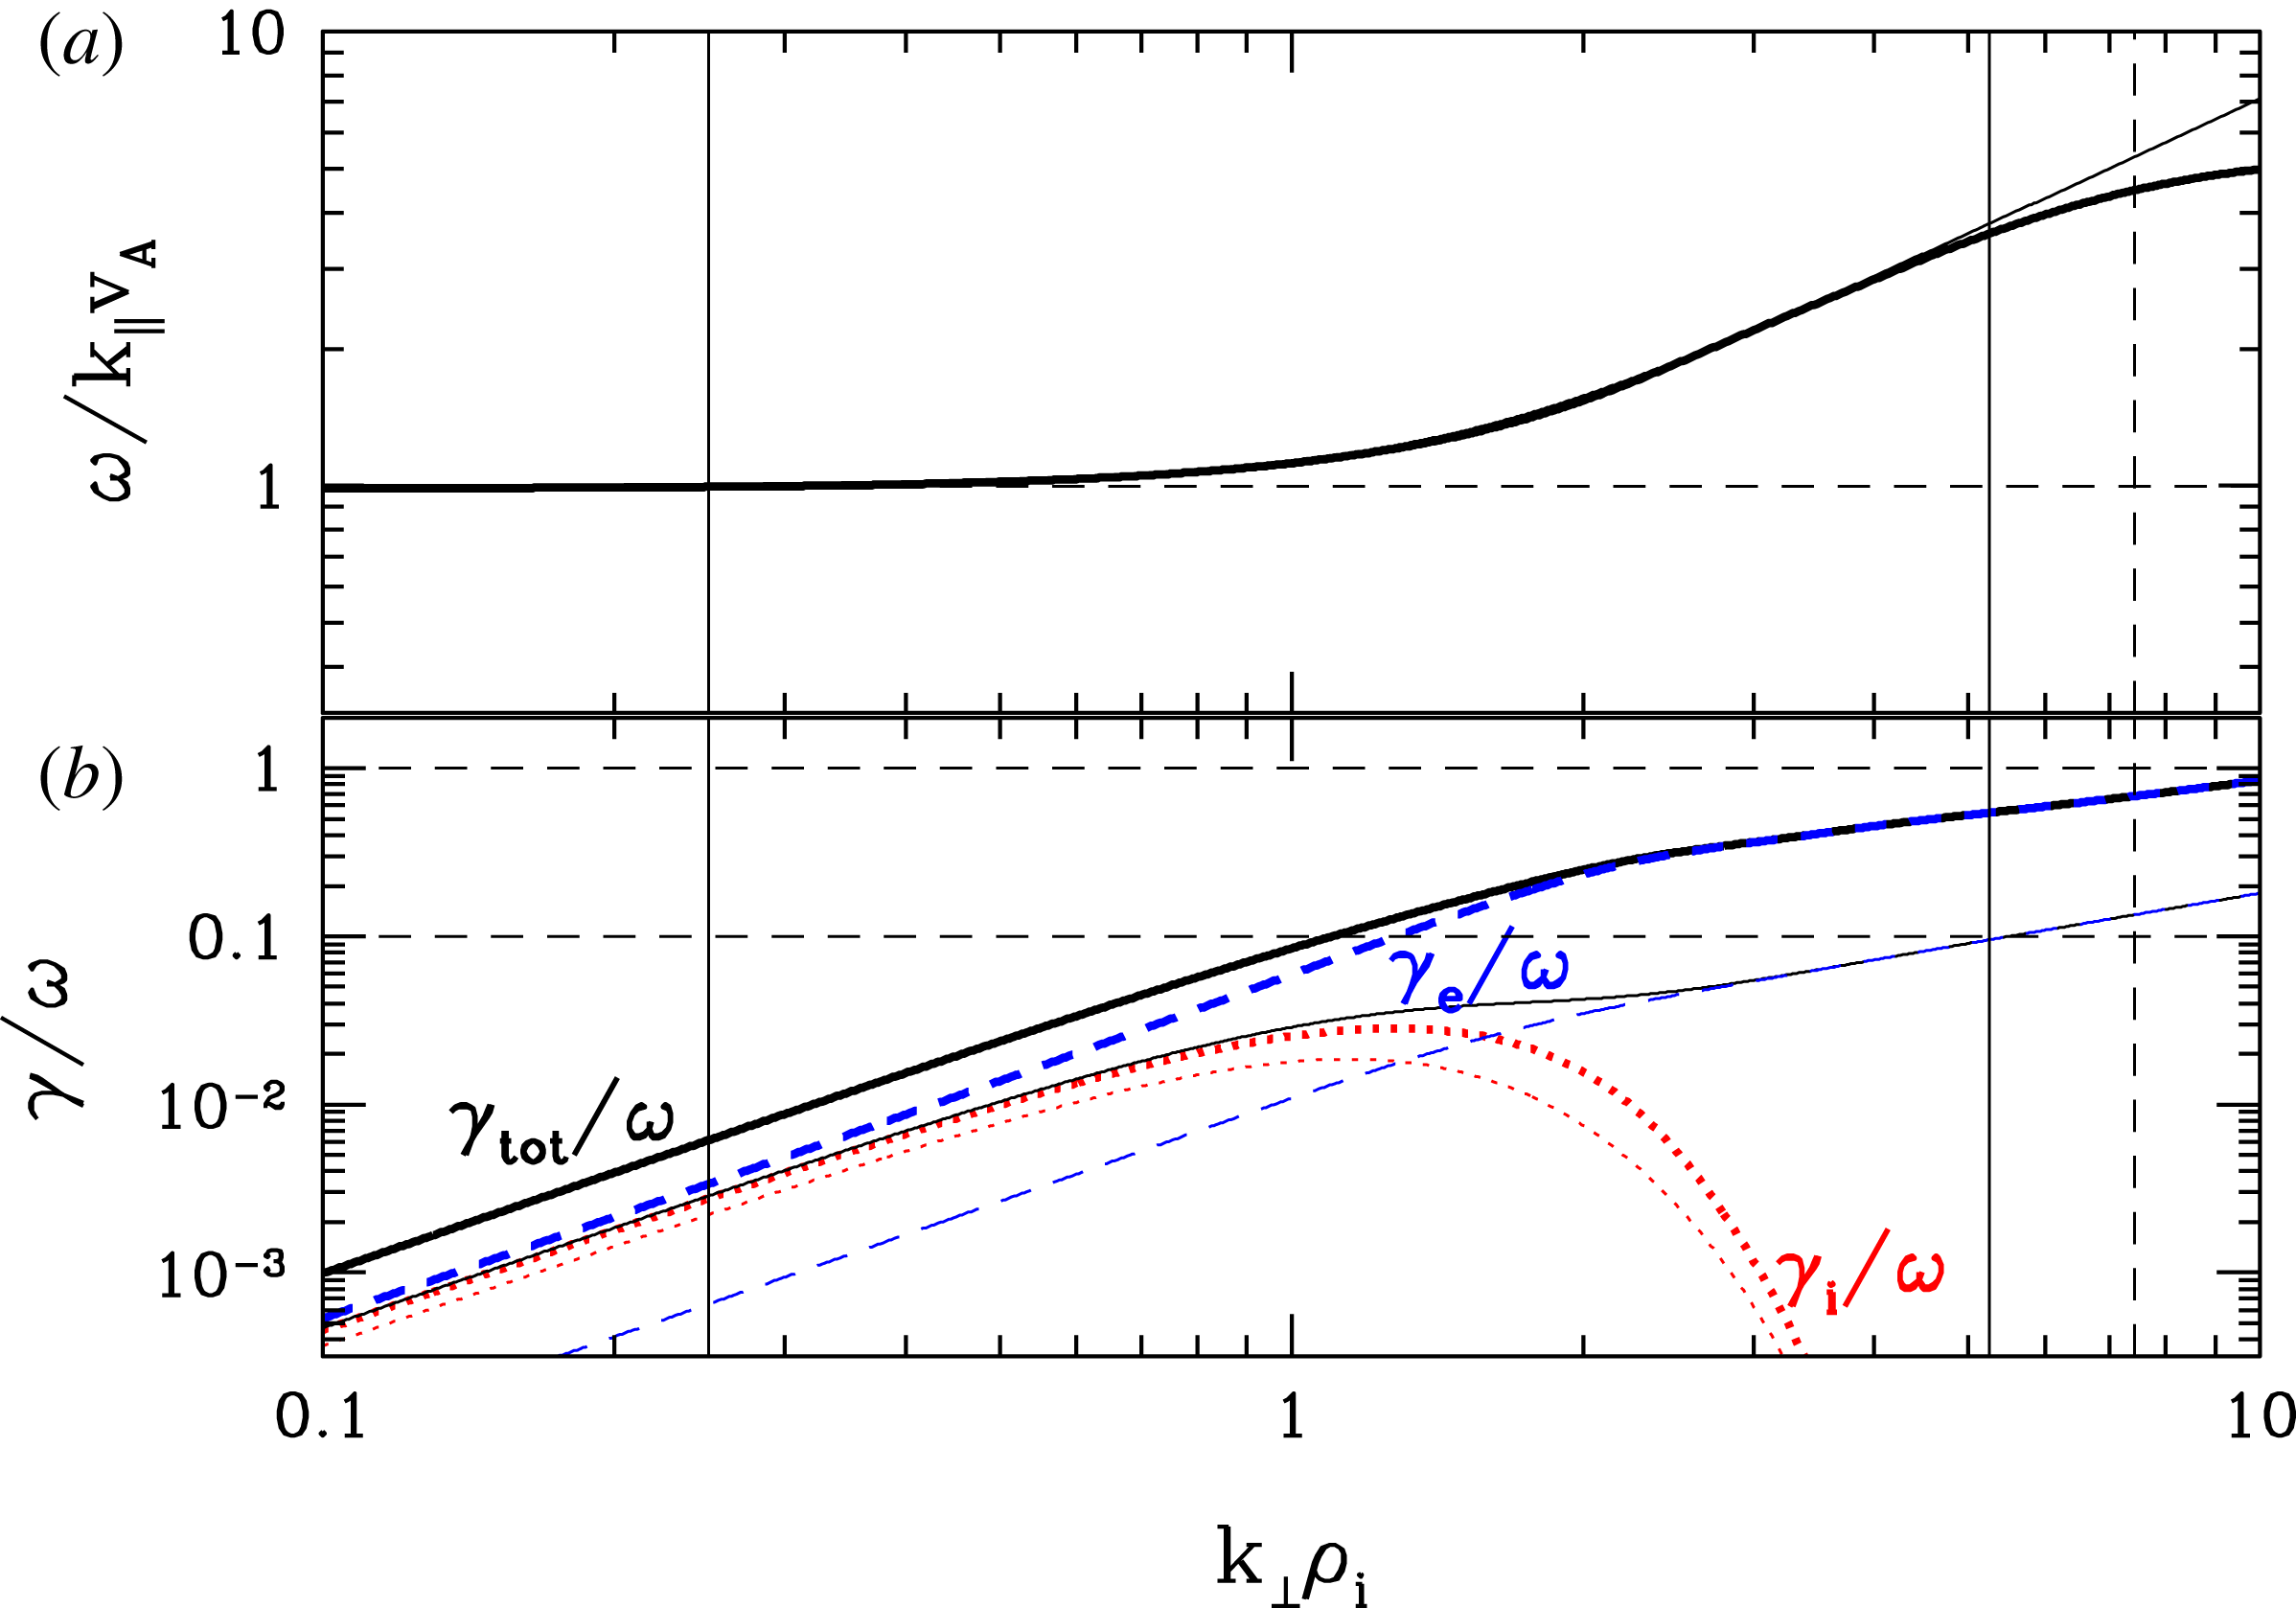
The noticeable difference between the two cases arises in the electron collisionless damping rate
 $\unicode[STIX]{x1D6FE}_{e}/\unicode[STIX]{x1D714}$
in figure 15(b). The ion damping is slightly smaller for the realistic mass ratio relative to the reduced mass ratio, but the electron damping drops by nearly an order of magnitude. Other than the amplitude changes, however, the individual species damping rates
$\unicode[STIX]{x1D6FE}_{e}/\unicode[STIX]{x1D714}$
in figure 15(b). The ion damping is slightly smaller for the realistic mass ratio relative to the reduced mass ratio, but the electron damping drops by nearly an order of magnitude. Other than the amplitude changes, however, the individual species damping rates
 $\unicode[STIX]{x1D6FE}_{s}/\unicode[STIX]{x1D714}$
on a log–log plot have the same the functional form, only a different relative weighting. The reduced mass ratio case has nearly a factor of ten larger relative contribution to the collisionless damping by the electrons than the realistic mass ratio. Note that significant collisionless damping of a wave occurs when
$\unicode[STIX]{x1D6FE}_{s}/\unicode[STIX]{x1D714}$
on a log–log plot have the same the functional form, only a different relative weighting. The reduced mass ratio case has nearly a factor of ten larger relative contribution to the collisionless damping by the electrons than the realistic mass ratio. Note that significant collisionless damping of a wave occurs when
 $\unicode[STIX]{x1D6FE}/\unicode[STIX]{x1D714}\gtrsim 0.1$
(marked by a horizontal dashed line), so total collisionless damping is relatively weak over the perpendicular range of the simulation for a realistic mass ratio
$\unicode[STIX]{x1D6FE}/\unicode[STIX]{x1D714}\gtrsim 0.1$
(marked by a horizontal dashed line), so total collisionless damping is relatively weak over the perpendicular range of the simulation for a realistic mass ratio
 $m_{i}/m_{e}=1836$
, whereas the damping is very strong with
$m_{i}/m_{e}=1836$
, whereas the damping is very strong with
 $\unicode[STIX]{x1D6FE}_{\text{tot}}/\unicode[STIX]{x1D714}\sim 1.0$
at the smallest perpendicular scales for the reduced mass ratio
$\unicode[STIX]{x1D6FE}_{\text{tot}}/\unicode[STIX]{x1D714}\sim 1.0$
at the smallest perpendicular scales for the reduced mass ratio
 $m_{i}/m_{e}=36$
. This enables collisionless damping to remove energy from the turbulent fluctuations completely over the resolve range of scales, avoiding any problematic bottlenecks at the smallest scales.
$m_{i}/m_{e}=36$
. This enables collisionless damping to remove energy from the turbulent fluctuations completely over the resolve range of scales, avoiding any problematic bottlenecks at the smallest scales.
Plots of (a) the normalized frequency
 $\unicode[STIX]{x1D714}/k_{\Vert }v_{A}$
and (b) the normalized ion damping rate
$\unicode[STIX]{x1D714}/k_{\Vert }v_{A}$
and (b) the normalized ion damping rate
 $\unicode[STIX]{x1D6FE}_{i}/\unicode[STIX]{x1D714}$
as a function of perpendicular wavenumber
$\unicode[STIX]{x1D6FE}_{i}/\unicode[STIX]{x1D714}$
as a function of perpendicular wavenumber
 $k_{\bot }\unicode[STIX]{x1D70C}_{i}$
for mass ratios (thick lines)
$k_{\bot }\unicode[STIX]{x1D70C}_{i}$
for mass ratios (thick lines)
 $m_{i}/m_{e}=4$
(dotted),
$m_{i}/m_{e}=4$
(dotted),
 $m_{i}/m_{e}=9$
(short dashed),
$m_{i}/m_{e}=9$
(short dashed),
 $m_{i}/m_{e}=16$
(long dashed),
$m_{i}/m_{e}=16$
(long dashed),
 $m_{i}/m_{e}=25$
(short dash-dot),
$m_{i}/m_{e}=25$
(short dash-dot),
 $m_{i}/m_{e}=32$
(long dash-dot) and
$m_{i}/m_{e}=32$
(long dash-dot) and
 $m_{i}/m_{e}=100$
(long dash-short dash). Also plotted (thin solid line) are the results for a realistic mass ratio
$m_{i}/m_{e}=100$
(long dash-short dash). Also plotted (thin solid line) are the results for a realistic mass ratio
 $m_{i}/m_{e}=1836$
.
$m_{i}/m_{e}=1836$
.
The properties of linear kinetic plasma theory, plotted in figure 15, support the argument that use of the reduced mass ratio
 $m_{i}/m_{e}=36$
will not lead to major qualitative differences in the plasma behaviour relative to a realistic mass ratio
$m_{i}/m_{e}=36$
will not lead to major qualitative differences in the plasma behaviour relative to a realistic mass ratio
 $m_{i}/m_{e}=1836$
. How far can the mass ratio be reduced before it alters the qualitative behaviour of the system? In figure 16, we plot (a) the normalized frequency
$m_{i}/m_{e}=1836$
. How far can the mass ratio be reduced before it alters the qualitative behaviour of the system? In figure 16, we plot (a) the normalized frequency
 $\unicode[STIX]{x1D714}/k_{\Vert }v_{A}$
and (b) the normalized ion damping rate
$\unicode[STIX]{x1D714}/k_{\Vert }v_{A}$
and (b) the normalized ion damping rate
 $\unicode[STIX]{x1D6FE}_{i}/\unicode[STIX]{x1D714}$
as a function of perpendicular wavenumber
$\unicode[STIX]{x1D6FE}_{i}/\unicode[STIX]{x1D714}$
as a function of perpendicular wavenumber
 $k_{\bot }\unicode[STIX]{x1D70C}_{i}$
for a
$k_{\bot }\unicode[STIX]{x1D70C}_{i}$
for a
 $\unicode[STIX]{x1D6FD}_{i}=1$
and
$\unicode[STIX]{x1D6FD}_{i}=1$
and
 $T_{i}/T_{e}=1$
plasma with mass ratios (thick lines)
$T_{i}/T_{e}=1$
plasma with mass ratios (thick lines)
 $m_{i}/m_{e}=4$
(dotted),
$m_{i}/m_{e}=4$
(dotted),
 $m_{i}/m_{e}=9$
(short dashed),
$m_{i}/m_{e}=9$
(short dashed),
 $m_{i}/m_{e}=16$
(long dashed),
$m_{i}/m_{e}=16$
(long dashed),
 $m_{i}/m_{e}=25$
(short dash-dot),
$m_{i}/m_{e}=25$
(short dash-dot),
 $m_{i}/m_{e}=32$
(long dash-dot) and
$m_{i}/m_{e}=32$
(long dash-dot) and
 $m_{i}/m_{e}=100$
(long dash-short dash). Also plotted for comparison (thin solid line) are the results for a realistic mass ratio
$m_{i}/m_{e}=100$
(long dash-short dash). Also plotted for comparison (thin solid line) are the results for a realistic mass ratio
 $m_{i}/m_{e}=1836$
. The cautionary result here is that, for very low mass ratios of
$m_{i}/m_{e}=1836$
. The cautionary result here is that, for very low mass ratios of
 $m_{i}/m_{e}=4$
and
$m_{i}/m_{e}=4$
and
 $m_{i}/m_{e}=9$
, the behaviour of the plasma response, specifically the wave frequency and the ion collisionless damping, differs qualitatively from the case for mass ratios
$m_{i}/m_{e}=9$
, the behaviour of the plasma response, specifically the wave frequency and the ion collisionless damping, differs qualitatively from the case for mass ratios
 $m_{i}/m_{e}\geqslant 16$
. The key difference is that the ion damping does not peak at
$m_{i}/m_{e}\geqslant 16$
. The key difference is that the ion damping does not peak at
 $k_{\bot }\unicode[STIX]{x1D70C}_{i}\sim 1$
and then drop off sharply for
$k_{\bot }\unicode[STIX]{x1D70C}_{i}\sim 1$
and then drop off sharply for
 $k_{\bot }\unicode[STIX]{x1D70C}_{i}\gg 1$
for these very low mass ratios, and this qualitative difference could lead to unphysical results.
$k_{\bot }\unicode[STIX]{x1D70C}_{i}\gg 1$
for these very low mass ratios, and this qualitative difference could lead to unphysical results.
For the mass ratio
 $m_{i}/m_{e}=36$
used in the simulation presented in this paper, we appear to be safely in an asymptotic regime that mimics the qualitative behaviour of the realistic mass ratio case. Similar tests (not shown) over the range of ion plasma
$m_{i}/m_{e}=36$
used in the simulation presented in this paper, we appear to be safely in an asymptotic regime that mimics the qualitative behaviour of the realistic mass ratio case. Similar tests (not shown) over the range of ion plasma
 $\unicode[STIX]{x1D6FD}$
 $0.3\leqslant \unicode[STIX]{x1D6FD}_{i}\leqslant 3$
suggest that mass ratios
$0.3\leqslant \unicode[STIX]{x1D6FD}_{i}\leqslant 3$
suggest that mass ratios
 $m_{i}/m_{e}<32$
may potentially lead to qualitatively incorrect results about the relative ion and electron damping (Klein et al.
Reference Klein, Howes and TenBarge2017). The take-home lesson is that one must be cautious in the interpretation of the results from numerical simulations that employ very low mass ratios.
$m_{i}/m_{e}<32$
may potentially lead to qualitatively incorrect results about the relative ion and electron damping (Klein et al.
Reference Klein, Howes and TenBarge2017). The take-home lesson is that one must be cautious in the interpretation of the results from numerical simulations that employ very low mass ratios.
Appendix B. Particle energization by component and species
In the Vlasov–Maxwell system of equations, the rate of change of particle energy density at a given position in space is given by the rate of electromagnetic work,
 $\boldsymbol{j}\boldsymbol{\cdot }\boldsymbol{E}$
(Klein et al.
Reference Klein, Howes and TenBarge2017), confirming the familiar concept the only the electric field can change the energy of charged particles. In the low-frequency limit of kinetic plasma theory, one may average the Vlasov–Maxwell equations over the gyrophase
$\boldsymbol{j}\boldsymbol{\cdot }\boldsymbol{E}$
(Klein et al.
Reference Klein, Howes and TenBarge2017), confirming the familiar concept the only the electric field can change the energy of charged particles. In the low-frequency limit of kinetic plasma theory, one may average the Vlasov–Maxwell equations over the gyrophase
 $\unicode[STIX]{x1D703}$
in cylindrical velocity space
$\unicode[STIX]{x1D703}$
in cylindrical velocity space
 $(v_{\Vert },v_{\bot },\unicode[STIX]{x1D703})$
to obtain the reduced system of gyrokinetics (Frieman & Chen Reference Frieman and Chen1982; Howes et al.
Reference Howes, Cowley, Dorland, Hammett, Quataert and Schekochihin2006). The benefit of this procedure is the reduction of velocity space to two dimensions
$(v_{\Vert },v_{\bot },\unicode[STIX]{x1D703})$
to obtain the reduced system of gyrokinetics (Frieman & Chen Reference Frieman and Chen1982; Howes et al.
Reference Howes, Cowley, Dorland, Hammett, Quataert and Schekochihin2006). The benefit of this procedure is the reduction of velocity space to two dimensions
 $(v_{\Vert },v_{\bot })$
at the expense of discarding the physics at cyclotron frequencies and higher; effectively, the cyclotron resonances and fast magnetosonic waves are eliminated, while retaining finite Larmor radius effects and collisionless damping via the Landau resonance.
$(v_{\Vert },v_{\bot })$
at the expense of discarding the physics at cyclotron frequencies and higher; effectively, the cyclotron resonances and fast magnetosonic waves are eliminated, while retaining finite Larmor radius effects and collisionless damping via the Landau resonance.
Plots of the different components of the electromagnetic work (a)
 $\langle j_{x}E_{x}\rangle _{\unicode[STIX]{x1D70F}}$
, (b)
$\langle j_{x}E_{x}\rangle _{\unicode[STIX]{x1D70F}}$
, (b)
 $\langle j_{y}E_{y}\rangle _{\unicode[STIX]{x1D70F}}$
and (c)
$\langle j_{y}E_{y}\rangle _{\unicode[STIX]{x1D70F}}$
and (c)
 $\langle j_{\Vert }E_{\Vert }\rangle _{\unicode[STIX]{x1D70F}}$
, as well as the total work (d)
$\langle j_{\Vert }E_{\Vert }\rangle _{\unicode[STIX]{x1D70F}}$
, as well as the total work (d)
 $\langle \boldsymbol{j}\boldsymbol{\cdot }\boldsymbol{E}\rangle _{\unicode[STIX]{x1D70F}}$
averaged over a single wave period
$\langle \boldsymbol{j}\boldsymbol{\cdot }\boldsymbol{E}\rangle _{\unicode[STIX]{x1D70F}}$
averaged over a single wave period
 $\unicode[STIX]{x1D70F}=0.992T_{0}$
centred at time
$\unicode[STIX]{x1D70F}=0.992T_{0}$
centred at time
 $t/T_{0}=1.86$
.
$t/T_{0}=1.86$
.

In addition to this elimination of the cyclotron resonances, a component of the perpendicular electromagnetic work,
 $\boldsymbol{j}_{\bot }\boldsymbol{\cdot }\boldsymbol{E}_{\bot }$
is alternatively expressed in terms of the magnetic mirror force,
$\boldsymbol{j}_{\bot }\boldsymbol{\cdot }\boldsymbol{E}_{\bot }$
is alternatively expressed in terms of the magnetic mirror force,
 $\boldsymbol{F}_{\text{mir}}=-\unicode[STIX]{x1D707}\unicode[STIX]{x1D735}_{\Vert }|\boldsymbol{B}|$
, where the magnetic moment of a particle is given by
$\boldsymbol{F}_{\text{mir}}=-\unicode[STIX]{x1D707}\unicode[STIX]{x1D735}_{\Vert }|\boldsymbol{B}|$
, where the magnetic moment of a particle is given by
 $\unicode[STIX]{x1D707}_{s}=m_{s}v_{\bot }^{2}/2|B|$
. In the anisotropic limit
$\unicode[STIX]{x1D707}_{s}=m_{s}v_{\bot }^{2}/2|B|$
. In the anisotropic limit
 $k_{\Vert }\ll k_{\bot }$
of the gyrokinetic approximation, the change in the magnetic field magnitude is dominated by the variation in the parallel component of the field,
$k_{\Vert }\ll k_{\bot }$
of the gyrokinetic approximation, the change in the magnetic field magnitude is dominated by the variation in the parallel component of the field,
 $\unicode[STIX]{x1D6FF}|\boldsymbol{B}|=\unicode[STIX]{x1D6FF}B_{\Vert }+O(|\unicode[STIX]{x1D6FF}\boldsymbol{B}|^{2})$
. For electromagnetic waves with a fluctuation in the magnetic field strength, the magnetic mirror force
$\unicode[STIX]{x1D6FF}|\boldsymbol{B}|=\unicode[STIX]{x1D6FF}B_{\Vert }+O(|\unicode[STIX]{x1D6FF}\boldsymbol{B}|^{2})$
. For electromagnetic waves with a fluctuation in the magnetic field strength, the magnetic mirror force
 $-\unicode[STIX]{x1D707}\unicode[STIX]{x1D735}_{\Vert }\unicode[STIX]{x1D6FF}B_{\Vert }$
acting on the magnetic moment
$-\unicode[STIX]{x1D707}\unicode[STIX]{x1D735}_{\Vert }\unicode[STIX]{x1D6FF}B_{\Vert }$
acting on the magnetic moment
 $\unicode[STIX]{x1D707}$
of the particle gyromotion, leads to collisionless damping of the wave via the Landau resonance, a process denoted by the term transit-time damping, or alternatively called Barnes damping (Barnes Reference Barnes1966; Quataert Reference Quataert1998).
$\unicode[STIX]{x1D707}$
of the particle gyromotion, leads to collisionless damping of the wave via the Landau resonance, a process denoted by the term transit-time damping, or alternatively called Barnes damping (Barnes Reference Barnes1966; Quataert Reference Quataert1998).
Plots of the instantaneous rate of parallel electromagnetic work on the ions
 $j_{\Vert ,i}E_{\Vert }$
and contours of the parallel vector potential
$j_{\Vert ,i}E_{\Vert }$
and contours of the parallel vector potential
 $A_{\Vert }$
(contours, positive solid, negative dashed) at times
$A_{\Vert }$
(contours, positive solid, negative dashed) at times
 $t/T_{0}=$
(a) 1.75, (b) 1.86 and (c) 2.03, as well as (d)
$t/T_{0}=$
(a) 1.75, (b) 1.86 and (c) 2.03, as well as (d)
 $\langle j_{\Vert ,i}E_{\Vert }\rangle _{\unicode[STIX]{x1D70F}}$
averaged over one full wave period
$\langle j_{\Vert ,i}E_{\Vert }\rangle _{\unicode[STIX]{x1D70F}}$
averaged over one full wave period
 $\unicode[STIX]{x1D70F}=0.992T_{0}$
centred at time
$\unicode[STIX]{x1D70F}=0.992T_{0}$
centred at time
 $t/T_{0}=1.86$
.
$t/T_{0}=1.86$
.

Plots of the instantaneous rate of parallel electromagnetic work on the electrons
 $j_{\Vert ,e}E_{\Vert }$
and contours of the parallel vector potential
$j_{\Vert ,e}E_{\Vert }$
and contours of the parallel vector potential
 $A_{\Vert }$
(contours, positive solid, negative dashed) at times
$A_{\Vert }$
(contours, positive solid, negative dashed) at times
 $t/T_{0}=$
(a) 1.75, (b) 1.86 and (c) 2.03, as well as (d)
$t/T_{0}=$
(a) 1.75, (b) 1.86 and (c) 2.03, as well as (d)
 $\langle j_{\Vert ,e}E_{\Vert }\rangle _{\unicode[STIX]{x1D70F}}$
averaged over one full wave period
$\langle j_{\Vert ,e}E_{\Vert }\rangle _{\unicode[STIX]{x1D70F}}$
averaged over one full wave period
 $\unicode[STIX]{x1D70F}=0.992T_{0}$
centred at time
$\unicode[STIX]{x1D70F}=0.992T_{0}$
centred at time
 $t/T_{0}=1.86$
.
$t/T_{0}=1.86$
.

The bottom line is in gyrokinetics there are two separate mechanisms that can lead to resonant collisionless particle energization: Landau damping mediated by the parallel electric field
 $E_{\Vert }$
and transit-time damping mediated by gradients in the parallel magnetic field perturbation
$E_{\Vert }$
and transit-time damping mediated by gradients in the parallel magnetic field perturbation
 $\unicode[STIX]{x1D735}_{\Vert }\unicode[STIX]{x1D6FF}B_{\Vert }$
. In this paper, we focus solely on the particle energization by Landau damping through the parallel electric field
$\unicode[STIX]{x1D735}_{\Vert }\unicode[STIX]{x1D6FF}B_{\Vert }$
. In this paper, we focus solely on the particle energization by Landau damping through the parallel electric field
 $E_{\Vert }$
, leaving a detailed analysis of transit-time damping to future work.
$E_{\Vert }$
, leaving a detailed analysis of transit-time damping to future work.
Although gyrokinetics eliminates cyclotron resonant heating, it still describes the electromagnetic work done by all three components of
 $\boldsymbol{j}\boldsymbol{\cdot }\boldsymbol{E}$
. The primary focus of this paper is resonant heating by Landau damping through the parallel electric field
$\boldsymbol{j}\boldsymbol{\cdot }\boldsymbol{E}$
. The primary focus of this paper is resonant heating by Landau damping through the parallel electric field
 $E_{\Vert }$
, so plots in the body of paper focus only on the parallel contribution
$E_{\Vert }$
, so plots in the body of paper focus only on the parallel contribution
 $j_{\Vert }E_{\Vert }$
. In figure 17, we present here for completeness the three components of the electromagnetic work (a)
$j_{\Vert }E_{\Vert }$
. In figure 17, we present here for completeness the three components of the electromagnetic work (a)
 $\langle j_{x}E_{x}\rangle _{\unicode[STIX]{x1D70F}}$
, (b)
$\langle j_{x}E_{x}\rangle _{\unicode[STIX]{x1D70F}}$
, (b)
 $\langle j_{y}E_{y}\rangle _{\unicode[STIX]{x1D70F}}$
and (c)
$\langle j_{y}E_{y}\rangle _{\unicode[STIX]{x1D70F}}$
and (c)
 $\langle j_{\Vert }E_{\Vert }\rangle _{\unicode[STIX]{x1D70F}}$
averaged over single wave period
$\langle j_{\Vert }E_{\Vert }\rangle _{\unicode[STIX]{x1D70F}}$
averaged over single wave period
 $\unicode[STIX]{x1D70F}=0.992T_{0}$
centred at time
$\unicode[STIX]{x1D70F}=0.992T_{0}$
centred at time
 $t/T_{0}=1.86$
. The components
$t/T_{0}=1.86$
. The components
 $j_{x}E_{x}$
and
$j_{x}E_{x}$
and
 $j_{y}E_{y}$
dominantly represent the energy transfer between fields and particles associated with undamped wave motion, for example representing magnetic tension as the restoring force for the Alfvén wave. Therefore,
$j_{y}E_{y}$
dominantly represent the energy transfer between fields and particles associated with undamped wave motion, for example representing magnetic tension as the restoring force for the Alfvén wave. Therefore,
 $j_{x}E_{x}$
and
$j_{x}E_{x}$
and
 $j_{y}E_{y}$
represent oscillatory energy transfer, and averaged over one wave period there is very little net energy change. By comparison, the single-wave period averaged
$j_{y}E_{y}$
represent oscillatory energy transfer, and averaged over one wave period there is very little net energy change. By comparison, the single-wave period averaged
 $\langle j_{\Vert }E_{\Vert }\rangle _{\unicode[STIX]{x1D70F}}$
represents the secular energy transfer associated with collisionless damping, is much larger than that for
$\langle j_{\Vert }E_{\Vert }\rangle _{\unicode[STIX]{x1D70F}}$
represents the secular energy transfer associated with collisionless damping, is much larger than that for
 $j_{x}E_{x}$
or
$j_{x}E_{x}$
or
 $j_{y}E_{y}$
. Note that (d) the total single-wave period-averaged total electromagnetic work
$j_{y}E_{y}$
. Note that (d) the total single-wave period-averaged total electromagnetic work
 $\langle \boldsymbol{j}\boldsymbol{\cdot }\boldsymbol{E}\rangle _{\unicode[STIX]{x1D70F}}$
is dominated by the parallel component
$\langle \boldsymbol{j}\boldsymbol{\cdot }\boldsymbol{E}\rangle _{\unicode[STIX]{x1D70F}}$
is dominated by the parallel component
 $\langle j_{\Vert }E_{\Vert }\rangle _{\unicode[STIX]{x1D70F}}$
. This comparison motivates our focus in the body of this paper on the parallel contribution to the electromagnetic work,
$\langle j_{\Vert }E_{\Vert }\rangle _{\unicode[STIX]{x1D70F}}$
. This comparison motivates our focus in the body of this paper on the parallel contribution to the electromagnetic work,
 $j_{\Vert }E_{\Vert }$
.
$j_{\Vert }E_{\Vert }$
.
We also plot separately the parallel electromagnetic work on the ions
 $j_{\Vert ,i}E_{\Vert }$
in figure 18 and on the electrons
$j_{\Vert ,i}E_{\Vert }$
in figure 18 and on the electrons
 $j_{\Vert ,e}E_{\Vert }$
in figure 19. The spatial patterns of the instantaneous rate of work at
$j_{\Vert ,e}E_{\Vert }$
in figure 19. The spatial patterns of the instantaneous rate of work at
 $t/T_{0}=$
(a) 1.75, (b) 1.86 and (c) 2.03, as well as (d) the
$t/T_{0}=$
(a) 1.75, (b) 1.86 and (c) 2.03, as well as (d) the
 $\langle j_{\Vert ,s}E_{\Vert }\rangle _{\unicode[STIX]{x1D70F}}$
averaged over one full wave period
$\langle j_{\Vert ,s}E_{\Vert }\rangle _{\unicode[STIX]{x1D70F}}$
averaged over one full wave period
 $\unicode[STIX]{x1D70F}=0.992T_{0}$
centred at time
$\unicode[STIX]{x1D70F}=0.992T_{0}$
centred at time
 $t/T_{0}=1.86$
, are similar for both species, but the rate of electron energization in this plane is about twice the magnitude of that for the ions. Since the ion and electron linear damping rates are similar for
$t/T_{0}=1.86$
, are similar for both species, but the rate of electron energization in this plane is about twice the magnitude of that for the ions. Since the ion and electron linear damping rates are similar for
 $k_{\bot }\unicode[STIX]{x1D70C}_{i}\lesssim 1$
, this may suggest significant energy removal at higher
$k_{\bot }\unicode[STIX]{x1D70C}_{i}\lesssim 1$
, this may suggest significant energy removal at higher
 $k_{\bot }\unicode[STIX]{x1D70C}_{i}>1$
where electrons are expected to receive a greater share of the removed turbulent energy. A future examination of the ion and electron energization will investigate the typical length scale at which particles are energized in more detail.
$k_{\bot }\unicode[STIX]{x1D70C}_{i}>1$
where electrons are expected to receive a greater share of the removed turbulent energy. A future examination of the ion and electron energization will investigate the typical length scale at which particles are energized in more detail.