


1. Introduction
In a high-confinement ‘H-mode’ tokamak plasma (Wagner et al. Reference Wagner1982), an edge transport barrier (a narrow region of reduced particle and heat diffusivity) forms spontaneously at the plasma periphery, resulting in much stronger gradients of density and temperature, known as the H-mode ‘pedestal’ just inside the last closed flux surface (LCFS) or ‘separatrix’. This pedestal increases the total particle and energy content of the plasma and thereby the overall energy confinement. Hence, for predictions of the performance of future devices, it is crucial to be able to predict the electron density $n_{e,ped}$
and temperature
$n_{e,ped}$
and temperature $T_{e,ped}$
at the top of the pedestal, which provide the boundary conditions for calculation of the density and temperature profiles across the confined ‘core’ plasma and thereby the total stored thermal energy
$T_{e,ped}$
at the top of the pedestal, which provide the boundary conditions for calculation of the density and temperature profiles across the confined ‘core’ plasma and thereby the total stored thermal energy $W_{pl}$
of the plasma.
$W_{pl}$
of the plasma.
Future fusion devices designed to demonstrate the conditions of a burning D–T plasma, e.g. ITER, DEMO or STEP (Ikeda Reference Ikeda2009; Federici et al. Reference Federici2014; Nuttall et al. Reference Nuttall, Konishi, Takeda and Webbe-Wood2020), will be run with plasmas formed from a 50 : 50 D–T mixture for thermonuclear operation, so it is important to understand the effect of the relative isotope mass, $A_{\textit{eff}} = \sum {(c_i A_i)}/\sum {c_i}$
, where
$A_{\textit{eff}} = \sum {(c_i A_i)}/\sum {c_i}$
, where $A_i = m_i/m_p$
(where
$A_i = m_i/m_p$
(where $m_i$
is the ion mass and
$m_i$
is the ion mass and $m_p$
is the proton mass) is the mass number and
$m_p$
is the proton mass) is the mass number and $c_i = n_i/n_e$
(where
$c_i = n_i/n_e$
(where $n_i$
and
$n_i$
and $n_e$
are the ion and electron number densities) is the concentration of each hydrogenic isotope (H, D and T)), on confinement and heat transport across the core and pedestal regions of the plasma. Hence, any model, either theory based, a reduced model or a simulation of turbulent heat transport, to be used for prediction of the pedestal temperature
$n_e$
are the ion and electron number densities) is the concentration of each hydrogenic isotope (H, D and T)), on confinement and heat transport across the core and pedestal regions of the plasma. Hence, any model, either theory based, a reduced model or a simulation of turbulent heat transport, to be used for prediction of the pedestal temperature $T_{e,ped}$
must be able to model its dependence on the effective mass
$T_{e,ped}$
must be able to model its dependence on the effective mass $A_{\textit{eff}}$
.
$A_{\textit{eff}}$
.
Many studies using gyrokinetic codes have now demonstrated that electron-scale turbulence due to electron-temperature-gradient (ETG) driven modes and/or micro-tearing modes (MTMs) frequently dominates the heat transport across the H-mode pedestal (Told et al. Reference Told2008; Jenko et al. Reference Jenko, Told, Xanthopoulos, Merz and Horton2009; Hatch et al. Reference Hatch2015, Reference Hatch, Kotschenreuther, Mahajan, Valanju, Jenko, Told, Görler and Saarelma2016, Reference Hatch, Kotschenreuther, Mahajan, Valanju and Liu2017, Reference Hatch2019; Kotschenreuther et al. Reference Kotschenreuther2019; Hatch et al. Reference Hatch2021; Hassan et al. Reference Hassan, Hatch, Halfmoon, Curie, Kotchenreuther, Mahajan, Merlo, Groebner, Nelson and Diallo2021), especially at high heating power and when the pedestal density gradient is steep.
Notably, Told et al. (Reference Told2008) found, in their study on ASDEX-Upgrade, that, while MTMs were found to make the dominant contribution to the electron heat flux in the region just inside the pedestal top, small-scale ETG modes with maximum amplitudes near the ‘x’-points were found to dominate in the steep-gradient region. They also pointed out, as was also in Jenko et al. (Reference Jenko, Told, Xanthopoulos, Merz and Horton2009), that the measured values of the parameter $\eta _e \equiv L_{n_e}/L_{T_e} \sim 2$
, where
$\eta _e \equiv L_{n_e}/L_{T_e} \sim 2$
, where $L_{n_e} = n_e/(\text{d}n_e/\text{d}r)$
and
$L_{n_e} = n_e/(\text{d}n_e/\text{d}r)$
and $L_{T_e} = T_e/(\text{d}T_e/\text{d}r)$
are the electron temperature and density scale lengths, were a factor
$L_{T_e} = T_e/(\text{d}T_e/\text{d}r)$
are the electron temperature and density scale lengths, were a factor ${\sim} 1.6$
above the linear threshold for ETG modes.
${\sim} 1.6$
above the linear threshold for ETG modes.
This observation of values of $\eta _e \sim 2$
across the pedestal was also reported in the earlier study by Neuhauser et al. (Reference Neuhauser2002), on ASDEX Upgrade, in which it was suggested this might be related to the threshold behaviour of drift waves, and it was shown by Horton et al. (Reference Horton2005) that, by assuming a constant value of
$\eta _e \sim 2$
across the pedestal was also reported in the earlier study by Neuhauser et al. (Reference Neuhauser2002), on ASDEX Upgrade, in which it was suggested this might be related to the threshold behaviour of drift waves, and it was shown by Horton et al. (Reference Horton2005) that, by assuming a constant value of $\eta _e \sim 2$
across the pedestal, the measured
$\eta _e \sim 2$
across the pedestal, the measured $T_e$
profile could be reconstructed from the
$T_e$
profile could be reconstructed from the $n_e$
profile, leaving the electron temperature and density at the separatrix,
$n_e$
profile, leaving the electron temperature and density at the separatrix, $T_{e,sep}$
and
$T_{e,sep}$
and $n_{e,sep}$
, as the only other free parameters.
$n_{e,sep}$
, as the only other free parameters.
Several other studies have also revealed the importance of $\eta _e$
in governing the electron heat flux
$\eta _e$
in governing the electron heat flux $q_e$
across the pedestal region (Guttenfelder et al. Reference Guttenfelder, Groebner, Canik, Grierson, Belli and Candy2021; Chapman-Oplopoiou et al. Reference Chapman-Oplopoiou2022; Hatch et al. Reference Hatch2022) and have proposed several, rather similar scaling expressions for the gyro-Bohm normalised heat flux
$q_e$
across the pedestal region (Guttenfelder et al. Reference Guttenfelder, Groebner, Canik, Grierson, Belli and Candy2021; Chapman-Oplopoiou et al. Reference Chapman-Oplopoiou2022; Hatch et al. Reference Hatch2022) and have proposed several, rather similar scaling expressions for the gyro-Bohm normalised heat flux $q_e/q_{e,gB}$
with the parameters
$q_e/q_{e,gB}$
with the parameters $\eta _e$
and
$\eta _e$
and $R/L_{T_e}$
. Here, the gyro-Bohm electron heat flux is defined as
$R/L_{T_e}$
. Here, the gyro-Bohm electron heat flux is defined as $q_{e,gB} = n_e \chi _{e,gB}\, T_e/R$
, where the associated heat diffusivity
$q_{e,gB} = n_e \chi _{e,gB}\, T_e/R$
, where the associated heat diffusivity $\chi _{e,gB} = v_{th,e} \rho _e^2/R$
,
$\chi _{e,gB} = v_{th,e} \rho _e^2/R$
, $v_{th,e}$
is the electron thermal velocity and
$v_{th,e}$
is the electron thermal velocity and $\rho _e$
is the electron Larmor radius.
$\rho _e$
is the electron Larmor radius.
A simplified heat flux scaling (or, alternatively, modified quasi-linear expressions for the ETG heat flux as proposed by Hatch et al. (Reference Hatch2022)) can be used to form the basis of numerical models for the pedestal $T_e$
profile. Such an approach is taken to construct the numerical model of pedestal structure developed by Guttenfelder et al. (Reference Guttenfelder, Groebner, Canik, Grierson, Belli and Candy2021), which is based on a combination of ETG heat transport governed by
$T_e$
profile. Such an approach is taken to construct the numerical model of pedestal structure developed by Guttenfelder et al. (Reference Guttenfelder, Groebner, Canik, Grierson, Belli and Candy2021), which is based on a combination of ETG heat transport governed by $\eta _e$
and particle transport due to pressure-gradient-limited, kinetic-ballooning modes (KBMs) – consistent with the mechanisms for pedestal transport proposed by Hatch et al. (Reference Hatch, Kotschenreuther, Mahajan, Valanju, Jenko, Told, Görler and Saarelma2016).
$\eta _e$
and particle transport due to pressure-gradient-limited, kinetic-ballooning modes (KBMs) – consistent with the mechanisms for pedestal transport proposed by Hatch et al. (Reference Hatch, Kotschenreuther, Mahajan, Valanju, Jenko, Told, Görler and Saarelma2016).
Such a simplified, semi-numerical model for the pedestal $T_e$
profile, based on a scaling for the ETG-driven turbulent heat transport proposed in Chapman-Oplopoiou et al. (Reference Chapman-Oplopoiou2022), appropriate for the steep-density gradient region of the H-mode pedestal, is presented in Field et al. (Reference Field, Chapman-Oplopoiou, Connor, Frassinetti, Hatch, Roach and Saarelma2023). Here, this model is used to predict the
$T_e$
profile, based on a scaling for the ETG-driven turbulent heat transport proposed in Chapman-Oplopoiou et al. (Reference Chapman-Oplopoiou2022), appropriate for the steep-density gradient region of the H-mode pedestal, is presented in Field et al. (Reference Field, Chapman-Oplopoiou, Connor, Frassinetti, Hatch, Roach and Saarelma2023). Here, this model is used to predict the $T_e$
profile across the pedestal of a set of
$T_e$
profile across the pedestal of a set of $2\,\textrm {MA}$
H-mode pulses, run in the JET tokamak with the beryllium wall and tungsten divertor (JET-Be/W) in which the effective isotope mass
$2\,\textrm {MA}$
H-mode pulses, run in the JET tokamak with the beryllium wall and tungsten divertor (JET-Be/W) in which the effective isotope mass $A_{\textit{eff}}$
was varied from pure D to pure T, as well as pulses in D and T at higher and lower rates of gas fuelling (Frassinetti et al. Reference Frassinetti2023). Hence, the predictive capability of the model is tested both across the
$A_{\textit{eff}}$
was varied from pure D to pure T, as well as pulses in D and T at higher and lower rates of gas fuelling (Frassinetti et al. Reference Frassinetti2023). Hence, the predictive capability of the model is tested both across the $A_{\textit{eff}}$
scan and at a different plasma current
$A_{\textit{eff}}$
scan and at a different plasma current $I_p$
and toroidal field
$I_p$
and toroidal field $B_t$
to that for which the scaling was determined, i.e.
$B_t$
to that for which the scaling was determined, i.e. $2\,\textrm {MA}/2.25\,\textrm {T}$
rather than
$2\,\textrm {MA}/2.25\,\textrm {T}$
rather than $1.4\,\textrm {MA}/1.7\,\textrm {T}$
, by comparing the predicted values of
$1.4\,\textrm {MA}/1.7\,\textrm {T}$
, by comparing the predicted values of $T_e$
with those measured at two locations at the top of the
$T_e$
with those measured at two locations at the top of the $T_e$
and
$T_e$
and $n_e$
pedestals.
$n_e$
pedestals.
The resulting agreement between the predicted and measured values of $T_e$
at the top of the density pedestal provides strong evidence that the electron heat transport across the steep-density gradient region of the pedestal conforms to the assumed scaling for
$T_e$
at the top of the density pedestal provides strong evidence that the electron heat transport across the steep-density gradient region of the pedestal conforms to the assumed scaling for $q_e/q_{e,gB}$
with
$q_e/q_{e,gB}$
with $\eta _e$
, which is independent of the ion mass and hence of
$\eta _e$
, which is independent of the ion mass and hence of $A_{\textit{eff}}$
. Furthermore, the applicability of this model also highlights the importance of the pedestal boundary conditions at the separatrix, i.e.
$A_{\textit{eff}}$
. Furthermore, the applicability of this model also highlights the importance of the pedestal boundary conditions at the separatrix, i.e. $n_{e,sep}$
and
$n_{e,sep}$
and $T_{e,sep}$
in governing the pedestal temperature
$T_{e,sep}$
in governing the pedestal temperature $T_{e,ped}$
, which is a consequence of the assumed electron heat flux dependence on
$T_{e,ped}$
, which is a consequence of the assumed electron heat flux dependence on $\eta _e$
.
$\eta _e$
.
By combining the ETG critical-heat-flux model of Field et al. (Reference Field, Chapman-Oplopoiou, Connor, Frassinetti, Hatch, Roach and Saarelma2023) with the EPED model of Snyder et al. (Reference Snyder, Groebner, Leonard, Osborne and Wilson2009) for prediction of the total pressure at the pedestal top $p_{ped}$
, we demonstrate in § 6 that it is also possible to predict the pedestal ion temperature
$p_{ped}$
, we demonstrate in § 6 that it is also possible to predict the pedestal ion temperature $T_{i,ped}$
, although this also requires knowledge of
$T_{i,ped}$
, although this also requires knowledge of $n_{e,ped}$
. Furthermore, by combining these two models with the density-pedestal (DP) prediction model of Saarelma et al. (Reference Saarelma, Connor, Bilkova, Bohm, Field, Frassinetti, Fridstrom, Kirk and Contributors2023) for
$n_{e,ped}$
. Furthermore, by combining these two models with the density-pedestal (DP) prediction model of Saarelma et al. (Reference Saarelma, Connor, Bilkova, Bohm, Field, Frassinetti, Fridstrom, Kirk and Contributors2023) for $n_{e,ped}$
, it is possible to obtain a full prediction of the pedestal
$n_{e,ped}$
, it is possible to obtain a full prediction of the pedestal $n_e$
,
$n_e$
, $T_e$
and
$T_e$
and $T_i$
profiles, only requiring the boundary conditions at the separatrix (
$T_i$
profiles, only requiring the boundary conditions at the separatrix ( $n_{e,sep}$
and
$n_{e,sep}$
and $T_{e,sep}$
) and the heat flux (
$T_{e,sep}$
) and the heat flux ( $P_{sep}/S$
, where
$P_{sep}/S$
, where $P_{sep}$
is the loss power across the separatrix and
$P_{sep}$
is the loss power across the separatrix and $S$
is the area of the LCFS) across the pedestal as the main experimental inputs.
$S$
is the area of the LCFS) across the pedestal as the main experimental inputs.
The remainder of this paper is structured as follows: the ETG model for the pedestal $T_e$
profile is outlined in § 2, then the experimental § 3 describes the pedestal data set used for this comparison in § 3.1, followed by an explanation of how the data are prepared for input to the model in § 3.2. The resulting comparisons of the predicted and measured
$T_e$
profile is outlined in § 2, then the experimental § 3 describes the pedestal data set used for this comparison in § 3.1, followed by an explanation of how the data are prepared for input to the model in § 3.2. The resulting comparisons of the predicted and measured $T_e$
profiles are then presented in § 4, followed by a discussion of these comparisons in terms of current understanding of the underlying physics of turbulent electron heat transport across the pedestal in § 5. Results from attempts to combine the ETG model for the pedestal
$T_e$
profiles are then presented in § 4, followed by a discussion of these comparisons in terms of current understanding of the underlying physics of turbulent electron heat transport across the pedestal in § 5. Results from attempts to combine the ETG model for the pedestal $T_e$
profile with the EPED model of Snyder et al. (Reference Snyder, Groebner, Leonard, Osborne and Wilson2009) for the pedestal height and width are presented in § 6. The overall conclusions of the study are then summarised in § 7.
$T_e$
profile with the EPED model of Snyder et al. (Reference Snyder, Groebner, Leonard, Osborne and Wilson2009) for the pedestal height and width are presented in § 6. The overall conclusions of the study are then summarised in § 7.
2. The ETG heat transport model for pedestal $T_e$
profile
$T_e$
profile

The model of Field et al. (Reference Field, Chapman-Oplopoiou, Connor, Frassinetti, Hatch, Roach and Saarelma2023) is based on a scaling for the gyro-Bohm normalised turbulent electron heat flux $Q_{e}^\star \equiv q_e/q_{e,MgB}$
with the parameter
$Q_{e}^\star \equiv q_e/q_{e,MgB}$
with the parameter $\eta _e = L_{n_e}/L_{T_e}$
. Here, the modified gyro-Bohm normalisation
$\eta _e = L_{n_e}/L_{T_e}$
. Here, the modified gyro-Bohm normalisation $q_{e,MgB} = q_{e,gB} (R/L_{T_e})^2$
is defined in terms of the local
$q_{e,MgB} = q_{e,gB} (R/L_{T_e})^2$
is defined in terms of the local $L_{T_e}$
at the simulated flux surface within the pedestal region, rather than the usual definition in terms of a macroscopic length scale such as the major radius of the plasma
$L_{T_e}$
at the simulated flux surface within the pedestal region, rather than the usual definition in terms of a macroscopic length scale such as the major radius of the plasma $R$
.
$R$
.
The $Q_{e}^\star (\eta _e)$
scaling was determined as a fit to saturated, turbulent electron heat-flux
$Q_{e}^\star (\eta _e)$
scaling was determined as a fit to saturated, turbulent electron heat-flux $q_e$
data from a set of local, nonlinear, electromagnetic, electron-scale simulations, which were performed by Chapman-Oplopoiou et al. (Reference Chapman-Oplopoiou2022) using the gyrokinetic (GK) code GENE (Jenko Reference Jenko2000; Goerler et al. Reference Goerler, Lapillonne, Brunner, Dannert, Jenko, Merz and Told2011). The simulations were run at a flux surface in the steep-density gradient region of the pedestal, half way between the density pedestal top (defined here in terms of the normalised poloidal flux as
$q_e$
data from a set of local, nonlinear, electromagnetic, electron-scale simulations, which were performed by Chapman-Oplopoiou et al. (Reference Chapman-Oplopoiou2022) using the gyrokinetic (GK) code GENE (Jenko Reference Jenko2000; Goerler et al. Reference Goerler, Lapillonne, Brunner, Dannert, Jenko, Merz and Told2011). The simulations were run at a flux surface in the steep-density gradient region of the pedestal, half way between the density pedestal top (defined here in terms of the normalised poloidal flux as $\psi _N^{n_{e,top}}$
) and the separatrix (at
$\psi _N^{n_{e,top}}$
) and the separatrix (at $\psi _N = 1$
).Footnote
1
$\psi _N = 1$
).Footnote
1
Two sets of pedestal profiles were considered from $1.4\,\textrm {MA}$
JET-Be/W deuterium pulses at high and low rates of gas fuelling (
$1.4\,\textrm {MA}$
JET-Be/W deuterium pulses at high and low rates of gas fuelling ( $\varGamma _{D2} \sim 0.3\ \text{and}\ 1.8 \times 10^{22}\,\textrm {es}^{-1}$
) with
$\varGamma _{D2} \sim 0.3\ \text{and}\ 1.8 \times 10^{22}\,\textrm {es}^{-1}$
) with $16\,\textrm {MW}$
of heating power, which were run during experiments performed by Maggi et al. (Reference Maggi2015, Reference Maggi2017). For each set of pedestal profiles, simulations were run with the normalised density and temperature gradients
$16\,\textrm {MW}$
of heating power, which were run during experiments performed by Maggi et al. (Reference Maggi2015, Reference Maggi2017). For each set of pedestal profiles, simulations were run with the normalised density and temperature gradients $R/L_{n_e}$
and
$R/L_{n_e}$
and $R/L_{T_e}$
scanned around their nominal experimental values (Chapman-Oplopoiou et al. Reference Chapman-Oplopoiou2022).
$R/L_{T_e}$
scanned around their nominal experimental values (Chapman-Oplopoiou et al. Reference Chapman-Oplopoiou2022).
It was found that by defining $Q_{e}^\star \equiv q_e/q_{e,MgB}$
in terms of the local
$Q_{e}^\star \equiv q_e/q_{e,MgB}$
in terms of the local $L_{T_e}$
rather than the major radius
$L_{T_e}$
rather than the major radius $R$
, the
$R$
, the $q_e$
data from all four gradient scans could be fitted approximately by the same
$q_e$
data from all four gradient scans could be fitted approximately by the same $Q_{e}^\star (\eta _e)$
scaling
$Q_{e}^\star (\eta _e)$
scaling
 \begin{align} Q_{e}^\star = \alpha (\eta _e - \eta _{e,cr})^\beta, \end{align}
where $\alpha = 0.85$
,
$\alpha = 0.85$
, $\eta _{e,cr} = 1.28$
and
$\eta _{e,cr} = 1.28$
and $\beta = 1.43$
. Here, the threshold
$\beta = 1.43$
. Here, the threshold $\eta _{e,cr}$
is somewhat higher than the linear threshold of 0.8 found, e.g. in Jenko, Dorland & Hammett (Reference Jenko, Dorland and Hammett2001) for ETG turbulence.
$\eta _{e,cr}$
is somewhat higher than the linear threshold of 0.8 found, e.g. in Jenko, Dorland & Hammett (Reference Jenko, Dorland and Hammett2001) for ETG turbulence.
The heat-flux scaling of (2.1) is used as the basis for the numerical model described in Field et al. (Reference Field, Chapman-Oplopoiou, Connor, Frassinetti, Hatch, Roach and Saarelma2023). Note that it is similar to the electron heat-flux scaling found by Guttenfelder et al. (Reference Guttenfelder, Groebner, Canik, Grierson, Belli and Candy2021) from a set of nonlinear GK simulations using the CGYRO code (Candy, Belli & Bravenec Reference Candy, Belli and Bravenec2016) for the steep-density gradient region of a set of DIII-D pedestals, which is also used for numerical calculation of the pedestal $T_e$
profile, as described in Guttenfelder et al. (Reference Guttenfelder, Groebner, Canik, Grierson, Belli and Candy2021).
$T_e$
profile, as described in Guttenfelder et al. (Reference Guttenfelder, Groebner, Canik, Grierson, Belli and Candy2021).
Numerical calculation of the pedestal $T_e$
profile is performed as follows: first, by assuming a linear form of (2.1), i.e. with
$T_e$
profile is performed as follows: first, by assuming a linear form of (2.1), i.e. with $\beta = 1$
, it can be expressed in the form of the cubic polynomial in
$\beta = 1$
, it can be expressed in the form of the cubic polynomial in $R/L_{T_e}$
 \begin{align} (R/L_{n_e})^{-1}(R/L_{T_e})^3 - \eta _{e,cr}\,(R/L_{T_e})^2 - q_e/(\alpha q_{e,gB}) = 0, \end{align}
which can be solved for $R/L_{T_e}$
at any flux surface given values of
$R/L_{T_e}$
at any flux surface given values of $q_e, T_e$
, the magnetic field
$q_e, T_e$
, the magnetic field $B$
and
$B$
and $n_e$
and
$n_e$
and $R/L_{n_e}$
. This solution then provides an initial estimate of
$R/L_{n_e}$
. This solution then provides an initial estimate of $R/L_{T_e}$
, which is subsequently used to perform a more accurate, numerical solution of the nonlinear form of the heat-flux scaling described by (2.1) with
$R/L_{T_e}$
, which is subsequently used to perform a more accurate, numerical solution of the nonlinear form of the heat-flux scaling described by (2.1) with $\beta = 1.43$
. The electron heat flux
$\beta = 1.43$
. The electron heat flux $q_e$
is determined from
$q_e$
is determined from $q_e = P_{e,sep}/S$
, where
$q_e = P_{e,sep}/S$
, where $P_{e,sep}$
is the loss power conducted across the pedestal by the electrons and
$P_{e,sep}$
is the loss power conducted across the pedestal by the electrons and $S$
is the area of the LCFS. The
$S$
is the area of the LCFS. The $T_e$
profile across the pedestal is calculated by applying the above method to solve for
$T_e$
profile across the pedestal is calculated by applying the above method to solve for $R/L_{T_e}$
iteratively, starting at the separatrix, where
$R/L_{T_e}$
iteratively, starting at the separatrix, where $T_e = T_{e,sep}$
, using the prescribed, fitted experimental density profile to provide
$T_e = T_{e,sep}$
, using the prescribed, fitted experimental density profile to provide $n_e$
and
$n_e$
and $R/L_{n_e}$
and taking
$R/L_{n_e}$
and taking $T_e$
from the previous iteration step. A more detailed explanation of the numerical algorithm can be found in Field et al. (Reference Field, Chapman-Oplopoiou, Connor, Frassinetti, Hatch, Roach and Saarelma2023).
$T_e$
from the previous iteration step. A more detailed explanation of the numerical algorithm can be found in Field et al. (Reference Field, Chapman-Oplopoiou, Connor, Frassinetti, Hatch, Roach and Saarelma2023).
3. Experimental data set and data preparation
3.1. Isotope mix and gas fuelling rate scans at constant
$\beta _N$

The experimental data set used for this comparison is from a series of type-I ELMy H-mode plasmas, i.e. plasmas with type-I Edge-Localised Modes, with plasma current $I_p = 2\,\textrm {MA}$
at a toroidal field
$I_p = 2\,\textrm {MA}$
at a toroidal field $B_t = 2.25\,\textrm {T}$
in JET-Be/W, over which the effective mass
$B_t = 2.25\,\textrm {T}$
in JET-Be/W, over which the effective mass $A_{\textit{eff}}$
was scanned from pure deuterium (D) to pure tritium (T) (Frassinetti et al. Reference Frassinetti2023). The equilibrium configuration positioned the inner strike point on the vertical target and outer strike point on the horizontal target with a plasma cross-section of low average triangularity (
$A_{\textit{eff}}$
was scanned from pure deuterium (D) to pure tritium (T) (Frassinetti et al. Reference Frassinetti2023). The equilibrium configuration positioned the inner strike point on the vertical target and outer strike point on the horizontal target with a plasma cross-section of low average triangularity ( $\delta \sim 0.24$
).
$\delta \sim 0.24$
).
Over the scan, the key parameters that affect the pedestal behaviour (normalised pressure $\beta _N \sim 1.5$
, ratio of the separatrix density to the pedestal density
$\beta _N \sim 1.5$
, ratio of the separatrix density to the pedestal density $n_{e,sep}/n_{e,ped}$
, pedestal ion Larmor radius
$n_{e,sep}/n_{e,ped}$
, pedestal ion Larmor radius $\rho _i \sim 2.1{-}2.3 \times 10^{-3}$
, pedestal electron collisionality
$\rho _i \sim 2.1{-}2.3 \times 10^{-3}$
, pedestal electron collisionality $\nu ^\star _e \propto n_e/T_e^2$
and toroidal rotation rate
$\nu ^\star _e \propto n_e/T_e^2$
and toroidal rotation rate $\varOmega ^{ped}_\phi$
) were kept as constant as possible. Feedback control of the neutral beam injection (NBI) heating power was used to maintain
$\varOmega ^{ped}_\phi$
) were kept as constant as possible. Feedback control of the neutral beam injection (NBI) heating power was used to maintain $\beta _N \sim 1.44-1.58$
, while the ion-cyclotron-resonance (ICRH) heating was maintained at
$\beta _N \sim 1.44-1.58$
, while the ion-cyclotron-resonance (ICRH) heating was maintained at $2\,\textrm {MW}$
. It was not possible to maintain a constant value of pedestal collisionality
$2\,\textrm {MW}$
. It was not possible to maintain a constant value of pedestal collisionality $\nu ^\star _e$
, which varied from
$\nu ^\star _e$
, which varied from ${\sim} 0.8$
in D to
${\sim} 0.8$
in D to ${\sim} 1.8$
in T (Frassinetti et al. Reference Frassinetti2023).
${\sim} 1.8$
in T (Frassinetti et al. Reference Frassinetti2023).
The $A_{\textit{eff}}$
scan, comprising six pulses (two in pure D, three in mixed D and T and one in pure T), was performed at a gas fuelling rate
$A_{\textit{eff}}$
scan, comprising six pulses (two in pure D, three in mixed D and T and one in pure T), was performed at a gas fuelling rate $\varGamma _{gas} \sim 1.7 \times 10^{22}\,\textrm{es}^{-1}$
, injected from divertor. In all pulses, a small H concentration (
$\varGamma _{gas} \sim 1.7 \times 10^{22}\,\textrm{es}^{-1}$
, injected from divertor. In all pulses, a small H concentration ( $c_H \sim 1\,\%$
) was used for the minority ICRH heating. At this fuelling rate, the ratio of density at the separatrix to that at the pedestal top was maintained at
$c_H \sim 1\,\%$
) was used for the minority ICRH heating. At this fuelling rate, the ratio of density at the separatrix to that at the pedestal top was maintained at $n_{e,sep}/n_{e,ped} \sim 0.5$
.
$n_{e,sep}/n_{e,ped} \sim 0.5$
.
In order to investigate the role of the ELM frequency $f_{ELM}$
on the pedestal structure, in particular the density ratio
$f_{ELM}$
on the pedestal structure, in particular the density ratio $n_{e,sep}/n_{e,ped}$
, further pulses (referred to as the ‘extended data set’ in Frassinetti et al. (Reference Frassinetti2023)) were run at higher and lower gas fuelling rates (two in D and two in T), the higher gas rate promoting more frequent ELMs. The importance of
$n_{e,sep}/n_{e,ped}$
, further pulses (referred to as the ‘extended data set’ in Frassinetti et al. (Reference Frassinetti2023)) were run at higher and lower gas fuelling rates (two in D and two in T), the higher gas rate promoting more frequent ELMs. The importance of $n_{e,sep}/n_{e,ped}$
in determining the cross-pedestal transport is discussed in detail in Frassinetti et al. (Reference Frassinetti2021). The parameters of the full set of pulses used for this study are summarised in table 1 of Appendix A.
$n_{e,sep}/n_{e,ped}$
in determining the cross-pedestal transport is discussed in detail in Frassinetti et al. (Reference Frassinetti2021). The parameters of the full set of pulses used for this study are summarised in table 1 of Appendix A.
3.2. Input data and data preparation
Required inputs for calculation of the pedestal $T_e$
profile using the model described in § 2 are: the nominal toroidal magnetic field
$T_e$
profile using the model described in § 2 are: the nominal toroidal magnetic field $B_t$
, the separatrix loss power during the inter-ELM periods
$B_t$
, the separatrix loss power during the inter-ELM periods $P_{sep}^{iELM}$
and the fraction of this power carried by the electrons
$P_{sep}^{iELM}$
and the fraction of this power carried by the electrons $f_{cnd,e}$
and the measured
$f_{cnd,e}$
and the measured $n_e$
profile across the pedestal, together with the corresponding
$n_e$
profile across the pedestal, together with the corresponding $T_e$
profile for comparison with the predicted profile.
$T_e$
profile for comparison with the predicted profile.
The pre-ELM, pedestal kinetic profiles used for these comparisons are fits of $\mathrm{mtanh()}$
functions (Groebner et al. Reference Groebner2001) to an ensemble of
$\mathrm{mtanh()}$
functions (Groebner et al. Reference Groebner2001) to an ensemble of $n_e$
and
$n_e$
and $T_e$
profile data measured by the JET-Be/W high-resolution Thomson scattering (HRTS) system (Pasqualotto et al. Reference Pasqualotto, Nielsen, Gowers, Beurskens, Kempenaars, Carlstrom and Johnson2004). The finite spatial resolution of the HRTS measurements is taken into account in the fitting procedure as described in Frassinetti et al. (Reference Frassinetti2012). The ensemble of measurements are for HRTS laser pulses (with
$T_e$
profile data measured by the JET-Be/W high-resolution Thomson scattering (HRTS) system (Pasqualotto et al. Reference Pasqualotto, Nielsen, Gowers, Beurskens, Kempenaars, Carlstrom and Johnson2004). The finite spatial resolution of the HRTS measurements is taken into account in the fitting procedure as described in Frassinetti et al. (Reference Frassinetti2012). The ensemble of measurements are for HRTS laser pulses (with $50\,\textrm {ms}$
) repetition rate) that fall within the last
$50\,\textrm {ms}$
) repetition rate) that fall within the last $20\,\%$
of the ELM cycle, i.e. the fraction 0.8–1.0 of the relative inter-ELM period
$20\,\%$
of the ELM cycle, i.e. the fraction 0.8–1.0 of the relative inter-ELM period $\tau _{ELM}$
, which occurs during the averaging time windows
$\tau _{ELM}$
, which occurs during the averaging time windows $t_0-t_1$
specified in table 1.
$t_0-t_1$
specified in table 1.
The resulting fitted profiles and the measured profile data are stored, together with the parameters of the $\mathrm{mtanh()}$
fits and their uncertainties, in the JET processed-pulse files (PPFs), also specified in table 1. These files form a subset of the JET-processed, EUROfusion Pedestal Database (Frassinetti et al. Reference Frassinetti2021). The fitted profiles, e.g. as shown in figure 1(a–c) are reconstructed from the parameters of the
$\mathrm{mtanh()}$
fits and their uncertainties, in the JET processed-pulse files (PPFs), also specified in table 1. These files form a subset of the JET-processed, EUROfusion Pedestal Database (Frassinetti et al. Reference Frassinetti2021). The fitted profiles, e.g. as shown in figure 1(a–c) are reconstructed from the parameters of the $\mathrm{mtanh()}$
function using a Monte Carlo method to calculate uncertainties on the profiles and also on the derived gradient parameters
$\mathrm{mtanh()}$
function using a Monte Carlo method to calculate uncertainties on the profiles and also on the derived gradient parameters $R/L_{T_e}$
,
$R/L_{T_e}$
, $R/L_{n_e}$
and
$R/L_{n_e}$
and $\eta _e$
. In order to set the temperature at the separatrix
$\eta _e$
. In order to set the temperature at the separatrix $T_{e,sep}$
at a prescribed value, the
$T_{e,sep}$
at a prescribed value, the $T_e$
profiles are shifted radially in
$T_e$
profiles are shifted radially in $\psi _N$
, with the same shift applied to the
$\psi _N$
, with the same shift applied to the $n_e$
and
$n_e$
and $p_e$
profiles.
$p_e$
profiles.

Figure 1.
Pre-ELM averaged ( ${\sim} 80\,\% \;\, \text{to}\; 100\,\%$
of the inter-ELM period) pedestal profiles for three
${\sim} 80\,\% \;\, \text{to}\; 100\,\%$
of the inter-ELM period) pedestal profiles for three $2\,\textrm {MA}$
JET-Be/W H-mode pulses in pure D (no. 99208, blue), pure T (no. 100247, gold) and a D:T isotope mixture with an effective mass
$2\,\textrm {MA}$
JET-Be/W H-mode pulses in pure D (no. 99208, blue), pure T (no. 100247, gold) and a D:T isotope mixture with an effective mass $A_{\textit{eff}} \sim 2.4$
(no. 99491(a), magenta) at a nominal hydrogenic gas fuelling rate of
$A_{\textit{eff}} \sim 2.4$
(no. 99491(a), magenta) at a nominal hydrogenic gas fuelling rate of $\varGamma _{gas} \sim 1.6 \times 10^{22}\,\mathrm{es}^{-1}$
, with other pulse parameters given in table
1
, showing: (a) electron temperature
$\varGamma _{gas} \sim 1.6 \times 10^{22}\,\mathrm{es}^{-1}$
, with other pulse parameters given in table
1
, showing: (a) electron temperature $T_e$
, (b) density
$T_e$
, (b) density $n_e$
, (c) pressure
$n_e$
, (c) pressure $p_e$
, their normalised gradients (d)
$p_e$
, their normalised gradients (d) $R/L_{T_e}$
, (e)
$R/L_{T_e}$
, (e) $R/L_{n_e}$
and (f) the parameter
$R/L_{n_e}$
and (f) the parameter $\eta _e$
(solid/dashed) and the locally gyro-Bohm normalised electron heat flux
$\eta _e$
(solid/dashed) and the locally gyro-Bohm normalised electron heat flux $Q_{e}^\star$
(dotted) vs normalised poloidal flux
$Q_{e}^\star$
(dotted) vs normalised poloidal flux $\psi _N$
. In (a–c), input profiles from the EUROfusion pedestal database are shown by the solid lines with error bars; in (a) the
$\psi _N$
. In (a–c), input profiles from the EUROfusion pedestal database are shown by the solid lines with error bars; in (a) the $T_e$
profile calculated using the ETG model is shown by the dashed lines, while
$T_e$
profile calculated using the ETG model is shown by the dashed lines, while $\mathrm{mtanh()}$
fits to these profiles are shown by dotted lines (note that the fits overlay the calculated
$\mathrm{mtanh()}$
fits to these profiles are shown by dotted lines (note that the fits overlay the calculated $T_e$
profiles, resulting in the dot-dashed lines); in (c, d & f) profiles of derived quantities (
$T_e$
profiles, resulting in the dot-dashed lines); in (c, d & f) profiles of derived quantities ( $p_e$
,
$p_e$
, $R/L_{T_e}$
and
$R/L_{T_e}$
and $\eta _e$
), calculated using the
$\eta _e$
), calculated using the $T_e$
profile from the ETG model are shown by the dashed lines. The ♦ symbols indicate the ‘mid-pedestal’ positions.
$T_e$
profile from the ETG model are shown by the dashed lines. The ♦ symbols indicate the ‘mid-pedestal’ positions.
The separatrix temperature is a rather ‘stiff’ parameter, scaling approximately as $T_{e,sep} \propto P_{e,sep}^{2/7}$
(Stangeby Reference Stangeby2000) and is found, e.g. from calculations using a Scrape-off-Layer (SOL) model to vary only within a rather limited range of
$T_{e,sep} \propto P_{e,sep}^{2/7}$
(Stangeby Reference Stangeby2000) and is found, e.g. from calculations using a Scrape-off-Layer (SOL) model to vary only within a rather limited range of $80-110\,\textrm {eV}$
on JET-Be/W for a wide range of
$80-110\,\textrm {eV}$
on JET-Be/W for a wide range of $P_{e,sep}$
(Simpson et al. Reference Simpson, Moulton, Giroud, Groth, Corrigan and Contributors2019). Hence, the fixed value of
$P_{e,sep}$
(Simpson et al. Reference Simpson, Moulton, Giroud, Groth, Corrigan and Contributors2019). Hence, the fixed value of $T_{e,sep} = 100\,\textrm {eV}$
is assumed for all of the cases considered here.
$T_{e,sep} = 100\,\textrm {eV}$
is assumed for all of the cases considered here.
Calculation of the time-averaged, conducted loss power across the pedestal during the inter-ELM periods $P_{sep}^{iELM}$
requires subtracting the radiated power from the confined plasma
$P_{sep}^{iELM}$
requires subtracting the radiated power from the confined plasma $P_{Rad}^{iELM}$
and the time-averaged ELM loss power
$P_{Rad}^{iELM}$
and the time-averaged ELM loss power $\left \langle P_{ELM} \right \rangle$
from the absorbed heating power
$\left \langle P_{ELM} \right \rangle$
from the absorbed heating power $P_{abs}$
i.e.
$P_{abs}$
i.e. $P_{sep}^{iELM} = P_{abs} - P_{Rad}^{iELM} - \left \langle P_{ELM} \right \rangle$
. Here, the absorbed heating power
$P_{sep}^{iELM} = P_{abs} - P_{Rad}^{iELM} - \left \langle P_{ELM} \right \rangle$
. Here, the absorbed heating power $P_{abs}$
is the sum of the injected NBI power, the ICRH heating power and the ohmic power minus the shine-through power
$P_{abs}$
is the sum of the injected NBI power, the ICRH heating power and the ohmic power minus the shine-through power $P_{abs} = P_{NB} + P_{RF} + P_{OH} - P_{sh}$
; the radiated power
$P_{abs} = P_{NB} + P_{RF} + P_{OH} - P_{sh}$
; the radiated power $P_{Rad}^{iELM}$
is determined from tomographic reconstructions of multi-channel bolometric measurements of the total radiation and the ELM loss power from the rate of change of the total stored energy of the plasma
$P_{Rad}^{iELM}$
is determined from tomographic reconstructions of multi-channel bolometric measurements of the total radiation and the ELM loss power from the rate of change of the total stored energy of the plasma $\text{d}W_{pl}/\text{d}t$
between the ELMs determined from magnetic equilibrium reconstructions. The methodology of this analysis of the loss power is exactly the same as used in Field et al. (Reference Field2020), to which the reader is referred for further details.
$\text{d}W_{pl}/\text{d}t$
between the ELMs determined from magnetic equilibrium reconstructions. The methodology of this analysis of the loss power is exactly the same as used in Field et al. (Reference Field2020), to which the reader is referred for further details.
The results presented here have been calculated assuming that the total heat flux conducted across the pedestal during the inter-ELM periods $q_{cond} = P_{sep}^{iELM}/S$
, where
$q_{cond} = P_{sep}^{iELM}/S$
, where $S$
is the area of the LCFS, is carried by the electrons, i.e.
$S$
is the area of the LCFS, is carried by the electrons, i.e. $f_{cnd,e} = 1$
. For the JET-Be/W equilibria used here, the area of the LCFS formed by the separatrix
$f_{cnd,e} = 1$
. For the JET-Be/W equilibria used here, the area of the LCFS formed by the separatrix $S \sim 140\,\textrm {m}^{2}$
. Calculated values of
$S \sim 140\,\textrm {m}^{2}$
. Calculated values of $P_{abs}$
,
$P_{abs}$
, $P_{Rad}^{iELM}$
,
$P_{Rad}^{iELM}$
, $\left \langle P_{ELM} \right \rangle$
and the resulting
$\left \langle P_{ELM} \right \rangle$
and the resulting $P_{sep}^{iELM}$
are given for each of the cases in table 1. It is interesting to note that, while the variation of heating power
$P_{sep}^{iELM}$
are given for each of the cases in table 1. It is interesting to note that, while the variation of heating power $P_{abs}$
required to maintain constant
$P_{abs}$
required to maintain constant $\beta _N$
is quite small, i.e.
$\beta _N$
is quite small, i.e. ${\sim} 12{-}18\,\textrm {MW}\ (\pm 20\,\%)$
, the ranges of
${\sim} 12{-}18\,\textrm {MW}\ (\pm 20\,\%)$
, the ranges of $P_{Rad}^{iELM} \sim 3{-}7\,\textrm {MW}\ (\pm 40\,\%)$
) and
$P_{Rad}^{iELM} \sim 3{-}7\,\textrm {MW}\ (\pm 40\,\%)$
) and $\left \langle P_{ELM} \right \rangle \sim 0.5{-}9\,\textrm {MW}\ (\sim \pm 50\,\%)$
) are much larger and roughly compensate one another, resulting in a smaller variation of
$\left \langle P_{ELM} \right \rangle \sim 0.5{-}9\,\textrm {MW}\ (\sim \pm 50\,\%)$
) are much larger and roughly compensate one another, resulting in a smaller variation of $P_{sep}^{iELM} \sim 5{-}8\,\textrm {MW}\ (\sim \pm 33\,\%)$
.
$P_{sep}^{iELM} \sim 5{-}8\,\textrm {MW}\ (\sim \pm 33\,\%)$
.
Note that the predicted pedestal temperature from the model scales approximately as $(T_{e,ped}^{ETG} \propto (P_{sep}^{iELM} B_t^2)^{1/3}$
, so is rather insensitive to the loss power, i.e.
$(T_{e,ped}^{ETG} \propto (P_{sep}^{iELM} B_t^2)^{1/3}$
, so is rather insensitive to the loss power, i.e. $\delta T_{e,sep}/T_{e,sep} \sim (\delta P/P)/3$
. It has been found that
$\delta T_{e,sep}/T_{e,sep} \sim (\delta P/P)/3$
. It has been found that $T_{e,ped}$
is much more sensitive to other input parameters, in particular the assumed temperature at the separatrix
$T_{e,ped}$
is much more sensitive to other input parameters, in particular the assumed temperature at the separatrix $T_{e,sep}$
and the nonlinear threshold
$T_{e,sep}$
and the nonlinear threshold $\eta _{e,cr}$
of the assumed ETG heat-flux scaling. Hence, uncertainties in
$\eta _{e,cr}$
of the assumed ETG heat-flux scaling. Hence, uncertainties in $P_{sep}^{iELM}$
are not quoted in table 1 or propagated to give uncertainties on the predicted
$P_{sep}^{iELM}$
are not quoted in table 1 or propagated to give uncertainties on the predicted $T_{e,ped}^{ETG}$
.
$T_{e,ped}^{ETG}$
.
4. Comparisons of predicted and measured
$T_e$
profiles

A comparison of the measured pedestal profiles for cases in pure D and T and an mixed D:T case with $A_{\textit{eff}} \sim 2.4$
at the same gas fuelling rate of
$A_{\textit{eff}} \sim 2.4$
at the same gas fuelling rate of $\varGamma _{gas} \sim 1.6 \times 10^{22}\,\mathrm{es}^{-1}$
is shown in figure 1(a–c) (solid), from which it can be seen that the pedestal density
$\varGamma _{gas} \sim 1.6 \times 10^{22}\,\mathrm{es}^{-1}$
is shown in figure 1(a–c) (solid), from which it can be seen that the pedestal density $n_{e,ped}$
increases with
$n_{e,ped}$
increases with $A_{\textit{eff}}$
, while the temperature
$A_{\textit{eff}}$
, while the temperature $T_{e,ped}$
only slightly decreases with
$T_{e,ped}$
only slightly decreases with $A_{\textit{eff}}$
, resulting in an overall increase in
$A_{\textit{eff}}$
, resulting in an overall increase in $p_{e,ped}$
, as is discussed in Frassinetti et al. (Reference Frassinetti2023). This result is also consistent with other isotope mass scans in JET-Be/W, e.g. as reported in Schneider et al. (Reference Schneider2023).
$p_{e,ped}$
, as is discussed in Frassinetti et al. (Reference Frassinetti2023). This result is also consistent with other isotope mass scans in JET-Be/W, e.g. as reported in Schneider et al. (Reference Schneider2023).
Both the normalised temperature and density gradients increase strongly with radius to values $\mathcal O \textrm {(100)}$
at the separatrix from much lower values
$\mathcal O \textrm {(100)}$
at the separatrix from much lower values $R/L_{T_e} \sim \mathcal O \textrm {(10)}$
and
$R/L_{T_e} \sim \mathcal O \textrm {(10)}$
and $R/L_{n_e} \sim \mathcal O \textrm {(1)}$
inside the pedestal top. In the steep-density gradient region close to the separatrix, the parameter
$R/L_{n_e} \sim \mathcal O \textrm {(1)}$
inside the pedestal top. In the steep-density gradient region close to the separatrix, the parameter $\eta _e$
has a value
$\eta _e$
has a value ${\sim} 2$
, increasing strongly at and inside the density pedestal top, where the
${\sim} 2$
, increasing strongly at and inside the density pedestal top, where the $n_e$
gradient is weak.
$n_e$
gradient is weak.
For this data set, which is based on performing $\mathrm{mtanh()}$
fits to the HRTS data only, as well as
$\mathrm{mtanh()}$
fits to the HRTS data only, as well as $n_{e,ped}$
increasing, the width of the density pedestal also increases and shifts inwards with increasing effective mass
$n_{e,ped}$
increasing, the width of the density pedestal also increases and shifts inwards with increasing effective mass $A_{\textit{eff}}$
. However, it should be noted that the pedestal profile data presented in Frassinetti et al. (Reference Frassinetti2023) were obtained by fitting a revised form of the
$A_{\textit{eff}}$
. However, it should be noted that the pedestal profile data presented in Frassinetti et al. (Reference Frassinetti2023) were obtained by fitting a revised form of the $\mathrm{mtanh()}$
function (Frassinetti et al. Reference Frassinetti2016) also incorporating a finite slope in the outer, low-field-side SOL region as well in as the core, high-field-side region of the pedestal to
$\mathrm{mtanh()}$
function (Frassinetti et al. Reference Frassinetti2016) also incorporating a finite slope in the outer, low-field-side SOL region as well in as the core, high-field-side region of the pedestal to $n_e$
profile data obtained by combining that from both the HRTS and the Li-beam diagnostic (Réfy et al. Reference Réfy, Brix, Gomes, Tál, Zoletnik, Dunai, Kocsis, Kálvin and Szabolics2018), as described in Frassinetti et al. (Reference Frassinetti2016).
$n_e$
profile data obtained by combining that from both the HRTS and the Li-beam diagnostic (Réfy et al. Reference Réfy, Brix, Gomes, Tál, Zoletnik, Dunai, Kocsis, Kálvin and Szabolics2018), as described in Frassinetti et al. (Reference Frassinetti2016).
The Li-beam provides more detailed, reliable $n_e$
measurements than available from the HRTS system over the SOL region, where the scattered signal is weak. This change primarily affects the fits in the SOL region, in particular for the cases at high gas fuelling rates, for which the outward relative shift of the
$n_e$
measurements than available from the HRTS system over the SOL region, where the scattered signal is weak. This change primarily affects the fits in the SOL region, in particular for the cases at high gas fuelling rates, for which the outward relative shift of the $n_e$
profile is largest, decreasing the fitted pedestal width
$n_e$
profile is largest, decreasing the fitted pedestal width $\varDelta _{n_e}$
and slightly increasing the
$\varDelta _{n_e}$
and slightly increasing the $n_e$
gradient inside the separatrix in comparison with the values obtained with the standard
$n_e$
gradient inside the separatrix in comparison with the values obtained with the standard $\mathrm{mtanh()}$
fit. For this reason, the reader is referred to Frassinetti et al. (Reference Frassinetti2023) for definitive statements regarding the dependence of the pedestal structure on
$\mathrm{mtanh()}$
fit. For this reason, the reader is referred to Frassinetti et al. (Reference Frassinetti2023) for definitive statements regarding the dependence of the pedestal structure on $A_{\textit{eff}}$
.
$A_{\textit{eff}}$
.
The density at the separatrix $n_{e,sep}$
varies similarly to
$n_{e,sep}$
varies similarly to $n_{e,ped}$
with
$n_{e,ped}$
with $A_{\textit{eff}}$
, so the density ratio
$A_{\textit{eff}}$
, so the density ratio $n_{e,sep}/n_{e,ped}$
remains approximately constant. These trends are also plotted explicitly for the full data set in figure 2, in which the colour scale represents the gas fuelling rate
$n_{e,sep}/n_{e,ped}$
remains approximately constant. These trends are also plotted explicitly for the full data set in figure 2, in which the colour scale represents the gas fuelling rate $\varGamma _{gas}$
.
$\varGamma _{gas}$
.

Figure 2.
Calculated and measured pedestal parameters corresponding to the cases for the isotope mix and fuelling rate scans for the $2\,\textrm {MA}$
H-mode pulses listed in table
1
, showing: (a)
$2\,\textrm {MA}$
H-mode pulses listed in table
1
, showing: (a) $T_{e,ped}$
from the
$T_{e,ped}$
from the $\mathrm{mtanh()}$
fit (●) and
$\mathrm{mtanh()}$
fit (●) and $T_e$
at the location of the density pedestal top
$T_e$
at the location of the density pedestal top $T_e(\psi _N^{n_{e,top}})$
(×), both calculated using the ETG model, vs the equivalent experimental values (calculated values of
$T_e(\psi _N^{n_{e,top}})$
(×), both calculated using the ETG model, vs the equivalent experimental values (calculated values of $T_e$
at factors of 1.5 and 2 higher/lower than the measured values are represented by the dotted and dot-dashed lines respectively); (b)
$T_e$
at factors of 1.5 and 2 higher/lower than the measured values are represented by the dotted and dot-dashed lines respectively); (b) $n_{e,ped}$
(●) and
$n_{e,ped}$
(●) and $n_{e,sep}$
(×) vs the effective isotope mass ratio
$n_{e,sep}$
(×) vs the effective isotope mass ratio $A_{\textit{eff}}$
; (c) the ratios of
$A_{\textit{eff}}$
; (c) the ratios of $T_e$
calculated using the ETG model to the measured values at
$T_e$
calculated using the ETG model to the measured values at $\psi _N^{T_{e,top}}$
(●) and at
$\psi _N^{T_{e,top}}$
(●) and at $\psi _N^{n_{e,top}}$
(×); and (d) the separatrix to pedestal density ratio
$\psi _N^{n_{e,top}}$
(×); and (d) the separatrix to pedestal density ratio $n_{e,sep}/n_{e,ped}$
vs
$n_{e,sep}/n_{e,ped}$
vs $A_{\textit{eff}}$
, where the colour represents the gas fuelling rate
$A_{\textit{eff}}$
, where the colour represents the gas fuelling rate $\varGamma _{gas}\,\mathrm{es}^{-1}$
.
$\varGamma _{gas}\,\mathrm{es}^{-1}$
.
The predicted $T_e$
and
$T_e$
and $p_e$
profiles, calculated using the ETG model described in § 2 are shown in figures 1(a) and 1(c) (dashed). Comparing the measured and predicted profiles, it can be seen that these match well in the steep-density gradient region between the separatrix and the density pedestal top, while further inwards, where the density gradient is weak and
$p_e$
profiles, calculated using the ETG model described in § 2 are shown in figures 1(a) and 1(c) (dashed). Comparing the measured and predicted profiles, it can be seen that these match well in the steep-density gradient region between the separatrix and the density pedestal top, while further inwards, where the density gradient is weak and $\eta _e$
is large, the predicted
$\eta _e$
is large, the predicted $T_e$
under-predicts the actual value.
$T_e$
under-predicts the actual value.
At the mid-pedestal location, half-way between the density pedestal top and the separatrix (indicated in the figure by the ♦), for which the heat-flux scaling of (2.1) was determined from the nonlinear GENE simulation results, the predicted value of $R/L_{T_e}$
closely matches the actual value, while further outwards
$R/L_{T_e}$
closely matches the actual value, while further outwards $R/L_{T_e}$
is over-predicted and under-predicted further inwards. In other words, the electron heat flux
$R/L_{T_e}$
is over-predicted and under-predicted further inwards. In other words, the electron heat flux $q_e$
determined from the
$q_e$
determined from the $Q_{e}^\star$
scaling is too high inside the mid-pedestal location and too low further outwards, requiring too low and too high a temperature gradient
$Q_{e}^\star$
scaling is too high inside the mid-pedestal location and too low further outwards, requiring too low and too high a temperature gradient $T_e'$
to match the prescribed
$T_e'$
to match the prescribed $q_e$
.
$q_e$
.
In figure 2(a), the predicted pedestal temperature $T_{e,ped}^{ETG}$
(indicated by the ●) is plotted as a function of the measured
$T_{e,ped}^{ETG}$
(indicated by the ●) is plotted as a function of the measured $T_{e,ped}$
for the full data set from both the effective mass and gas rate scans. From this, it is evident that, for most but not all cases, the model under-predicts
$T_{e,ped}$
for the full data set from both the effective mass and gas rate scans. From this, it is evident that, for most but not all cases, the model under-predicts $T_{e,ped}$
compared with the measured values, in some cases by over a factor
$T_{e,ped}$
compared with the measured values, in some cases by over a factor ${\sim} 2$
. The degree of agreement appears to be independent of the particular gas fuelling rate
${\sim} 2$
. The degree of agreement appears to be independent of the particular gas fuelling rate $\varGamma _{gas}$
used.
$\varGamma _{gas}$
used.
The position of the $T_e$
pedestal top
$T_e$
pedestal top $\psi _N^{T_{e,top}}$
is generally located further inwards to that of the density pedestal top
$\psi _N^{T_{e,top}}$
is generally located further inwards to that of the density pedestal top $\psi _N^{n_{e,top}}$
, i.e. there is a relative inward shift of the
$\psi _N^{n_{e,top}}$
, i.e. there is a relative inward shift of the $T_e$
profile,
$T_e$
profile, $\delta _{n-T} = \psi _N^{n_{e,top}} - \psi _N^{T_{e,top}}$
, which has been well documented in previous studies (Frassinetti et al. Reference Frassinetti2021) and found to be well correlated with the increasing density ratio
$\delta _{n-T} = \psi _N^{n_{e,top}} - \psi _N^{T_{e,top}}$
, which has been well documented in previous studies (Frassinetti et al. Reference Frassinetti2021) and found to be well correlated with the increasing density ratio $n_{e,sep}/n_{e,ped}$
resulting from higher rates of gas fuelling. A consequence of this inward shift of the
$n_{e,sep}/n_{e,ped}$
resulting from higher rates of gas fuelling. A consequence of this inward shift of the $T_e$
pedestal top relative to that of the density is that an increasing portion of the
$T_e$
pedestal top relative to that of the density is that an increasing portion of the $T_e$
pedestal is coincident with the region of weak-density gradient inside the density pedestal top, i.e. in this inner region of the pedestal
$T_e$
pedestal is coincident with the region of weak-density gradient inside the density pedestal top, i.e. in this inner region of the pedestal $R/L_{T_e}$
well exceeds
$R/L_{T_e}$
well exceeds $R/L_{n_e}$
and
$R/L_{n_e}$
and $\eta _e$
is consequently large.
$\eta _e$
is consequently large.
It is sometimes stated as an explanation of the lower $T_{e,ped}$
resulting from the relatively high gas fuelling rates for sustained, high-power operation on JET-Be/W (Giroud et al. Reference Giroud2013), that the resulting higher values of
$T_{e,ped}$
resulting from the relatively high gas fuelling rates for sustained, high-power operation on JET-Be/W (Giroud et al. Reference Giroud2013), that the resulting higher values of $\eta _e$
across the region of weak-density gradient at the pedestal top drives more turbulent heat transport and hence cools the pedestal (Frassinetti et al. Reference Frassinetti2019). However, the loss power conducted across the pedestal
$\eta _e$
across the region of weak-density gradient at the pedestal top drives more turbulent heat transport and hence cools the pedestal (Frassinetti et al. Reference Frassinetti2019). However, the loss power conducted across the pedestal $P_{e,sep}$
is prescribed, the
$P_{e,sep}$
is prescribed, the $T_e$
gradient at a particular location adjusting to drive the corresponding turbulent electron heat flux
$T_e$
gradient at a particular location adjusting to drive the corresponding turbulent electron heat flux $q_e$
. Furthermore, we learn from the above discussion that our
$q_e$
. Furthermore, we learn from the above discussion that our $Q_{e}^\star$
scaling for the electron heat flux determined for the steep-density gradient region actually over-predicts
$Q_{e}^\star$
scaling for the electron heat flux determined for the steep-density gradient region actually over-predicts $q_e$
in this region of weak-density gradient, so whatever branch of turbulence is prevalent there requires a higher rather than lower driving
$q_e$
in this region of weak-density gradient, so whatever branch of turbulence is prevalent there requires a higher rather than lower driving $T_e$
gradient to match the prescribed heat flux. This point is discussed further in § 5 below.
$T_e$
gradient to match the prescribed heat flux. This point is discussed further in § 5 below.
Values of the predicted $T_e$
at the location of the density pedestal top
$T_e$
at the location of the density pedestal top $T_e(\psi _N^{n_{e,top}})$
are also plotted (as the
$T_e(\psi _N^{n_{e,top}})$
are also plotted (as the $\times$
’s) in figure 2(a) as a function of the corresponding measured values at the same location. It is evident that there is a much better agreement between the model prediction and the measured values at this location than at the
$\times$
’s) in figure 2(a) as a function of the corresponding measured values at the same location. It is evident that there is a much better agreement between the model prediction and the measured values at this location than at the $T_e$
pedestal top, with only a slight over-prediction of
$T_e$
pedestal top, with only a slight over-prediction of $T_e(\psi _N^{n_{e,top}})$
by factor
$T_e(\psi _N^{n_{e,top}})$
by factor $\lesssim 1.2$
. This is to be expected because the
$\lesssim 1.2$
. This is to be expected because the $Q_{e}^\star$
scaling on which the model is based was determined from the nonlinear GENE simulations for the steep-density gradient and prediction of
$Q_{e}^\star$
scaling on which the model is based was determined from the nonlinear GENE simulations for the steep-density gradient and prediction of $T_e(\psi _N^{n_{e,top}})$
requires calculation of
$T_e(\psi _N^{n_{e,top}})$
requires calculation of $T_e$
over this region but not further inwards of the density pedestal top where the density gradient is weak.
$T_e$
over this region but not further inwards of the density pedestal top where the density gradient is weak.
The effect of increasing the gas fuelling rate $\varGamma _{gas}$
in both the pure D and pure T pulses is shown in figures 3 and 4, respectively. For the D pulses, increasing
$\varGamma _{gas}$
in both the pure D and pure T pulses is shown in figures 3 and 4, respectively. For the D pulses, increasing $\varGamma _{gas}$
by a factor of
$\varGamma _{gas}$
by a factor of ${\sim} 3.5$
results in only a small increase in
${\sim} 3.5$
results in only a small increase in $n_{e,ped}$
, i.e. the gas fuelling is rather inefficient at fuelling the confined plasma. In fact, the increased fuelling results in a higher ELM frequency and these then expel the additional particles deposited inside the separatrix at an increased rate, almost balancing the additional influx.
$n_{e,ped}$
, i.e. the gas fuelling is rather inefficient at fuelling the confined plasma. In fact, the increased fuelling results in a higher ELM frequency and these then expel the additional particles deposited inside the separatrix at an increased rate, almost balancing the additional influx.

Figure 3.
Pedestal profiles for the three $2\,\textrm {MA}$
JET-Be/W H-mode deuterium pulses (
$2\,\textrm {MA}$
JET-Be/W H-mode deuterium pulses ( $A_{\textit{eff}} = 2$
) from table
1
no. 96202 (cyan), no. 96208 (mid-blue) and no. 96201 (dark-blue) with gas fuelling rates of
$A_{\textit{eff}} = 2$
) from table
1
no. 96202 (cyan), no. 96208 (mid-blue) and no. 96201 (dark-blue) with gas fuelling rates of $\varGamma _{gas} \sim 0.74, 1.7\ \text{and}\ 2.7 \times 10^{22}\,\textrm{es}^{-1}$
, respectively, with the plotted quantities as defined in figure
1
.
$\varGamma _{gas} \sim 0.74, 1.7\ \text{and}\ 2.7 \times 10^{22}\,\textrm{es}^{-1}$
, respectively, with the plotted quantities as defined in figure
1
.

Figure 4.
Pedestal profiles for the three $2\,\textrm {MA}$
JET-Be/W H-mode tritium pulses (
$2\,\textrm {MA}$
JET-Be/W H-mode tritium pulses ( $A_{\textit{eff}} = 3$
) from table
1
no. 100185 (pink), no. 100247 (magenta) and no. 100183 (purple) with gas fuelling rates of
$A_{\textit{eff}} = 3$
) from table
1
no. 100185 (pink), no. 100247 (magenta) and no. 100183 (purple) with gas fuelling rates of $\varGamma _{gas} \sim 1.1, 1.7\ {\rm and}\ 3.0 \times 10^{22}\,\textrm{es}^{-1}$
, respectively, with the plotted quantities as defined in figure
1
.
$\varGamma _{gas} \sim 1.1, 1.7\ {\rm and}\ 3.0 \times 10^{22}\,\textrm{es}^{-1}$
, respectively, with the plotted quantities as defined in figure
1
.
The main effect of the increased gas rate is to increase the density at the separatrix and hence the density ratio $n_{e,sep}/n_{e,ped}$
, as is also shown in figure 2(c). This has the effect of shifting the
$n_{e,sep}/n_{e,ped}$
, as is also shown in figure 2(c). This has the effect of shifting the $n_e$
profile outwards with respect to the
$n_e$
profile outwards with respect to the $T_e$
profile, thereby narrowing the steep-density gradient region just inside the separatrix and increasing
$T_e$
profile, thereby narrowing the steep-density gradient region just inside the separatrix and increasing $\eta _e$
at the pedestal top, as is also discussed in Frassinetti et al. (Reference Frassinetti2019).
$\eta _e$
at the pedestal top, as is also discussed in Frassinetti et al. (Reference Frassinetti2019).
In the case of the two D pulses no. 96208 and no. 96201 shown in figure 3 at the two higher fuelling rates of $1.7\, {\rm and}\, 2.7 \times 10^{22}\,\textrm{es}^{-1}$
for which
$1.7\, {\rm and}\, 2.7 \times 10^{22}\,\textrm{es}^{-1}$
for which $f_{ELM}$
is particularly high (
$f_{ELM}$
is particularly high ( $\gtrsim 70\,\textrm {Hz}$
), the degree of agreement between the predicted value of
$\gtrsim 70\,\textrm {Hz}$
), the degree of agreement between the predicted value of $T_{e,ped}$
and the measured value is particularly poor.
$T_{e,ped}$
and the measured value is particularly poor.
Similar trends are observed for the T as for the D pulses, except that the pulse no. 100183 at the highest fuelling rate of $3.0 \times 10^{22}\,\textrm{es}^{-1}$
has an anomalously high pedestal density, increasing more strongly for a similar increase in
$3.0 \times 10^{22}\,\textrm{es}^{-1}$
has an anomalously high pedestal density, increasing more strongly for a similar increase in $\varGamma _{gas}$
than in the case of the D pulse no. 96201 shown in figure 3. This increase can be attributed to the low ELM frequency in pulse no. 100183 of
$\varGamma _{gas}$
than in the case of the D pulse no. 96201 shown in figure 3. This increase can be attributed to the low ELM frequency in pulse no. 100183 of $f_{ELM} \sim 7.5\,\textrm {Hz}$
, which is much lower than in the other pulses in the data set.
$f_{ELM} \sim 7.5\,\textrm {Hz}$
, which is much lower than in the other pulses in the data set.
Hence, in the T pulses, the effect of increasing the gas fuelling is not to increase but to decrease $f_{ELM}$
. In the case of the T pulses, increasing
$f_{ELM}$
. In the case of the T pulses, increasing $\varGamma _{gas}$
increases the radiated power
$\varGamma _{gas}$
increases the radiated power $P_{Rad}^{iELM}$
and hence the rate at which the pedestal energy
$P_{Rad}^{iELM}$
and hence the rate at which the pedestal energy $W_{e,ped}$
can increase between the ELMs, thereby decreasing
$W_{e,ped}$
can increase between the ELMs, thereby decreasing $f_{ELM}$
and the ELM power loss
$f_{ELM}$
and the ELM power loss $\left \langle P_{ELM} \right \rangle$
. However, for the D pulses, increasing
$\left \langle P_{ELM} \right \rangle$
. However, for the D pulses, increasing $\varGamma _{gas}$
has the opposite effect of reducing
$\varGamma _{gas}$
has the opposite effect of reducing $P_{Rad}^{iELM}$
, which increases rather than decreases
$P_{Rad}^{iELM}$
, which increases rather than decreases $f_{ELM}$
.
$f_{ELM}$
.
These observations support the notion that the narrower the steep-density gradient region, the worse the predictive capability of the model, which is not applicable to the weak-density gradient region inside the density pedestal top. The particularly poor agreement for the T pulse no. 100183 at the highest fuelling rate also follows this trend. Note that the dependencies of the loss power components due to radiation, ELMs and inter-ELM heat transport across this data set are discussed in more detail in Frassinetti et al. (Reference Frassinetti2023).
Generally, as is evident from figure 2(a), the higher gas fuelling rates, with the correspondingly higher density ratios $n_{e,sep}/n_{e,ped}$
exhibit the lowest values of
$n_{e,sep}/n_{e,ped}$
exhibit the lowest values of $T_{e,ped}$
and
$T_{e,ped}$
and $T_e(\psi _N^{n_{e,top}})$
, in agreement with several previous studies on JET-Be/W, e.g. as in Frassinetti et al. (Reference Frassinetti2019, Reference Frassinetti2021). An alternative interpretation of this observation to that proposed in Frassinetti et al. (Reference Frassinetti2019), i.e. increased turbulent transport due to higher resulting values of
$T_e(\psi _N^{n_{e,top}})$
, in agreement with several previous studies on JET-Be/W, e.g. as in Frassinetti et al. (Reference Frassinetti2019, Reference Frassinetti2021). An alternative interpretation of this observation to that proposed in Frassinetti et al. (Reference Frassinetti2019), i.e. increased turbulent transport due to higher resulting values of $\eta _e$
across the pedestal, is discussed in § 5.
$\eta _e$
across the pedestal, is discussed in § 5.
5. Discussion
In the following sections, several aspects of the pedestal heat transport are discussed: in § 5.1, the important role of the separatrix boundary conditions in determining the pedestal structure; in § 5.2, the expected dependencies of the pedestal $T_e$
profile on the toroidal field
$T_e$
profile on the toroidal field $B_t$
and the effective isotopic mass
$B_t$
and the effective isotopic mass $A_{\textit{eff}}$
, which is indirect through it’s dependence on the
$A_{\textit{eff}}$
, which is indirect through it’s dependence on the $n_e$
profile; and in § 5.3, the expected threshold for the ETG turbulence on pedestal gradients in terms of
$n_e$
profile; and in § 5.3, the expected threshold for the ETG turbulence on pedestal gradients in terms of $R/L_{T_e}$
and
$R/L_{T_e}$
and $R/L_{n_e}$
or
$R/L_{n_e}$
or $\eta _e$
. There follows in § 5.4, a brief review of GK studies of the structure of the pedestal turbulence, which highlights the dominant contribution of ‘slab’-like, electron-temperature-gradient-driven (S-ETG) turbulence to the heat flux across the steep gradient region of the pedestal.
$\eta _e$
. There follows in § 5.4, a brief review of GK studies of the structure of the pedestal turbulence, which highlights the dominant contribution of ‘slab’-like, electron-temperature-gradient-driven (S-ETG) turbulence to the heat flux across the steep gradient region of the pedestal.
5.1. On the role of the separatrix boundary conditions
An extreme simplification of the model for the pedestal $T_e$
profile presented in § 2 gives insight into the important role that the density ratio
$T_e$
profile presented in § 2 gives insight into the important role that the density ratio $n_{e,sep}/n_{e,ped}$
plays in governing the resulting pedestal temperature, in particular its value at the density pedestal top
$n_{e,sep}/n_{e,ped}$
plays in governing the resulting pedestal temperature, in particular its value at the density pedestal top $T_e(\psi _N^{n_{e,top}})$
. As reported in Field et al. (Reference Field2020), values of the parameter
$T_e(\psi _N^{n_{e,top}})$
. As reported in Field et al. (Reference Field2020), values of the parameter $\eta _e$
averaged over the steep-density gradient region of the pedestal is often observed to saturate at a value
$\eta _e$
averaged over the steep-density gradient region of the pedestal is often observed to saturate at a value $\left \langle \eta _e \right \rangle _{ped} \sim 2$
in JET-Be/W plasmas. This observation is also supported by results presented in Frassinetti et al. (Reference Frassinetti2023).
$\left \langle \eta _e \right \rangle _{ped} \sim 2$
in JET-Be/W plasmas. This observation is also supported by results presented in Frassinetti et al. (Reference Frassinetti2023).
It is also discussed in Guttenfelder et al. (Reference Guttenfelder, Groebner, Canik, Grierson, Belli and Candy2021), that values of $\left \langle \eta _e \right \rangle _{ped}$
in the range 1–2 have been reported on several other devices and it is explicitly mentioned in Jenko et al. (Reference Jenko, Told, Xanthopoulos, Merz and Horton2009) that values of
$\left \langle \eta _e \right \rangle _{ped}$
in the range 1–2 have been reported on several other devices and it is explicitly mentioned in Jenko et al. (Reference Jenko, Told, Xanthopoulos, Merz and Horton2009) that values of $\eta _e \sim 2$
measured across the steep-density gradient region in ASDEX Upgrade pedestals lie at
$\eta _e \sim 2$
measured across the steep-density gradient region in ASDEX Upgrade pedestals lie at ${\sim} 1.6 \times$
the linear threshold and that this observation might be attributable to the ‘stiffness’ of turbulent ETG-driven heat transport. Similar observations from ASDEX Upgrade were also reported earlier in Neuhauser et al. (Reference Neuhauser2002) and in Horton et al. (Reference Horton2005) it was shown that the pedestal
${\sim} 1.6 \times$
the linear threshold and that this observation might be attributable to the ‘stiffness’ of turbulent ETG-driven heat transport. Similar observations from ASDEX Upgrade were also reported earlier in Neuhauser et al. (Reference Neuhauser2002) and in Horton et al. (Reference Horton2005) it was shown that the pedestal $T_e$
profile could be reconstructed from the
$T_e$
profile could be reconstructed from the $n_e$
profile by assuming a constant
$n_e$
profile by assuming a constant $\eta _e \sim 2$
, in accordance with the following discussion.
$\eta _e \sim 2$
, in accordance with the following discussion.
In Field et al. (Reference Field2020), the consequences of assuming that infinitely ‘stiff’ electron heat transport clamps $\eta _e$
to a constant, critical value
$\eta _e$
to a constant, critical value $\bar {\eta _e}$
across the pedestal are discussed. Under this assumption, the definition of
$\bar {\eta _e}$
across the pedestal are discussed. Under this assumption, the definition of $\eta _e \equiv L_{n_e}/L_{T_e}$
represents a first-order differential equation
$\eta _e \equiv L_{n_e}/L_{T_e}$
represents a first-order differential equation $T_e'/T_e = \bar {\eta _e} (n_e'/n_e)$
, where the prime
$T_e'/T_e = \bar {\eta _e} (n_e'/n_e)$
, where the prime $' = d/dr$
. On integration inwards from the separatrix, this yields the following simple relation for
$' = d/dr$
. On integration inwards from the separatrix, this yields the following simple relation for $T_e$
at the top of the density pedestal:
$T_e$
at the top of the density pedestal:
 \begin{align} T_e(\psi _N^{n_{e,top}}) = T_{e,sep} \left ( \frac {n_{e,ped}}{n_{e,sep}} \right )^{\bar {\eta _e}}. \end{align}
This highlights the importance of the boundary conditions at the separatrix for the case of stiff heat transport, i.e. that $T_{e,ped}$
is then proportional to
$T_{e,ped}$
is then proportional to $T_{e,sep}$
and increases strongly with the density ratio
$T_{e,sep}$
and increases strongly with the density ratio $n_{e,ped}/n_{e,sep}$
, conversely decreasing with the inverse ratio
$n_{e,ped}/n_{e,sep}$
, conversely decreasing with the inverse ratio $n_{e,sep}/n_{e,ped}$
. This can be understood from the
$n_{e,sep}/n_{e,ped}$
. This can be understood from the $n_e$
in the denominator on the right-hand side of the initial differential equation, which results in a larger value of
$n_e$
in the denominator on the right-hand side of the initial differential equation, which results in a larger value of $T_e'$
for given values of
$T_e'$
for given values of $R/L_{n_e}$
and
$R/L_{n_e}$
and $T_e$
at the separatrix, this increase then propagating inwards as the temperature profile is integrated.
$T_e$
at the separatrix, this increase then propagating inwards as the temperature profile is integrated.
Hence, taken together, the observation that across the steep-density gradient region of the pedestal $\left \langle \eta _e \right \rangle _{ped} \sim 2$
and the simplifying assumption of infinitely stiff electron heat transport, offers an explanation of the decreasing dependence of
$\left \langle \eta _e \right \rangle _{ped} \sim 2$
and the simplifying assumption of infinitely stiff electron heat transport, offers an explanation of the decreasing dependence of $T_{e,ped}$
on the density ratio
$T_{e,ped}$
on the density ratio $n_{e,sep}/n_{e,ped}$
. Furthermore, in the density pedestal prediction model of Saarelma et al. (Reference Saarelma, Connor, Bilkova, Bohm, Field, Frassinetti, Fridstrom, Kirk and Contributors2023), which is discussed further in § 6.1 below, the pedestal density is also strongly dependent on the separatrix density.
$n_{e,sep}/n_{e,ped}$
. Furthermore, in the density pedestal prediction model of Saarelma et al. (Reference Saarelma, Connor, Bilkova, Bohm, Field, Frassinetti, Fridstrom, Kirk and Contributors2023), which is discussed further in § 6.1 below, the pedestal density is also strongly dependent on the separatrix density.
5.2. Influence of the effective isotope mass
$A_{\textit{eff}}$
and B-field

The heat-flux scaling of (2.1) on which the model described in § 2 is based is only dependent on the electron mass $m_e$
appearing in the gyro-Bohm normalisation
$m_e$
appearing in the gyro-Bohm normalisation $q_{e,gB} \propto \rho _e^2 \propto m_e$
, so is independent of the isotopic mass
$q_{e,gB} \propto \rho _e^2 \propto m_e$
, so is independent of the isotopic mass $A_{\textit{eff}}$
of the plasma ions. However, the predicted pedestal
$A_{\textit{eff}}$
of the plasma ions. However, the predicted pedestal $T_e$
profile does depend on the density profile, which does vary with
$T_e$
profile does depend on the density profile, which does vary with $A_{\textit{eff}}$
, as is described in detail in Frassinetti et al. (Reference Frassinetti2023). Across the data set used here and in Frassinetti et al. (Reference Frassinetti2023),
$A_{\textit{eff}}$
, as is described in detail in Frassinetti et al. (Reference Frassinetti2023). Across the data set used here and in Frassinetti et al. (Reference Frassinetti2023), $n_{e,ped}$
increases by
$n_{e,ped}$
increases by ${\sim} 50\,\%$
when changing isotope from pure D to T, i.e. with
${\sim} 50\,\%$
when changing isotope from pure D to T, i.e. with $A_{\textit{eff}}$
increasing from 2 to 3, while
$A_{\textit{eff}}$
increasing from 2 to 3, while $T_{e,ped}$
decreases by
$T_{e,ped}$
decreases by ${\sim} 25\,\%$
. As shown in figures 2(b) and 2(c),
${\sim} 25\,\%$
. As shown in figures 2(b) and 2(c), $n_{e,sep}$
increases with
$n_{e,sep}$
increases with $A_{\textit{eff}}$
, although less than
$A_{\textit{eff}}$
, although less than $n_{e,ped}$
, resulting in an almost constant density ratio
$n_{e,ped}$
, resulting in an almost constant density ratio $n_{e,sep}/n_{e,ped}$
.
$n_{e,sep}/n_{e,ped}$
.
The effect of these changes to the density profile is that the model predictions for $T_{e,ped}$
broadly reproduces the observed trends. As described above, the effect of increasing the assumed
$T_{e,ped}$
broadly reproduces the observed trends. As described above, the effect of increasing the assumed $n_{e,sep}$
is to decrease the initial
$n_{e,sep}$
is to decrease the initial $T_e$
gradient at the separatrix, so results in lower predicted
$T_e$
gradient at the separatrix, so results in lower predicted $T_e$
across the whole pedestal. At each flux surface, the predicted
$T_e$
across the whole pedestal. At each flux surface, the predicted $R/L_{T_e}$
adjusts to give the appropriate
$R/L_{T_e}$
adjusts to give the appropriate $\eta _e$
required to match the prescribed electron heat flux
$\eta _e$
required to match the prescribed electron heat flux $q_e$
, accounting for the predicted, local value of the gyro-Bohm normalisation
$q_e$
, accounting for the predicted, local value of the gyro-Bohm normalisation $q_{e,MgB}$
.
$q_{e,MgB}$
.
As can be seen from figure 2(a), the predicted $T_e$
at the density pedestal top
$T_e$
at the density pedestal top $T_{e,ped}^{ETG}(\psi _N^{n_{e,top}})$
typically agrees quite well with the measured values. The ratios of the calculated to measured values shown in figure 2(c) show that the predicted values overestimate the measured values by up to a factor
$T_{e,ped}^{ETG}(\psi _N^{n_{e,top}})$
typically agrees quite well with the measured values. The ratios of the calculated to measured values shown in figure 2(c) show that the predicted values overestimate the measured values by up to a factor ${\sim} 1.2$
. This indicates that, at least across the steep-density gradient region of the pedestal, the electron heat transport is probably independent of
${\sim} 1.2$
. This indicates that, at least across the steep-density gradient region of the pedestal, the electron heat transport is probably independent of $A_{\textit{eff}}$
.
$A_{\textit{eff}}$
.
As is also evident from figure 2(c), the agreement between the predicted and measured values of $T_{e,ped}$
improves with increasing
$T_{e,ped}$
improves with increasing $A_{\textit{eff}}$
, i.e. is better for the T pulses with lower
$A_{\textit{eff}}$
, i.e. is better for the T pulses with lower $T_{e,ped}$
than for the D pulses. This indicates that the underlying scaling for the electron heat transport across the weak-density gradient region must depend to some extent on
$T_{e,ped}$
than for the D pulses. This indicates that the underlying scaling for the electron heat transport across the weak-density gradient region must depend to some extent on $A_{\textit{eff}}$
.
$A_{\textit{eff}}$
.
This trend is consistent with the electron heat flux across the weak-density gradient region having a significant component due to ion-scale turbulence, which does exhibit a dependence on isotope mass. For example, the ion gyro-Bohm normalisation $q_{i,gB}$
scales with
$q_{i,gB}$
scales with $A_{\textit{eff}}$
. So, should the heat transport require a relatively constant normalised heat flux
$A_{\textit{eff}}$
. So, should the heat transport require a relatively constant normalised heat flux $q_e/q_{i,gB}$
, this alone would result in the predicted
$q_e/q_{i,gB}$
, this alone would result in the predicted $T_{e,ped}$
decreasing with
$T_{e,ped}$
decreasing with $A_{\textit{eff}}$
. Furthermore, the ion mass can affect the growth rates of trapped-electron-driven-mode (TEM) turbulence by changing the electron–ion collision frequency, which increases with
$A_{\textit{eff}}$
. Furthermore, the ion mass can affect the growth rates of trapped-electron-driven-mode (TEM) turbulence by changing the electron–ion collision frequency, which increases with $A_{\textit{eff}}^{1/2}$
. This would reduce the trapped-electron fraction for otherwise similar parameters and hence decrease the linear growth rates of TEM modes.
$A_{\textit{eff}}^{1/2}$
. This would reduce the trapped-electron fraction for otherwise similar parameters and hence decrease the linear growth rates of TEM modes.
Global linear GK simulations using GENE, discussed in Frassinetti et al. (Reference Frassinetti2023) performed without flow shear, yielded lower growth rates for ion-scale turbulence with $k_y \rho _i \lesssim 0.4$
and a significant TEM component for the T pulse no. 100247 compared with the D pulse no. 96208, while in simulations with flow shear, the ion-scale turbulence is completely suppressed in the T pulse but not in the D pulse. As TEM turbulence is thought responsible for electron particle transport (Kotschenreuther et al. Reference Kotschenreuther2019), this change is consistent with the higher
$k_y \rho _i \lesssim 0.4$
and a significant TEM component for the T pulse no. 100247 compared with the D pulse no. 96208, while in simulations with flow shear, the ion-scale turbulence is completely suppressed in the T pulse but not in the D pulse. As TEM turbulence is thought responsible for electron particle transport (Kotschenreuther et al. Reference Kotschenreuther2019), this change is consistent with the higher $n_{e,ped}$
of the T pulse. In this case there would be an indirect effect of increasing
$n_{e,ped}$
of the T pulse. In this case there would be an indirect effect of increasing $A_{\textit{eff}}$
on
$A_{\textit{eff}}$
on $T_{e,ped}$
. Should the pedestal heat transport be dominated by ETG turbulence, as it is across the steep-density gradient region, the increased pedestal density would then result in a reduction of
$T_{e,ped}$
. Should the pedestal heat transport be dominated by ETG turbulence, as it is across the steep-density gradient region, the increased pedestal density would then result in a reduction of $T_e$
across the pedestal.
$T_e$
across the pedestal.
In a recent detailed GK study of Predebon et al. (Reference Predebon, Hatch, Frassinetti, Horvath, Saarelma, Chapman-Oplopoiou, Görler, Maggi and Contributors2023) of the isotope mass dependence of pedestal transport in three $1.4\,\textrm {MA}$
, low-triangularity (
$1.4\,\textrm {MA}$
, low-triangularity ( $\delta \sim 0.2$
) JET-Be/W pulses, two in D and one in H at similar fuelling rates, local
$\delta \sim 0.2$
) JET-Be/W pulses, two in D and one in H at similar fuelling rates, local $\rho _e$
-scale GK simulations using GENE revealed that heat transport due to ETG turbulence dominates near the pedestal top, decreasing in significance outwards towards the separatrix. Swapping the isotope mass in the simulations, resulted in a negligible change in the predicted heat fluxes, showing that
$\rho _e$
-scale GK simulations using GENE revealed that heat transport due to ETG turbulence dominates near the pedestal top, decreasing in significance outwards towards the separatrix. Swapping the isotope mass in the simulations, resulted in a negligible change in the predicted heat fluxes, showing that $\rho _e$
-scale ETG turbulence is unable to explain the isotope effect on the heat transport. Also, as expected for ETG turbulence, the predicted particle and ion heat fluxes were negligibly small.
$\rho _e$
-scale ETG turbulence is unable to explain the isotope effect on the heat transport. Also, as expected for ETG turbulence, the predicted particle and ion heat fluxes were negligibly small.
In the global $\rho _i$
-scale GK simulations of Predebon et al. (Reference Predebon, Hatch, Frassinetti, Horvath, Saarelma, Chapman-Oplopoiou, Görler, Maggi and Contributors2023), the turbulent ion heat transport was found to be mostly due to ion-temperature-gradient (ITG) driven modes and to be characterised by an anti-gyro-Bohm heat-flux scaling due to different normalised
$\rho _i$
-scale GK simulations of Predebon et al. (Reference Predebon, Hatch, Frassinetti, Horvath, Saarelma, Chapman-Oplopoiou, Görler, Maggi and Contributors2023), the turbulent ion heat transport was found to be mostly due to ion-temperature-gradient (ITG) driven modes and to be characterised by an anti-gyro-Bohm heat-flux scaling due to different normalised $E\!\times \!B$
shearing rates in species units
$E\!\times \!B$
shearing rates in species units $\tilde {\omega }_{E\!\times \!B}(H) = A_D^{-1/2} \tilde {\omega }_{E\!\times \!B}(D)$
, relevant for flow–shear stabilisation of the ion-scale turbulence. Here, the normalised
$\tilde {\omega }_{E\!\times \!B}(H) = A_D^{-1/2} \tilde {\omega }_{E\!\times \!B}(D)$
, relevant for flow–shear stabilisation of the ion-scale turbulence. Here, the normalised $E\!\times \!B$
shearing rate is defined as
$E\!\times \!B$
shearing rate is defined as $\tilde {\omega }_{E\!\times \!B} = \omega _{E\!\times \!B}/(c_i/a)$
, where
$\tilde {\omega }_{E\!\times \!B} = \omega _{E\!\times \!B}/(c_i/a)$
, where $c_i$
is the ion sound speed and
$c_i$
is the ion sound speed and $a$
is the minor radius. As the neo-classical (NC) transport component of the ion heat flux is instead characterised by a gyro-Bohm scaling, overall this resulted in no net isotope dependence of the ion heat transport.
$a$
is the minor radius. As the neo-classical (NC) transport component of the ion heat flux is instead characterised by a gyro-Bohm scaling, overall this resulted in no net isotope dependence of the ion heat transport.
Turning to particle transport, whereas the NC component is not expected to be affected by the isotope mass, the global $\rho _i$
-scale GK simulations of Predebon et al. (Reference Predebon, Hatch, Frassinetti, Horvath, Saarelma, Chapman-Oplopoiou, Görler, Maggi and Contributors2023) showed the turbulent particle transport to largely dominate the NC transport and to exhibit a clear anti-gyro-Bohm scaling, this providing an efficient mechanism to explain the increased density gradient observed with increasing isotopic mass.
$\rho _i$
-scale GK simulations of Predebon et al. (Reference Predebon, Hatch, Frassinetti, Horvath, Saarelma, Chapman-Oplopoiou, Görler, Maggi and Contributors2023) showed the turbulent particle transport to largely dominate the NC transport and to exhibit a clear anti-gyro-Bohm scaling, this providing an efficient mechanism to explain the increased density gradient observed with increasing isotopic mass.
Regarding the dependence of the model predictions on the magnetic field, the gyro-Bohm normalisation $q_{e,gB}$
in the heat-flux scaling of (2.1) scales with
$q_{e,gB}$
in the heat-flux scaling of (2.1) scales with $B^2$
. Hence, as mentioned in § 3.2 above, the predicted
$B^2$
. Hence, as mentioned in § 3.2 above, the predicted $T_e$
across the pedestal is expected to scale approximately with
$T_e$
across the pedestal is expected to scale approximately with $B^{2/3}$
. Hence, the higher toroidal field of the pulses considered here of
$B^{2/3}$
. Hence, the higher toroidal field of the pulses considered here of $2.25\,\textrm {T}$
compared with the
$2.25\,\textrm {T}$
compared with the $1.7\,\textrm {T}$
of the pulses for which the
$1.7\,\textrm {T}$
of the pulses for which the $q_e$
scaling was determined (Chapman-Oplopoiou et al. Reference Chapman-Oplopoiou2022), would result in a factor
$q_e$
scaling was determined (Chapman-Oplopoiou et al. Reference Chapman-Oplopoiou2022), would result in a factor ${\sim} 1.52$
increase in the predicted
${\sim} 1.52$
increase in the predicted $T_{e,ped}$
, provided other pulse parameters where held constant. The fact that at least the predicted
$T_{e,ped}$
, provided other pulse parameters where held constant. The fact that at least the predicted $T_e$
at the density pedestal top
$T_e$
at the density pedestal top $T_e(\psi _N^{n_{e,top}})$
agrees well with experiment, indicates that the electron heat flux, at least across the steep-density gradient region of the pedestal, likely does scale with the expected electron gyro-Bohm normalisation.
$T_e(\psi _N^{n_{e,top}})$
agrees well with experiment, indicates that the electron heat flux, at least across the steep-density gradient region of the pedestal, likely does scale with the expected electron gyro-Bohm normalisation.
From the above, the key points are that the results presented here indicate:
-
(i) across the steep-density gradient region of the pedestal, the good agreement between the ETG model predictions and the measured profiles implies that the electron heat transport is probably predominately due to slab-ETG turbulence over this region, and is hence largely independent of
$A_{\textit{eff}}$
; -
(ii) the reduction in
$T_{e,ped}$
with
$A_{\textit{eff}}$
is primarily due to the response of the
$n_e$
profile to changes in the particle transport with
$A_{\textit{eff}}$
; -
(iii) the change with
$A_{\textit{eff}}$
in the degree of agreement between the ETG model predictions and the measured profiles over the region of weak-density gradient inside the density pedestal top implies that the underlying scaling for the electron heat transport in this inner region of the pedestal must depend to some extent on
$A_{\textit{eff}}$
.


5.3. On the critical threshold for ETG turbulence
Here, we discuss the conditions under which ETG-driven turbulence is expected to exhibit a threshold, normalised temperature gradient $R/L_{T_e,cr}$
or a threshold in the parameter
$R/L_{T_e,cr}$
or a threshold in the parameter $\eta _e$
, the latter implying that an increased density gradient would require a larger temperature gradient to destabilise the turbulence. In which regions of the pedestal these different thresholds are expected to apply gives insight into their role in determining the pedestal structure.
$\eta _e$
, the latter implying that an increased density gradient would require a larger temperature gradient to destabilise the turbulence. In which regions of the pedestal these different thresholds are expected to apply gives insight into their role in determining the pedestal structure.
For a study of the linear threshold temperature gradient for the destabilisation of ETG turbulence by Jenko et al. (Reference Jenko, Dorland and Hammett2001), a series of linear stability calculations were performed using the GK code GENE, scanning a number of parameters over ranges representative of the core of a typical tokamak plasma equilibrium, to determine the scaling of the critical, normalised electron temperature gradient $R/L_{T_e,cr}$
required for finite growth rate of the most unstable linear mode, i.e. at which its growth rate
$R/L_{T_e,cr}$
required for finite growth rate of the most unstable linear mode, i.e. at which its growth rate $\gamma _m \gt 0$
.
$\gamma _m \gt 0$
.
By separately fitting the scaling of $R/L_{T_e,cr}$
obtained for each parameter, e.g. the normalised density gradient
$R/L_{T_e,cr}$
obtained for each parameter, e.g. the normalised density gradient $R/L_{n_e}$
, the temperature ratio parameter
$R/L_{n_e}$
, the temperature ratio parameter $\tau = Z_{\textit{eff}} (T_e/T_i)$
, safety factor
$\tau = Z_{\textit{eff}} (T_e/T_i)$
, safety factor $q$
, and the magnetic shear
$q$
, and the magnetic shear $\hat {s} = r/q(dq/dr)$
, the overall scaling could be summarised by an expression of the form
$\hat {s} = r/q(dq/dr)$
, the overall scaling could be summarised by an expression of the form
 \begin{align} R/L_{T_e,cr} = \{(1+\tau )(\mathcal{A}+\mathcal{B}\hat {s}/q), \mathcal{C} R/L_{n_e}\}_{max}, \end{align}
where the fit coefficients are $\mathcal{A}=1.33$ $\mathcal{B}=1.91$
,
$\mathcal{B}=1.91$
, $\mathcal{C}=0.8$
(see (4) of Jenko et al. (Reference Jenko, Dorland and Hammett2001)). A more complete scaling, accounting for finite aspect ratio and non-circular plasma geometry is given by
$\mathcal{C}=0.8$
(see (4) of Jenko et al. (Reference Jenko, Dorland and Hammett2001)). A more complete scaling, accounting for finite aspect ratio and non-circular plasma geometry is given by
 \begin{align} R/L_{T_e,cr} &= \{(1+\tau )(1.33+1.91\hat {s}/q)(1-1.5\epsilon )(1+0.3\epsilon (d\kappa /d\epsilon )), 0.8 R/L_{n_e}\}_{max},\nonumber \\& \end{align}
where the inverse aspect ratio $\epsilon = r/R_0$
and
$\epsilon = r/R_0$
and $\kappa = b/a$
(where
$\kappa = b/a$
(where $a$
and
$a$
and $b$
are the horizontal and vertical plasma radii) is the elongation of the flux surfaces (see (7) of Jenko et al. (Reference Jenko, Dorland and Hammett2001)).
$b$
are the horizontal and vertical plasma radii) is the elongation of the flux surfaces (see (7) of Jenko et al. (Reference Jenko, Dorland and Hammett2001)).
The first and second terms in (5.2) and (5.3) represent the linear thresholds for what are known as the ‘toroidal’ and ‘slab’ branches of linear ETG modes, which we denote hereafter as T-ETG and S-ETG modes. For the slab modes, which dominate at high $R/L_{n_e}$
, the parallel dynamics dominates over perpendicular drifts, while toroidal modes, which are driven by perpendicular drifts, are dominant at low
$R/L_{n_e}$
, the parallel dynamics dominates over perpendicular drifts, while toroidal modes, which are driven by perpendicular drifts, are dominant at low $R/L_{n_e}$
(Romanelli Reference Romanelli1989; Jenko et al. Reference Jenko, Dorland and Hammett2001).
$R/L_{n_e}$
(Romanelli Reference Romanelli1989; Jenko et al. Reference Jenko, Dorland and Hammett2001).
The behaviour of this threshold is made up of two parts, the constant $R/L_{T_e,cr}$
branch at low
$R/L_{T_e,cr}$
branch at low $R/L_{n_e}$
, where the first term in (5.3) is largest and the branch at high
$R/L_{n_e}$
, where the first term in (5.3) is largest and the branch at high $R/L_{n_e}$
where
$R/L_{n_e}$
where $R/L_{T_e,cr} = 0.8 R/L_{n_e}$
. It is this second branch, corresponding to the dominance of S-ETG modes, that is appropriate at the high values of
$R/L_{T_e,cr} = 0.8 R/L_{n_e}$
. It is this second branch, corresponding to the dominance of S-ETG modes, that is appropriate at the high values of $R/L_{n_e} \sim \mathcal O \textrm {(100)}$
typical of the steep-density gradient region of the pedestal. With the definition of the parameter
$R/L_{n_e} \sim \mathcal O \textrm {(100)}$
typical of the steep-density gradient region of the pedestal. With the definition of the parameter $\eta _e = L_{n_e}/L_{T_e}$
, this branch corresponds to the threshold
$\eta _e = L_{n_e}/L_{T_e}$
, this branch corresponds to the threshold $\eta _{e,cr} = 0.8$
for a finite linear growth rate of these modes.
$\eta _{e,cr} = 0.8$
for a finite linear growth rate of these modes.
The set of nonlinear, GENE simulations, over which the electron temperature and density gradients were scanned about nominal values of $R/L_{T_e}$
and
$R/L_{T_e}$
and $R/L_{n_e}$
, performed for the study of Chapman-Oplopoiou et al. (Reference Chapman-Oplopoiou2022), were run only for the mid-pedestal location in the steep-density region. These showed that the ETG turbulence prevalent there exhibits a threshold in
$R/L_{n_e}$
, performed for the study of Chapman-Oplopoiou et al. (Reference Chapman-Oplopoiou2022), were run only for the mid-pedestal location in the steep-density region. These showed that the ETG turbulence prevalent there exhibits a threshold in $\eta _{e,cr}$
, with the threshold
$\eta _{e,cr}$
, with the threshold $R/L_{T_e}$
increasing linearly with
$R/L_{T_e}$
increasing linearly with $R/L_{n_e}$
, as expected for S-ETG modes. The saturated electron heat fluxes
$R/L_{n_e}$
, as expected for S-ETG modes. The saturated electron heat fluxes $q_e$
from these simulations were found to decrease linearly with increasing
$q_e$
from these simulations were found to decrease linearly with increasing $R/L_{n_e}$
and increase with
$R/L_{n_e}$
and increase with $(R/L_{T_e})^3$
for values well above threshold, these trends captured by the expression
$(R/L_{T_e})^3$
for values well above threshold, these trends captured by the expression
 \begin{align} Q_{e}^\star = (R/L_{n_e})^{-1} (R/L_{T_e} - R/L_{T_e,cr}) \equiv (\eta _e - \eta _{e,cr}). \end{align}
Here, the dependence of the threshold $\eta _e$
on the density gradient
$\eta _e$
on the density gradient $\eta _{e,cr} = (R/L_{T_e,cr})(R/L_{n_e})$
is consistent with that found from the linear scans with GENE in Jenko et al. (Reference Jenko, Dorland and Hammett2001), represented by the second term in (5.3).
$\eta _{e,cr} = (R/L_{T_e,cr})(R/L_{n_e})$
is consistent with that found from the linear scans with GENE in Jenko et al. (Reference Jenko, Dorland and Hammett2001), represented by the second term in (5.3).
Two expressions for the electron heat flux $q_e$
were used in Chapman-Oplopoiou et al. (Reference Chapman-Oplopoiou2022) to fit the data from the nonlinear GENE simulations from the temperature gradient scan, i.e. equation (i)
$q_e$
were used in Chapman-Oplopoiou et al. (Reference Chapman-Oplopoiou2022) to fit the data from the nonlinear GENE simulations from the temperature gradient scan, i.e. equation (i) $q_e \propto (\omega _{T_e} - \alpha \omega _{n_e,0})^\beta$
and equation (ii)
$q_e \propto (\omega _{T_e} - \alpha \omega _{n_e,0})^\beta$
and equation (ii) $q_e \propto (\omega _{T_e} - \delta \omega _{n_e,0}))^\epsilon \omega _{T_e}^2$
, where
$q_e \propto (\omega _{T_e} - \delta \omega _{n_e,0}))^\epsilon \omega _{T_e}^2$
, where $\omega _{T_e} \equiv a/L_{T_e}$
, etc. Only the latter equation (ii) can be transformed algebraically into (5.4). The fit found using equation (i) yielded a threshold
$\omega _{T_e} \equiv a/L_{T_e}$
, etc. Only the latter equation (ii) can be transformed algebraically into (5.4). The fit found using equation (i) yielded a threshold $\alpha \equiv \eta _{e,cr} \sim 0.8$
and an exponent
$\alpha \equiv \eta _{e,cr} \sim 0.8$
and an exponent $\beta \sim 3$
, while the fit using equation (ii) yielded a higher threshold
$\beta \sim 3$
, while the fit using equation (ii) yielded a higher threshold $\delta \equiv \eta _{e,cr} \sim 1.28$
and an exponent
$\delta \equiv \eta _{e,cr} \sim 1.28$
and an exponent $\epsilon \sim 1.43$
.
$\epsilon \sim 1.43$
.
It is interesting to note that fitting the $q_e$
data using equation (i) yielded a threshold much closer to the linear threshold
$q_e$
data using equation (i) yielded a threshold much closer to the linear threshold $\alpha \equiv \eta _{e,cr} \sim 0.8$
, while the fitted exponent
$\alpha \equiv \eta _{e,cr} \sim 0.8$
, while the fitted exponent $\beta \sim 3$
is consistent with the prediction of critical balance theory for ETG turbulence (Barnes, Parra & Schekochihin Reference Barnes, Parra and Schekochihin2011; Adkins et al. Reference Adkins, Schekochihin, Ivanov and Roach2022, Reference Adkins, Abel, Barnes, Buller, Dorland, Ivanov, Meyrand, Parra, Schekochihin and Squire2026), even for values of
$\beta \sim 3$
is consistent with the prediction of critical balance theory for ETG turbulence (Barnes, Parra & Schekochihin Reference Barnes, Parra and Schekochihin2011; Adkins et al. Reference Adkins, Schekochihin, Ivanov and Roach2022, Reference Adkins, Abel, Barnes, Buller, Dorland, Ivanov, Meyrand, Parra, Schekochihin and Squire2026), even for values of $\omega _{T_e}$
not far above threshold. In contrast, the higher threshold found by fitting to equation (ii) instead, results in a slightly stronger dependence of
$\omega _{T_e}$
not far above threshold. In contrast, the higher threshold found by fitting to equation (ii) instead, results in a slightly stronger dependence of $q_e \propto (R/L_{T_e})^{3.4}$
only far above threshold. The similar uncertainties on the fit parameters found with either expression, meant that it was impossible to distinguish which of the two forms better fits the heat-flux data. It therefore remains an open question whether
$q_e \propto (R/L_{T_e})^{3.4}$
only far above threshold. The similar uncertainties on the fit parameters found with either expression, meant that it was impossible to distinguish which of the two forms better fits the heat-flux data. It therefore remains an open question whether $\eta _{e,cr}$
lies at the linear threshold or whether there is an upward, nonlinear `Dimits' shift to the threshold
$\eta _{e,cr}$
lies at the linear threshold or whether there is an upward, nonlinear `Dimits' shift to the threshold $\eta _e$
for ETG turbulence in the pedestal region (Dimits et al. Reference Dimits2000).
$\eta _e$
for ETG turbulence in the pedestal region (Dimits et al. Reference Dimits2000).
The key points from the above discussion are:
-
(i) in regions with high
$R/L_{T_e} \sim \mathcal O \textrm {(100)}$
, as in the steep-density gradient region of the pedestal, the slab branch of ETG turbulence exhibits a threshold in
$\eta _e$
, hence, the threshold
$R/L_{T_e}$
is proportional to
$R/L_{n_e}$
; -
(ii) in contrast, where the density gradient is weak (
$R/L_{T_e} \lt \mathcal O \textrm {(10)}$
), as inside the density pedestal top, the toroidal branch of ETG turbulence is expected to prevail, which exhibits a threshold in
$R/L_{T_e}$
that is independent of
$R/L_{n_e}$
; -
(iii) above this critical threshold, the electron heat flux increases strongly
$\propto (R/L_{T_e})^3$
, implying that the ETG turbulence is critically balanced; -
(iv) from the heat-flux scalings found compatible with the GK study of Chapman-Oplopoiou et al. (Reference Chapman-Oplopoiou2022), it is not possible to ascertain whether or not the ETG turbulence in the steep-density gradient region exhibits a Dimits’ shift in the critical
$\eta _e$
.


5.4. On the structure of turbulence across the pedestal
In the study of Chapman-Oplopoiou et al. (Reference Chapman-Oplopoiou2022), the structure of turbulence across the pedestal of selected JET-Be/W type-I ELMy H-modes at $1.4\,\textrm {MA}/1.7\,\textrm {T}$
with varying input power and gas injection rates, from the weak-density region inside the pedestal top across the steep-density gradient region to the separatrix, is investigated in detail using both linear and nonlinear electromagnetic GK simulations using GENE. For the cases studied there, the heat flux was found to be carried predominantly by turbulent electron heat transport across most of the pedestal, except in one case for a pulse at lower heating power, in which neo-classical ion heat transport carried most of the heat flux across this region.
$1.4\,\textrm {MA}/1.7\,\textrm {T}$
with varying input power and gas injection rates, from the weak-density region inside the pedestal top across the steep-density gradient region to the separatrix, is investigated in detail using both linear and nonlinear electromagnetic GK simulations using GENE. For the cases studied there, the heat flux was found to be carried predominantly by turbulent electron heat transport across most of the pedestal, except in one case for a pulse at lower heating power, in which neo-classical ion heat transport carried most of the heat flux across this region.
For the innermost flux surface considered, mid-way between the temperature and density pedestal top positions, the dominant modes were found to be ITG/TEM turbulence at low $k_y \rho _i$
and ‘core-like’ ETG turbulence (with growth rates peaking at the outboard mid-plane, i.e.
$k_y \rho _i$
and ‘core-like’ ETG turbulence (with growth rates peaking at the outboard mid-plane, i.e. $\theta _0 = 0$
) at high
$\theta _0 = 0$
) at high $k_y \rho _i$
. There, the electron heat-flux spectra were found to peak at larger scales, over the range of
$k_y \rho _i$
. There, the electron heat-flux spectra were found to peak at larger scales, over the range of $k_y \rho _i \sim 10{-}20$
, than in the steep-density gradient region.
$k_y \rho _i \sim 10{-}20$
, than in the steep-density gradient region.
At the mid-pedestal flux surface in the steep-density gradient region, the heat flux was found to be carried predominantly by S-ETG turbulence, the spectrally resolved electron heat flux peaking at $k_y \rho _i \sim 60$
, i.e. where
$k_y \rho _i \sim 60$
, i.e. where $k_y \rho _e \sim \mathcal O \textrm {(1)}$
. Linearly, these modes were found to have a high parallel wavenumber
$k_y \rho _e \sim \mathcal O \textrm {(1)}$
. Linearly, these modes were found to have a high parallel wavenumber $k_z$
, indicating the importance of the parallel resonance (
$k_z$
, indicating the importance of the parallel resonance ( $\omega \sim k_z v_{th,e}$
, where
$\omega \sim k_z v_{th,e}$
, where $v_{th,e}$
is the electron thermal velocity and
$v_{th,e}$
is the electron thermal velocity and $k_z$
the wavenumber parallel to
$k_z$
the wavenumber parallel to $B$
) in their dynamics, thus confirming the S-ETG character of this turbulence.
$B$
) in their dynamics, thus confirming the S-ETG character of this turbulence.
A tendency for ETGs to exist also at smaller $k_y \rho _i$
in the steep-density gradient region was particularly noticeable for the high-power pulses. At
$k_y \rho _i$
in the steep-density gradient region was particularly noticeable for the high-power pulses. At $k_y \rho _i \lesssim 5$
, the dominant form of ETG were found to be T-ETG modes, requiring large values of
$k_y \rho _i \lesssim 5$
, the dominant form of ETG were found to be T-ETG modes, requiring large values of $R/L_{T_e}$
to exist and with growth rates peaking at
$R/L_{T_e}$
to exist and with growth rates peaking at $\theta _0 \ne 0$
, in contrast to the high
$\theta _0 \ne 0$
, in contrast to the high $k_z$
S-ETG modes present at high
$k_z$
S-ETG modes present at high $k_y \rho _i$
, which were found to carry the overwhelming fraction of the electron heat flux.
$k_y \rho _i$
, which were found to carry the overwhelming fraction of the electron heat flux.
The cases studied with low gas fuelling rates also exhibited KBMs present close to the separatrix at $k_y \rho _i \sim 0.2$
, characterised by their vanishing parallel electric field
$k_y \rho _i \sim 0.2$
, characterised by their vanishing parallel electric field $E_\parallel$
and transport fingerprints, as described in Hatch et al. (Reference Hatch, Kotschenreuther, Mahajan, Valanju, Jenko, Told, Görler and Saarelma2016) and Kotschenreuther et al. (Reference Kotschenreuther2019).
$E_\parallel$
and transport fingerprints, as described in Hatch et al. (Reference Hatch, Kotschenreuther, Mahajan, Valanju, Jenko, Told, Görler and Saarelma2016) and Kotschenreuther et al. (Reference Kotschenreuther2019).
Recently the GK study of JET-Be/W pedestal heat transport reported in Chapman-Oplopoiou et al. (Reference Chapman-Oplopoiou2022) has been extended by performing a more detailed study of the morphology of the ETG turbulence reported in Chapman-Oplopoiou et al. (Reference Chapman-Oplopoiou, Walker, Hatch, Görler and Contributors2025), with the aim of investigating why the cases with a higher gas fuelling rate exhibit a somewhat ‘stiffer’ $q_e(\eta _e)$
scaling than the low-gas cases. Here, the term ‘stiffness’ refers to the rate of increase of
$q_e(\eta _e)$
scaling than the low-gas cases. Here, the term ‘stiffness’ refers to the rate of increase of $q_e$
with
$q_e$
with $\eta _e$
, i.e.
$\eta _e$
, i.e. $\text{d}q_e/\text{d}\eta _e$
. The relative importance of the toroidal and slab resonances could be investigated by comparing the resulting heat fluxes obtained from nonlinear GK simulations performed both with and without the toroidal drifts active. For the low-gas case, no difference was found between the cases with and without the toroidal drifts, indicating that the ETG turbulence is purely slab-like in character.
$\text{d}q_e/\text{d}\eta _e$
. The relative importance of the toroidal and slab resonances could be investigated by comparing the resulting heat fluxes obtained from nonlinear GK simulations performed both with and without the toroidal drifts active. For the low-gas case, no difference was found between the cases with and without the toroidal drifts, indicating that the ETG turbulence is purely slab-like in character.
In contrast, for the high-gas case, which consequently has a higher ratio of separatrix to pedestal density $n_{e,sep}/n_{e,ped}$
(and hence lower normalised density gradient
$n_{e,sep}/n_{e,ped}$
(and hence lower normalised density gradient $\omega _{n_e}$
at the mid-pedestal flux surface) than the low-gas case, disabling the toroidal drifts significantly reduced the heat flux (by
$\omega _{n_e}$
at the mid-pedestal flux surface) than the low-gas case, disabling the toroidal drifts significantly reduced the heat flux (by ${\sim} 35\,\%$
at the nominal gradients), resulting in quantitatively very similar
${\sim} 35\,\%$
at the nominal gradients), resulting in quantitatively very similar $q_e(\eta _e)$
scaling to the low-gas case. Hence, with a weaker density gradient, an increasing relative contribution from T-ETG modes is found to be the underlying cause of the increased stiffness of the heat-flux scaling. As expected, the T-ETG modes were of a ballooning character, peaking at
$q_e(\eta _e)$
scaling to the low-gas case. Hence, with a weaker density gradient, an increasing relative contribution from T-ETG modes is found to be the underlying cause of the increased stiffness of the heat-flux scaling. As expected, the T-ETG modes were of a ballooning character, peaking at $k_z \sim 0$
. Furthermore, it was found that, while variation of
$k_z \sim 0$
. Furthermore, it was found that, while variation of $\omega _{n_e}$
did not affect the
$\omega _{n_e}$
did not affect the $q_e(k_z)$
spectrum, increasing
$q_e(k_z)$
spectrum, increasing $\omega _{T_e}$
caused a pile up of the heat flux at high values of
$\omega _{T_e}$
caused a pile up of the heat flux at high values of $k_z$
at the limit of the parallel resolution of the GK simulations, as is also documented for S-ETG modes in Pueschel et al. (Reference Pueschel, Hatch, Ernst, Guttenfelder, Terry, Citrin and Connor2019).
$k_z$
at the limit of the parallel resolution of the GK simulations, as is also documented for S-ETG modes in Pueschel et al. (Reference Pueschel, Hatch, Ernst, Guttenfelder, Terry, Citrin and Connor2019).
In the detailed GK study of Parisi et al. (Reference Parisi2020) of the pedestal of the $1.4\,\textrm {MA}/1.9\,\textrm {T}$
JET-Be/W pulse no. 92174 with
$1.4\,\textrm {MA}/1.9\,\textrm {T}$
JET-Be/W pulse no. 92174 with $17.4\,\textrm {MW}$
of heating power, the turbulence for a flux surface in the steep-density gradient region was found to be dominated by ETG turbulence for all
$17.4\,\textrm {MW}$
of heating power, the turbulence for a flux surface in the steep-density gradient region was found to be dominated by ETG turbulence for all $k_y \rho _i \gt 0.1$
, with a novel type of T-ETG instability found often to be the fastest growing mode for
$k_y \rho _i \gt 0.1$
, with a novel type of T-ETG instability found often to be the fastest growing mode for $k_y \rho _i \geqslant 1$
. These modes exhibited such large radial wavenumbers for electron Larmor radius effects to be important, i.e.
$k_y \rho _i \geqslant 1$
. These modes exhibited such large radial wavenumbers for electron Larmor radius effects to be important, i.e. $k_x \rho _e \sim 1$
. This mode was found to be driven far away from the outboard mid-plane, i.e.
$k_x \rho _e \sim 1$
. This mode was found to be driven far away from the outboard mid-plane, i.e. $\theta _0 \ne 0$
, and to exist at large spatial scales, where
$\theta _0 \ne 0$
, and to exist at large spatial scales, where $k_y \rho _i \sim (\rho _i/\rho _e) (L_{T_e}/R) \sim 1$
, which is consistent with the results reported in Told et al. (Reference Told2008).
$k_y \rho _i \sim (\rho _i/\rho _e) (L_{T_e}/R) \sim 1$
, which is consistent with the results reported in Told et al. (Reference Told2008).
The T-ETG modes were found to co-exist with S-ETG modes, with the latter dominant at $\theta _0 = 0$
for
$\theta _0 = 0$
for $k_y \rho _i \geqslant 5$
. Quasi-linear, mixing-length arguments indicated that both the T-ETG and S-ETG modes were expected to make comparable contributions to the electron heat transport. While growth rates of the S-ETG modes were found to decrease with
$k_y \rho _i \geqslant 5$
. Quasi-linear, mixing-length arguments indicated that both the T-ETG and S-ETG modes were expected to make comparable contributions to the electron heat transport. While growth rates of the S-ETG modes were found to decrease with $R/L_{n_e}$
, the T-ETG modes were insensitive to
$R/L_{n_e}$
, the T-ETG modes were insensitive to $R/L_{n_e}$
but strongly driven by
$R/L_{n_e}$
but strongly driven by $R/L_{T_e}$
. At all scales, ITG modes were found to be subdominant and KBMs were shown to be suppressed by
$R/L_{T_e}$
. At all scales, ITG modes were found to be subdominant and KBMs were shown to be suppressed by $E\!\times \!B$
shear.
$E\!\times \!B$
shear.
In another recent study by Leppin et al. (Reference Leppin2023), the structure of turbulence across a typical pedestal in ASDEX Upgrade was determined using a combination of linear and nonlinear, global electromagnetic GK simulations performed using GENE. Trapped-electron-driven mode (TEM) turbulence with electromagnetic components due to MTMs was found to be dominant at the pedestal top/shoulder, while a combination of linear stabilisation and $E\!\times \!B$
shear was found to suppress such ion-scale turbulence towards the steep gradient region, where the electron heat flux was instead carried by small-scale ETG modes and the ion channel reduced to neo-classical levels.
$E\!\times \!B$
shear was found to suppress such ion-scale turbulence towards the steep gradient region, where the electron heat flux was instead carried by small-scale ETG modes and the ion channel reduced to neo-classical levels.
Of particular relevance to this present work is the finding of each of the studies discussed above that small-scale ETG turbulence carries the dominant fraction of the electron heat flux across the steep-density region of the pedestal. This turbulence has a predominantly ‘slab’ structure, with high parallel wavenumber $k_z$
and a threshold in
$k_z$
and a threshold in $\eta _e$
close to or somewhat above the linear threshold, although there is an increase in the relative contribution from T-ETG modes, driven by toroidal drifts, as the density gradient weakens. Furthermore, across the weak-density gradient region inwards of the density pedestal top, other larger-scale ITG/TEM modes or electromagnetic MTMs are found to carry a significant fraction of the electron heat flux.
$\eta _e$
close to or somewhat above the linear threshold, although there is an increase in the relative contribution from T-ETG modes, driven by toroidal drifts, as the density gradient weakens. Furthermore, across the weak-density gradient region inwards of the density pedestal top, other larger-scale ITG/TEM modes or electromagnetic MTMs are found to carry a significant fraction of the electron heat flux.
It is across this inner region of the pedestal that the model for the temperature profile of § 2 breaks down, as here the heat-flux scaling for the steep-density gradient region on which it is based is invalid. Further sets of nonlinear GK calculations scanning the temperature and density gradients are required to determine the appropriate electron heat-flux scaling to adopt for this region, which would have to be global to capture the ion-scale modes. Furthermore, in order to accurately determine the scaling, it may also be necessary to perform multi-scale GK simulations to capture any effects of cross-scale coupling between electron- and ion-scale turbulence (Howard et al. Reference Howard, Holland, White, Greenwald and Candy2015; Pueschel et al. Reference Pueschel, Hatch, Kotschenreuther, Ishizawa and Merlo2020). Ideally, other parameters as appear in (5.3) for the threshold $R/L_{T_e}$
, e.g.
$R/L_{T_e}$
, e.g. $\hat {s}/q$
should also be scanned to further parameterise the heat-flux scaling. Note that estimates of the magnitude of
$\hat {s}/q$
should also be scanned to further parameterise the heat-flux scaling. Note that estimates of the magnitude of $R/L_{T_e,cr}$
obtained from the first term of (5.3) using typical values of the parameters for the region at the pedestal top give too low values for
$R/L_{T_e,cr}$
obtained from the first term of (5.3) using typical values of the parameters for the region at the pedestal top give too low values for $R/L_{T_e,cr}$
of
$R/L_{T_e,cr}$
of $\mathcal O \textrm {(1)}$
compared with the observed values which are of
$\mathcal O \textrm {(1)}$
compared with the observed values which are of $\mathcal O \textrm {(10)}$
in this inner region of the pedestal.
$\mathcal O \textrm {(10)}$
in this inner region of the pedestal.
6. Predictions using the EPED model combined with the ETG critical-heat-flux model
The EPED model of Snyder et al. (Reference Snyder, Groebner, Leonard, Osborne and Wilson2009) for prediction of the total pressure at the pedestal top $p_{ped}$
is based on two assumptions: (i) that the pressure pedestal width
$p_{ped}$
is based on two assumptions: (i) that the pressure pedestal width $\varDelta _{p}$
is determined by the stability of KBMs, which limit the pressure gradient
$\varDelta _{p}$
is determined by the stability of KBMs, which limit the pressure gradient $p_{tot}'$
across the pedestal, yielding the relation
$p_{tot}'$
across the pedestal, yielding the relation $\varDelta _{p} = 0.076\, \beta _{p,ped}^{1/2}$
;Footnote
2
and (ii) the pedestal height is determined by increasing
$\varDelta _{p} = 0.076\, \beta _{p,ped}^{1/2}$
;Footnote
2
and (ii) the pedestal height is determined by increasing $p_{ped}$
until the magneto-hydro-dynamic (MHD) stability limit set by peeling-ballooning instabilities (Snyder et al. Reference Snyder, Wilson, Ferron, Lao, Leonard, Osborne, Turnbull, Mossessian, Murakami and Xu2002) is reached, above which an ELM would be triggered. Hence, in order to determine
$p_{ped}$
until the magneto-hydro-dynamic (MHD) stability limit set by peeling-ballooning instabilities (Snyder et al. Reference Snyder, Wilson, Ferron, Lao, Leonard, Osborne, Turnbull, Mossessian, Murakami and Xu2002) is reached, above which an ELM would be triggered. Hence, in order to determine $T_{e,ped}$
, using the EPED model it is necessary to assume a prescribed pedestal density
$T_{e,ped}$
, using the EPED model it is necessary to assume a prescribed pedestal density $n_{e,ped}$
.
$n_{e,ped}$
.
Typically, equal electron and ion temperatures ( $T_e = T_i$
) and equal widths for the electron density, temperature and pressure pedestals (
$T_e = T_i$
) and equal widths for the electron density, temperature and pressure pedestals ( $\varDelta _{n_e} = \varDelta _{T_e} = \varDelta _{p}$
) are assumed. As an attempt to improve upon this aspect of the EPED model, we have incorporated the ETG critical-heat-flux model of Field et al. (Reference Field, Chapman-Oplopoiou, Connor, Frassinetti, Hatch, Roach and Saarelma2023) for the pedestal
$\varDelta _{n_e} = \varDelta _{T_e} = \varDelta _{p}$
) are assumed. As an attempt to improve upon this aspect of the EPED model, we have incorporated the ETG critical-heat-flux model of Field et al. (Reference Field, Chapman-Oplopoiou, Connor, Frassinetti, Hatch, Roach and Saarelma2023) for the pedestal $T_e$
profile into a modified version of EPED in two different ways, as described in § 6.1 below. As a further step, the ionisation/diffusion model of Saarelma et al. (Reference Saarelma, Connor, Bilkova, Bohm, Field, Frassinetti, Fridstrom, Kirk and Contributors2023) has also been used to predict the pedestal
$T_e$
profile into a modified version of EPED in two different ways, as described in § 6.1 below. As a further step, the ionisation/diffusion model of Saarelma et al. (Reference Saarelma, Connor, Bilkova, Bohm, Field, Frassinetti, Fridstrom, Kirk and Contributors2023) has also been used to predict the pedestal $n_e$
profile. This, in combination with the EPED prediction of the total pedestal pressure
$n_e$
profile. This, in combination with the EPED prediction of the total pedestal pressure $p_{ped}$
, also allows the pedestal
$p_{ped}$
, also allows the pedestal $T_i$
profile to be determined. Results from applying these models to the JET-Be/W isotope mass scan dataset (Frassinetti et al. Reference Frassinetti2023) are presented in the following § 6.2.
$T_i$
profile to be determined. Results from applying these models to the JET-Be/W isotope mass scan dataset (Frassinetti et al. Reference Frassinetti2023) are presented in the following § 6.2.
6.1. Combined EPED and ETG critical-heat-flux pedestal models
The standard EPED model of Snyder et al. (Reference Snyder, Groebner, Leonard, Osborne and Wilson2009) for prediction of the total pedestal pressure $p_{ped}$
functions in the following way: a range of pedestal widths
$p_{ped}$
functions in the following way: a range of pedestal widths $\varDelta _{p}$
are assumed from which profiles of the total pedestal pressure
$\varDelta _{p}$
are assumed from which profiles of the total pedestal pressure $p_{ped}$
are constructed using the relation
$p_{ped}$
are constructed using the relation $p_{ped} \propto \varDelta _{p}^2$
, which derives from the KBM pressure-gradient constraint
$p_{ped} \propto \varDelta _{p}^2$
, which derives from the KBM pressure-gradient constraint $\varDelta _{p} = 0.076\, \beta _p^{1/2}$
; two-dimensional equilibria, constructed for each pressure profile, are tested for MHD stability to peeling-ballooning modes (PBM) using the MISHKA code (Mikhailovskii et al. Reference Mikhailovskii, Huysmans, Kerner and Sharapov1997) and that which is marginally stable then gives the EPED prediction of
$\varDelta _{p} = 0.076\, \beta _p^{1/2}$
; two-dimensional equilibria, constructed for each pressure profile, are tested for MHD stability to peeling-ballooning modes (PBM) using the MISHKA code (Mikhailovskii et al. Reference Mikhailovskii, Huysmans, Kerner and Sharapov1997) and that which is marginally stable then gives the EPED prediction of $p_{ped}$
. The marginal stability criterion on the growth rate
$p_{ped}$
. The marginal stability criterion on the growth rate $\gamma$
used here is
$\gamma$
used here is $\gamma \gt \omega ^\star _{p_i}/2$
, where
$\gamma \gt \omega ^\star _{p_i}/2$
, where $\omega ^\star _{p_i}$
is the ion diamagnetic frequency.
$\omega ^\star _{p_i}$
is the ion diamagnetic frequency.
The ETG critical-heat-flux model for the pedestal $T_e$
profile of Field et al. (Reference Field, Chapman-Oplopoiou, Connor, Frassinetti, Hatch, Roach and Saarelma2023), allows calculation of the
$T_e$
profile of Field et al. (Reference Field, Chapman-Oplopoiou, Connor, Frassinetti, Hatch, Roach and Saarelma2023), allows calculation of the $T_e$
profile across the pedestal, given the
$T_e$
profile across the pedestal, given the $n_e$
profile and the heat flux across the pedestal
$n_e$
profile and the heat flux across the pedestal $P_{sep}/S$
as input. This model has been combined with the standard EPED model within Europed in various ways, forming the models M1–3 described below.
$P_{sep}/S$
as input. This model has been combined with the standard EPED model within Europed in various ways, forming the models M1–3 described below.
The first two models still take $n_{e,ped}$
as an input and use the ETG model to calculate the associated
$n_{e,ped}$
as an input and use the ETG model to calculate the associated $T_e$
profile. A consequence of this is that the resulting
$T_e$
profile. A consequence of this is that the resulting $T_{e,ped}$
is extremely sensitive to the ratio
$T_{e,ped}$
is extremely sensitive to the ratio $n_{e,sep}/n_{e,ped}$
, increasing values of this density ratio causing
$n_{e,sep}/n_{e,ped}$
, increasing values of this density ratio causing $T_{e,ped}$
to decrease strongly. This sensitivity causes the first model (M1), which does not use the KBM constraint to determine the total pressure
$T_{e,ped}$
to decrease strongly. This sensitivity causes the first model (M1), which does not use the KBM constraint to determine the total pressure $p_{ped}$
, to fail in some cases at the experimental value of this density ratio.
$p_{ped}$
, to fail in some cases at the experimental value of this density ratio.
For the second model (M2), the ETG model is combined with EPED, where the $T_e$
profile from the ETG model is used together with the EPED prediction of the total pressure
$T_e$
profile from the ETG model is used together with the EPED prediction of the total pressure $p_{tot}$
and pedestal width
$p_{tot}$
and pedestal width $\varDelta _{p}$
to determine the
$\varDelta _{p}$
to determine the $T_i$
profile.
$T_i$
profile.
The third model (M3) combines the ETG critical-heat-flux model for the pedestal $T_e$
profile with the density-prediction (DP) model of Saarelma et al. (Reference Saarelma, Connor, Bilkova, Bohm, Field, Frassinetti, Fridstrom, Kirk and Contributors2023), a brief description of which is given in Appendix B. An iterative process is used, where the predicted
$T_e$
profile with the density-prediction (DP) model of Saarelma et al. (Reference Saarelma, Connor, Bilkova, Bohm, Field, Frassinetti, Fridstrom, Kirk and Contributors2023), a brief description of which is given in Appendix B. An iterative process is used, where the predicted $n_e$
profile is used as an input to the ETG model to predict the
$n_e$
profile is used as an input to the ETG model to predict the $T_e$
profile, which is then fed back into the DP model, resulting in a self-consistent prediction of the
$T_e$
profile, which is then fed back into the DP model, resulting in a self-consistent prediction of the $n_e$
and
$n_e$
and $T_e$
profiles. By combining this model with the MHD and KBM constraints of the EPED model the
$T_e$
profiles. By combining this model with the MHD and KBM constraints of the EPED model the $T_i$
profile can also be predicted, thereby providing a complete prediction of the pedestal profiles.
$T_i$
profile can also be predicted, thereby providing a complete prediction of the pedestal profiles.
An algorithmic style description of the three models M1-3 follows:
M1: with $n_{e,ped}$
given, assuming
$n_{e,ped}$
given, assuming $T_i/T_e = const$
but without the EPED KBM constraint:
$T_i/T_e = const$
but without the EPED KBM constraint:
-
(i) a range of pedestal widths
$\varDelta _{p}$
are generated, which together with the experimental value of
$n_{e,ped}$
, gives a range of pedestal
$n_e$
profiles; -
(ii) for each of these
$n_e$
profiles a corresponding
$T_e$
profile is calculated using the ETG critical-heat-flux model, as explained in § 3 of Field et al. (Reference Field, Chapman-Oplopoiou, Connor, Frassinetti, Hatch, Roach and Saarelma2023); -
(iii) the total pressure
$p_{tot} = p_i + p_e$
is calculated, assuming a fixed ratio of
$T_i/T_e = const$
and taking account of ion dilution using the measured
$Z_{\textit{eff}}$
and a representative impurity charge state
$Z_I$
; -
(iv) the resulting
$p_{tot}$
profiles are used to generate a range of self-consistent equilibria, each of which are tested for stability to ideal MHD PBM using the MISHKA code; -
(v) the profile which is found to be marginally stable then yields a prediction of
$p_{tot}$
and the corresponding
$n_{e,ped}$
and
$T_{e,ped}$
.


M2: with $n_{e,ped}$
given, determine:
$n_{e,ped}$
given, determine: $p_{tot}$
from EPED,
$p_{tot}$
from EPED, $T_e$
from ETG model and
$T_e$
from ETG model and $T_i$
by matching
$T_i$
by matching $p_{tot}$
from the EPED KBM and MHD (PBM) constraints:
$p_{tot}$
from the EPED KBM and MHD (PBM) constraints:
-
(i) a range of pedestal widths
$\varDelta _{p}$
are generated and for each the given value of
$n_{e,ped}$
, gives a range of pedestal
$n_e$
profiles; -
(ii) for each of these
$n_e$
profiles the corresponding
$T_e$
profile is calculated using the ETG critical-heat-flux model, as explained in § 3 of Field et al. (Reference Field, Chapman-Oplopoiou, Connor, Frassinetti, Hatch, Roach and Saarelma2023); -
(iii) for each
$\varDelta _{p}$
the corresponding
$p_{tot}$
profile is calculated using the KBM constraint, i.e.
$p_{ped} \propto \varDelta _{p}^2$
; -
(iv) the resulting
$p_{tot}$
profiles are used to generate a range of self-consistent equilibria, each of which are tested for stability to ideal MHD PBM using the MISHKA code; -
(v) the profile which is found to be marginally stable then yields a prediction of
$p_{tot}$
and the corresponding
$n_{e,ped}$
and
$T_{e,ped}$
; -
(vi) to satisfy the KBM constraint, the
$T_i$
profile is determined from
$p_{tot}$
, i.e.
$T_i = (p_{tot}-p_e))/n_i$
.


M3: the density pedestal prediction model of Saarelma et al. (Reference Saarelma, Connor, Bilkova, Bohm, Field, Frassinetti, Fridstrom, Kirk and Contributors2023) combined with the ETG critical-heat-flux model and the EPED KBM constraint ( $\varDelta =0.076 \sqrt {\beta _{p,ped}}$
):
$\varDelta =0.076 \sqrt {\beta _{p,ped}}$
):
-
(i) an initial guess is made of
$n_{e,ped}$
and
$T_{e,ped}$
; -
(ii) a range of pedestal widths
$\varDelta _{p}$
are generated and for each width corresponding
$n_e$
and
$T_e$
profiles are generated; -
(iii) for each width
$\varDelta _{p}$
the condition
$\varDelta _{p}=0.076\, \beta _{p,ped}^{1/2}$
is used to solve first
$\beta _{p,ped}$
and then for
$p_{ped}$
from
$\beta _{p,ped}$
; -
(iv)
$T_{i,ped}$
is solved from
$p_{ped} = p_{e,ped} + p_{i,ped}$
, where
$p_{i,ped} = n_{e,ped} (T_{e,ped} + T_{i,ped} ((1+{Z_I}-Z_{\textit{eff}}))/{Z_I})$
and
$Z_I$
is the charge state of a representative low-Z impurity, e.g.
${\textrm {Be}}^{+4}$
; -
(v) for each width
$\varDelta _{p}$
, the initial
$n_e$
,
$T_e$
and
$T_i$
profiles are input to the DP model (along with the other model parameters, described below) to predict the corresponding
$n_e$
profile; -
(vi) the resulting
$n_e$
profile is then input to the ETG model to predict the corresponding
$T_e$
profile; -
(vii) steps (iv) and (v) are iterated until the resulting
$n_e$
and
$T_e$
profiles converge; -
(viii) steps (iii) to (v) are iterated until the resulting
$T_i$
profile converges; -
(ix) for each of the cases corresponding to the different pedestal widths
$\varDelta _{p}$
, the total pressure profile
$p_{tot} = p_e + p_i$
is calculated; -
(x) the resulting
$p_{tot}$
profiles are used to generate a range of self-consistent equilibria, each of which are tested for stability to ideal MHD PBM using the MISHKA code; -
(xi) the
$p_{tot}$
profile which is found to be marginally stable then yields a prediction of the pedestal
$n_e$
,
$T_e$
and
$T_i$
profiles; -
(xii) after fitting the predicted profiles with model
$\mathrm{mtanh()}$
functions, the corresponding values of
$n_{e,ped}$
,
$T_{e,ped}$
and
$T_{i,ped}$
are obtained.


The principal inputs to model M3, which provides a full prediction of the pedestal profiles, are:
-
(i) the experimental input parameters: i.e. the heat flux across the separatrix
$P_{sep}/S$
and the electron density
$n_{e,sep}$
and temperature
$T_{e,sep}$
at the separatrix; -
(ii) several, less accurately known ‘model’ parameters of the DP model, to which the
$n_{e,ped}$
predictions are less sensitive: the flux-surface-averaged (FSA) density of Franck–Condon neutral atoms at the separatrix
$\left \langle n_{FC}(0) \right \rangle$
; the assumed ratio of electron particle diffusivity to electron heat conductivity (
$(D_e/\chi _e)_{TG}$
across the pedestal due to temperature-gradient-driven (ITG and ETG) turbulence; and the ratio of charge-exchange to Franck–Condon neutral densities at the separatrix
$({n_{CX}}/{n_{FC}})\rvert _{x=0}$
. -
(iii) For the ETG critical-heat-flux model, there are also the model parameters of (
$\alpha$
,
$\beta$
and
$\eta _{e,cr}$
) of the underlying gyro-Bohm normalised electron heat-flux scaling (2.1).


A discussion of the sensitivities of the predictions of the combined ETG+EPED+DP model (M3) to these experimental input and model parameters is given in Appendix C.
6.2. Results of applying combined EPED + ETG pedestal models to isotope scan pulses
M1: the strong inverse dependence of the value of $T_{e,ped}$
predicted using the ETG model on the density ratio
$T_{e,ped}$
predicted using the ETG model on the density ratio $n_{e,sep}/n_{e,ped}$
, which is a result of the stiffness of the ETG heat-flux clamping
$n_{e,sep}/n_{e,ped}$
, which is a result of the stiffness of the ETG heat-flux clamping $\eta _e$
to values not far above
$\eta _e$
to values not far above $\eta _{e,cr}$
as discussed in Field et al. (Reference Field, Chapman-Oplopoiou, Connor, Frassinetti, Hatch, Roach and Saarelma2023), causes the model to fail, i.e. never reaching marginal MHD stability, for some cases with higher values of this ratio. For this reason, this model, which does not use the EPED KBM constraint, has not been explored further.
$\eta _{e,cr}$
as discussed in Field et al. (Reference Field, Chapman-Oplopoiou, Connor, Frassinetti, Hatch, Roach and Saarelma2023), causes the model to fail, i.e. never reaching marginal MHD stability, for some cases with higher values of this ratio. For this reason, this model, which does not use the EPED KBM constraint, has not been explored further.
M2: results from applying model M2 to one of the pulses from the isotope mass scan dataset discussed here (no. 96202), at a low gas fuelling rate of $\varGamma _{gas} \sim 0.74 \times 10^{22}\,\textrm{es}^{-1}$
, are shown in figure 5(a–d). Both the predicted
$\varGamma _{gas} \sim 0.74 \times 10^{22}\,\textrm{es}^{-1}$
, are shown in figure 5(a–d). Both the predicted $T_e$
profile from the standard EPED and from the combined model M2 are shown for four different density profiles with the same
$T_e$
profile from the standard EPED and from the combined model M2 are shown for four different density profiles with the same $n_{e,ped}$
, which explore the dependence of the predicted
$n_{e,ped}$
, which explore the dependence of the predicted $T_{e,ped}$
on the density ratio
$T_{e,ped}$
on the density ratio $n_{e,sep}/n_{e,ped}$
.
$n_{e,sep}/n_{e,ped}$
.

Figure 5.
Pedestal profiles for the D pulse no. 96202 at the low fuelling rate of $\varGamma _{gas} \sim 0.74 \times 10^{22}\,\textrm{es}^{-1}$
showing
$\varGamma _{gas} \sim 0.74 \times 10^{22}\,\textrm{es}^{-1}$
showing $n_e$
(green),
$n_e$
(green), $T_e$
(red) and
$T_e$
(red) and $T_i$
(black) vs normalised poloidal flux
$T_i$
(black) vs normalised poloidal flux $\psi _N$
from various EPED based models. Experimental profile fits are shown by the ‘dotted’ lines with the error bars. Profiles are shown in (a) calculated using standard EPED (‘dashed’ lines) and from the combined ETG + EPED model (M2) (‘solid’ lines). In (b–d) the
$\psi _N$
from various EPED based models. Experimental profile fits are shown by the ‘dotted’ lines with the error bars. Profiles are shown in (a) calculated using standard EPED (‘dashed’ lines) and from the combined ETG + EPED model (M2) (‘solid’ lines). In (b–d) the $n_e$
profile is shifted outwards by
$n_e$
profile is shifted outwards by $\delta _n = \varDelta _{p}/2$
, with
$\delta _n = \varDelta _{p}/2$
, with $T_e$
calculated using the ETG model; in (c) the
$T_e$
calculated using the ETG model; in (c) the $n_e$
profile asymptotes to
$n_e$
profile asymptotes to $0.5 \times n_{e,sep}$
outside the separatrix; in (d) the
$0.5 \times n_{e,sep}$
outside the separatrix; in (d) the $n_e$
profile asymptotes instead to
$n_e$
profile asymptotes instead to $0.7 \times n_{e,sep}$
. In (e, f), the
$0.7 \times n_{e,sep}$
. In (e, f), the $n_e$
profile is calculated using the DP model of Saarelma et al. (Reference Saarelma, Connor, Bilkova, Bohm, Field, Frassinetti, Fridstrom, Kirk and Contributors2023), the
$n_e$
profile is calculated using the DP model of Saarelma et al. (Reference Saarelma, Connor, Bilkova, Bohm, Field, Frassinetti, Fridstrom, Kirk and Contributors2023), the $T_e$
profile is calculated using the ETG model and
$T_e$
profile is calculated using the ETG model and $T_i$
is determined for consistency with the EPED prediction of
$T_i$
is determined for consistency with the EPED prediction of $p_{tot}$
; in (e) with coefficient
$p_{tot}$
; in (e) with coefficient $C_{KBM} = 0$
and in (d) with
$C_{KBM} = 0$
and in (d) with $C_{KBM} = 0.3$
.
$C_{KBM} = 0.3$
.
For the first case (a) following the standard EPED, the $n_e$
profile position is at
$n_e$
profile position is at $\varDelta _{n_e}/2$
inside the separatrix and the profile asymptotes to the experimental
$\varDelta _{n_e}/2$
inside the separatrix and the profile asymptotes to the experimental $n_{e,sep}$
outside the separatrix. This results in too low a predicted
$n_{e,sep}$
outside the separatrix. This results in too low a predicted $T_e$
from the ETG model, which is has to be compensated by too high values of
$T_e$
from the ETG model, which is has to be compensated by too high values of $T_i$
required to match the predicted
$T_i$
required to match the predicted $p_{tot}$
from EPED. Note that for the pulses in the dataset discussed here, the experimental values of
$p_{tot}$
from EPED. Note that for the pulses in the dataset discussed here, the experimental values of $T_i \sim T_e$
in the pedestal region, although relatively large uncertainties preclude a detailed comparison with our predictions.
$T_i \sim T_e$
in the pedestal region, although relatively large uncertainties preclude a detailed comparison with our predictions.
For the other cases (b–c), the $n_e$
profiles are shifted outwards by
$n_e$
profiles are shifted outwards by $\varDelta _{n_e}/2$
from the standard EFIT case (a), i.e. the centre position is located at the separatrix. In case (b), this shift increases the ratio
$\varDelta _{n_e}/2$
from the standard EFIT case (a), i.e. the centre position is located at the separatrix. In case (b), this shift increases the ratio $n_{e,sep}/n_{e,ped}$
, resulting in similarly too low values of
$n_{e,sep}/n_{e,ped}$
, resulting in similarly too low values of $T_e$
and too high values of
$T_e$
and too high values of $T_i$
, as for case (a). In case (c and d), the asymptotic value of
$T_i$
, as for case (a). In case (c and d), the asymptotic value of $n_e$
outside the separatrix is reduced to
$n_e$
outside the separatrix is reduced to $0.5 \times n_{e,sep}$
and
$0.5 \times n_{e,sep}$
and $0.7 \times n_{e,sep}$
, respectively. For the lowest resulting ratio
$0.7 \times n_{e,sep}$
, respectively. For the lowest resulting ratio $n_{e,sep}/n_{e,ped}$
of case (c), the predicted
$n_{e,sep}/n_{e,ped}$
of case (c), the predicted $T_e$
profile is the closest to the experimental profile and the predicted
$T_e$
profile is the closest to the experimental profile and the predicted $T_i$
profile closest to
$T_i$
profile closest to $T_e$
, although still considerably higher.
$T_e$
, although still considerably higher.
Results from applying model M2 to the full isotope mass scan dataset are shown in figures 6, 7 and 8, which compare the calculated $T_{e,ped}$
,
$T_{e,ped}$
, $n_{e,ped}$
and
$n_{e,ped}$
and $\varDelta _{p}$
from the standard EPED and from the various combined models with the experimental values, respectively. The most accurate predictions of
$\varDelta _{p}$
from the standard EPED and from the various combined models with the experimental values, respectively. The most accurate predictions of $T_{e,ped}$
are for case (d). However, for this case, the predicted pedestal widths
$T_{e,ped}$
are for case (d). However, for this case, the predicted pedestal widths $\varDelta _{p}$
are wider than the experimental values. For these pulses, the standard EPED predicts quite constant values of
$\varDelta _{p}$
are wider than the experimental values. For these pulses, the standard EPED predicts quite constant values of $\varDelta _{p}$
, which are mostly narrower than the experimental widths. Note that the values of
$\varDelta _{p}$
, which are mostly narrower than the experimental widths. Note that the values of $n_{e,ped}$
shown in figure 7(a–d) from model M2, which takes
$n_{e,ped}$
shown in figure 7(a–d) from model M2, which takes $n_{e,ped}$
as an input, differ slightly from the experimental values because the former are obtained from a fit to the analytic model profile rather than from a fit to the experimental data.
$n_{e,ped}$
as an input, differ slightly from the experimental values because the former are obtained from a fit to the analytic model profile rather than from a fit to the experimental data.

Figure 6.
Predicted values of the pedestal electron temperature $T_{e,ped}^{calc}$
vs experimental values
$T_{e,ped}^{calc}$
vs experimental values $T_{e,ped}^{exp}$
, with
$T_{e,ped}^{exp}$
, with $T_{e,ped}^{calc}$
calculated using the standard EPED model (
$T_{e,ped}^{calc}$
calculated using the standard EPED model (
![]() ) and from each of the various EPED based pedestal models (
) and from each of the various EPED based pedestal models (
![]() ) corresponding to the same model cases as in figure
5
(a–f) above, each for all of the
) corresponding to the same model cases as in figure
5
(a–f) above, each for all of the $2.0\,\textrm {MA}$
pulses from the isotope mass and fuelling rate scans in
table 1
.
$2.0\,\textrm {MA}$
pulses from the isotope mass and fuelling rate scans in
table 1
.

Figure 7.
Predicted values of the pedestal density $n_{e,ped}^{calc}$
vs experimental values
$n_{e,ped}^{calc}$
vs experimental values $n_{e,ped}^{exp}$
from each of the various EPED based pedestal models (
$n_{e,ped}^{exp}$
from each of the various EPED based pedestal models (
![]() ) corresponding to the same model cases as in figure
5
(a–f) above, each for all of the
) corresponding to the same model cases as in figure
5
(a–f) above, each for all of the $2.0\,\textrm {MA}$
pulses from the isotope mass and fuelling rate scans in table
1
.
$2.0\,\textrm {MA}$
pulses from the isotope mass and fuelling rate scans in table
1
.
For all of the cases modelled here, we do not take into account the variation of $(D_e/\chi _e)_{TG}$
with
$(D_e/\chi _e)_{TG}$
with $A_{\textit{eff}}$
. A value of the heat-to-particle diffusivity ratio
$A_{\textit{eff}}$
. A value of the heat-to-particle diffusivity ratio $(D_e/\chi _e)_{TG} = 0.3\dot {3}$
is assumed in the DP model, which is appropriate for the mid-range value
$(D_e/\chi _e)_{TG} = 0.3\dot {3}$
is assumed in the DP model, which is appropriate for the mid-range value $A_{\textit{eff}} = 2.5$
over the D:T isotope-mix scan. Results of GK simulations reported in Predebon et al. (Reference Predebon, Hatch, Frassinetti, Horvath, Saarelma, Chapman-Oplopoiou, Görler, Maggi and Contributors2023) for JET-Be/W pulses with different values of
$A_{\textit{eff}} = 2.5$
over the D:T isotope-mix scan. Results of GK simulations reported in Predebon et al. (Reference Predebon, Hatch, Frassinetti, Horvath, Saarelma, Chapman-Oplopoiou, Görler, Maggi and Contributors2023) for JET-Be/W pulses with different values of $A_{\textit{eff}}$
, found values of
$A_{\textit{eff}}$
, found values of $(D_e/\chi _e)_{TG}$
of
$(D_e/\chi _e)_{TG}$
of $0.5 \rightarrow 0.25$
over the range of
$0.5 \rightarrow 0.25$
over the range of $A_{\textit{eff}} = 2 \rightarrow 3$
, i.e. a decreasing relative level of particle to heat transport with increasing
$A_{\textit{eff}} = 2 \rightarrow 3$
, i.e. a decreasing relative level of particle to heat transport with increasing $A_{\textit{eff}}$
. As discussed in Appendix C below, the sensitivity of the calculated
$A_{\textit{eff}}$
. As discussed in Appendix C below, the sensitivity of the calculated $n_{e,ped}$
from the DP model prediction to
$n_{e,ped}$
from the DP model prediction to $(D_e/\chi _e)_{TG}$
is quite weak. For an example JET-Be/W case (no. 96201), doubling
$(D_e/\chi _e)_{TG}$
is quite weak. For an example JET-Be/W case (no. 96201), doubling $(D_e/\chi _e)_{TG}$
from
$(D_e/\chi _e)_{TG}$
from $0.25 \rightarrow 0.5$
is found to decrease the predicted
$0.25 \rightarrow 0.5$
is found to decrease the predicted $n_{e,ped}$
by only
$n_{e,ped}$
by only ${\sim} 12\,\%$
.
${\sim} 12\,\%$
.
M3: results from applying model M3, which combines the density pedestal prediction model of Saarelma et al. (Reference Saarelma, Connor, Bilkova, Bohm, Field, Frassinetti, Fridstrom, Kirk and Contributors2023), the ETG critical-heat-flux model and the EPED KBM constraint, to profiles from the D pulse no. 96202 are shown in plots (e, f) of figure 5 and to the full dataset of pulses in table 1 in plots (e, f) of figures 6, 7 and 8.

Figure 8.
Predicted values of the pedestal width $\varDelta _{p}^{calc}$
vs experimental values
$\varDelta _{p}^{calc}$
vs experimental values $\varDelta _{p}^{exp}$
, with
$\varDelta _{p}^{exp}$
, with $\varDelta _{p}^{calc}$
calculated using the standard EPED (
$\varDelta _{p}^{calc}$
calculated using the standard EPED (
![]() ) model and from each of the various EPED based pedestal models (
) model and from each of the various EPED based pedestal models (
![]() ) corresponding to the same model cases as in figure
5
(a–f) above, each for all of the
) corresponding to the same model cases as in figure
5
(a–f) above, each for all of the $2.0\,\textrm {MA}$
pulses from the isotope mass and fuelling rate scans in table
1
.
$2.0\,\textrm {MA}$
pulses from the isotope mass and fuelling rate scans in table
1
.
The difference between the two cases is the value of the KBM coefficient $C_{KBM}$
, which is set to 0 and 0.3 for plots (e) and (f), respectively. This coefficient is a multiplier on the contribution to the particle diffusivity from KBM modes (
$C_{KBM}$
, which is set to 0 and 0.3 for plots (e) and (f), respectively. This coefficient is a multiplier on the contribution to the particle diffusivity from KBM modes ( $D_{KBM} = C_{KBM} (\alpha -\alpha _{cr}), \alpha \gt \alpha _{cr}$
). Hence, for
$D_{KBM} = C_{KBM} (\alpha -\alpha _{cr}), \alpha \gt \alpha _{cr}$
). Hence, for $C_{KBM} \gt 0$
, KBM modes can contribute to particle transport if
$C_{KBM} \gt 0$
, KBM modes can contribute to particle transport if $\alpha \gt \alpha _{cr}$
but not if
$\alpha \gt \alpha _{cr}$
but not if $C_{KBM} = 0$
. The similarity between the results shown for these two cases show that KBM modes are not predicted to contribute significantly to particle transport across the pedestal for these cases.
$C_{KBM} = 0$
. The similarity between the results shown for these two cases show that KBM modes are not predicted to contribute significantly to particle transport across the pedestal for these cases.
The overall agreement between the predicted pedestal $T_e$
profiles from model M3 and the experimental profiles is the best of those from the three combined models, with a slight improvement over the standard EPED predictions. Both the predicted
$T_e$
profiles from model M3 and the experimental profiles is the best of those from the three combined models, with a slight improvement over the standard EPED predictions. Both the predicted $n_{e,ped}$
and
$n_{e,ped}$
and $T_{e,ped}$
generally agree well (within
$T_{e,ped}$
generally agree well (within ${\sim} \pm \,\%10$
) with the experimental values.
${\sim} \pm \,\%10$
) with the experimental values.
Although both the predicted $n_{e,ped}$
and
$n_{e,ped}$
and $T_{e,ped}$
increase with the experimental values, the predicted values of
$T_{e,ped}$
increase with the experimental values, the predicted values of $T_{e,ped}$
tend to increase faster than linearly, while the predicted
$T_{e,ped}$
tend to increase faster than linearly, while the predicted $n_{e,ped}$
, increase more slowly. Including the dependence of
$n_{e,ped}$
, increase more slowly. Including the dependence of $(D_e/\chi _e)_{TG}$
on
$(D_e/\chi _e)_{TG}$
on $A_{\textit{eff}}$
rather than assuming the constant value of
$A_{\textit{eff}}$
rather than assuming the constant value of $0.3\dot {3}$
would likely improve the degree of agreement between the calculated and experimental values of
$0.3\dot {3}$
would likely improve the degree of agreement between the calculated and experimental values of $n_{e,ped}$
.
$n_{e,ped}$
.
The predicted pedestal widths $\varDelta _{p}$
are of approximately the correct magnitude, however, these exhibit an opposite trend to the experimental values, i.e. smaller widths are predicted for wider experimental pedestals.
$\varDelta _{p}$
are of approximately the correct magnitude, however, these exhibit an opposite trend to the experimental values, i.e. smaller widths are predicted for wider experimental pedestals.
7. Conclusions
The fact that the model described in § 2 for the pedestal electron temperature profile is able to predict the electron temperature at the top of the density pedestal $T_e(\psi _N^{n_{e,top}})$
with reasonable veracity across these scans of effective isotope mass
$T_e(\psi _N^{n_{e,top}})$
with reasonable veracity across these scans of effective isotope mass $A_{\textit{eff}}$
and gas fuelling rate, supports the underlying assumption of the model that the electron heat transport across this region of the pedestal is dominated by turbulent heat transport due to ETG modes. The S-ETG turbulence prevailing in a regime with a strong density gradient exhibits a critical threshold in the parameter
$A_{\textit{eff}}$
and gas fuelling rate, supports the underlying assumption of the model that the electron heat transport across this region of the pedestal is dominated by turbulent heat transport due to ETG modes. The S-ETG turbulence prevailing in a regime with a strong density gradient exhibits a critical threshold in the parameter $\eta _e$
, rather than of
$\eta _e$
, rather than of $R/L_{n_e}$
, which results in the
$R/L_{n_e}$
, which results in the $T_e$
profile being intimately related to the
$T_e$
profile being intimately related to the $n_e$
profile.
$n_e$
profile.
Currently, the model is based on the simple scaling of the gyro-Bohm normalised electron heat flux of (2.1) with $\eta _e$
alone. As the electron gyro-Bohm normalisation depends only on the local
$\eta _e$
alone. As the electron gyro-Bohm normalisation depends only on the local $T_e$
gradient scale length
$T_e$
gradient scale length $L_{T_e}$
, the magnetic field
$L_{T_e}$
, the magnetic field $B$
and the electron mass
$B$
and the electron mass $m_e$
, this scaling is independent of the ion mass and hence exhibits no dependence on
$m_e$
, this scaling is independent of the ion mass and hence exhibits no dependence on $A_{\textit{eff}}$
. The agreement of the predicted
$A_{\textit{eff}}$
. The agreement of the predicted $T_e$
at the top of the density pedestal
$T_e$
at the top of the density pedestal $T_e(\psi _N^{n_{e,top}})$
across the effective isotopic mass
$T_e(\psi _N^{n_{e,top}})$
across the effective isotopic mass $A_{\textit{eff}}$
scan data set results purely as a consequence of the electron heat transport responding to changes to the density profile occurring with the change in
$A_{\textit{eff}}$
scan data set results purely as a consequence of the electron heat transport responding to changes to the density profile occurring with the change in $A_{\textit{eff}}$
, which can affect the relative level of electron particle compared with heat transport, e.g. as has been found in the recent study of Predebon et al. (Reference Predebon, Hatch, Frassinetti, Horvath, Saarelma, Chapman-Oplopoiou, Görler, Maggi and Contributors2023).
$A_{\textit{eff}}$
, which can affect the relative level of electron particle compared with heat transport, e.g. as has been found in the recent study of Predebon et al. (Reference Predebon, Hatch, Frassinetti, Horvath, Saarelma, Chapman-Oplopoiou, Görler, Maggi and Contributors2023).
As can be seen e.g. from figure 1(d), the adopted electron heat flux-scaling tends to over-/under-predict $R/L_{T_e}$
outside/inside the mid-pedestal location for which the scaling was derived. Although these effects largely compensate, resulting in a reasonable prediction of
$R/L_{T_e}$
outside/inside the mid-pedestal location for which the scaling was derived. Although these effects largely compensate, resulting in a reasonable prediction of $T_e(\psi _N^{n_{e,top}})$
, this indicates that this scaling is probably over simplified. It is likely that other parameters are also relevant in controlling the electron heat transport, e.g. the magnetic shear
$T_e(\psi _N^{n_{e,top}})$
, this indicates that this scaling is probably over simplified. It is likely that other parameters are also relevant in controlling the electron heat transport, e.g. the magnetic shear $\hat {s}$
, which increases strongly towards the separatrix.
$\hat {s}$
, which increases strongly towards the separatrix.
The value of $T_{e,ped}$
, which is determined from the
$T_{e,ped}$
, which is determined from the $\mathrm{mtanh()}$
fit to the
$\mathrm{mtanh()}$
fit to the $T_e$
profile, is always higher than that at the density pedestal top
$T_e$
profile, is always higher than that at the density pedestal top $T_e(\psi _N^{n_{e,top}})$
, which in turn is a consequence of the inward shift of the pedestal
$T_e(\psi _N^{n_{e,top}})$
, which in turn is a consequence of the inward shift of the pedestal $T_e$
profile with respect to the
$T_e$
profile with respect to the $n_e$
profile. This shift is actually a consequence of the underlying turbulent electron heat transport requiring that
$n_e$
profile. This shift is actually a consequence of the underlying turbulent electron heat transport requiring that $\eta _e$
exceed a value
$\eta _e$
exceed a value $\mathcal O \textrm {(2)}$
to be able to carry the imposed heat flux
$\mathcal O \textrm {(2)}$
to be able to carry the imposed heat flux $q_e$
across the pedestal. Note that for
$q_e$
across the pedestal. Note that for $\eta _e = 1$
, the profiles of
$\eta _e = 1$
, the profiles of $R/L_{T_e}$
and
$R/L_{T_e}$
and $R/L_{n_e}$
are identical and there is no relative shift between the
$R/L_{n_e}$
are identical and there is no relative shift between the $T_e$
and
$T_e$
and $n_e$
profiles, while for
$n_e$
profiles, while for $\eta _e \gt 1$
the resulting
$\eta _e \gt 1$
the resulting $T_e$
profile is shifted inwards with respect to the
$T_e$
profile is shifted inwards with respect to the $n_e$
profile and vice versa.
$n_e$
profile and vice versa.
The higher values of $T_{e,ped}$
than
$T_{e,ped}$
than $T_e(\psi _N^{n_{e,top}})$
are a consequence of
$T_e(\psi _N^{n_{e,top}})$
are a consequence of $T_e$
continuing to increase across the weak-density gradient region inside the density pedestal top. In this region, the assumed heat-flux scaling of (2.1) is invalid, resulting in an under-prediction of
$T_e$
continuing to increase across the weak-density gradient region inside the density pedestal top. In this region, the assumed heat-flux scaling of (2.1) is invalid, resulting in an under-prediction of $R/L_{T_e}$
, i.e. an over-prediction of the resulting electron heat flux. The findings of several of the pedestal GK studies discussed in § 5 that other modes than S-ETG modes are dominant in this region, implies that the electron heat transport is unlikely to be governed by
$R/L_{T_e}$
, i.e. an over-prediction of the resulting electron heat flux. The findings of several of the pedestal GK studies discussed in § 5 that other modes than S-ETG modes are dominant in this region, implies that the electron heat transport is unlikely to be governed by $\eta _e$
. This hypothesis is consistent with the expression proposed in Jenko et al. (Reference Jenko, Dorland and Hammett2001) for the critical threshold for ETG turbulence, which implies that
$\eta _e$
. This hypothesis is consistent with the expression proposed in Jenko et al. (Reference Jenko, Dorland and Hammett2001) for the critical threshold for ETG turbulence, which implies that $R/L_{T_e,cr}$
is independent of
$R/L_{T_e,cr}$
is independent of $R/L_{n_e}$
when the density gradient is weak.
$R/L_{n_e}$
when the density gradient is weak.
The critical role of the pedestal density profile in largely determining the electron temperature profile, means that in order to be able to predict $T_{e,ped}$
, any stand-alone model for the
$T_{e,ped}$
, any stand-alone model for the $T_e$
profile must also incorporate a model for the density profile. A recent model for the pedestal density profile by Saarelma et al. (Reference Saarelma, Connor, Bilkova, Bohm, Field, Frassinetti, Fridstrom, Kirk and Contributors2023), which is a refinement of the ionisation/diffusion model of Groebner et al. (Reference Groebner, Mahdavi, Leonard, Osborne, Porter, Colchin and Owen2002), extended to include a self-consistent population of charge-exchange neutral atoms.
$T_e$
profile must also incorporate a model for the density profile. A recent model for the pedestal density profile by Saarelma et al. (Reference Saarelma, Connor, Bilkova, Bohm, Field, Frassinetti, Fridstrom, Kirk and Contributors2023), which is a refinement of the ionisation/diffusion model of Groebner et al. (Reference Groebner, Mahdavi, Leonard, Osborne, Porter, Colchin and Owen2002), extended to include a self-consistent population of charge-exchange neutral atoms.
This model has been tested against the EUROFusion Pedestal Database (Frassinetti et al. Reference Frassinetti2021) and is found, in particular, to be able to reproduce the observed increase in $n_{e,ped}$
with isotope mass
$n_{e,ped}$
with isotope mass $A_{\textit{eff}}$
. This arises primarily from the strong sensitivity of the predicted
$A_{\textit{eff}}$
. This arises primarily from the strong sensitivity of the predicted $n_{e,ped}$
to the assumed value of
$n_{e,ped}$
to the assumed value of $n_{e,sep}$
, which is an input to the model, the former increasing with the latter. However, to reproduce the observations accurately, it was also necessary to adjust the assumed ratio of electron particle diffusivity to electron heat conductivity (
$n_{e,sep}$
, which is an input to the model, the former increasing with the latter. However, to reproduce the observations accurately, it was also necessary to adjust the assumed ratio of electron particle diffusivity to electron heat conductivity ( $D_e/\chi _e)$
, by decreasing this ratio with increasing
$D_e/\chi _e)$
, by decreasing this ratio with increasing $A_{\textit{eff}}$
(from 1 in H to 0.5 in D and 0.25 in T) (Saarelma et al. Reference Saarelma, Connor, Bilkova, Bohm, Field, Frassinetti, Fridstrom, Kirk and Contributors2023), broadly consistent with the trends found in the study of Predebon et al. (Reference Predebon, Hatch, Frassinetti, Horvath, Saarelma, Chapman-Oplopoiou, Görler, Maggi and Contributors2023).
$A_{\textit{eff}}$
(from 1 in H to 0.5 in D and 0.25 in T) (Saarelma et al. Reference Saarelma, Connor, Bilkova, Bohm, Field, Frassinetti, Fridstrom, Kirk and Contributors2023), broadly consistent with the trends found in the study of Predebon et al. (Reference Predebon, Hatch, Frassinetti, Horvath, Saarelma, Chapman-Oplopoiou, Görler, Maggi and Contributors2023).
Hence, the boundary conditions at the separatrix, $T_{e,sep}$
and in particular
$T_{e,sep}$
and in particular $n_{e,sep}$
, are critical for determining both the electron density and temperature profiles across the pedestal, which are determined by heat and particle transport in the SOL, rather than details of transport processes within the confined plasma. The main control parameters determining
$n_{e,sep}$
, are critical for determining both the electron density and temperature profiles across the pedestal, which are determined by heat and particle transport in the SOL, rather than details of transport processes within the confined plasma. The main control parameters determining $T_{e,sep}$
and
$T_{e,sep}$
and $n_{e,sep}$
are the heat and particle fluxes into the SOL, although these also depend on the geometry of the SOL, i.e. the plasma shape and on the divertor configuration. Hence, as is well appreciated by machine operators, the plasma heating and fuelling are the principal means for influencing the pedestal parameters.
$n_{e,sep}$
are the heat and particle fluxes into the SOL, although these also depend on the geometry of the SOL, i.e. the plasma shape and on the divertor configuration. Hence, as is well appreciated by machine operators, the plasma heating and fuelling are the principal means for influencing the pedestal parameters.
Three different numerical pedestal models, combining EPED with the ETG heat-flux model of Field et al. (Reference Field, Chapman-Oplopoiou, Connor, Frassinetti, Hatch, Roach and Saarelma2023) discussed here, have been tested against the isotope and fuelling rate scan dataset discussed here. The first two models take $n_{e,ped}$
as an input, while the third combines EPED, the ETG heat-flux model and the DP model of Saarelma et al. (Reference Saarelma, Connor, Bilkova, Bohm, Field, Frassinetti, Fridstrom, Kirk and Contributors2023). The first model, which does not use the EPED KBM constraint, fails on many cases due to the strong dependence of the predicted
$n_{e,ped}$
as an input, while the third combines EPED, the ETG heat-flux model and the DP model of Saarelma et al. (Reference Saarelma, Connor, Bilkova, Bohm, Field, Frassinetti, Fridstrom, Kirk and Contributors2023). The first model, which does not use the EPED KBM constraint, fails on many cases due to the strong dependence of the predicted $T_{e,ped}$
from the ETG model on
$T_{e,ped}$
from the ETG model on $n_{e,sep}/n_{e,ped}$
. The second model, which uses the KBM constraint (
$n_{e,sep}/n_{e,ped}$
. The second model, which uses the KBM constraint ( $p_{tot} \propto \varDelta _{p}^2$
), provides predictions of both the
$p_{tot} \propto \varDelta _{p}^2$
), provides predictions of both the $T_e$
profile from the ETG model and the
$T_e$
profile from the ETG model and the $T_i$
profile by matching the total pressure
$T_i$
profile by matching the total pressure $p_{tot}$
. The third model, which provides a full prediction of the pedestal profiles, exhibits a reasonable agreement between the model predictions and experiment, implying that this model encapsulates the main physics underlying the pedestal structure.
$p_{tot}$
. The third model, which provides a full prediction of the pedestal profiles, exhibits a reasonable agreement between the model predictions and experiment, implying that this model encapsulates the main physics underlying the pedestal structure.
It is illuminating to determine the scaling of $n_{e,sep}$
with the power crossing the separatrix in the electron channel
$n_{e,sep}$
with the power crossing the separatrix in the electron channel $P_{e,sep}$
and the electron particle fuelling rate into the SOL
$P_{e,sep}$
and the electron particle fuelling rate into the SOL $\varGamma _{e}$
for the admittedly grossly over simplified case of a a collisionless SOL, which is sheath limited at the divertor target. This can be derived from the simple two-point model of Stangeby (Reference Stangeby2000), as described in Appendix B, which predicts that
$\varGamma _{e}$
for the admittedly grossly over simplified case of a a collisionless SOL, which is sheath limited at the divertor target. This can be derived from the simple two-point model of Stangeby (Reference Stangeby2000), as described in Appendix B, which predicts that $n_{e,sep}$
should increase with isotope mass
$n_{e,sep}$
should increase with isotope mass $\propto A_{\textit{eff}}^{1/2}$
and also with the particle fuelling rate into the SOL
$\propto A_{\textit{eff}}^{1/2}$
and also with the particle fuelling rate into the SOL $\propto \varGamma _{e}^{3/2}$
and decrease with the loss power across the separatrix
$\propto \varGamma _{e}^{3/2}$
and decrease with the loss power across the separatrix $\propto P_{sep}^{-1/2}$
.
$\propto P_{sep}^{-1/2}$
.
Note that an extension of this 2-point model to incorporate the temperature dependence of the parallel electron heat conductivity $\kappa _\parallel \propto T_e^{5/2}$
predicts a very weak power scaling for
$\kappa _\parallel \propto T_e^{5/2}$
predicts a very weak power scaling for $T_{e,sep} \propto P_{sep}^{2/7}$
. Hence, the influence of the loss power on the pedestal due to changes to the separatrix boundary conditions is stronger through its effect on
$T_{e,sep} \propto P_{sep}^{2/7}$
. Hence, the influence of the loss power on the pedestal due to changes to the separatrix boundary conditions is stronger through its effect on $n_{e,sep}$
than through its effect on
$n_{e,sep}$
than through its effect on $T_{e,sep}$
. Note that modelling of JET-Be/W plasmas with neon impurity seeding described in Simpson et al. (Reference Simpson, Moulton, Giroud, Groth, Corrigan and Contributors2019) demonstrated agreement between the scaling
$T_{e,sep}$
. Note that modelling of JET-Be/W plasmas with neon impurity seeding described in Simpson et al. (Reference Simpson, Moulton, Giroud, Groth, Corrigan and Contributors2019) demonstrated agreement between the scaling $T_{e,sep} \propto P_{sep}^{2/7}$
with the results of simulations using the EDGE2D-EIRENE code (Reiter et al. Reference Reiter, May, Coster and Schneider1995), provided the dependence of
$T_{e,sep} \propto P_{sep}^{2/7}$
with the results of simulations using the EDGE2D-EIRENE code (Reiter et al. Reference Reiter, May, Coster and Schneider1995), provided the dependence of $\lambda _q$
, the characteristic decay length of the parallel heat flux across the SOL, on the density and radiation in the SOL was taken into account.
$\lambda _q$
, the characteristic decay length of the parallel heat flux across the SOL, on the density and radiation in the SOL was taken into account.
This over-simplified scaling would predict an increase in $n_{e,sep}$
by a factor
$n_{e,sep}$
by a factor ${\sim} 1.2$
changing isotope alone from D to T, which is less than the observed increase of a factor
${\sim} 1.2$
changing isotope alone from D to T, which is less than the observed increase of a factor ${\sim} 1.6$
at constant
${\sim} 1.6$
at constant $\varGamma _{gas}$
as shown in figure 2(b). However, this ‘toy’ model does illustrate how SOL physics can influence the boundary conditions at the separatrix and hence indirectly govern the pedestal structure. Of course, realistic simulations require much more complex two-dimensional models, such as the coupled fluid and Monte Carlo neutrals simulation code EDGE2D-EIRENE (Reiter et al. Reference Reiter, May, Coster and Schneider1995), to account for the complex processes occurring in a high-density, recycling SOL and particularly with a detached divertor where impurity and molecular radiation and charge-exchange heat and momentum losses play a dominant role.
$\varGamma _{gas}$
as shown in figure 2(b). However, this ‘toy’ model does illustrate how SOL physics can influence the boundary conditions at the separatrix and hence indirectly govern the pedestal structure. Of course, realistic simulations require much more complex two-dimensional models, such as the coupled fluid and Monte Carlo neutrals simulation code EDGE2D-EIRENE (Reiter et al. Reference Reiter, May, Coster and Schneider1995), to account for the complex processes occurring in a high-density, recycling SOL and particularly with a detached divertor where impurity and molecular radiation and charge-exchange heat and momentum losses play a dominant role.
Acknowledgements
This work has been carried out within the framework of the EUROfusion Consortium, funded by the European Union via the Euratom Research and Training Programme (Grant Agreement No. 101052200 – EUROfusion) and from the EPSRC (grant number EP/W006839/1). The data that support the findings of this study are openly available in the Open Data Register at https://doi.org/10.14468/tcey-2p41, reference number 2026-03-03-14-04-44-640878. To obtain further information on the data and models underlying this paper please contact PublicationsManager@ukaea.uk. Views and opinions expressed are, however, those of the author(s) only and do not necessarily reflect those of the European Union or the European Commission. Neither the European Union nor the European Commission can be held responsible for them.
Editor Eleonora Viezzer thanks the referees for their advice in evaluating this article.
Declaration of interests
The authors report no conflicts of interest.
Appendix A. Parameters of JET-Be/W experimental cases
See table 1.
Table 1.
Parameters of the $2.0\,\textrm {MA}$
JET-Be/W H-mode pulses and the corresponding fitted pedestal profile data files (PPFs): pulse number, PPF number, averaging time period
$2.0\,\textrm {MA}$
JET-Be/W H-mode pulses and the corresponding fitted pedestal profile data files (PPFs): pulse number, PPF number, averaging time period $t_0-t_1$
, effective isotope mass
$t_0-t_1$
, effective isotope mass $A_{\textit{eff}}$
, gas fuelling rate
$A_{\textit{eff}}$
, gas fuelling rate $\varGamma _{gas}$
, absorbed heating power
$\varGamma _{gas}$
, absorbed heating power $P_{abs}$
, radiated power from confined plasma
$P_{abs}$
, radiated power from confined plasma $P_{Rad}^{iELM}$
, time-averaged ELM loss power
$P_{Rad}^{iELM}$
, time-averaged ELM loss power $\langle P_{ELM} \rangle$
, averaged conducted power across the pedestal between ELMs
$\langle P_{ELM} \rangle$
, averaged conducted power across the pedestal between ELMs $P_{sep}^{iELM}$
and average ELM frequency
$P_{sep}^{iELM}$
and average ELM frequency $f_{ELM}$
. Note that for some pulses the multiple PPFs correspond to different time periods during the pulse. Cases for which the ELM frequency is particularly high (
$f_{ELM}$
. Note that for some pulses the multiple PPFs correspond to different time periods during the pulse. Cases for which the ELM frequency is particularly high ( $f_{ELM} \gt 70\,\textrm {Hz}$
), for which values of
$f_{ELM} \gt 70\,\textrm {Hz}$
), for which values of $P_{sep}^{iELM}$
are likely to be more uncertain, are in bold font.
$P_{sep}^{iELM}$
are likely to be more uncertain, are in bold font.

Appendix B. Physics basis of the combined ETG+DP pedestal model (M3)
The predictive density pedestal model of Saarelma et al. (Reference Saarelma, Connor, Bilkova, Bohm, Field, Frassinetti, Fridstrom, Kirk and Contributors2023, Reference Saarelma2024) is based on an analytic model of neutral penetration combined with a model for diffusive pedestal transport. The neutral-penetration model is an extension of the model of Groebner et al. (Reference Groebner, Mahdavi, Leonard, Osborne, Wolf, Porter, Stangeby, Brooks, Colchin and Owen2003) to include the ionisation source of hot, charge-exchange hydrogenic neutral atoms, as well as that of lower energy, Franck–Condon atoms from molecular dissociation. A diffusion model for the charge-exchange neutral penetration becomes valid when $\sigma _{CX} v_{th,i} \gt\!\!\gt \sigma _i v_{th,e}$
(where
$\sigma _{CX} v_{th,i} \gt\!\!\gt \sigma _i v_{th,e}$
(where $\sigma _{CX}$
and
$\sigma _{CX}$
and $\sigma _i$
are the charge-exchange and ionisation cross-sections, respectively, and
$\sigma _i$
are the charge-exchange and ionisation cross-sections, respectively, and $v_{th,i}$
and
$v_{th,i}$
and $v_{th,e}$
are the ion and electron thermal velocities), which is appropriate for higher pedestal temperatures
$v_{th,e}$
are the ion and electron thermal velocities), which is appropriate for higher pedestal temperatures $\gtrsim\!\mathcal O (1\,\textrm {keV})$
.
$\gtrsim\!\mathcal O (1\,\textrm {keV})$
.
In this model, the radial profile of the electron density $n_e(r)$
in the pedestal region is calculated by balancing radial particle diffusion, with coefficient
$n_e(r)$
in the pedestal region is calculated by balancing radial particle diffusion, with coefficient $D_{ped}(r)$
, against the source of electrons from the ionisation of neutral atoms. The neutral densities are modelled in turn by balancing their inward convection with ionisation and charge-exchange sources and sinks. The electron density profile is calculated from the solution of a one-dimensional differential equation for
$D_{ped}(r)$
, against the source of electrons from the ionisation of neutral atoms. The neutral densities are modelled in turn by balancing their inward convection with ionisation and charge-exchange sources and sinks. The electron density profile is calculated from the solution of a one-dimensional differential equation for $n_e(x)$
(where
$n_e(x)$
(where $x = r_{rep} - r$
, is the radial distance inwards from the separatrix), given by (17) and (18) of Saarelma et al. (Reference Saarelma, Connor, Bilkova, Bohm, Field, Frassinetti, Fridstrom, Kirk and Contributors2023).
$x = r_{rep} - r$
, is the radial distance inwards from the separatrix), given by (17) and (18) of Saarelma et al. (Reference Saarelma, Connor, Bilkova, Bohm, Field, Frassinetti, Fridstrom, Kirk and Contributors2023).
The total particle diffusion coefficient in the pedestal region $D_{ped}$
is made up from components due to KBM modes, temperature-gradient-driven ITG and/or ETG driven turbulence (TG) and NC transport, i.e.
$D_{ped}$
is made up from components due to KBM modes, temperature-gradient-driven ITG and/or ETG driven turbulence (TG) and NC transport, i.e. $D_{ped} = D_{KBM} +D_{TG} + D_{NC}$
. Simplified forms for
$D_{ped} = D_{KBM} +D_{TG} + D_{NC}$
. Simplified forms for $D_{KBM}$
,
$D_{KBM}$
, $D_{TG}$
and
$D_{TG}$
and $D_{NC}$
are given by (21)–(26) of Saarelma et al. (Reference Saarelma, Connor, Bilkova, Bohm, Field, Frassinetti, Fridstrom, Kirk and Contributors2023), in which the terms
$D_{NC}$
are given by (21)–(26) of Saarelma et al. (Reference Saarelma, Connor, Bilkova, Bohm, Field, Frassinetti, Fridstrom, Kirk and Contributors2023), in which the terms $(D_e/\chi _e)_{TG}$
,
$(D_e/\chi _e)_{TG}$
, $C_{KBM}$
and
$C_{KBM}$
and $\alpha _{cr}$
are adjustable parameters of the model. Here,
$\alpha _{cr}$
are adjustable parameters of the model. Here, $(D/\chi )_{TG}$
represents the ratio of particle to electron heat flux due to the temperature-gradient driven turbulence and
$(D/\chi )_{TG}$
represents the ratio of particle to electron heat flux due to the temperature-gradient driven turbulence and $C_{KBM}$
represents the strength of the KBM turbulence when the normalised pressure-gradient threshold
$C_{KBM}$
represents the strength of the KBM turbulence when the normalised pressure-gradient threshold $\alpha _{cr}$
is exceeded.
$\alpha _{cr}$
is exceeded.
Boundary conditions are also required to solve the one-dimensional differential equation for $n_e(x)$
. The separatrix density
$n_e(x)$
. The separatrix density $n_{e,sep}$
can be taken from the experiment by finding
$n_{e,sep}$
can be taken from the experiment by finding $n_e$
at the same location as the specified
$n_e$
at the same location as the specified $T_{e,sep}$
. Here we take the value
$T_{e,sep}$
. Here we take the value $T_{e,sep} = 100\,\textrm {eV}$
, but this can also be calculated using the 2-point model (Stangeby Reference Stangeby2000; Kallenbach et al. Reference Kallenbach, Asakura, Kirk, Korotkov, Mahdavi, Mossessian and Porter2005).
$T_{e,sep} = 100\,\textrm {eV}$
, but this can also be calculated using the 2-point model (Stangeby Reference Stangeby2000; Kallenbach et al. Reference Kallenbach, Asakura, Kirk, Korotkov, Mahdavi, Mossessian and Porter2005).
The density gradient at the separatrix is set to $dn_e/dx\rvert _{x=0} = - n_e/\sqrt {{D_{SOL}} \tau _{i,\parallel }}$
, where the particle diffusion coefficient
$dn_e/dx\rvert _{x=0} = - n_e/\sqrt {{D_{SOL}} \tau _{i,\parallel }}$
, where the particle diffusion coefficient $D_{SOL}$
, is calculated from (19) of Saarelma et al. (Reference Saarelma, Connor, Bilkova, Bohm, Field, Frassinetti, Fridstrom, Kirk and Contributors2023) at the separatrix and
$D_{SOL}$
, is calculated from (19) of Saarelma et al. (Reference Saarelma, Connor, Bilkova, Bohm, Field, Frassinetti, Fridstrom, Kirk and Contributors2023) at the separatrix and $\tau _{i,\parallel }$
is thermal ion free-streaming time along the field lines to the divertor. Finally, the FSA neutral particle density
$\tau _{i,\parallel }$
is thermal ion free-streaming time along the field lines to the divertor. Finally, the FSA neutral particle density $\left \langle n_{FC}(0) \right \rangle$
and the ratio of Franck–Condon to charge-exchange particle densities at the separatrix
$\left \langle n_{FC}(0) \right \rangle$
and the ratio of Franck–Condon to charge-exchange particle densities at the separatrix $({n_{FC}}/{n_{CX}})\rvert _{x=0}$
have to be specified.
$({n_{FC}}/{n_{CX}})\rvert _{x=0}$
have to be specified.
Tested against a pedestal database of JET-ILW Type I ELMy H-modes (Saarelma et al. Reference Saarelma, Connor, Bilkova, Bohm, Field, Frassinetti, Fridstrom, Kirk and Contributors2023), this model gave good agreement over a wide parameter range, when using the experimental $T_e$
profile as an input. Further tests for ASDEX Upgrade and MAST-U Type I ELMy H-modes also gave good agreement (Saarelma et al. Reference Saarelma2024), using the same model parameters used for JET-ILW.
$T_e$
profile as an input. Further tests for ASDEX Upgrade and MAST-U Type I ELMy H-modes also gave good agreement (Saarelma et al. Reference Saarelma2024), using the same model parameters used for JET-ILW.
Saarelma et al. (Reference Saarelma2024), further JET-ILW experiments, in which $A_{\textit{eff}}$
was varied at constant gas rate and constant
$A_{\textit{eff}}$
was varied at constant gas rate and constant $\beta _N$
(Frassinetti et al. Reference Frassinetti2023), could be modelled successfully, provided the experimental variation of
$\beta _N$
(Frassinetti et al. Reference Frassinetti2023), could be modelled successfully, provided the experimental variation of $n_{e,sep}$
and the isotope dependence of
$n_{e,sep}$
and the isotope dependence of $(D_e/\chi _e)_{TG}$
were assumed. Over the range
$(D_e/\chi _e)_{TG}$
were assumed. Over the range $A_{\textit{eff}} = 2 \rightarrow 3$
, appropriate values of
$A_{\textit{eff}} = 2 \rightarrow 3$
, appropriate values of $(D_e/\chi _e)_{TG}$
of
$(D_e/\chi _e)_{TG}$
of $0.5 \rightarrow 0.25$
were found from GK simulations Predebon et al. (Reference Predebon, Hatch, Frassinetti, Horvath, Saarelma, Chapman-Oplopoiou, Görler, Maggi and Contributors2023), i.e. the relative level of particle to heat transport decreases with increasing
$0.5 \rightarrow 0.25$
were found from GK simulations Predebon et al. (Reference Predebon, Hatch, Frassinetti, Horvath, Saarelma, Chapman-Oplopoiou, Görler, Maggi and Contributors2023), i.e. the relative level of particle to heat transport decreases with increasing $A_{\textit{eff}}$
.
$A_{\textit{eff}}$
.
Appendix C. Sensitivities of the combined ETG+DP model (M3) to input parameters
A comprehensive calculation of the uncertainties on the predicted profiles from the combined ETG+DP+EPED model (M3) using estimated uncertainties on the experimental input parameters is beyond the scope of the present study. However, statements can be made as to how sensitive the predicted $n_{e,ped}$
from the DP model and
$n_{e,ped}$
from the DP model and $T_{e,ped}$
from the ETG model are to the experimental input and internal ‘model’ parameters of each.
$T_{e,ped}$
from the ETG model are to the experimental input and internal ‘model’ parameters of each.
In the discussion below, the sensitivities to the input and model parameters are quantified by assuming a dependence of the calculated parameter $y$
(either
$y$
(either $n_{e,ped}$
for the DP model or
$n_{e,ped}$
for the DP model or $T_{e,ped}$
for the ETG model) on the input parameter
$T_{e,ped}$
for the ETG model) on the input parameter $x$
as either a power law
$x$
as either a power law $y = a x^\gamma$
or an offset-linear scaling
$y = a x^\gamma$
or an offset-linear scaling $y=ax+c$
, as appropriate. This allows the sensitivity to be quantified in terms of either the exponent
$y=ax+c$
, as appropriate. This allows the sensitivity to be quantified in terms of either the exponent $\gamma = (\Delta y/\Delta x)/(\bar {x}/\bar {y})$
, where for example
$\gamma = (\Delta y/\Delta x)/(\bar {x}/\bar {y})$
, where for example $\Delta x$
and
$\Delta x$
and $\bar {x}$
are the changes and mean values over the scan of the parameter
$\bar {x}$
are the changes and mean values over the scan of the parameter $x$
, or the equivalent, dimensionless coefficient
$x$
, or the equivalent, dimensionless coefficient $\gamma = a/(\bar {x}/\bar {y})$
for the offset-linear scaling.
$\gamma = a/(\bar {x}/\bar {y})$
for the offset-linear scaling.
(a) DP model for $n_e$
profile:
$n_e$
profile:
(i) Experimental input parameters:
The experimental inputs to this model are: the electron density $n_{e,sep}$
at the separatrix and the heat flux across the separatrix
$n_{e,sep}$
at the separatrix and the heat flux across the separatrix $P_{sep}/S$
. As shown in figure 6 of Saarelma et al. (Reference Saarelma, Connor, Bilkova, Bohm, Field, Frassinetti, Fridstrom, Kirk and Contributors2023), the dependence of
$P_{sep}/S$
. As shown in figure 6 of Saarelma et al. (Reference Saarelma, Connor, Bilkova, Bohm, Field, Frassinetti, Fridstrom, Kirk and Contributors2023), the dependence of $n_{e,ped}$
on
$n_{e,ped}$
on $n_{e,sep}$
is slightly weaker than linear, with an estimated scaling exponent
$n_{e,sep}$
is slightly weaker than linear, with an estimated scaling exponent $\gamma \sim 0.9$
.
$\gamma \sim 0.9$
.
The dependence on the heat flux $P_{sep}/S$
across the pedestal, which increases the particle flux in proportion to
$P_{sep}/S$
across the pedestal, which increases the particle flux in proportion to $(P_{sep}/S)(D/\chi )_{TG}$
and hence decreases
$(P_{sep}/S)(D/\chi )_{TG}$
and hence decreases $n_{e,ped}$
for increasing
$n_{e,ped}$
for increasing $P_{sep}$
, is modest and offset-linear. For example, for JET-Be/W pulse no. 100183, increasing
$P_{sep}$
, is modest and offset-linear. For example, for JET-Be/W pulse no. 100183, increasing $P_{sep}$
from
$P_{sep}$
from $8-24\,\textrm {MW}$
decreases
$8-24\,\textrm {MW}$
decreases $n_{e,ped}$
by only
$n_{e,ped}$
by only ${\sim} 12\,\%$
from
${\sim} 12\,\%$
from $5.2 \rightarrow 4.6 \times 10^{19}\,\textrm {m}^{-3}$
, so the scaling coefficient
$5.2 \rightarrow 4.6 \times 10^{19}\,\textrm {m}^{-3}$
, so the scaling coefficient $\gamma \sim 0.12$
.
$\gamma \sim 0.12$
.
(ii) ‘Model’ parameters:
The other, less accurately known ‘model’ parameters of the DP model, to which the $n_{e,ped}$
predictions are mostly less sensitive are: the FSA density of Franck–Condon neutral atoms at the separatrix
$n_{e,ped}$
predictions are mostly less sensitive are: the FSA density of Franck–Condon neutral atoms at the separatrix $\left \langle n_{FC}(0) \right \rangle$
; the assumed ratio of electron particle diffusivity to electron heat conductivity
$\left \langle n_{FC}(0) \right \rangle$
; the assumed ratio of electron particle diffusivity to electron heat conductivity $(D_e/\chi _e)_{TG}$
across the pedestal; and the ratio of charge-exchange to Franck–Condon neutral densities at the separatrix
$(D_e/\chi _e)_{TG}$
across the pedestal; and the ratio of charge-exchange to Franck–Condon neutral densities at the separatrix $({n_{CX}}/{n_{FC}})\rvert _{x=0}$
.
$({n_{CX}}/{n_{FC}})\rvert _{x=0}$
.
As shown in figure 7 of Saarelma et al. (Reference Saarelma, Connor, Bilkova, Bohm, Field, Frassinetti, Fridstrom, Kirk and Contributors2023), the dependence of $n_{e,ped}$
on the neutral density
$n_{e,ped}$
on the neutral density $\left \langle n_{FC}(0) \right \rangle$
is modest, with an offset-linear dependence. Increasing
$\left \langle n_{FC}(0) \right \rangle$
is modest, with an offset-linear dependence. Increasing $\left \langle n_{FC}(0) \right \rangle$
from
$\left \langle n_{FC}(0) \right \rangle$
from $0 \rightarrow 10^{16}\,\textrm {m}^{-3}$
increases
$0 \rightarrow 10^{16}\,\textrm {m}^{-3}$
increases $n_{e,ped}$
by
$n_{e,ped}$
by ${\sim} 35\,\%$
from
${\sim} 35\,\%$
from $6 \rightarrow 8.5 \times 10^{19}\,\textrm {m}^{-3}$
, so the scaling coefficient
$6 \rightarrow 8.5 \times 10^{19}\,\textrm {m}^{-3}$
, so the scaling coefficient $\gamma \sim 0.17$
.
$\gamma \sim 0.17$
.
The sensitivity of the $n_{e,ped}$
prediction to the ratio of charge-exchange to Franck–Condon neutral densities at the separatrix is very weak. Calculations performed for JET-Be/W pulse no. 100183, increasing
$n_{e,ped}$
prediction to the ratio of charge-exchange to Franck–Condon neutral densities at the separatrix is very weak. Calculations performed for JET-Be/W pulse no. 100183, increasing $({n_{CX}}/{n_{FC}})\rvert _{x=0}$
from
$({n_{CX}}/{n_{FC}})\rvert _{x=0}$
from $0 \rightarrow 0.2$
, decreased
$0 \rightarrow 0.2$
, decreased $n_{e,ped}$
by only
$n_{e,ped}$
by only ${\sim} 2.5\,\%$
, so the scaling coefficient
${\sim} 2.5\,\%$
, so the scaling coefficient $\gamma \sim -0.01$
.
$\gamma \sim -0.01$
.
Increasing the ratio of particle to heat diffusivity $(D_e/\chi _e)_{TG}$
has the same effect as increasing
$(D_e/\chi _e)_{TG}$
has the same effect as increasing $P_{sep}/S$
, i.e. weakly decreasing
$P_{sep}/S$
, i.e. weakly decreasing $n_{e,ped}$
. For example, for pulse no. 96201, doubling
$n_{e,ped}$
. For example, for pulse no. 96201, doubling $(D_e/\chi _e)_{TG}$
from
$(D_e/\chi _e)_{TG}$
from $0.25 \rightarrow 0.5$
decreased
$0.25 \rightarrow 0.5$
decreased $n_{e,ped}$
by
$n_{e,ped}$
by ${\sim} 12\,\%$
from
${\sim} 12\,\%$
from $4.5 \rightarrow 4.0 \times 10^{19}\,\textrm {m}^{-3}$
, so the scaling coefficient
$4.5 \rightarrow 4.0 \times 10^{19}\,\textrm {m}^{-3}$
, so the scaling coefficient $\gamma \sim -0.2$
.
$\gamma \sim -0.2$
.
(b) ETG critical-heat-flux model for $T_e$
profile:
$T_e$
profile:
(i) Experimental input parameters:
For the ETG critical-heat-flux model, the experimental input parameters are: the heat flux across the separatrix $P_{sep}/S$
and the electron density
$P_{sep}/S$
and the electron density $n_{e,sep}$
and temperature
$n_{e,sep}$
and temperature $T_{e,sep}$
at the separatrix.
$T_{e,sep}$
at the separatrix.
The strongest dependencies of $T_{e,ped}$
are on
$T_{e,ped}$
are on $T_{e,sep}$
and the pedestal–separatrix density ratio
$T_{e,sep}$
and the pedestal–separatrix density ratio $n_{e,ped}/n_{e,sep}$
, which can be understood from the simple model for infinitely stiff electron heat transport discussed in § 5.2 above. Assuming that ETG heat transport clamps
$n_{e,ped}/n_{e,sep}$
, which can be understood from the simple model for infinitely stiff electron heat transport discussed in § 5.2 above. Assuming that ETG heat transport clamps $\eta _e$
at some constant level
$\eta _e$
at some constant level $\bar {\eta _e}$
, which is
$\bar {\eta _e}$
, which is $\mathcal O \textrm {(1)}$
above the linear threshold
$\mathcal O \textrm {(1)}$
above the linear threshold $\eta _{e,cr} \sim \mathcal O \textrm {(1)}$
, integrating inwards from the separatrix yields relation (5.1), i.e. that
$\eta _{e,cr} \sim \mathcal O \textrm {(1)}$
, integrating inwards from the separatrix yields relation (5.1), i.e. that $T_e$
at some location
$T_e$
at some location $x$
between the separatrix and the density pedestal top is given by
$x$
between the separatrix and the density pedestal top is given by $T_e(x) = T_{e,sep}(n_e(x)/n_{e,sep})^{\bar {\eta _e}}$
. Hence, for this simple model,
$T_e(x) = T_{e,sep}(n_e(x)/n_{e,sep})^{\bar {\eta _e}}$
. Hence, for this simple model, $T_{e,ped}$
scales linearly with
$T_{e,ped}$
scales linearly with $T_{e,sep}$
and inversely with
$T_{e,sep}$
and inversely with $n_{e,sep}^{\bar {\eta _e}}$
, where
$n_{e,sep}^{\bar {\eta _e}}$
, where $\bar {\eta _e} \sim \mathcal O \textrm {(2)}$
is appropriate for the steep-density gradient region of the pedestal.
$\bar {\eta _e} \sim \mathcal O \textrm {(2)}$
is appropriate for the steep-density gradient region of the pedestal.
Numerical calculations with the full ETG critical-heat-flux model, varying $T_{e,sep}$
at a fixed location on the experimental profiles and hence fixed
$T_{e,sep}$
at a fixed location on the experimental profiles and hence fixed $n_{e,sep}$
show that
$n_{e,sep}$
show that $T_e$
at the location of the experimental
$T_e$
at the location of the experimental $T_e$
pedestal location varies approximately linearly with
$T_e$
pedestal location varies approximately linearly with $T_{e,sep}$
as:
$T_{e,sep}$
as: $T_e(\psi _N^{T_{e,top}}) \approx \mathcal{A} T_{e,sep} + \mathcal{B}$
, where the coefficient
$T_e(\psi _N^{T_{e,top}}) \approx \mathcal{A} T_{e,sep} + \mathcal{B}$
, where the coefficient $\mathcal{A} \sim \mathcal O \textrm {(2)}$
increases modestly with the heat flux
$\mathcal{A} \sim \mathcal O \textrm {(2)}$
increases modestly with the heat flux $P_{sep}/S$
and is typically smaller than that expected from the simple model discussed above, e.g. for JET-Be/W pulse no. 90339,
$P_{sep}/S$
and is typically smaller than that expected from the simple model discussed above, e.g. for JET-Be/W pulse no. 90339, $(n_{e,ped}/n_{e,sep})^{\bar {\eta _e}} \sim 4$
rather than
$(n_{e,ped}/n_{e,sep})^{\bar {\eta _e}} \sim 4$
rather than ${\sim} 2.8$
, as determined from the
${\sim} 2.8$
, as determined from the $T_{e,sep}$
scan. The offset
$T_{e,sep}$
scan. The offset $\mathcal{B}$
, which is typically
$\mathcal{B}$
, which is typically $\mathcal O (\mathrm{few} \times 100\,\textrm{eV})$
, increases weakly with
$\mathcal O (\mathrm{few} \times 100\,\textrm{eV})$
, increases weakly with $P_{sep}/S$
and decreases with increasing stiffness of the ETG heat-flux scaling, i.e. with increasing exponent
$P_{sep}/S$
and decreases with increasing stiffness of the ETG heat-flux scaling, i.e. with increasing exponent $\beta$
in (2.1).
$\beta$
in (2.1).
(ii) ‘Model’ parameters:
Sensitivity to the parameters ( $\alpha$
,
$\alpha$
, $\beta$
and
$\beta$
and $\eta _{e,cr}$
) of the gyro-Bohm normalised electron heat-flux scaling (2.1) underlying the model are discussed in Appendix D.1 of Turica et al. (Reference Turica, Field, Frassinetti, Schekochihin and Contributors2025), which presents a detailed investigation of reconstructions of JET-Be/W
$\eta _{e,cr}$
) of the gyro-Bohm normalised electron heat-flux scaling (2.1) underlying the model are discussed in Appendix D.1 of Turica et al. (Reference Turica, Field, Frassinetti, Schekochihin and Contributors2025), which presents a detailed investigation of reconstructions of JET-Be/W $T_e$
profiles from the EUROfusion Pedestal Database (Frassinetti et al. Reference Frassinetti2021), using various reduced turbulence models and machine learning approaches.
$T_e$
profiles from the EUROfusion Pedestal Database (Frassinetti et al. Reference Frassinetti2021), using various reduced turbulence models and machine learning approaches.
In summary of the results in Appendix D.1 of Turica et al. (Reference Turica, Field, Frassinetti, Schekochihin and Contributors2025):
-
(i) The strongest dependence of
$T_{e,ped}$
is on the critical threshold
$\eta _{e,cr}$
, increasing
$\eta _{e,cr}$
strongly increasing
$T_e$
across the pedestal; -
(ii) Increasing the coefficient
$\alpha$
is equivalent to decreasing the heat flux
$P_{sep}/S$
across the pedestal, as the relevant parameter in (2.2) is
$P_{sep}/(\alpha S)$
. Increasing
$P_{sep}/S$
(or decreasing
$\alpha$
) only weakly increases
$T_{e,ped}$
, with an exponent
$\gamma \sim \mathcal O \textrm {(0.1)}$
. -
(iii) The stiffness coefficient
$\beta$
affects the shape of the
$T_e$
profile but only weakly affects its magnitude. Increased stiffness forces
$\eta _e$
to be closer to the assumed
$\eta _{e,cr}$
but it remains larger, so that the term (
$\eta _e - \eta _{e,cr})$
in (2.1) remains
${\sim} \mathcal O \textrm {(1)}$
, such that the predicted heat flux
$q_e \propto (\eta _e - \eta _{e,cr})^\beta$
can match the prescribed
$q_e = P_{sep}/S$
even when
$\beta$
is very large.


Appendix D. Scaling of upstream density
$n_u$
for a collisionless, sheath-limited SOL

For a collisionless, isothermal SOL, assuming that $T_i = T_e$
, we have for the temperature
$T_i = T_e$
, we have for the temperature $T_u = T_t$
and density
$T_u = T_t$
and density $n_u = 2 n_t$
, where the subscripts
$n_u = 2 n_t$
, where the subscripts $u$
and
$u$
and $t$
denote upstream (mid-plane) and target values respectively (Stangeby Reference Stangeby2000). Also assuming a constant SOL power decay length
$t$
denote upstream (mid-plane) and target values respectively (Stangeby Reference Stangeby2000). Also assuming a constant SOL power decay length $\lambda _q$
implies that the parallel electron heat flux in the SOL is proportional to the loss power across the separatrix
$\lambda _q$
implies that the parallel electron heat flux in the SOL is proportional to the loss power across the separatrix $q_{\parallel } \propto P_{sep}/S \lambda _q$
, where
$q_{\parallel } \propto P_{sep}/S \lambda _q$
, where $S$
is the area of the LCFS.
$S$
is the area of the LCFS.
Expressions for the particle and heat fluxes at the target are then: $\varGamma = {1}/{2} n_t c_s \propto n_t T_t^{1/2}/A^{1/2}$
and
$\varGamma = {1}/{2} n_t c_s \propto n_t T_t^{1/2}/A^{1/2}$
and $q = \gamma T_t \varGamma \propto n_t T_t^{3/2}/A^{1/2}$
, where
$q = \gamma T_t \varGamma \propto n_t T_t^{3/2}/A^{1/2}$
, where $c_s$
is the sound speed and
$c_s$
is the sound speed and $\gamma \sim 5/2$
is the sheath transmission factor. By elimination of
$\gamma \sim 5/2$
is the sheath transmission factor. By elimination of $n_t$
from these two expressions, we have
$n_t$
from these two expressions, we have $T_t \propto q/\varGamma$
, which can be substituted into the expression for
$T_t \propto q/\varGamma$
, which can be substituted into the expression for $\varGamma$
to yield the following scaling for the upstream density
$\varGamma$
to yield the following scaling for the upstream density $n_u \propto \varGamma ^{3/2} A^{1/2} / q^{1/2}$
.
$n_u \propto \varGamma ^{3/2} A^{1/2} / q^{1/2}$
.
Hence, even this simple-as-possible model predicts that $n_u \equiv n_{e,sep}$
should increase with isotope mass
$n_u \equiv n_{e,sep}$
should increase with isotope mass $\propto A_{\textit{eff}}^{1/2}$
and also with the particle fuelling rate into the SOL
$\propto A_{\textit{eff}}^{1/2}$
and also with the particle fuelling rate into the SOL $\propto \varGamma _{e}^{3/2}$
and decrease with the loss power across the separatrix
$\propto \varGamma _{e}^{3/2}$
and decrease with the loss power across the separatrix $\propto P_{sep}^{-1/2}$
.
$\propto P_{sep}^{-1/2}$
.


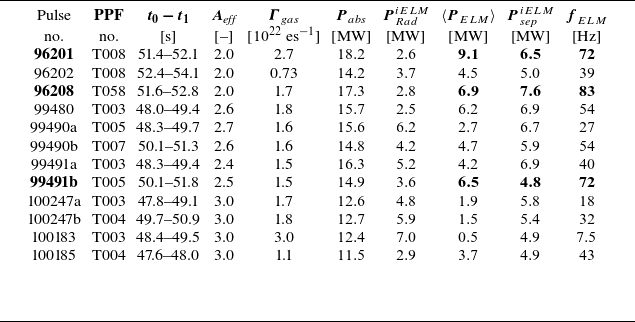


 Open access