

During its colonial days, Haiti’s slave plantations supplied over half of the world’s sugar. But after the slaves gained their freedom from the brutal regime and the country declared independence in 1804, sugar disappeared from the economy as small farms produced coffee, subsistence agriculture, and food for local markets. Even as its Caribbean neighbors responded to booming sugar demand at the turn of the twentieth century and shifted agriculture to cane production, Haiti stood firm in its small-farm agriculture. In 1950, when Haiti was at least producing some sugar, its exports were far behind comparable countries: sugar exports in Puerto Rico were 35 times higher, and in the Dominican Republic (which shares an island with Haiti), exports were 14 times higher (Bulmer-Thomas Reference Bulmer-Thomas2012, table C.5). A common explanation for Haiti’s resistance to producing sugar is that Haitian culture rejected the industry because of the associated historical traumas (Dubois Reference Dubois2012, pp. 109–10). But this explanation is incomplete since during this same period tens of thousands of Haitians migrated to neighboring islands every year to work on sugar plantations. In this paper, I argue that a major contributor to Haiti’s failure to restore its sugar economy was historical property rights institutions that created significant transaction costs to starting large-scale farms.
Haiti’s high transaction costs came from a combination of three post-Independence property rights institutions: (1) a large redistribution of the former French plantations; (2) inheritance patterns on peasant land that gave every family member a veto right to selling it; and (3) a constitutional ban on foreigners owning land in Haiti. Because of Haiti’s early independence in 1804, the institutions had time to ossify ahead of the twentieth century, when new opportunities for the region arose because of changing agricultural technologies and growing export demand. Countries with similar endowments and histories to Haiti, like the Dominican Republic, Puerto Rico, Cuba, and Jamaica, took advantage of the developments and expanded plantation-style agriculture. But even though Haiti seemed to be in a similarly advantageous position, its agriculture did not switch.
While others have attributed Haiti’s agricultural structure to transaction costs (Moral Reference Moral1961), this paper empirically tests the hypothesis using two novel sets of microdata. First, I collect plot-level data from more than 5,700 farms that were created between 1928 to 1950 under a land reform implemented during the 1915–1934 U.S. occupation of Haiti. Second, I create a proxy for transaction costs using settlement patterns taken from historical maps. The two datasets allow for the first empirical test of explanations for Haiti’s small farms and missing sugar.
My empirical tests analyze the relationship between the proxy for transaction costs and the number of new farms in this period. In a cross-sectional regression, I find a negative correlation between the transaction cost proxy and how much uncultivated land the district converted into farms. The results are not causal, and they are underpowered due to the noisy proxy, but they provide the first empirical investigation of the transaction cost hypothesis.
Understanding why Haiti failed to produce sugar in the twentieth century is key to understanding its modern poverty. Haiti appears to be an extreme case of the reversal-of-fortune phenomenon (Acemoglu, Johnson, and Robinson Reference Acemoglu, Simon and James2002), but it diverges from the typical pattern. Economists studying the reversal of fortune blame colonial institutions for the change (Acemoglu, Johnson, and Robinson Reference Acemoglu, Simon and Robinson2001; Engerman and Sokoloff Reference Engerman and Ken2002), and indeed many studies have shown colonial institutions cause long-run inequities (Dell Reference Dell2010; Michalopoulos and Papaioannou Reference Michalopoulos and Elias2016, 2013). But the property rights institutions in Haiti are important because they were not established by colonists; instead, they were created by a newly independent nation in reaction to colonists. These are post-colonial institutions.
The institutions considered here contribute to a growing literature on how transaction costs affect economic development. While classical theories of growth attribute differences in development to differences in physical and human capital, modern theories attribute these differences to the misallocation of resources (Hsieh and Klenow Reference Hsieh and Klenow2009; Restuccia and Rogerson Reference Restuccia and Rogerson2008). Particularly relevant for this paper, misallocation of farm size can explain about one-half of agricultural productivity differences between poor and rich countries (Adamopoulos and Restuccia Reference Adamopoulos and Diego2014). A major cause of misallocation is transaction costs since such costs shape how and where resources are used (North Reference North1981). For example, in Cuba, transaction costs from negotiating with entrenched landowners forced investors to develop sugar mills on the eastern side of the island, far from Havana and the established sugar industry (Dye Reference Dye1994). More recently, fragmented land ownership impeded shale oil production in North Dakota (Leonard and Parker Reference Leonard and Dominic2021). To overcome such problems, economic development sometimes requires (involuntarily) reallocating property rights in response to changing economic conditions (Lamoreaux Reference Lamoreaux2011). Indeed, violating or weakening property rights on the path to development occurred in France (Finley, Franck, and Johnson Reference Finley, Raphael and Johnson2021; Rosenthal Reference Rosenthal1990), England (Dimitruk Reference Dimitruk2020; Bogart and Richardson Reference Bogart and Gary2011), and America (Priest Reference Priest2006). But such a solution requires a government with the capacity to reorganize and enforce property rights, a dilemma discussed in the conclusion.
HAITI’S MISSING SUGAR
The mystery at hand is why Haiti, the once global leader in sugar production, failed to grow significant quantities of sugar in the twentieth century. Of course, Haiti’s former global leadership relied on a vicious slave system, and if the cost of greater sugar production was returning to that system, then there would be no mystery. But it is clear from Haiti’s neighbors that the twentieth-century sugar production could thrive without slavery (see Figure 1). From 1900 to 1960, sugar accounted for 76 percent of Cuba’s export value, 51 percent of the Dominican Republic’s, 46 percent of Puerto Rico’s, and 26 percent of Jamaica’s. Sugar contributed only 5 percent to Haiti’s exports (Bulmer-Thomas Reference Bulmer-Thomas2012, table C.5).Footnote 1 Instead, Haiti’s main export was coffee, which over this time accounted for 63 percent of Haiti’s export value. But the price of sugar relative to coffee was increasing rapidly (see Online Appendix Figure A1). At a time when sugar was swelling Caribbean exports, the once world-leader effectively produced none.
SUGAR EXPORTED FROM SELECT CARIBBEAN ISLANDS, 1900–1950
Source: Bulmer-Thomas (Reference Bulmer-Thomas2012, table C.5).
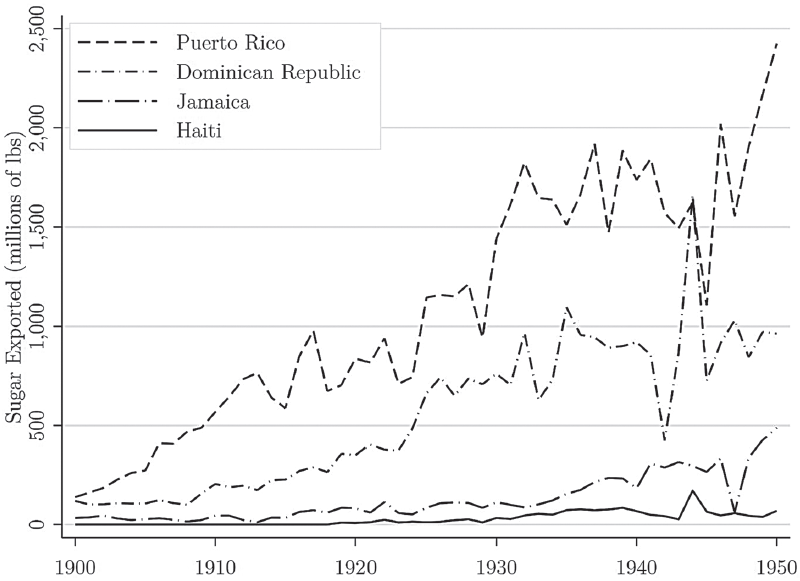
Clearly, Haiti would not be expected to dominate global supply as it did during the colonial days since that was a time when few countries produced sugar. But early twentieth-century Haiti failed to even reach the numbers it attained during its colonial production. From 1900 to 1918, Haiti did not export any sugar, and when production peaked in the late 1930s, Haiti exported an average of 75.9 million pounds per year (Bulmer-Thomas Reference Bulmer-Thomas2012, table C.5). Yet in 1789, the eve of Haiti’s revolution, the colony exported 47.5 million pounds of clayed sugar (refined, white) and 93.6 million pounds of muscovado sugar (unrefined, still contains molasses) (Mackenzie Reference Mackenzie1830). Haiti was far below potential even without accounting for the improved twentieth-century technology and cultivation practices. Indeed, Bulmer-Thomas describes Haiti’s missing sugar exports by saying, “The Haitian economy, it would seem, was not able to respond to these price signals from the market with the flexibility required” (Bulmer-Thomas Reference Bulmer-Thomas2012, p. 190).
The failure to respond to market signals was not for lack of effort. When the American occupation began in 1915, there was a big push for sugar production. “The most important means of increasing national income and thus taking an initial step toward stability is by the establishment of large-scale agricultural undertakings in appropriate regions,” said A. C. Millspaugh, the American Financial Adviser-General Receiver in Haiti (Millspaugh Reference Millspaugh1929, p. 562).Footnote 2 The push for sugar under occupation can explain the shift from Haiti exporting no sugar in any year from 1900 to 1918 to exporting 11 million pounds in 1921 (Bulmer-Thomas Reference Bulmer-Thomas2012, table C.5). But the Dominican Republic, which was also under American occupation, saw a much greater increase in sugar output over this period. So why were the Haitian and Dominican responses so different?
A common explanation for Haiti’s missing sugar is a cultural resistance to its association with the slave economy, but evidence from Haitian migration suggests a cultural explanation is incomplete. Under French colonial rule, Haiti’s slave regime brutally fueled sugar production. Successfully breaking away from that economy was a source of national pride. But while cultural resistance certainly contributed to Haiti’s missing sugar, there was a significant number of workers willing to cultivate sugar. During this same period, when Haiti failed to produce sugar, tens of thousands of Haitians migrated to other countries to work on sugar plantations. Though the actual number of migrants was impossible to document, about 100,000 went to the Dominican Republic each year (National Archives and Records Service General Services Administration 1924), and between 10,000 and 25,000 traveled to Cuba (Cumberland, Colson, and Dunn 1927, p. 96).Footnote 3 Haitian workers could earn wages two to six times higher than what they could get in Haiti, and the two countries employed about 20 percent of Haiti’s prime-age (25–55) male workforce, sapping Haiti’s domestic labor supply.Footnote 4 It is possible that the cultural resistance made Haitians more comfortable working on sugar plantations abroad rather than at home, but surely some of the migrants would have preferred saving the cost of traveling and absence from their family by working at home.
What makes Haiti’s missing sugar so puzzling is that the workers were leaving when a lot of Haiti’s agricultural land sat uncultivated. Although Haiti’s population was four times larger than in colonial times, farmers cultivated only two-thirds of the land cultivated by colonists.Footnote 5 One complaint from policymakers was that private landholders left land idle, and there was no land tax to prod them to cultivate it (which prompted a discussion on instituting one; see De La Rue, Pixley, and Craddock (1939, p. 99) and also Millspaugh (Reference Millspaugh1929)). Some policymakers wondered why workers would leave when there was enough good land to employ their talents (National Archives and Records Service General Services Administration 1927), and others argued that employing the migrant labor on the idle domestic land would create higher returns than migrating (De La Rue, Pixley, and Craddock 1931, p. 141). Calculating how much land was idle is difficult because comprehensive land-use data are unavailable, but rough estimates suggest that between 36 and 55 percent of Haiti’s arable land was left uncultivated.Footnote 6 The land that was cultivated was mostly dedicated to subsistence crops or food for local markets: according to census numbers, only 24 percent of the land in cultivation was dedicated to cash crops, and only 5 percent was in sugar.
Much of this idle land was owned by the government. During the Haitian Revolution, the government had confiscated much of the country’s land. As discussed below, the government redistributed and sold that land after declaring independence in 1804, but it retained about half of the country’s land. Brisson (Reference Brisson1968) estimates that large landholders owned about 960,000 hectares in Haiti, but Lundahl (Reference Lundahl1996) argues that very little of this land would have been in the hands of private landowners; most of it belonged to the government. This is consistent with the claim by Millspaugh (Reference Millspaugh1929), who was an official in the U.S. occupation of Haiti, that the government-owned 915,000 hectares. According to Brisson, only 7 percent was under cultivation. Millspaugh describes such land as “uncultivated and unoccupied” (p. 561).
Though data on land quality in the early 1900s are unavailable, evidence from historical records indicates the land was good. Contemporaries struggled to understand why so much “fertile” land sat idle (De La Rue, Pixley, and Craddock 1933, p. 28), even in areas sending workers abroad (Casey Reference Casey2012, p. 86). Historically, the land proved its quality by supplying half of the world’s coffee and sugar. During the Haitian Revolution at the end of the eighteenth century, the government acquired the plantation lands (Trouillot Reference Trouillot1990; Millspaugh Reference Millspaugh1929), and by the twentieth century, any depletion from colonial overproduction had been remedied by 100 years of sitting fallow (Cumberland, Colson, and Stanley 1928, p. 137; see also Millspaugh Reference Millspaugh1929). The land was so good that small farmers chose to cultivate it when they could. In the early 1920s, the government allowed farmers to exchange their privately-owned land for state-owned land, and the program was so popular that the government had to end it because the gap in quality between what it gave and what it received was too large (Renaud Reference Renaud1934, p. 228; De La Rue, Pixley, and Craddock 1941, p. 121).
To summarize the puzzle: Haiti lagged in sugar production despite tens of thousands of willing workers and hundreds of thousands of acres of idle land. Why was Haiti unable to transition to sugar production? A key issue was sugar production required a minimum efficient scale, but Haiti was a nation of small farms.
Small Farms and Minimum Efficient Scale
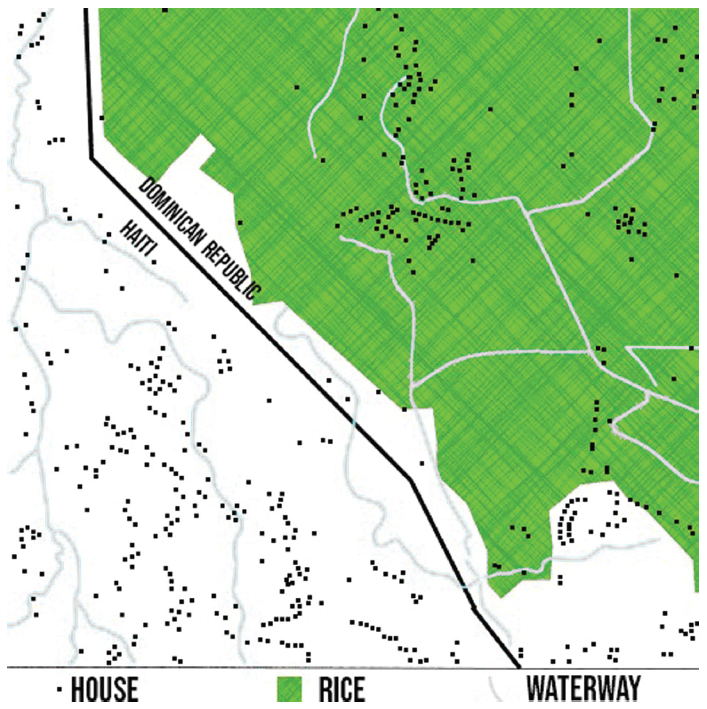
Haiti’s striking small farm economy is best seen when contrasted with its island neighbor, the Dominican Republic (DR). Figure 2 shows a map of the Haitian-DR border (United States Army Map Service 1962), with every dot representing a house. The difference in the distribution of houses is clear: in Haiti, houses were spread all over the land, but in the Dominican Republic, they were clustered together, leaving plenty of property for large-scale agriculture (in this case, rice). The earliest landholdings data available for Haiti show that in 1950 94 percent of farms and 70 percent of farmland were on plots smaller than 6.5 hectares (Lundahl Reference Lundahl1996). During the nineteenth century, small farms were not a problem because they were well-suited for coffee cultivation, which supplied, on average, 84 percent of Haiti’s annual export value (Bulmer-Thomas Reference Bulmer-Thomas2012, table A.10). But the small farms became an impediment when the economics of sugar cane production changed with the invention of new mills at the turn of the twentieth century.
EXAMPLE OF SETTLEMENT PATTERNS ON A 100-HECTARE PIECE OF LAND ON THE BORDER OF HAITI THE DOMINICAN REPUBLIC
Notes: Every black dot represents a building, mostly homes and huts. The map depicts the region around Ouanaminthe, Haiti and Dajabon, Dominican Republic. The thick black line in the middle is the border between the two countries. The thatched area indicates rice farming and the gray lines show waterways.
Source: United States Army Map Service (1962).
The new mills’ efficiency made Caribbean sugar profitable without slavery, but profitability required a minimum efficient scale. Mills extract sucrose from cane, but once the cane is cut, the sucrose begins transforming into fructose. Thus mills could maximize profits by shrinking the window between harvesting and processing. But if all cane was harvested at the same time, the mill’s capacity would be overwhelmed, and the cane would be wasted. Shrinking the window required coordination. The solution was straightforward: mills needed to control a large area of cane production. Furthermore, controlling at least some farm areas protected the mill’s investment from risks such as supplier cartelization, hold-up problems, or variations in supply caused by independent farmers switching away from sugar cane production because of short-term fluctuations in prices (Dye Reference Dye1994; Ayala Reference Ayala1999, p. 143). Thus, the economies of scale did not come from cultivating the land; they came from controlling supply to the mills.
The economics of the new mills transformed Caribbean economies such as Cuba and Puerto Rico. In Cuba, the need to achieve a minimum efficient scale shaped the industry’s economic geography (Dye Reference Dye1994). Under the old mill system, Cuba’s sugar industry was established on the Western side of the island, and the Eastern side sat unpopulated and undeveloped. But when the new mills arrived, investors in the West did not control enough land to ensure a steady supply of cane without disruption from farmers who knew the mills depended on them. Investors moved to the undeveloped Eastern side, where large plots of land were available. Mills bought and controlled the land, built railroads, then leased land to cultivators in a way that guaranteed a constant supply uninterrupted by bargaining with farmers. Thus, while the West still had a prosperous sugar industry, the mills and plantations in the East were much larger, and Cuba’s sugar economy thrived.
One might argue that Puerto Rico was a small-farm economy that became a dominant sugar producer, so issues with minimum efficient scale do not seem pertinent. Indeed, when sugar mills came to Puerto Rico, it looked like Haiti: a densely populated country filled with small farms (Ayala Reference Ayala1999, pp. 141–4). But mills overcame this problem and achieved the minimum efficient scale through a combination of purchasing land and contracting with small farmers. “The practice is to buy some of the larger estates lying in the immediate vicinity, to secure long term leases, usually from five to fifteen years, from the owners of the other large estates adjoining, and to make cane grinding contracts with the owners of small outlying farms” (Ayala Reference Ayala1999, p. 142). Such contracting was made easier by recent legal reforms made by the U.S. after Puerto Rico became an American territory (Cabán Reference Cabán, Carlos and Sampaio2002, pp. 122–4). While thousands of small farms thrived under this organization, their contribution to Puerto Rico’s total sugar cultivation was small: in 1934, the 4,815 farms smaller than 2.40 ha only accounted for 2.4 percent of sugar cultivation, whereas 67.1 percent came from the 59 farms larger than 200 ha (Ayala Reference Ayala1999, p. 142). It was the success of Puerto Rico’s few large farms that enabled the success of its many small farms. Because Haiti did not have large farms, its small farms could not succeed in producing sugar.
Thus, Haiti did not switch to sugar production because it did not create large plantations that could reach the minimum efficient scale. But this reasoning is almost circular. What stopped them from starting large plantations? If creating large farms could generate so much value for Haiti, then someone should buy the small farms and aggregate the land. Why could Puerto Rico, a country with a similar initial distribution, transfer land, and contract production, but Haiti could not? Furthermore, as established earlier, there were hundreds of thousands of acres of idle land. What stopped farmers from moving idle land into sugar production? In the next section, I argue that Haiti’s inability to produce sugar in the twentieth century started with decisions made a century before. When Haiti gained its independence in 1804, it developed a set of land institutions that created thousands of small farms with diffuse property rights. This new agricultural structure created large transaction costs to aggregating land. These transaction costs prevented farmers from creating plantations that could achieve the minimum efficient scale needed for running twentieth-century mills.
HISTORICAL ORIGINS OF TRANSACTION COSTS
I argue that the puzzle can be explained by Haiti’s early experiments in land redistribution. After independence in 1804, land redistribution succeeded in removing sugar from Haiti’s economy by eliminating large plantations and creating an abundance of small farms. Then over the nineteenth century, two important property institutions emerged: a ban on foreign property ownership and intricate inheritance patterns. By the time sugar cane was profitable in the twentieth century, Haiti’s land was entangled in a web of property rights that created high transaction costs for assembling large plantations. As a result, sugar production could not return, and Haitian labor moved to sugar production on other islands where it could be employed more productively.
Land Redistribution and the Disappearance of Sugar
Although multiple factors explain the disappearance of sugar from Haiti’s exports, land redistribution after independence played an important role. During the revolution, the government had confiscated much of the country’s land. Then, in the beginning stages of independence, the government did not have the revenues needed to pay its military and civil servants. Instead of paying them in cash, the government gave them land (Murray Reference Murray1977, pp. 76–77). Realizing that the land could provide a quick source of revenue, the government moved to sell the property to the broader public. This redistribution created a country of small landholders (Thoby Reference Thoby1888, pp. 11–12).
Dividing the land dictated crop choice. Farmers on small plots could profitably cultivate coffee, which is why coffee remained a key export even into the twentieth century. But such small farms were inadequate for growing sugar. Before the revolution, a typical plantation would have more than 250 acres of cane; after the redistribution, the few estates that cultivated sugar were on fields smaller than 40 acres (Murray Reference Murray1977, pp. 73–74). As a result, Haiti lost essential inputs to producing sugar. “Machinery, suddenly without a purpose in [Haiti], found its way to Cuba; so too did men who worked as sugar technicians” (Ferrer Reference Ferrer2014, p. 10). Furthermore, the remaining plantations struggled to recruit workers because they had to compete with the workers’ farms (Murray Reference Murray1977, p. 91). For the farms that persisted in producing sugar despite the scarcity of capital and labor, productivity plummeted, dropping from 3,000 lbs. of sugar per acre during colonial times to 1,000 lbs. per acre in the 1820s (Murray Reference Murray1977, p. 74).
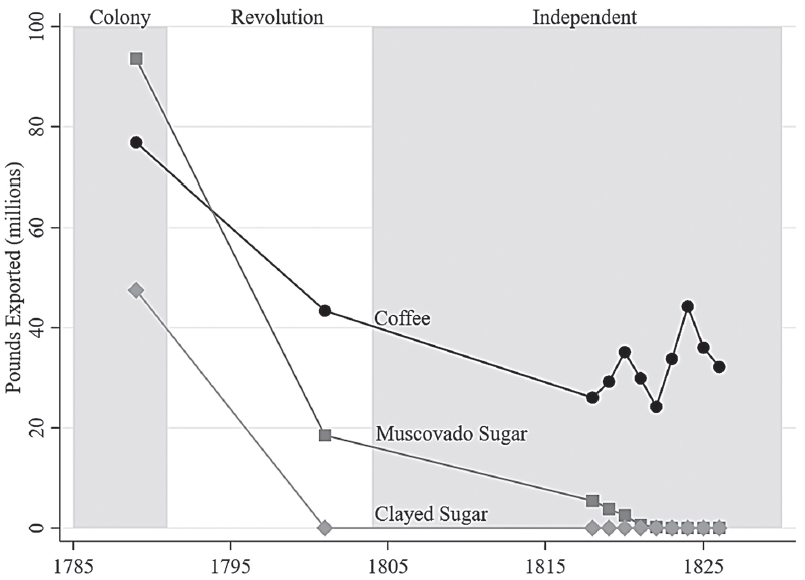
The fall in sugar production can be seen in data collected by Mackenzie (Reference Mackenzie1830), plotted in Figure 3. Mackenzie documented Haiti’s sugar and coffee exports from 1789 to 1826, and although he does not have data from every year, he has at least one observation from the three most important periods: colonial rule (pre-1792), the revolution (1792–1804), and independence (post-1804). From colonial rule to the revolution, we can see a significant drop in coffee, muscovado sugar, and clayed sugar. This is consistent with the revolution leading to a loss of capital and trading partners. Then, by independence, the economy had been transformed: coffee fell by 43 percent, muscovado sugar fell by 80 percent, and clayed sugar disappeared entirely.
EXPORTS FROM HAITI, 1789–1826
Notes: The graph is split into three periods: Colony (pre-1791)—when the French ruled without interruption; Revolution (1791–1804)—when slaves revolted and sovereignty was contested; Independent (post-1804)—when the Haitian state declared independence from French colonial rule. Clayed sugar refers to refined sugar and muscovado is unrefined sugar (still contains molasses).
Source: Mackenzie (Reference Mackenzie1830).
How much did the land redistribution contribute to sugar’s disappearance after independence? An early Haitian political schism provides some insight. In 1805, just one year following Haiti’s independence, the country split into separate governments: the Republic of Haiti in the South, led by Alexandre Pétion, and the Kingdom of Haiti in the North, led by Henri Christophe. While Pétion immediately dismantled plantations and redistributed the land in the South, Christophe preserved the plantation structure in the North. Christophe maintained a plantation-based economy up until his sudden death in 1820, after which the Kingdom of Haiti was reintegrated into the Republic of Haiti. With reunification, the plantation lands in the North were immediately redistributed.
Because redistribution happened at different times in the North and South, we can look at production in these two regions to discern the importance of farm size to sugar production. If large farms were important to sugar production, redistribution after Christophe’s death should have decreased sugar exports from the North. But, since coffee could be produced on small farms, we should not see a drop in coffee. Thus, using the South and coffee production as controls, we could see the effect of the land redistribution on sugar production in the North.
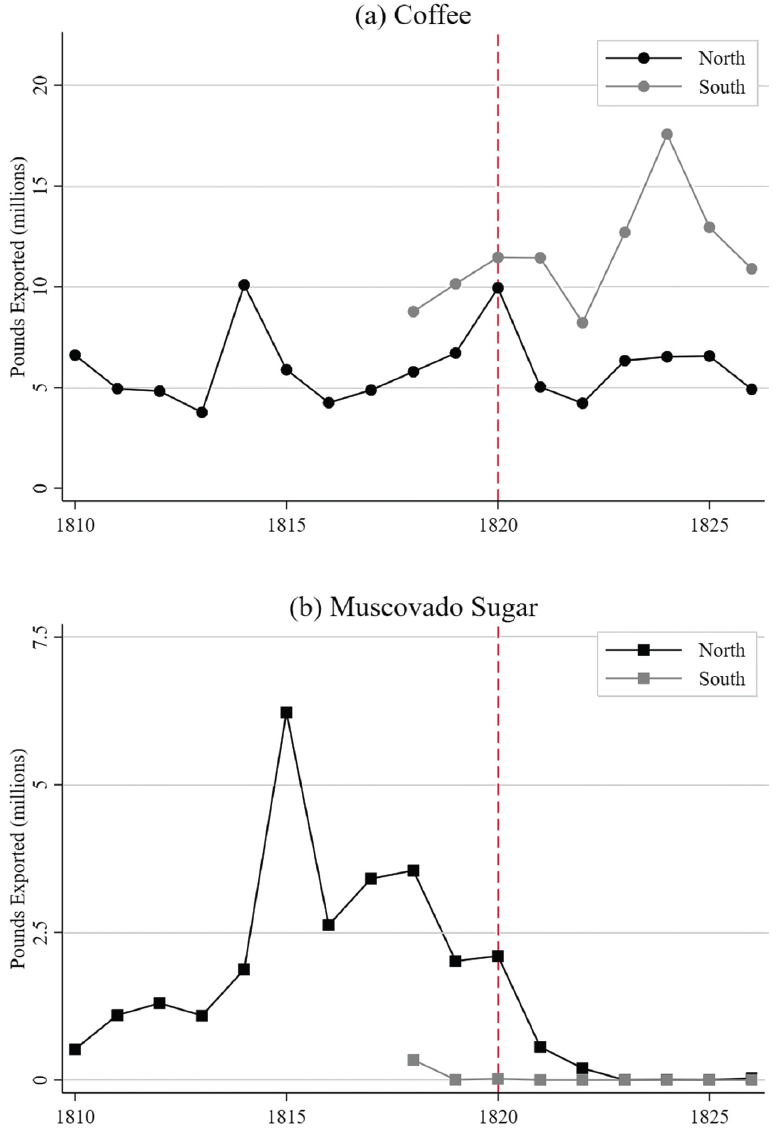
Mackenzie’s (Reference Mackenzie1830) export data allow us to make that comparison. Mackenzie reports data on all exports from the North (Cap Haitien) from 1810 to 1826. In the South (meaning the ports of Les Cayes and Jacmel), Mackenzie only has data from 1818 to 1826. The data are plotted in Figure 4. In Panel (a), we see that although coffee exports fluctuated, the difference between the levels of the North and South did not change after Christophe’s death. Sugar, shown in Panel (b), was a different story. While sugar exports were non-existent in the South, sugar exports in the North were rising. But after Christophe’s death, when the plantations were dismantled, the sugar exports disappeared. It is hard to draw a strong conclusion, but with the limited data available, it is still notable that we see trends consistent with the theory that land redistribution contributed to the disappearance of sugar in Haiti.
COFFEE AND SUGAR EXPORTS IN THE NORTH AND SOUTH OF HAITI, 1810–1826
Notes: South means the combined exports of Jacmel and Les Cayes while North means the exports from Cap Haitien. The vertical dashed line indicates the death of Christophe, which led to the reunification of Haiti and land redistribution in the North.
Source: Mackenzie (Reference Mackenzie1830).
Land redistribution contributed to the elimination of Haiti’s sugar economy in the 1800s. It eroded the old system’s economies of scale while giving farmers an option to farm for themselves. By itself, the land redistribution would have added difficulties to assembling plantations 100 years later. But in addition to the redistribution, Haiti developed property institutions that increased the transaction costs to buying and assembling land.
Foreign Ban and Inheritance Patterns
In addition to the land redistribution, there were two important property institutions: inheritance patterns and a ban on foreign property ownership. Alone, the institutions might not have been sufficient to cause such high transaction costs. But together, they reinforced each other for over a century, cementing Haiti’s land into a system in which farms were small, and transfers were rare.
After the early nineteenth-century land redistribution, an inheritance pattern emerged that put a property under the control of entire lineages. Property owners divided their land equally among heirs (Bastien Reference Bastien1985), a practice officially encoded in the law (Lundahl Reference Lundahl2016, p. 278; Force Reference Force2016, p. 41) and culturally reinforced by a desire to prevent large-scale agriculture from returning and destroying the legacy of emancipation (Dubois Reference Dubois2012, pp. 109–10). Each heir received usufructuary rights over the inherited land, but the entire family held the alienation rights; thus, a farmer could cultivate his plot as he wished, but if he wanted to sell, he needed approval from his siblings, cousins, and beyond. Any family member could veto the sale. The initial redistribution by itself would make aggregating land difficult; however, aggregating plots became even harder because most of the private land had multiple legitimate claimants.
The family practices then created a community culture that favored insiders and discriminated against outsiders. Lundahl (Reference Lundahl1996, pp. 119–21) summarizes some of the research on the property arrangements and suggests that such measures were intentional. Haitian communities engaged in incredibly complex property arrangements that made discerning ownership impenetrable. Furthermore, the state lacked the capacity to systematically demarcate private and state property (Palsson Reference Palsson2021a). Development projects failed because outside technical advisers could not negotiate with a central authority. The literature suggests that the “confusion and uncertainty” (Lundahl Reference Lundahl1996, p. 120) was a deliberate response to threats from outsiders who might try to alienate the land.
Inheritance patterns were not the only institutional defense against the threat of foreigners. Another defense, which contributed to a rise in transaction costs, came from the Haitian government banning foreigners from owning property. In the 1805 constitution, fearing foreign powers would reassert control over their newly independent nation, the Haitian founding fathers put all former French properties into the State’s hands and banned foreigners of any nation from acquiring property in Haiti (Janvier Reference Janvier1886). The ban was not a dead letter; the government enforced it even when outsiders attempted clever circumventions.
An example of enforcement came when foreigners started to acquire land through a loophole. An 1860 Haitian law allowed households headed by a foreigner to own land as long as the Haitian wife held the title (Janvier Reference Janvier1886, p. 275). Exploiting the provision, foreign merchants acquired wives and property. But the strategy soon became popular enough to worry the government (Dubois Reference Dubois2012, p. 174). In response, a new constitution in 1879 stripped citizenship from women married to foreigners, requiring them to sell any property within three months of the marriage and forbidding them from acquiring property in the future. The law allowed the woman to regain her citizenship and property rights only if the husband died and the couple had no children (Janvier Reference Janvier1886, pp. 422–23). By closing this loophole, the Haitian government cut off foreign investment just as sugar was returning to the islands.
The ban introduced a crippling hysteresis by cutting off a key source of capital that could have aggregated land before inheritance patterns made it too costly. Developing sugar production under the new mills required capital and experience, neither of which was available in Haiti. By necessity, sugar production required foreign investment. But because of the ban, that investment was unavailable. Perhaps by itself, the ban would not have been a major factor; after all, many countries instituted such bans after independence. But the ban was not the only impediment to foreign acquisition of land: the inheritance patterns that divided property rights over each generation meant the number of claimants over a parcel of land could grow exponentially. Thus, the cost of restarting the sugar industry was growing during every generation where foreigners were prohibited from investing in Haiti. In 1918, the U.S. occupation eliminated the ban, but because the Haitian government had enforced it for 100 years, the transaction costs associated with acquiring land had become prohibitive. It is possible that removing the ban just one generation earlier could have radically changed Haiti’s experience in the sugar industry.
Thus, in response to colonial institutions, the early Haitians intentionally developed new property institutions that increased transaction costs for land transfers. Anecdotes from Haiti show the transaction costs were important in preventing large-scale agriculture, especially relative to other countries that did develop sugar production.
Transaction Costs Examples
Over the generations, the property institutions combined to create high transaction costs in Haiti for anyone wanting to establish large-scale agriculture. Large farms were important for sugar production because sugar mills required a minimum efficient scale. But purchasing land from smallholders was difficult. Reaching the minimum efficient scale in Haiti required investors to contract with many private farmers and their families. For example, Moral notes that “One sisal company, desiring to acquire about twenty hectares [50 acres] in the east of Cul-de-Sac, has negotiated for three years with 180 propertyholders” (1961, p. 185, emphasis mine).
An investor might have sought the assistance of the state in removing any holdout owners or squatters, but it was not an easy route. While there are many reports of the government expropriating wealth from peasants, there are few confirmed instances of it confiscating peasant land prior to the 1915 U.S. Occupation (Murray Reference Murray1977, pp. 341–42). And although the Occupation certainly led to forced displacement, it removed far fewer farmers than it wanted (Nicholls Reference Nicholls1985, p. 120). Indeed, after ending the ban on foreign property ownership in 1918, the American officials worked through the Haitian government in an attempt to start plantations by giving foreign companies 43,000 acres between 1918 and 1927. But receiving land was a far step from cultivating it:
The attempt to introduce a plantation economy was not a great success, partly due to stubborn resistance on the part of the peasants and to the complicated system of land tenure. Many foreign firms found themselves involved in long and costly legal battles and a number withdrew from Haiti after having suffered losses. (Nicholls Reference Nicholls1985, p. 120)
The concessions were allegedly government land, yet they were checkered with farmers. While certainly, some farmers were squatters, some challenged the government’s claim on the land in court and successfully proved their ownership (Cumberland, Colson, and Stanley 1928, p. 74). Facing such challenges, some Americans advocated reforming eminent domain law to make eviction easier (De La Rue, Pixley, and Craddock 1939, p. 99), but others opposed it because they wanted to maintain support from the masses (Schmidt Reference Schmidt1971, p. 179). There was no low-cost solution to the prevalence of smallholders on agricultural land.
Contrasting Haiti with the Dominican Republic highlights how small differences in property institutions can make a big difference in the development of sugar. The Dominican Republic had a system of property rights that resembled the Haitian system called terrenos comuneros, but there were key differences. In a terreno comunero, the rights to cultivate the land (the rights were called pesos) were held by a group of farmers. But unlike the Haitian system, pesos were held by individuals and could be transferred without the consent of other peso holders in the same terreno comunero (Franks Reference Franks1999, p. 111). Moreover, originally the land was never divided: pesos gave the holder a share of the land, but not a specific piece of land (Franks Reference Franks1999, p. 109). Thus, peso holders had to negotiate and coordinate property rights (Franks Reference Franks1999, p. 110). The history of coordination probably helped in establishing clear rights as the land system evolved and pesos became associated with specific plots (Franks Reference Franks1999, p. 111). When sugar cane expanded with new mills, investors could acquire large farms by buying pesos from individual farmers, and even Dominican entrepreneurs started aggregating pesos to sell to foreigners (Franks Reference Franks1999, p. 113).
To build and run mills, countries like Haiti and the Dominican Republic needed foreign capital. During the nineteenth century, the incentive to commit capital to Haiti was curtailed by the ban on foreign property ownership. The Dominican government, on the other hand, promoted foreign investment as a defense against a possible Haitian incursion (Pinkett Reference Pinkett1941; Sagas Reference Sagas1994). By the end of the nineteenth century, investors in the Dominican Republic demanded clear property rights, received preferential treatment from the government, and bought large tracts of frontier land (Martinez Reference Martinez1999; Moya Pons Reference Moya1985). Early foreign investment contributed to the Dominican Republic’s rapid shift into sugar production.
When Haiti’s ban on foreign property ownership was removed in 1918, capital would have been free to enter Haiti, but at that point, transaction costs made the acquisition of large plots of land unattainable. Clearly, the ban was not the only barrier to attracting foreign capital: the U.S. occupation was prompted by severe political instability, and most properties in Haiti was held under informal tenure. But a key barrier was the transaction costs involved in acquiring land. Even a capital-rich company like Standard Fruit struggled. In the 1930s, Standard bought land for a banana plantation, and Lundahl (Reference Lundahl2016, p. 286) suggests their operations were riddled with transaction costs:
In order to secure enough land in fairly contiguous territory for efficient operations, the company has had to sign lease and share contracts with hundreds of little land owners. A record of production has to be kept for each land plot and a record of payments to each peasant must be maintained. Even then there are small plots here and there within the contiguous area where the owners refused to lease their land and with whom arise interminable disputes with regard to whose bananas are whose, and whose land shall receive irrigation water and when, whose stock get into whose crops etc. Much land in Haiti is simply not available for large scale operations.
Contrasting this experience with how the banana industry developed in Jamaica shows that Haiti’s high transaction costs might have been avoided had foreigners been able to invest sooner. Jamaica had similar factor endowments as Haiti, and both had colonial sugar economies that relied on slave labor. Jamaica even experienced a similar post-emancipation land redistribution that eliminated sugar production.Footnote 7 But unlike Haiti, Jamaica could not ban foreigners from owning property because emancipation did not remove Jamaica from the British Empire. When global demand increased banana prices, foreign investors monopolized shipping and then bid up land prices. Within a short period, plantations returned to Jamaica (Holt Reference Holt1992). Despite similar early experiences, Jamaica received foreign capital before it could develop Haitian-like transaction costs.
Transaction costs also explain why small sugar producers could thrive in Puerto Rico but not in Haiti. Puerto Rico’s small-farm economy provided an initial barrier to sugar production, but through purchasing and leasing land and contracting with small suppliers, production flourished. The above examples with bananas and sisal suggest that Haiti’s contracting environment was much more complex. Setting aside problems that might have arisen in the legal enforcement of contracts, just establishing such contracts in Haiti seems to have been onerous.
One might wonder why Haiti allowed such institutions to persist when there were potentially large gains to removing them. But it was not obvious at the time that Haiti was losing much from its high transaction costs. Although Haiti was a poor country throughout the nineteenth century, it was never the poorest in the region. Thanks to its coffee production, Haiti at times outperformed the Dominican Republic, Puerto Rico, and Jamaica (Bulmer-Thomas Reference Bulmer-Thomas2012). The innovations in sugar milling came after the property rights had already created large transaction costs. Possibly the only room for improvement in retrospect was the strict enforcement of the ban on foreign ownership of property. But enforcing the ban was not irrational: Haiti’s independence was not guaranteed.
In summary, historical institutions divided the land among the population and created forces that prevented the government or investors from consolidating it. By the beginning of the twentieth century, smallholders dotted the country, a unique pattern relative to similar countries.
EMPIRICAL STRATEGY AND DATA
I have presented a puzzle about Haiti—sugar production was non-existent despite suitability for cultivation—and proposed an explanatory hypothesis—sugar production was impeded by high transaction costs caused by historical property institutions. While anecdotes and comparisons to other countries support the transaction cost hypothesis, empirically testing the hypothesis is difficult. The hypothesis explains the absence of Haitian sugar plantations, but it is empirically difficult to test something that does not exist anywhere. Instead of looking at the effect of transaction costs on creating sugar plantations, we can take a broader interpretation and look at starting any farm. If transaction costs impeded the start of smaller farms, it is natural to conclude that they also prevented the formation of larger sugar plantations. But even with the broader view, we still run into a problem: Haitian land data are scarce. Indeed, the lack of empirical evidence for the transaction cost hypothesis is not because it is novel—Moral (Reference Moral1961) presents the transaction cost hypothesis using convincing anecdotal evidence, and Lundahl (Reference Lundahl2016) mentions the argument but does not explore it because his analysis relies on macrodata which are insufficient for testing this micro-level hypothesis. The hypothesis has not been tested because data on Haitian land are difficult to find (Lundahl Reference Lundahl1996).
Yet data on land are necessary but not sufficient. We also need to measure transaction costs within Haiti. Transaction costs generally are unobserved, so in most cases, researchers need to develop a proxy measure. Thus, in this environment with a paucity of data, we need to find a data source that allows us to measure transaction costs, but that data source needs to be independent of the data source for Haitian land-use, so we do not induce a spurious correlation.
To overcome these problems, I present two new data sets.Footnote 8 One describes new farms started in a government land rental program. The other proxies for transaction costs using settlement patterns gathered from maps. With the two data sets, I can explore the cross-sectional implications of the transaction costs hypothesis. Areas with higher transaction costs should move less uncultivated land into cultivation.
Land Rental Data
While data on Haitian land has been historically difficult to find, I have collected a unique source on new farms started in Haiti from 1928 to 1950. The farms were started as part of reforms implemented during the American Occupation of Haiti (1915–1934).
In 1914, the U.S. Marine Corp began occupying Haiti as an extension of an American strategy to stabilize the Caribbean.Footnote 9 The marines initially intended to leave quickly, but the occupation lasted until 1934 because officials feared a hasty withdrawal would create instability.Footnote 10 In extending the occupation, American officials gained greater control over policymaking, and one of the top priorities became strengthening the Haitian government through increased internal revenues.Footnote 11 Before the Occupation, the Haitian government relied almost exclusively on volatile customs receipts. From 1911 to 1915, customs supplied over 97 percent of government revenue. This dependency decreased after the U.S. entered, but even in 1926, customs still comprised 86 percent of revenues.Footnote 12
Seeking a stable source of internal revenue, the American officials controlling Haiti’s finances believed the government could increase revenues from the government’s large collection of uncultivated land (Cumberland, Colson, and Stanley 1928, p. 65). To put the idle land into production, the American officials decided to reform a flagging 1877 land rental program. The 1877 program had degenerated and produced few benefits for the government; as one official said, “It would be hard to devise a system more susceptible to fraud or more difficult to administer properly” (Cumberland, Colson, and Dunn Reference Cumberland, Colson and Dunn1926, p. 119). The American reforms clarified the program’s organization, corrected price distortions, created incentives to invest in the land, and made available for rent a reported 915,000 ha (3,700,000 acres) located throughout the country (Millspaugh Reference Millspaugh1929, p. 561). Also, the reform guaranteed the tenant could farm the land for 20 years and made him the residual claimant on any investments he made on the plot. The American officials hoped that their reforms would mobilize the government’s uncultivated land and quickly supply the government with revenue.
This rental program presents an opportunity to look for the latent demand for larger farms. Remember, the government was the country’s largest landholder, and this rental program was offering this land to the public. There were no limits on farm size. If the government had large, contiguous plots available, then this would be the quickest way to obtain them. Furthermore, if there were contiguous plots, the renter could negotiate with just one party—the government—and not hundreds. But the government might not have had large plots of contiguous land. We do not know much about what the government’s land looked like after it had gifted and sold many of its holdings. But during the redistribution in the 1800s, the government may have prioritized revenue over maintaining contiguous plots, and thus the rental program might not have had contiguous plots available. Indeed, Millspaugh (Reference Millspaugh1929) describes the government’s land as “scattered tracts” (p. 561). The description conjures a picture of areas where government and private land cover the land like a checkerboard, which would make getting a large, contiguous plot difficult.
Another valuable aspect of this program is that it presents an opportunity to observe farms Haitians chose when they did not have to use their inherited land. One of the theories for Haiti’s abundant small farms is that most farmers inherited small plots, and transaction costs prevented them from getting a larger one (Lundahl Reference Lundahl2016). Note that this is a slightly different argument than the one for plantations. In the plantation case, the argument is that no one, not even the government, owned a sufficiently large plot to achieve the scale needed for sugar mills without negotiating with many parties to get the land. In this case, the farmer was not trying to obtain a plantation-sized plot: this is about a farmer who has a high marginal return to land but cannot access it because of transaction costs in the land market. This farmer would not care if the government had plantation-sized plots but might be eager to get one of the smaller pieces of land.
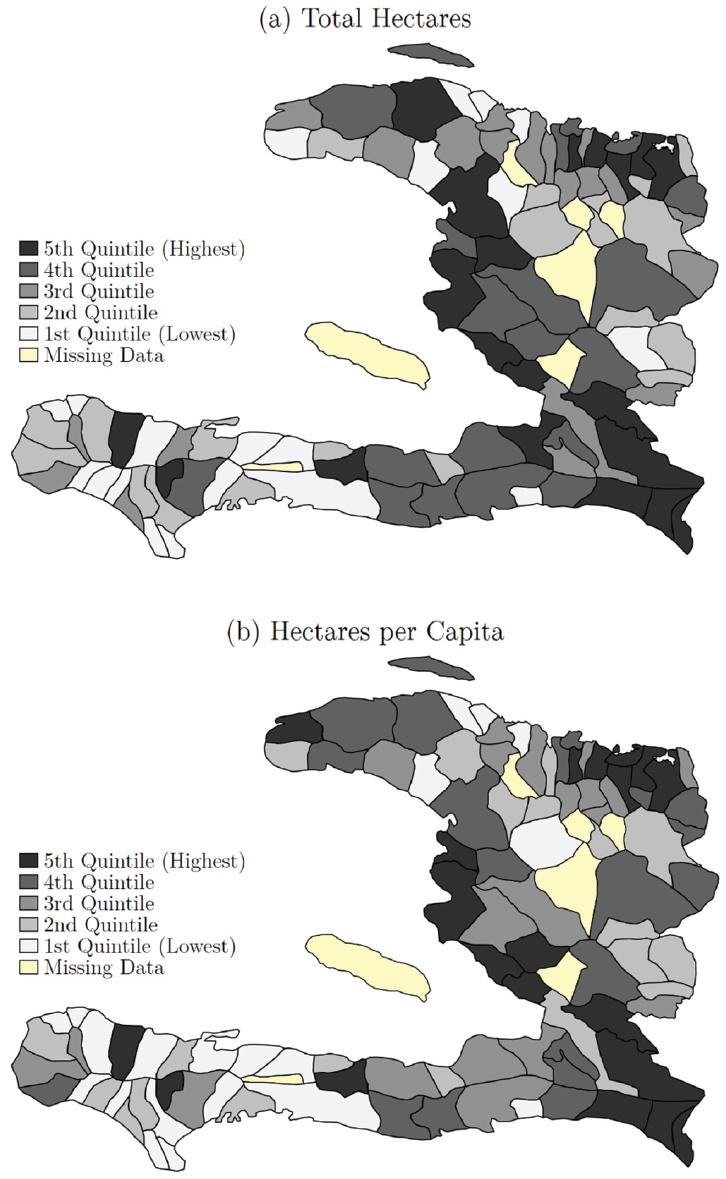
I collected data on the universe of farms started under the program from 1928 to 1950. The program’s legislation required the government to publish a notification in its official gazette, Le Moniteur, any time someone started a farm on uncultivated land. The notifications show that over these 22 years, farmers started 5,792 agricultural plots.Footnote 13 Each notification contains descriptive information about the requested land, listing the plot’s location in one of Haiti’s 107 administrative districts (communes) and describing the plot’s size and neighbors (what was located on the north, south, east, and west side of the plot). It also listed the renter’s name and the date he or she requested the land. Figure 5 shows the spatial distribution of the land rental data. Panel (a) organizes the distribution by the total number of hectares adopted in each district, and Panel (b) looks at hectares per capita.
SPATIAL DISTRIBUTION OF IDLE LAND CONVERTED TO FARMLAND, 1928–1950
Note: Population figures used to calculate hectares per capita come from the 1950 census.
Sources: See Online Appendix Table A1 and the main text.
One concern with this data is we do not know how much land the government owned in each district. While this could complicate whether trends are driven by supply or demand, the evidence suggests the supply of land was not a binding constraint. Prior to the reform, revenues from land rentals were the most important source of revenue for rural districts (Cumberland, Colson, and Stanley 1928, p. 124), so the program already existed throughout the country. The total area for all farms started in the data was 30,000 ha. According to one official who helped develop the program, the state had the potential to rent out about 1,500,000 ha available (3,700,000 acres (Millspaugh Reference Millspaugh1929, p. 561)). Using this figure, the average district should have 15,000 ha available. In the data, the district with the most land rented during this period rented out 2,040 ha total, so it is unlikely the constraints were binding. For some districts, we have lower-bound estimates of available land, and the Online Appendix shows that even the lower-bound estimates were not binding. Despite the government’s efforts to induce farmers with its rent guarantees, investment incentives, and clear title, few farmers rented land.
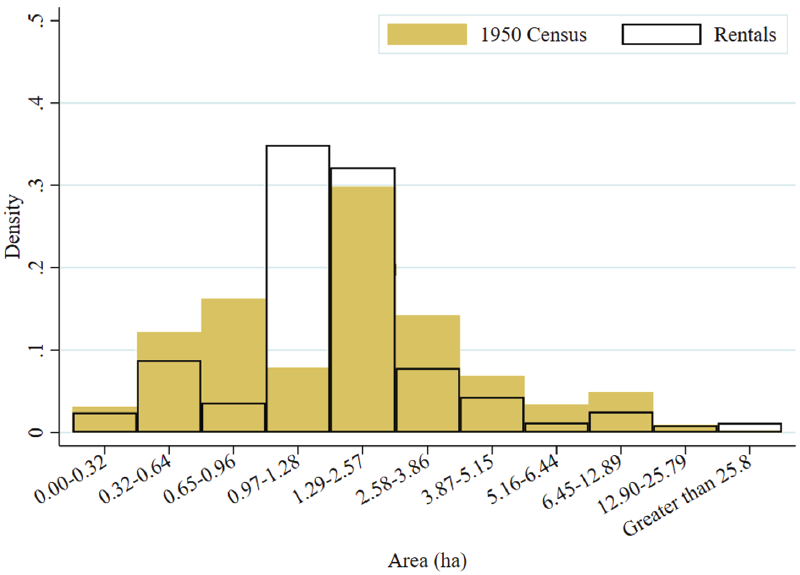
Exploring the notifications data provides new insights relevant to the transaction cost hypothesis. To explore how people chose farms when they were unconstrained by inheritance customs, Figure 6 superimposes the farm-size distribution for the rental plots on the distribution of all farms reported in the 1950 census. If subdividing plots over generations gave farmers farms that were too small, then the land rental program, even if it could not enable plantation farming, should have been able to easily accommodate moving to a slightly larger farm. Figure 6 shows that farmers avoided farms at the smallest end of the distribution, choosing farms around 1.29 ha. While this suggests that inheritance patterns constrained farmers, it is also necessary to note that almost every size category above 2.57 ha was less prevalent in the rental data than in the census. The only category among the larger farms where the rental data had relatively more farms than the population was at the top (greater than 25.8 ha), but even those categories were close. Thus, the rental land data indicate that traditional land institutions both put too many people on small plots and also prevented people from starting large farms.
DISTRIBUTION OF PLOT SIZES IN THE CENSUS AND STATE RENTALS, 1928–1950
Notes: Categories are defined according to the 1950 agricultural census. The smallest plot in the rental data is 0.10 hectares and the largest is 1,000 hectares.
Sources: 1950 Agricultural Census of Haiti. See Online Appendix Table A1 and the main text.
The notifications also show that many of the rentals were adjacent to private land, revealing private and public land were intermingled like a checkerboard. The notifications often identify whether the neighboring plot was owned by the government or an individual. But ownership was not specified in every case. If we assume the notification always said when the government owned the neighboring plot, then 67 percent of plots had at least one neighbor owned by a private party. But the notification’s writer might have omitted ownership in cases where the reader would be expected to know the government owned the surrounding land, meaning this figure might overestimate the prevalence of private land. A more conservative estimate of how many government plots abutted private land looks just at how many plots had at least one state-owned neighbor and at least one privately-owned neighbor. In this case, 48 percent of plots were bordered by both private and state land. From the notifications, we cannot tell if the private neighbors are squatters or if this tells us the early government sold the land without consideration for maintaining contiguous plots. But they paint a picture of state-owned land checkered with privately cultivated land, preventing anyone from controlling a large, contiguous plot.
But the notifications also reveal that transaction costs could not have been the only barrier to expanding farm sizes. Looking at whether the plots bordered unoccupied land provides evidence that farmers chose the smaller 1.29 ha farms because of capital constraints. Since the government did not set limits on farm sizes, farmers could choose the size that fit their constraints. With the notifications, we can see many farmers rented land that bordered idle land: 15 percent of plots had at least one neighbor listed as “unoccupied state land,” and 31 percent of plots had at least one neighbor listed as “rest of the land” or simply “the State.” Together this means that 46 percent of renters gave up the opportunity to rent larger plots. Since the state owned the land already, transaction costs cannot explain the failure to take advantage of the additional land. A likely explanation is cash or credit constraints, where farmers did not have enough cash on hand to rent a larger plot and also lacked access to credit (probably because the complex property rights hindered the development of credit markets). These patterns suggest transaction costs might have a U-shaped effect on farm sizes: they affect the smallest and largest farms, but the mid-size farms are more affected by capital constraints. It is worth noting that while the data cannot provide concrete evidence for causal effects, they do provide suggestive new evidence that should be explored further.
Transaction Costs—Settlement Pattern Data
Given the right data, we might be able to estimate transaction costs on property transfers, but the problem is we can only measure successful transactions. The challenge with transaction costs is they prevent property sales from happening. Thus, using data on successful transactions would give us information on properties that had the lowest costs and ignore the areas where costs were prohibitively high. We cannot measure realized costs; we need to proxy for potential transaction costs.
To see how we could measure potential transaction costs, consider a thought experiment: If a farmer wanted to start a 100-ha plantation, how many households would he need to remove from the land? This is essentially the thought experiment Moral (Reference Moral1961) proposes when he presents the map of Haitian houses shown in Figure 2. He argues that because households are scattered across the area, potential investors cannot get enough land to start a plantation. In a Coasean world free of transaction costs, the houses are not a problem. But given our understanding of the property rights institutions, we know that each house represents a series of transaction costs, not just from interacting with separate households but also from getting approval from extended families. Thus, in our thought experiment, we could say the transaction costs for acquiring that land will be linked to the number of households on the 100-ha plot.
We can use the maps to turn this thought experiment into a proxy for transaction costs. The map Moral (Reference Moral1961) presents comes from the 1956 U.S. Army Inter-American Geodetic Survey, which is available at the Digital Library of the Caribbean (United States Army Map Service 1958). Using high-quality scans, I divide the entire map into “simulated plantations” of about 100 hectares (256 × 256-pixel squares). Simulated plantations are assigned to the district containing the majority of its pixels, and plantations are discarded when the majority of pixels fall in the ocean or the Dominican Republic.Footnote 14 The map produces 32,412 simulated plantations in 70 districts, with the average district containing 506 plantations. I randomly sample 10 percent of the simulated plantations and count the number of houses on each plantation using an image processing algorithm I describe in the Online Appendix. For plantation i in district d, the algorithm outputs xid, the number of houses in the image. In the sample, the median plantation has two houses but the average has more than seven, a skewed distribution that indicates there are some incredibly dense plots of land. For each district, I calculate μd and σd, which are the mean and standard deviation of x for all plantations in district d.
Continuing the thought experiment, we can see how μd and σd relate to transaction costs. It is straightforward to connect μd to transaction costs: more houses on the average plantation should lead to higher transaction costs. But the relationship between σd and transaction costs requires a short proof. Suppose there are two districts, D and E, and let Xi be a random variable measuring transaction costs in district i with mean μ and variance
 $$\sigma _i^2$$
. Note that the mean is the same for both districts, and assume without loss of generality that σD > σE. Let F(Z) be the cumulative distribution function for the standard normal distribution. To start a plantation, an investor must find a plot of land where the transaction costs are less than x < μ. Then the probability that the investor finds land in district i with transaction costs less than x is
$$\sigma _i^2$$
. Note that the mean is the same for both districts, and assume without loss of generality that σD > σE. Let F(Z) be the cumulative distribution function for the standard normal distribution. To start a plantation, an investor must find a plot of land where the transaction costs are less than x < μ. Then the probability that the investor finds land in district i with transaction costs less than x is
 $$F\left( {\frac{{x - \mu }}{{{\sigma _i}}}} \right)$$
. Because x < μ and σD > σE,
$$F\left( {\frac{{x - \mu }}{{{\sigma _i}}}} \right)$$
. Because x < μ and σD > σE,
 $$F\left( {\frac{{x - \mu }}{{{\sigma _D}}}} \right) \gt F\left( {\frac{{x - \mu }}{{{\sigma _E}}}} \right)$$
; thus, the probability of finding suitable land in district D is higher than in district E. Hence, holding μ constant, a greater σ means the district has more land available at low transaction costs. Transaction costs are increasing in μ but decreasing in σ.
$$F\left( {\frac{{x - \mu }}{{{\sigma _D}}}} \right) \gt F\left( {\frac{{x - \mu }}{{{\sigma _E}}}} \right)$$
; thus, the probability of finding suitable land in district D is higher than in district E. Hence, holding μ constant, a greater σ means the district has more land available at low transaction costs. Transaction costs are increasing in μ but decreasing in σ.
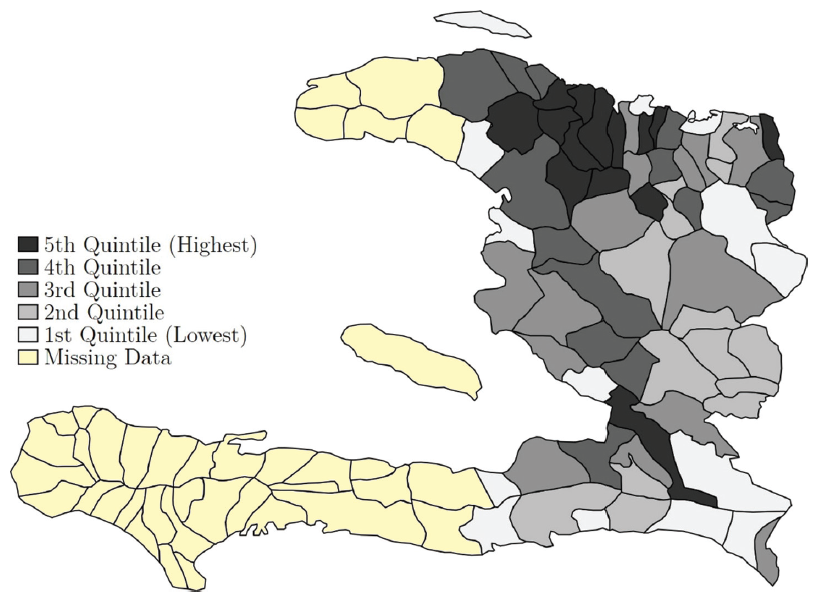
Figure 7 shows the spatial distribution of ln(μd), which will be used in the empirical work below. Although the maps only cover the Eastern portion of Haiti, the covered districts account for 70 percent of the population. From the map, we can see clusters where transaction costs are similar. For instance, most of the districts with the highest transaction costs are located in a cluster in the north. Moran’s I, a measure for spatial correlation, is 0.20 and is significant at the 1 percent level. Therefore, in the empirical analysis, I calculate standard errors accounting for spatial correlation.
SPATIAL DISTRIBUTION OF TRANSACTION COST PROXY
Note: The map depicts the quintiles of ln(µ d).
Sources: See Online Appendix Table A1 and the main text.
Note that the maps were created in 1956, and my land rental sample ended in 1950. Thus, we are observing settlement patterns after the land has been rented. Naturally, when considering the effect of settlement patterns on land use, the timing raises questions of reverse causality. The analysis will look at how settlement patterns relate to land use, arguing that denser settlement patterns impede land use. A critic could argue that since I am measuring settlement patterns after the land sample ends, we are actually observing the effect of land use on the settlement. This reverse causality story is plausible, but note that it moves in the opposite direction of the transaction cost theory. If farm starts shape settlement patterns, that means districts that moved more land into cultivation will have a higher µ. If reverse causality is the only link between the farm starts and settlement, then we would expect to find a positive correlation between µ and land use, whereas the hypothesis is that there is a negative correlation. Thus, reverse causality works against finding evidence to support the transaction cost hypothesis.
TESTING THE TRANSACTION COST HYPOTHESIS
Empirical Strategy
Under the transaction cost hypothesis, the ideal empirical strategy would be to regress farm starts on transaction costs. Given the transaction cost hypothesis, we would expect to find a negative relationship: districts with higher transaction costs should have had fewer farms. But the straightforward empirical strategy needs to be adjusted for the proxy I collected.
The empirical strategy takes advantage of the population’s spatial distribution. I estimate the following regressions:
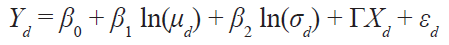 $${Y_d} = {\beta _0} + {\beta _1}\ln \left( {{\mu _d}} \right) + {\beta _2}\ln \left( {{\sigma _d}} \right) + {\rm{\Gamma }}{X_d} + {\varepsilon _d}$$
The outcome Y d is land adopted in each district d (either the total land, average farm size, or number of farms), and μd and σd are, respectively, the average number of households per simulated plantation and the variance. The summary statistics μd and σd are proxies for transaction costs. There is also a vector of controls Xd, which will control for factors that affect land adoption, such as the slope of the terrain, market access, and latitude.
The coefficients of interest are β 1 and β 2. The transaction cost hypothesis says that high transaction costs prevent land, including government land, from being moved into productive agriculture. The dependent variable measures how much uncultivated land in district d was moved into agriculture during this period. As outlined above, transaction costs should be increasing in μd. Since transaction costs impede farm starts, we expect β 1 < 0. Similarly, transaction costs are decreasing in σd, so we should see β 2 > 0.
Results
The first column of Table 1 shows the regression of total land adopted in each district from 1928 to 1950 on settlement patterns. Consistent with transaction cost theory, higher average density is associated with fewer land in new farms, and higher variance is related to more land in new farms. Because the regression uses the log transformation of both the dependent variable and independent variables, the coefficients can be read as elasticities. The magnitude of both elasticities is greater than but not statistically different than one. If we take the results literally, the large magnitudes suggest that each additional household on a plot increases the transaction costs by more than one person, which matches the story of ancestral lines holding claim to a property: an additional house is not just one extra negotiation; it is an entire ancestral line. Although the coefficients are consistent with the causal story, it should be noted that we cannot interpret these as causal effects.
THE RELATIONSHIP BETWEEN SETTLEMENT PATTERNS AND THE TOTAL LAND ADOPTED IN A DISTRICT, 1928–1950
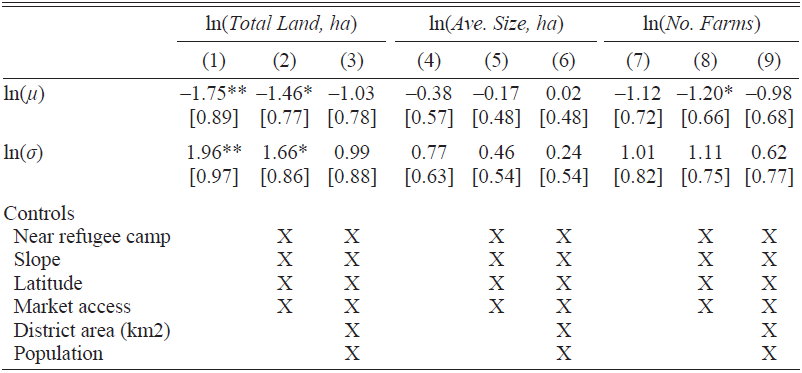
Notes: All regressions have 65 observations. Standard errors in brackets account for spatial correlation across neighboring districts. The variables µ and σ are the mean and variance of dots counted on simulated plantations in the district as described in the Online Appendix. The dummy for near a refugee camp indicates that the district is within 20 km of a camp. Border indicates that the district touches the Dominican Republic. Slope is the mean slope in the district. Market access measures how many hours it takes to reach the closest major market. ***p<0.01, **p<0.05, *p<0.1
Sources: Online Appendix Table A1 and the main text.
Because settlement patterns are not random, Columns (2) and (3) in Table 1 use additional controls. There is a dummy variable indicating whether the district is close to a refugee camp since a 1937 massacre in the Dominican Republic increased demand for land (Palsson Reference Palsson2021b). Controlling for the district’s average slope accounts for how the terrain may alter settlement patterns, and controlling for the district’s latitude captures the climatic suitability to cash crops. A market access control measures how many hours it takes to get to the closest large Haitian market, taken from a 1932 Marine report.Footnote 15 These controls reduce the coefficients’ magnitudes, but they remain above one, significant, and most importantly, they retain the predicted signs.
To show that the transaction cost variables measure something more than population density, Column (3) of Table 1 also displays results that control for the district’s land area and population. One might argue that the transaction costs variables are just measures of population density, but including these additional controls holds population density constant and compares differences in settlement patterns. Of course, the relationship between transaction costs and population density is real, which is why including the controls reduces the magnitudes further, but the signs remain.
The total land is a combination of two factors: the number of farms and the average farm size. The transaction costs hypothesis predicts both will be smaller in areas with higher transaction costs. Columns (4)–(9) look at this prediction. The results are not as statistically strong as the total land regressions, but we see consistent findings. Higher transaction costs are associated with smaller farms, though this relationship gets weaker with the additional controls (Columns (4)–(7)). Most of the correlation is coming from the number of farms (Columns (5)–(9)).
One concern with the regressions is that they do not control the total government land supplied in each district. Land supply is captured to some extent by controlling for the district’s total land area, but omitting direct measures might misattribute the effect of supply differences to the settlement patterns. Differences in the supply of land across districts could create the same observed relationship between settlement patterns and land adoption: supply might be lower in districts with more households per plantation and higher in districts with greater variance. But Online Appendix Table A2 shows the adopted land is too small a fraction of the total idle land for land supply to be a binding constraint.
It is also important to note that the results in Table 1 are the opposite of what we would expect from many countervailing theories. First, we might expect that population pressure pushes districts with denser settlements to adopt more land and larger farms. But that would create a positive coefficient on μd. Similarly, if the reverse causality issues mentioned earlier were serious, we would see a positive coefficient. Thus, the confounding effects imply that the true correlations could be much higher.
Overall, the results in this section provide new evidence for the transaction cost hypothesis, but the results should not be oversold. While the signs on the coefficients generally match the hypothesis, in many cases, the power is not strong enough to detect statistical significance. This could be because my measure of transaction costs is a noisy proxy, and error in the measurement is confounding the results. Of course, the lack of statistical significance could also mean transaction costs are not affecting the land rental program.
CONCLUSION
The puzzle at the center of this paper is why Haiti failed to develop a sugar industry despite the many factors that indicate it should have: its historical experience, its beneficial factor endowments, its mobile labor, and its idle agricultural land. The proposed answer is that developing a sugar industry required a minimum efficient scale, and transaction costs prevented Haitian farms from reaching that scale.
Now that this paper has presented the first empirical investigation of the hypothesis, how convincing is the evidence? Some of the most convincing evidence for the transaction cost hypothesis is the corroboration assembled across diverse sources and periods in Haiti’s history. For example, the evidence that eliminating large plantations in the early 1800s after independence led to the disappearance of sugar production. Then evidence from a century later shows that the areas where we expect to find higher transaction costs (thanks to settlement patterns) were also areas where less land was moved into new farms.
While the paper assembles a lot of evidence in favor of the transaction cost hypothesis, there are significant limits to the study. No single piece of evidence is convincing by itself: the historical details rely on anecdotes and the econometric analysis is underpowered. But in a context like Haiti, where data are scarce and our understanding is deficient, any detail is welcomed. Indeed, the most important contribution from the new data is the activity we can observe in the land market. There was an active market. But it was small, both in the number of transactions and the size of the farms: over 22 years, fewer than 6,000 farms started, with the modal farm being between 1.29 and 2.58 ha. This alone provides new insights into Haiti’s history and could potentially open new paths to further exploring this hypothesis.
It is also important to understand the limits of the transaction cost hypothesis. While the transaction cost hypothesis is important to understanding Haiti’s agricultural structure, there are competing hypotheses. This study has tried to strengthen the case for the transaction cost hypothesis, but it cannot assert the relative importance of this hypothesis over others. In fact, the new data strengthens some competing hypotheses. For example, the many farms adjacent to uncultivated land suggest that capital constraints must have prevented farmers from getting bigger farms.
Another question left open by the paper is to give a definite answer on whether sticking to small farms and failing to develop sugar plantations hurt Haiti’s development. Haiti’s great potential for increasing output is easy to see with some back-of-the-envelope calculations. In 1949, Haiti exported 19,000 tons of sugar while Puerto Rico produced 940,000 tons (Bulmer-Thomas Reference Bulmer-Thomas2012, table C.5). For Haiti, it is hard to discern how much land produced sugar, but Puerto Rico achieved its output on 354,000 acres (U.S. Bureau of the Census 1952). Allegedly in Haiti, there were 3.7 million acres of scattered idle land. Thus, Haiti could get to Puerto Rico’s scale by moving 10 percent of its idle land into cultivating sugar. Perhaps it is too optimistic to assume Haiti could shift that much into production or match Puerto Rico’s productivity. But even if Haiti maintained that productivity on 5 percent of the idle land, or mobilized the full 10 percent but was only half as productive as Puerto Rico, it could still have produced 470,000 tons. That output in 1949 would have been just shy of the Dominican Republic’s. Assuming output for its other exports did not decrease (which is defensible since we are assuming the production is on the idle land, but probably not realistic), then matching the Dominican output would have increased Haiti’s export revenues by 130 percent. There is no doubt that sugar had the potential to expand Haiti’s economy.
But achieving that output would have come at a cost. The small attempts to restart the plantation economy at the beginning of the occupation forced thousands of farmers off the land they had cultivated for generations, causing severe hardships (Nicholls Reference Nicholls1985, pp. 119–20, 187). As explained above, removing the farmers was so costly that many companies abandoned their claims to land. Furthermore, it is not obvious that greater sugar output would have led to economic development. Sugar production would have been financed by foreign capital, meaning much of the profits would have left the country. The wages of migrants working in Cuba and the Dominican Republic suggest Haitians would have captured some of the gains, but there is plenty of evidence arguing that Haitians preferred a small-farm economy. It is difficult to describe the counterfactual Haiti.
Despite the paper’s limitations, there are important insights on how transaction costs affect misallocation. Misallocation of farm size can explain about one-half of agricultural productivity differences between poor and rich countries (Adamopoulos and Restuccia Reference Adamopoulos and Diego2014). Haiti’s experience tells us that creating a more efficient allocation of farmland could require massive changes in property rights. Sometimes we think that we can get the efficient allocation just by assigning clear property rights, but in a situation like Haiti, who do we assign the rights to? These are complicated institutions, and changes would mean benefitting one person at the expense of the family. Furthermore, enforcing property rights requires state capacity, and it is unclear whether Haiti developed enough state capacity to credibly reorganize property rights. Eliminating transaction costs is not a simple policy solution.
The Haitian story also has broader implications for our understanding of institutions and development. Engerman and Sokoloff (Reference Engerman and Ken2002) argue that an economy full of small farms will create institutions that promote growth because low inequality fights exclusive institutions. In some respects, Haiti’s post-colonial experiment followed Engerman and Sokoloff’s predictions by creating a more equal land distribution than in the rest of Latin America (Lundahl Reference Lundahl1996, p. 121). Yet exclusive institutions still emerged. Understanding how exclusive institutions prevailed despite widespread land ownership is an important direction for future research.


 Open access