

1. Introduction
A major type of social-indexical information that listeners extract from speech is the speaker’s regional origin. Any identification of a speaker’s regional origin is based on mental maps (Gould & White, Reference Gould and White1974), that is, ideas that we have acquired about a place or area influenced by personal and social experience. The identification of regional origin (whether this identification is objectively accurate or only subjectively believed) simultaneously activates particular stereotypes and evaluations regarding characteristics of the speaker’s perceived group memberships (Dragojevic, Berglund & Blauvelt, Reference Dragojevic, Berglund and Blauvelt2018; McKenzie, Reference McKenzie2015; McKenzie et al., Reference McKenzie, Huang, Theng Ong and Snodin2019; Van Bezooijen & Gooskens, Reference van Bezooijen and Gooskens1999). Listeners use these connotations to estimate their psychological distance to the speaker on the basis of their linguistic experience from past conversations (Montgomery, Reference Montgomery2012). Perceptual-dialectology studies aim to elicit the geographical partitioning of these associations by either asking listeners to draw mental maps (e.g., Preston, Reference Preston1989) or presenting listeners with voice stimuli to be associated with a geographical area. Both types of data can inform researchers on the coarseness of listeners’ socioindexical representations: If listeners perceive two objectively different dialect fragments as fitting the same regional stereotype, they evidently belong to a single overarching mental category.
Underpinning the use of perceptual dialectology in mental-map and input-driven tasks is the belief that an individual listener’s extraction of social-indexical information from speech, as well as their associating it with social-indexical categories, is at least somewhat consistent both within and between individuals. The present paper uses a new type of mental-map task to investigate the extent to which this holds true. Specifically, we pose two questions: How accurate are listeners at detecting regional provenance in a fragment of speech, and what listener-specific factors modulate this accuracy?
The majority of research specifically investigating the identification of speakers’ places of origin has concentrated on the perception of regional varieties of English by native listeners, mostly in the United States (Clopper & Pisoni, Reference Clopper and Pisoni2007; Cramer, Reference Cramer2010; Jones et al., Reference Jones, Yan, Wagner and Clopper2017; McCullough, Clopper & Wagner, Reference McCullough, Clopper and Wagner2019) and in the United Kingdom (Williams, Garrett & Coupland, Reference Williams, Garrett, Coupland and Preston1999). In this tradition, the regional variety is studied holistically, for which reason these are often considered studies on dialect recognition. Bent and Holt (Reference Bent and Holt2017) summarized the evidence from the United States and the United Kingdom by saying that listeners cognitively represent regional dialectal variation in their native language, but this representation is relatively broad as, for instance, showing a rough distinction along a single geographical axis (e.g., north versus south; Plichta & Preston, Reference Plichta and Preston2005).
In practice, the largest component of regional variation in the aforementioned studies comes down to accent variation. In continental Europe and Asia, studies that were explicitly positioned as accent-recognition studies have been conducted in Denmark (Ladegaard, Reference Ladegaard2001), the Netherlands (Van Bezooijen & Gooskens, Reference van Bezooijen and Gooskens1999), Germany (Diercks, Reference Diercks, Long and Preston2002), and China (Yan, Reference Yan2015). Methodologically, many prior studies on accent recognition have employed either forced-choice categorization tasks (e.g., Clopper & Pisoni, Reference Clopper and Pisoni2006; Kristiansen, Zenner & Geeraerts, Reference Kristiansen, Zenner and Geeraerts2018; Prikhodkine, Reference Prikhodkine, Evans, Benson and Stanford2018) or free-response tasks (e.g., Bent et al., Reference Bent, Atagi, Akbik and Bonifield2016; Clopper & Pisoni, Reference Clopper and Pisoni2007; Jones et al., Reference Jones, Yan, Wagner and Clopper2017; see also Clopper, Reference Clopper, Pardo, Nygaard, Remez and Pisoni2021, for an extensive discussion of methods in recognition studies). In forced-choice categorization tasks, listeners are required to select possible speaker origins from a predetermined list of countries, regions, or varieties. This procedure potentially helps listeners classify speech into specific language groups or geographical areas, but the obtained classifications have the disadvantage of being based on researcher-determined categorizations. In contrast, free-classification measures permit listeners to create their own perceptual labels and lend themselves to the insightful analysis of both miscategorization and correct categorization patterns. However, free classification often gives rise to coding issues. To avoid the drawbacks of both forced-choice categorization and free-classification tasks, Cramer (Reference Cramer2010) instead asked her listeners to pinpoint on a map where they believed the speaker to be from. The present study expands and advances this methodological line, introducing a novel map-based accent-recognition task.
We focus on the role of regional accent in standard language, using the case of Netherlandic Standard Dutch, which shows notable regional variation at the phonetic level (e.g., van der Harst, Reference van der Harst2011), that is, regional accents. When speakers from the Netherlands aim to speak Standard Dutch (a supraregional variety by definition), they often produce a variety that still retains some salient phonetic variants originating from the speaker’s local regional origin (van Heuven & Van de Velde, Reference van Heuven, van de Velde, Fenoulhet and Renkema2010). This is known as “Standard Dutch with an accent” (Pinget, Rotteveel & Van de Velde, Reference Pinget, Rotteveel and Van de Velde2014) and will be under consideration in this study.
Dialectologically speaking, the Netherlands is a relatively well-understood linguistic area: there is a long dialectological tradition that dates back to the nineteenth century and includes several attempts to map linguistic variation onto space (see overviews in Heeringa & Nerbonne, Reference Heeringa and Nerbonne2006, Reference Heeringa, Nerbonne, Hinskens and Taeldeman2012). The most famous and comprehensive map of all contiguous Dutch-speaking areas is the map by Daan and Blok (Reference Daan and Blok1969). This map is based on both production and perception data (based on the original work by Weijnen, Reference Weijnen1946, who applied the “little arrow” method) and distinguishes twenty-eight dialect groups for the whole Dutch-speaking territory. For the Netherlands specifically, a rough division is traditionally made between Low Franconian (roughly speaking in the south and west) and Low Saxon dialects (roughly speaking in northeastern part of the Netherlands). In addition to this reference work, more recent dialectometric work (e.g., Heeringa, Reference Heeringa2004; Spruit, Reference Spruit2008) has provided new insights into the specific boundaries between the areas and the transition areas between those dialect groups, but results largely correspond to earlier dialectological work. At this point, it is an open question whether accents within the current Dutch standard language are still geographically organized along the traditional dialectological patterns.
Many production studies have examined the phonetic features that show geographical variation in Dutch. Variation has widely been shown at the segmental level, that is, the amount of voicing in fricatives (Van de Velde, Gerritsen & van Hout, Reference van de Velde, Gerritsen and van Hout1996), the articulation of /ɣ, x/ (van der Harst, Van de Velde & Schouten, Reference van der Harst, van de Velde and Schouten2007), the pronunciation of /r/ (Sebregts, Reference Sebregts2015; Van de Velde & van Hout, Reference van de Velde, van Hout, van Bezooijen and Kager1999), the different degrees of diphthongization of /eː, øː, oː/ (van der Harst, Reference van der Harst2011; Voeten, Reference Voeten2020, Reference Voeten2021a, 2021b) but also at the suprasegmental level (Gooskens, Reference Gooskens1997). We know that listeners can use these regional features to identify speakers’ regional provenances, though the accuracy and extent of these regional connotations seem to depend on both the accentedness of the speakers and the experience of the listener (Van Bezooijen & Gooskens, Reference van Bezooijen and Gooskens1999; Pinget et al., Reference Pinget, Rotteveel and Van de Velde2014). Van Bezooijen and Gooskens conducted a range of accent-recognition experiments in the Dutch language area in order to investigate the contribution of variation at different linguistic levels. Their results revealed relatively high recognition scores: their Dutch listeners were “reasonably good [at identifying the speaker’s geographical origin] when information is provided at all linguistic levels” (Reference van Bezooijen and Gooskens1999, 46). Pinget et al. (Reference Pinget, Rotteveel and Van de Velde2014) presented listeners with fragments of accented Standard Dutch and examined the role of exclusively phonetic variation in accent recognition. They reported relatively high identification scores such as better recognition but mostly for speakers coming from geographically peripheral areas (i.e., northern and southern regions). The identification of speakers from the central core area turned out to be significantly more difficult. Typically, speakers from the Randstad, the prestigious concatenation of major cities in the west of the Netherlands, display less variation in their speech for several reasons. First, dialect loss is faster and stronger in this area, mostly as a consequence of its urban character (e.g., Grondelaers & van Hout, Reference Grondelaers and van Hout2011; Willemyns, Reference Willemyns, Fandrych and Salverda2007). Second, linguistic changes toward the standard language have been spreading from the Hollandic (western) center of economic power and have not always reached more peripheral areas of the country (e.g., Wieling et al., Reference Wieling, Nerbonne and Harald Baayen2011). Third, speakers from different language or dialect backgrounds have settled in the central area during the last few decades, with dialect leveling as a result of their convergence toward each other (e.g., Scholtmeijer, Reference Scholtmeijer1992). Both Van Bezooijen & Gooskens (Reference van Bezooijen and Gooskens1999) and Pinget et al. (Reference Pinget, Rotteveel and Van de Velde2014) used a limited set of speakers coming from a few regions in the Dutch language area. In Pinget et al. (Reference Pinget, Rotteveel and Van de Velde2014), accent recognition was measured as the correct identification of one of four main regions (Randstad, center-east, northern periphery, and southern periphery). The current study refines these findings by extending the set of speakers and introducing a new task. It aims to investigate the factors that impact the geographical recognition of regional accents.
2. Factors affecting accent recognition
A significant amount of research on accent recognition has focused on speaker-related effects. Apart from revealing findings related to a specific language situation (e.g., speakers from region A are on average easier/harder to identify than speakers from region B), this kind of research often showed that the social attractiveness of speakers (due to voice quality, tempo, content, etc.) has no direct effect on their identifiability. Conversely, the act of categorizing speakers usually elicits evaluative reactions regarding their social-group membership (Cramer, Reference Cramer2010; Dragojevic et al., Reference Dragojevic, Berglund and Blauvelt2018; McKenzie et al., Reference McKenzie, Huang, Theng Ong and Snodin2019; McKenzie, Reference McKenzie2015; Van Bezooijen & Gooskens, Reference van Bezooijen and Gooskens1999). Similar research gives insight into typical “errors” in dialect classification. For instance, it has been shown repeatedly that listeners often ascribe ambiguous stimuli to the most prestigious variety of the country. In experiments on American English varieties (Perrachione, Chiao & Wong, Reference Perrachione, Chiao and Wong2010; Purnell, Idsardi & Baugh, Reference Purnell, Idsardi and Baugh1999), Mandarin dialects (Yan, Reference Yan2015), and French regional accents (Avanzi & Boula de Mareüil, Reference Avanzi and Boula de Mareüil2017), listeners were biased toward ascribing most stimuli to Caucasian American English, Enshi Mandarin, and Parisian French, respectively. In addition, it has been shown that listeners need relatively little input from a speaker to identify varieties. Purnell et al. (Reference Purnell, Idsardi and Baugh1999), for instance, showed that listeners can identify varieties after hearing just a single word. More generally speaking, testing the predictions from exemplar-based models has given rise to a range of studies showing that social expectations can influence listener performance on a variety of behavioral measures (Drager, Reference Drager2010; Pierrehumbert, Reference Pierrehumbert2003; Hay, Warren & Drager, Reference Hay, Warren and Drager2006; Sumner et al., Reference Sumner, Kyung Kim, King and B. McGowan2014). In addition, McGowan (Reference McGowan2015) showed that listener’s perceptual accuracy depends on their previous experience with the social profile of the speakers.
In order to broaden our understanding of dialect recognition and its more general, crosslinguistic nature, there has been a growing tendency to take listener-related factors into consideration. Arguably, the most dominant listener-related predictor of dialect recognition is one’s familiarity with the target variety. It became apparent in many studies that listeners who are more familiar with the target variety are likely to be more accurate in their categorization of speakers who use that variety than listeners who are less familiar (McKenzie, Reference McKenzie2015; McKenzie et al., Reference McKenzie, Huang, Theng Ong and Snodin2019; Montgomery, Reference Montgomery2012; Ryan, Reference Ryan1983). While it is quite straightforward to see that the degree of familiarity should directly impact recognition, investigating which type of familiarity matters is complicated: the target variety can be familiar to listeners for many various reasons (Kerswill & Williams, Reference Kerswill, Williams, Long and Preston2002). We distinguish between four types of familiarity: a variety can be familiar to listeners (1) because it is the variety that they speak themselves; (2) because they have had previous extended contact with this variety as it is spoken somewhere else (i.e., an effect of geographical mobility); (3) because the listeners just happen to know someone speaking the variety (individual-based recognition); and (4) because the listeners are extensively confronted with the variety through media. The effect of the first type of familiarity has been reported extensively for a range of different language situations. Listeners generally tend to identify their own dialect more easily than other dialects (e.g., Avanzi & Boula de Mareüil, Reference Avanzi and Boula de Mareüil2017; Baker, Eddington & Nay, Reference Baker, Eddington and Nay2009; Pinget et al., Reference Pinget, Rotteveel and Van de Velde2014; Williams et al., Reference Williams, Garrett, Coupland and Preston1999). Regarding the second type, previous results generally demonstrated relatively high levels of accurate recognition among those listeners with greater levels of experience with dialects within their home country and/or geographical mobility than less experienced/mobile listeners (Baker et al., Reference Baker, Eddington and Nay2009; Clopper & Pisoni, Reference Clopper and Pisoni2004; McKenzie et al., Reference McKenzie, Huang, Theng Ong and Snodin2019). The third type is more difficult to test experimentally but has been observed in more qualitative research designs (e.g., Diercks, Reference Diercks, Long and Preston2002). The impact of media on dialect perception and recognition has been shown by, for instance, Busselle and Shrum (Reference Busselle and Shrum2003), Stuart-Smith (Reference Stuart-Smith, Kristiansen and Coupland2011), and Purschke (Reference Purschke2012).
One’s familiarity with a variety can be influenced or modulated by a range of interrelated factors, including the listener’s age, gender, education, and their own place of origin. First, it is important to examine how the effect of familiarity correlates or interacts with listener age. Only a few studies have looked at the effect of listeners’ ages on their abilities to identify speakers’ places of origin (Diercks, Reference Diercks, Long and Preston2002; Floccia et al., Reference Floccia, Butler, Girard and Goslin2009; Girard, Floccia & Goslin, Reference Girard, Floccia and Goslin2008; Jones et al., Reference Jones, Yan, Wagner and Clopper2017; Williams et al., Reference Williams, Garrett, Coupland and Preston1999). Girard et al. (Reference Girard, Floccia and Goslin2008) asked five-to-six-year-old French-speaking children to discriminate between southern- and northern-accented French and found that these children were not able to reliably distinguish between these varieties of their native language, despite the fact that perceptual attunement begins at an early age (Aslin & Pisoni, Reference Aslin, Pisoni, Yeni-Komshian, Kavanaugh and Ferguson1980). Jones et al. (Reference Jones, Yan, Wagner and Clopper2017) presented samples of American English varieties to listeners between four and 86 years old and asked them to group the talkers by region in a free-classification task. While they showed that some of the youngest listeners perceived dialect variation, they did not observe adult-like accuracy until they were between sixteen and seventeen years old. No further distinction in age in the adult group was made. Williams et al. (Reference Williams, Garrett, Coupland and Preston1999) examined Welsh teenagers’ collective recognition of and attitudes to regional Welsh English accents. Their results showed that adolescents have significant difficulties determining the specific dialect regions. Welsh school teachers performed much better than the schoolboys on the same dialect categorization task. They attributed this difference in performance to the teachers’ travel experiences. Diercks’s (Reference Diercks, Long and Preston2002) findings demonstrated that German teenagers and young adults (15–29 years old) displayed a lower ability to recognize German dialects than older adults (30–64 years old). To summarize, young listeners often lack sociolinguistic maturity (Dossey, Clopper & Wagner, Reference Dossey, Clopper and Wagner2020; Floccia et al., Reference Floccia, Butler, Girard and Goslin2009; Girard et al., Reference Girard, Floccia and Goslin2008; Jones et al., Reference Jones, Yan, Wagner and Clopper2017; Kerswill & Williams, Reference Kerswill, Williams, Long and Preston2002; Kerswill, Reference Kerswill1996; Labov et al, Reference Labov, Sharon Ash, Weldon, Baranowski and Nagy2011; Williams et al., Reference Williams, Garrett, Coupland and Preston1999). Yet it remains an open question whether dialect recognition further develops in adulthood or conversely remains stable. Hypothetically, the effect of age could be continuously linear (the older you are, the better you recognize accents due to the accumulation of life and sociolinguistic experience). Alternatively, age might modulate accent familiarity in a more complex way, because the effect of the aforementioned four types of familiarity depends on specific life phases.
Some types of familiarity effects are related to the listener’s regional origin. Clopper and Pisoni (Reference Clopper and Pisoni2004) showed that listeners with different residential histories have structurally different perceptual-similarity spaces of dialect variation. Depending on whether they have lived in an urban versus rural context and in a linguistically diverse versus homogeneous context, listeners might also be confronted with different linguistic landscapes (Dailey, Giles & Jansma, Reference Dailey, Giles and Jansma2005; Shohamy & Gorter, Reference Shohamy and Gorter2008). Following Kerswill and Williams (Reference Kerswill, Williams, Long and Preston2002), we may hypothesize that listeners use different strategies in dialect recognition depending on their own region of origin.
Familiarity effects might also be modulated by the listener’s genders and education levels. Kerswill and Williams (Reference Kerswill, Williams, Long and Preston2002) systematically varied judges by social class (working versus middle class) and social network (local network versus nonlocal network, thus geographically mobile). They showed that it was network, rather than social class, that was the decisive factor in own-community dialect recognition. Alternatively, we explore the possibility of using the listener’s education level as a proxy for both social class and social network. In the Netherlands, sociological research has shown that there tends to be a very strong correlation between education level and social and geographical mobility (Hensen, de Vries & Cörvers, Reference Hensen, Robert De Vries and Cörvers2009; van de Werfhorst, Reference van de Werfhorst2002). Traditionally, women are seen as poor dialect experts because, especially in rural areas, they tend to be less mobile both socially and geographically than men. In his German dialect recognition study, Diercks (Reference Diercks, Long and Preston2002) included gender as a factor and found—against expectations—that female listeners scored better. However, because there was a confound between gender and mobility, his results were difficult to interpret.
Finally, an accent-recognition study necessarily includes a measure of the distance between the speaker and the listener as an estimation of the effect of proximity. It is hypothesized that the geographical distance between speaker and listener origin directly affects accent recognition because of the way speakers live, travel, and keep in touch with each other. Furthermore, in a country like the Netherlands, geographical distance is a good proxy for linguistic distance. Wieling, Nerbonne, and Baayen (Reference Wieling, Nerbonne and Harald Baayen2011) found in a large-scale dialectometric study of Dutch that geography is the dominant predictor of dialect distance. Distance between varieties, whether geographical or linguistic, cannot be the single absolute modulator of our recognition capacities, as we know that they are affected by the salience of features (Kerswill & Williams, Reference Kerswill, Williams, Long and Preston2002; Leach, Watson & Gnevsheva, Reference Leach, Watson and Gnevsheva2016). In this study, we take the aforementioned factors into account and examine their effects on accent recognition by using a novel map-based recognition task.
3. Method
3.1. Speakers and stimuli
Forty speakers were selected from the Spoken Dutch Corpus (Oostdijk, Reference Oostdijk, Peters, Collins and Smith2002). The Spoken Dutch Corpus is a large compilation (about ten million words) of Dutch as it is spoken in the Netherlands and in Flanders, which demonstrates notable regional variation (for an overview of the specific phonetic features that vary regionally within this corpus, see Adank, van Hout & Smits, Reference Adank, van Hout and Smits2004; Adank, van Hout & Van de Velde, Reference Adank, van Hout and van de Velde2007; van der Harst, Reference van der Harst2011). We selected speakers with the same two-digit postcode for their place of education and place of residence, such that at the time of recording all speakers still lived in the same place as where they had grown up from 4-16 years of age.Footnote 1 All speakers from our selection can be said to display a mild regional accent, that is, there are a least a few phonetic features that deviate from Standard Dutch and point to a specific area within the Netherlands. Stimuli consisted of an extract of around twenty seconds (the usual length of stimuli in this type of study; see also Watson & Clark, Reference Watson and Clark2015) from either a spontaneous face-to-face conversation or a sociolinguistic interview. The content of the stimuli was carefully controlled so that it contained no information that could be linked to a geographical area or any specific place, no indication about the ages, social classes, and regional origins of the speakers, no noticeable hesitations or slips of the tongue, and no disturbing background noise. The extracted sound files were leveled to 80 dB/SPL.
The forty speakers came from twenty places in the Netherlands (one male and one female per place). Places were selected to represent traditional dialect areas in the country and to vary between big cities (e.g., Amsterdam, Utrecht), smaller cities (e.g., Assen, Hengelo), and rural areas (e.g., Medemblik, Sluis).
3.2. Listeners
Data were collected from 1,578 listeners with Dutch as the native language (886 men and 692 women). This sample was obtained after removing participants who did not complete the whole experiment. The age range was between 18 and 79 years (M = 39.53 years, SD = 14.19 years). Participants filled in the highest level of education they had completed: either primary school (N = 8), preparatory vocational secondary education (Dutch vmbo) (N = 15), senior general secondary education (Dutch havo) (N = 40), university preparatory secondary education (Dutch vwo) (N = 138), vocational education (Dutch mbo) (N = 71), nonuniversity higher education (Dutch hbo) (N=373), or university (N = 933). The origins of the listeners were determined by asking them for the four-digit postcode of the place (within the Netherlands) where they have lived the longest. The task was disseminated through social media to reach as many regions as possible. Listeners originated from all over the Netherlands, but, similarly to the bias toward higher-educated listeners, there was a bias toward urban places of origin. Within the Netherlands, there is a correlation between these two features: institutes of higher education (i.e., universities and colleges) are invariably located within cities. Thus, these imbalances in the demographic characteristics of our listeners naturally reflect the demographic characteristics of participants who usually participate in experimental sociolinguistic research.
3.3. Procedure
Participants conducted an online map-based accent-recognition task using LimeSurvey. They were instructed to assign each stimulus to the site where they thought that the speaker came from by clicking on a map provided by Google Maps (see example in Figure 1).
Example of a trial in the map-based recognition task. (Question in Dutch: “Where in the Netherlands does the speaker come from?”)

This method avoids the drawbacks of both the forced-choice and the free-classification tasks but still involves, like other map-based tasks (Preston, Reference Preston1999), a featural analysis and its mapping onto geographical patterns. The Google Maps interface presented several advantages. First, Google Maps is by far the most popular mapping application, so we may safely assume that most participants (if not all) have experience with its design and functionalities (e.g., the zoom-in and zoom-out functions). Second, Google Maps provides a lot of historical-political and geographical information (e.g., province lines and city locations) familiar to listeners that they can use as support when localizing the accent that they heard. American studies where map-based tasks were used (e.g., Preston, Reference Preston1989, Reference Preston and Preston1993) indicated that people have great difficulty with completely blank maps due to a general lack of geographical knowledge. However, in our design, all participants have available the same amount of geographical information. Supplementarily, a question about participants’ self-estimated geographical knowledge (measured on a scale from 1 to 10) was included in the questionnaire in order to control for any effect of geographical knowledge on recognition capacities.
Four semi-randomized lists, each containing ten speakers balanced for gender, were created. Each participant was asked to identify the origins of all ten speakers of one of the lists, presented in random order. Feedback was given to participants about the accuracy of their responses after each trial. Responses within a range of 15 km were marked as correct identification, and, for all other responses, the distance in kilometers between the answer and the correct origin was given. Each participant received a final score (out of 10), which made the experiment similar to a game or quiz. The challenge aspect of the experimental design probably contributed to its attractiveness to a large pool of participants.
3.4. Data analysis
To capture listeners’ accuracies in identifying the speakers’ regional provenances, we computed listeners’ “accent-recognition errors,” which we defined as the distances in kilometers between the true speaker origins and listeners’ clicks on the map. We similarly computed distances between the listeners’ regions of origin and the speakers’ regions of origin, which we call “distance to own region.” These regional origins were determined on the basis of postcode areas that were available in the corpus metadata for the speakers and that was provided by the listeners before they started the experiment. A postcode in the Netherlands defines a small area, not a precise coordinate. The centroid of each of these areas was taken in order to define a single coordinate as the place of origin. For 210 of the 15,780 data points, the listeners’ regional origins could not be determined from their provided postcode. Due to these missing values, these cases were excluded from the analysis.
The effects of social factors on listeners’ accent-recognition errors were analyzed using a generalized additive model (Wood, Reference Wood2017; henceforth ‘GAM’). Generalized additive models are regression-like models that incorporate smooth splines. A spline is similar to a regression line, except that it can bend and curve. A smoothing penalty, estimated automatically in a similar way to random effects in mixed-effects models, optimally balances the spline between overfitting (“undersmoothing”) and underfitting (“oversmoothing,” i.e., reducing to a straight line). Our analyses use two types of splines: a “thin-plate regression spline,” which fits the preceding explanation of being the nonlinear extension of a regression line, and a “spline on the sphere,” which is a specialist spline for geographical <latitude, longitude> data. The upshot is that we can model effects of predictors that are more complex than straight lines (including two-dimensional geographical data), using a statistical framework that is otherwise equivalent to the traditional regression model. For more details on GAMs, we refer to authoritative works such as Wood (Reference Wood2017) or to tutorials aimed at a sociolinguistic audience such as that by Tamminga, Ahern and Ecay (Reference Tamminga, Ahern and Ecay2016) or Wieling, Nerbonne and Baayen (Reference Wieling, Nerbonne and Harald Baayen2011).
We fitted the listeners’ mean accent recognition errors using the GAM function from R package mgcv. In addition to the intercept, fixed effects were included for listener gender (deviation-coded), listener education level (Helmert-coded),Footnote 2 and speaker gender (deviation-coded). Smooth terms (thin-plate regression splines) were included for listeners’ self-reported geographical knowledge, ages, and the distances to their own region. In addition, a spline on the sphere was included for the latitude and longitude coordinates of the listener origin. Splines were afforded at most ten basis functions, which we verified (using the gam.check function) to be adequate. By-speaker random intercepts, slopes, and smooths were included for all terms that were not speaker-specific.
Accent-recognition errors are subject to “edge effects”: a speaker who is closer to the edges of the country will automatically have a larger range of possible values for the accent-recognition error, because the distance from one edge of the country to the opposite edge will always be larger than the distance from a more interior point to the same edge. We took this inherent source of bias into account by fitting a location-scale model, meaning that we included predictors not only for the mean accent-recognition error but also for its variance, which will necessarily increase for speakers nearer to the country borders. These predictors are an intercept, a fixed effect for speaker origin and two smooth terms for the distance to own region and the listener’s region of origin. Appropriate by-speaker random effects were also included. Together, these predictors make up all of the geographical predictors that we have, and hence they fully account for the possible edge effects in the model. The model was fitted to gamma errors with a log link. This ensures that the fitted accent-recognition error can only be positive and allows the variance to increase with the mean, which correctly represents the data. We observed many small accent-recognition errors and fewer extreme ones. For the one-dimensional smooths, we projected the model’s linear-predictor matrix onto a 100-point grid to obtain predictions, setting the coefficients for all factors except the interrogated smooth to zero. For the two-dimensional spline on the sphere, we divided the Netherlands into a 100×100-point grid and pruned away any points that were not on land, yielding 4,116 points. We then obtained the model’s predictions for these points.
4. Results
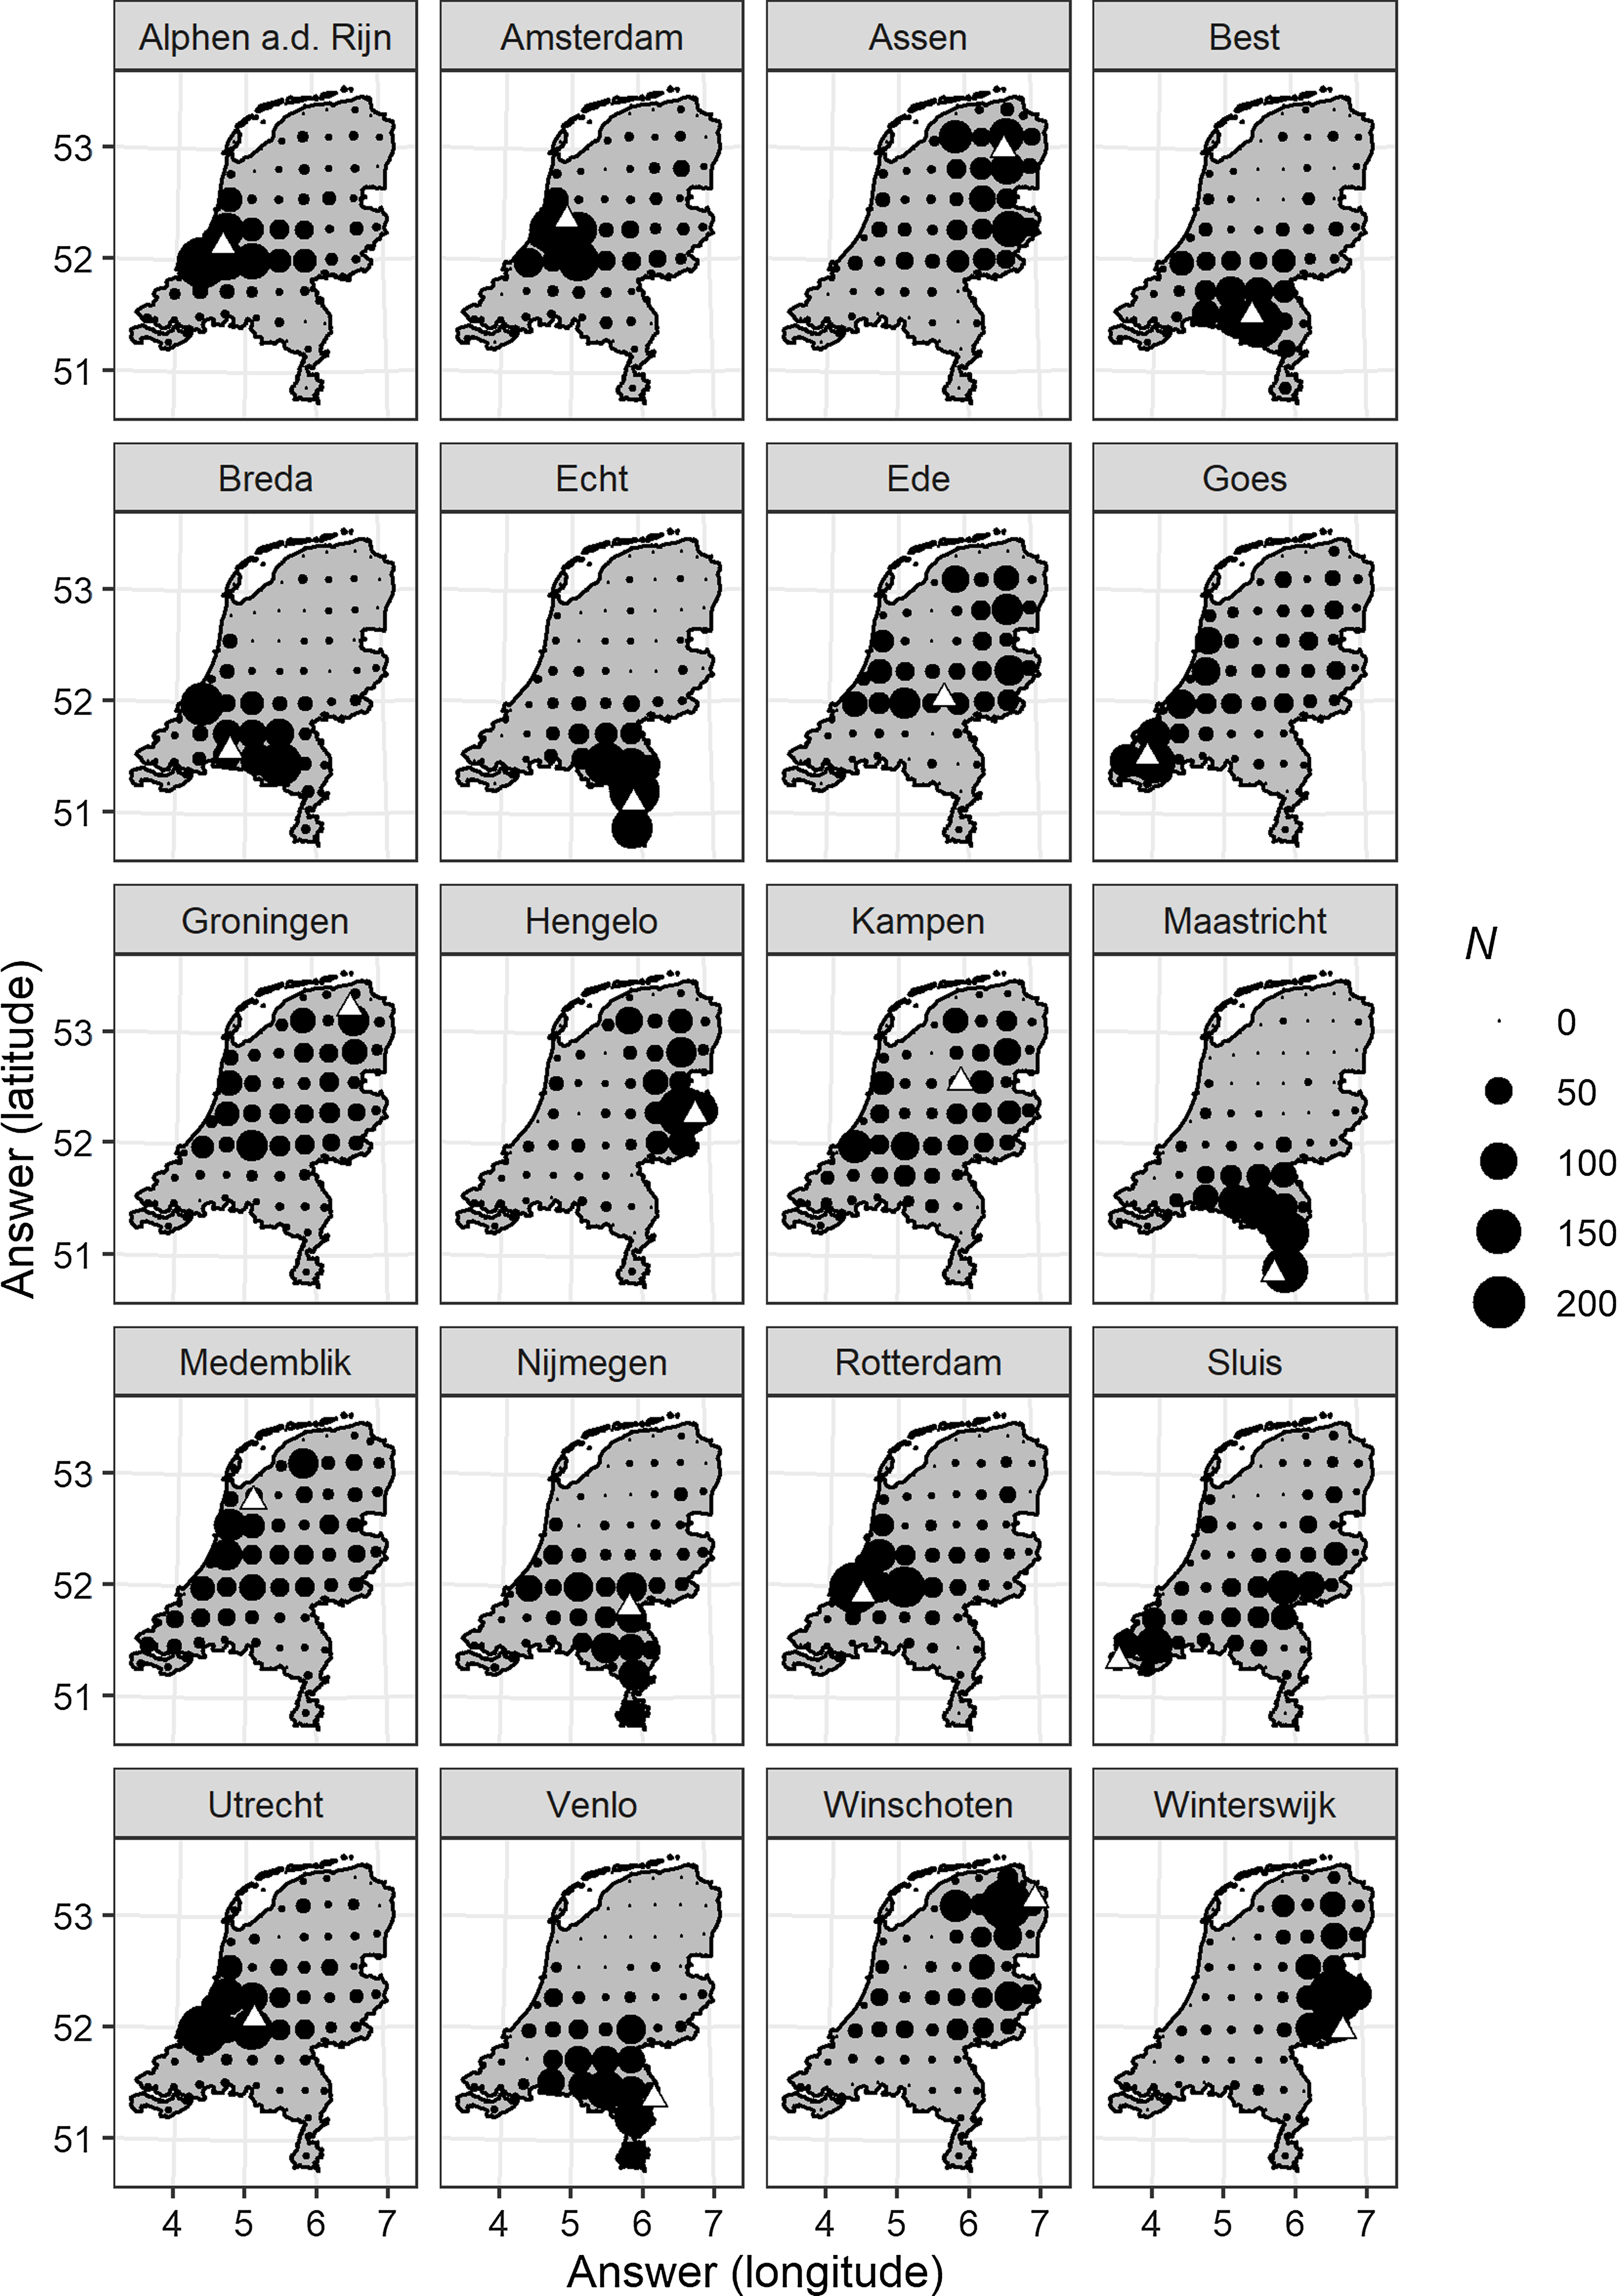
Figure 2 represents the raw data we collected (total N = 15,780). This and all R code are available at https://figshare.com/s/4ada1e6e080c9144e9b9. In Figure 2, we binned the raw data along a 10×10-point two-dimensional grid of latitude and longitude values to enable visualization. The labels of the facets give the two speakers’ true geographical origins, and the triangle indicates where that place is located on the map.
Raw data, binned along a 10×10-point grid spanning sixty-nine points on land. Triangles indicate the true speaker origins (i.e., the locations of the sites in the facet labels).
The GAM comprises two parts: the location part, representing the mean accent-recognition error, and the scale part, which models its error. We limit our interpretation to the fixed effects in the location part of the model (i.e., we focus our investigation on factors modulating the mean accent-recognition error). In our discussion, we will make extensive use of the notion of “accent-recognition-error ratio” (henceforth “ARE ratio”). This can be intuitively understood as the multiplicative effect of a one-unit change in a predictor. For example, a predictor with an ARE ratio of 1.01 denotes that, for every one-unit increase in the predictor, the accent-recognition error increases by a factor of 1.01, or a 1% larger error in kilometers.
4.1. The parametric terms
Table 1 summarizes the estimates for the parametric (i.e., “regular”) terms in the location part of the model. The intercept is placed at 4.19 km on the logarithmic scale of the linear predictors, which corresponds to an average accent-recognition error of 66 km. In other words, listeners tended to click on average 66 km next to a speaker’s true origin.
Parametric coefficients of the model for the mean accent-recognition error. The estimates are in kilometers on the log scale. The column labeled ‘ARE Ratio’ contains exponentiations of these estimates

This is significantly modulated by education: on the cline from primary school to university, the model identified two significant breakpoints, namely at vwo and university. Both of these levels have successively lower accent-recognition errors than the preceding ones. Speakers whose highest education level is vwo have an ARE ratio of 0.98, giving them a 2% reduced accent-recognition error than speakers with a lower education level than them. Speakers who go to university on average attain an additional 1% smaller accent-recognition error.
4.2. The smooth terms
Table 2 shows the omnibus significances of the smooth splines for listener geographical knowledge, age, speaker origin, and the distance between the speaker’s and the listener’s origin. All these significant factors will be discussed one by one and the effects are visualized in Figures 3-6.
Smooth terms in the model for the mean accent-recognition error. The “edf” provide the estimated degrees of freedom for the corresponding chi-square statistic, while the “ref. df” provide the corresponding residual degrees of freedom. The further the edf are from 1, the less straight and more curved the corresponding smooth term is. At exactly 1, the effect is a straight line

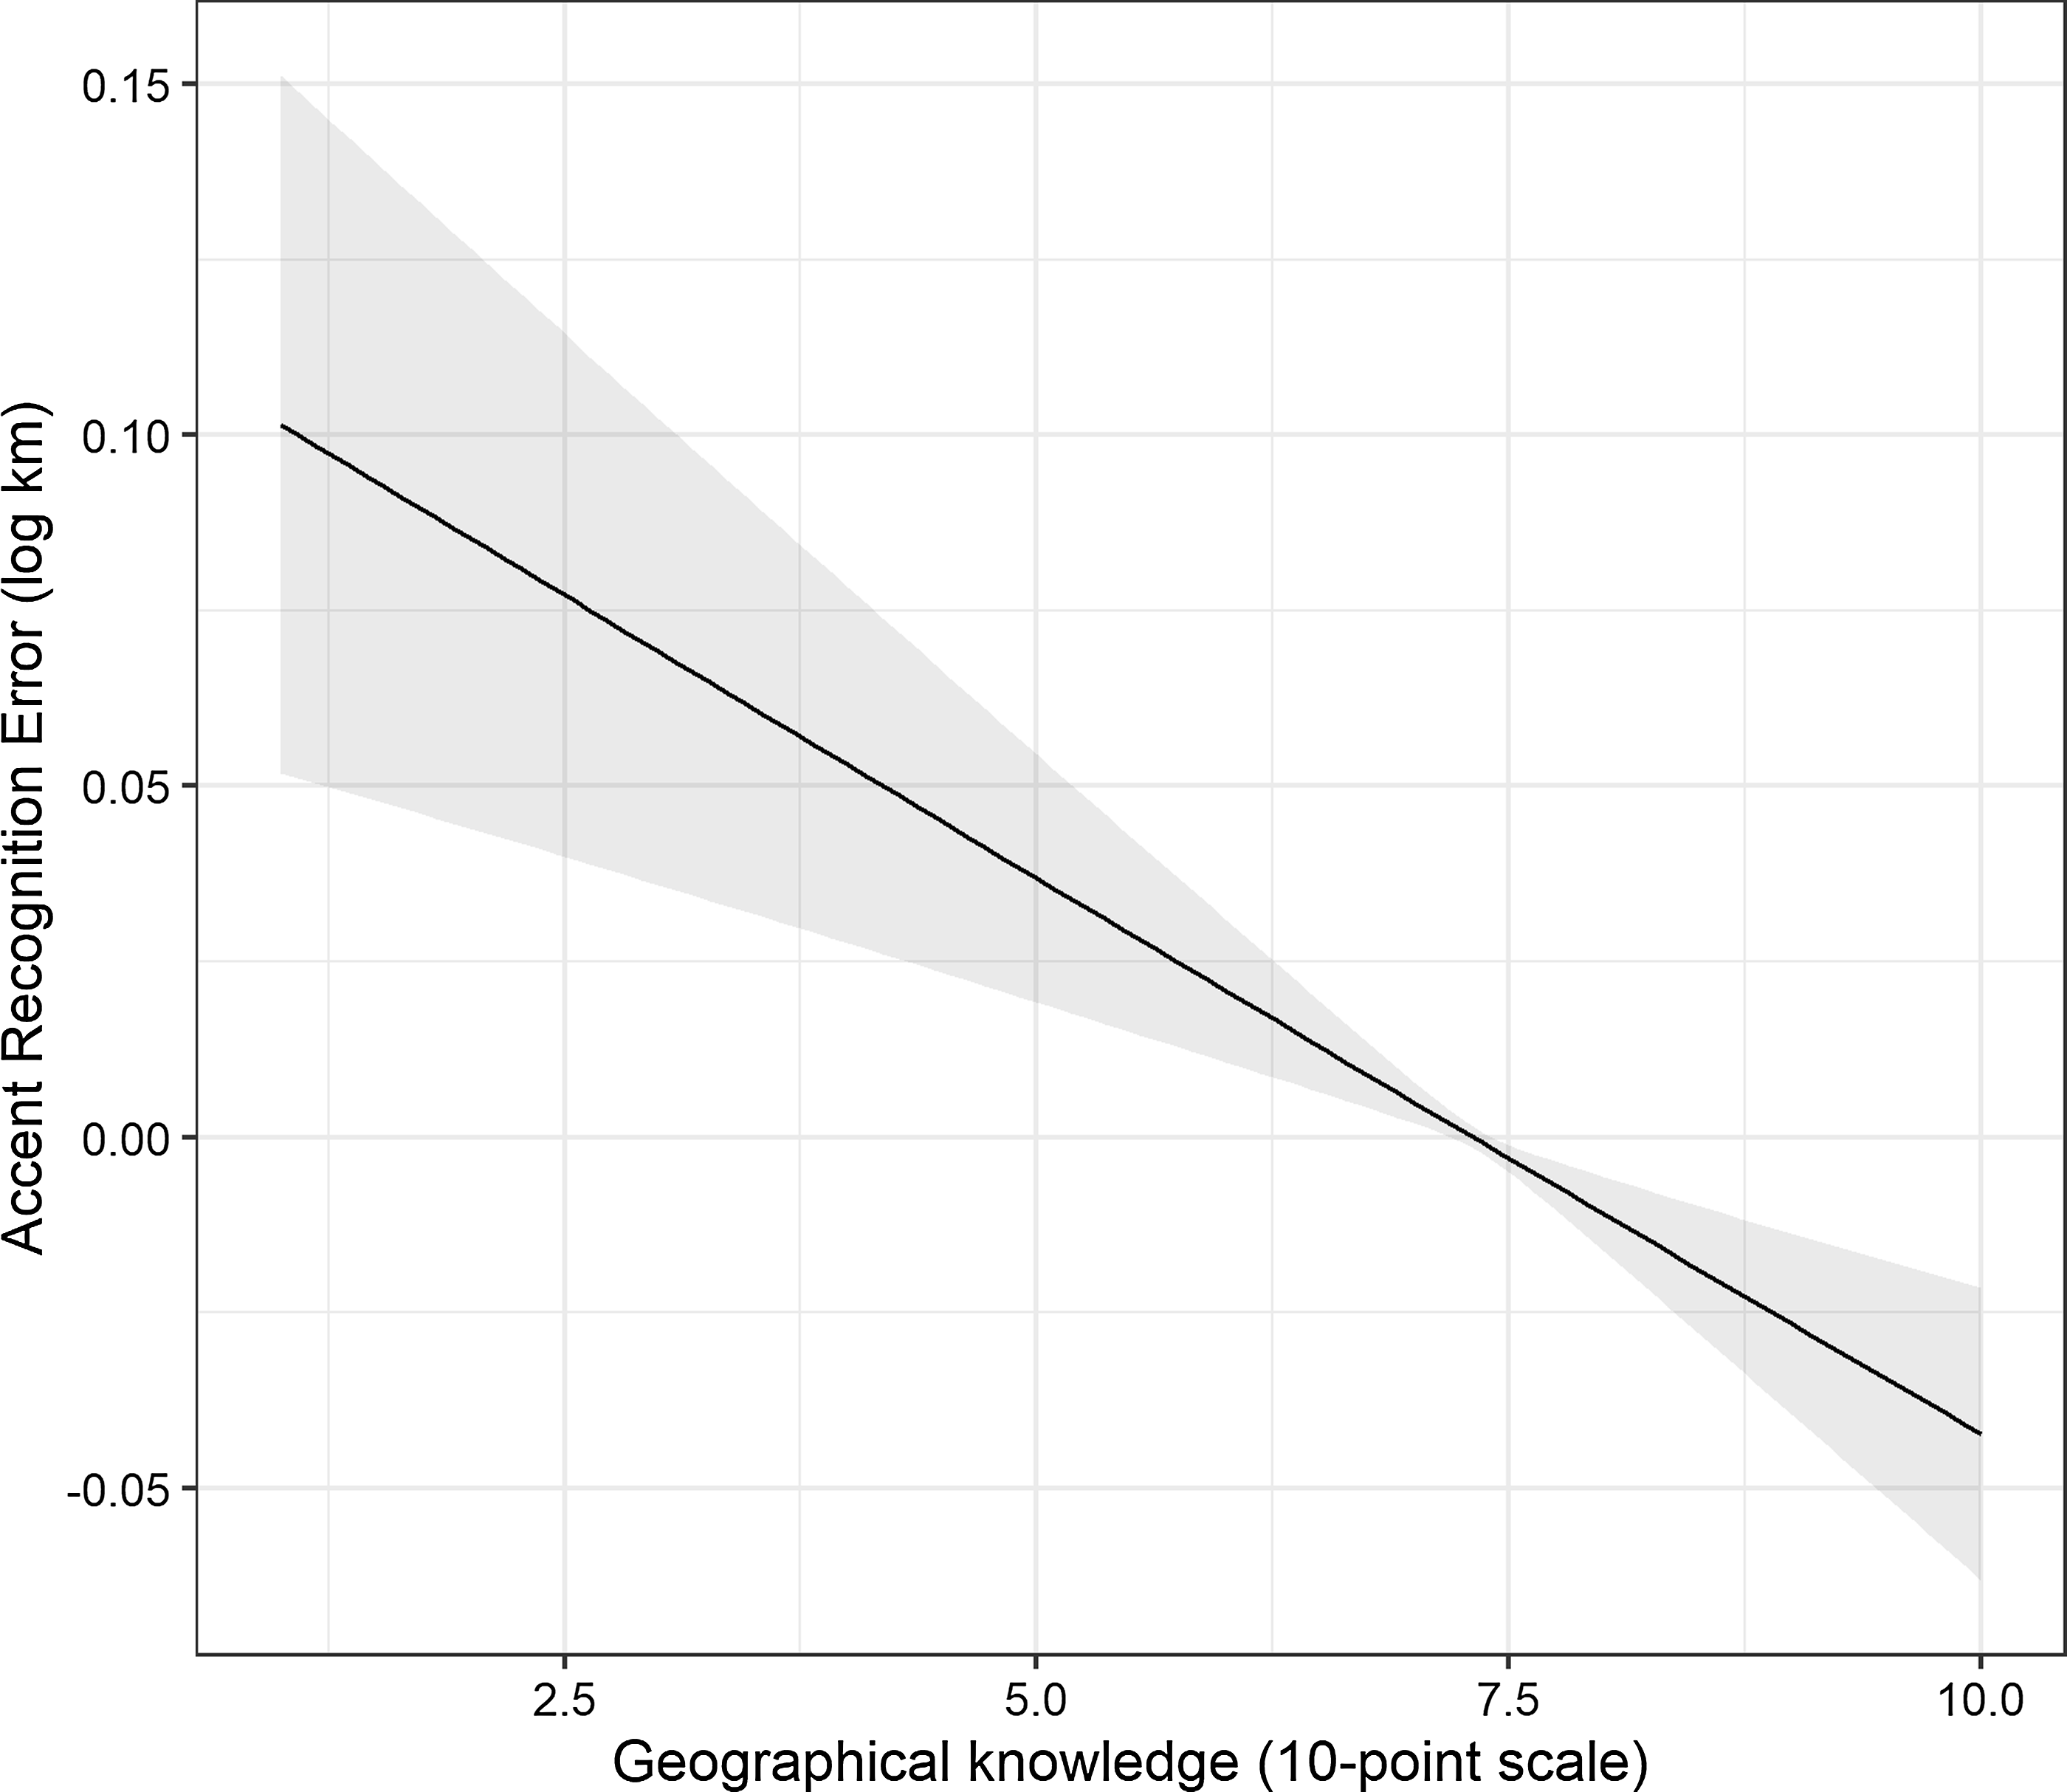
Effect of geographic knowledge (1 = very poor, 10 = excellent) on the mean accent-recognition error. The gray band indicates the 95% CI.
Effect of listener age in years on the mean accent-recognition error. The gray band indicates the 95% CI.

Effect of distance of the speaker to the listener’s own region on the mean accent-recognition error (log scale). The gray band indicates the 95% CI.

Effect of listener origin on the mean accent-recognition error.

Figure 3 visualizes the smooth spline for the effect of geographical knowledge. Even though this is most intuitively interpreted on the ARE-ratio scale, we plot all smooth terms on the logarithmic scale, as this is the scale at which the predictors are linear in the model. We observe a nearly linear effect of geographical knowledge. This means that for every one additional point of geographical knowledge, one’s accent-recognition error goes down by approximately –0.02 km on the log scale, which corresponds to an ARE ratio of 0.98. Thus, every additional point of geographical knowledge reduces one’s accent-recognition error by 2%, cumulatively.
Figure 4 shows the effect of listener age. The effect is U-shaped, with younger and older listeners incurring higher accent-recognition errors (with an ARE ratio of up to 1.09, i.e., a 9% higher error). Middle-aged listeners, by contrast, achieve lower accent-recognition errors, with the lowest contribution of the effect of age at an ARE ratio of 0.96, corresponding to a 4% smaller accent-recognition error in kilometers than average.
Figure 5 shows the effect of distance of the speaker to the listener’s own region. This effect seems relatively linear until about 150 km, which is about half of the possible answer space. At more extreme distances than this, the effect levels off, and the model estimates become more uncertain due to the low amount of data with such extreme accent-recognition errors. The closest speakers and listeners have been together in these data is 382 meters; in this case, the effect reaches an ARE ratio as low as 0.80, corresponding to a 24% advantage in accent recognition compared to the average. At 200 km, the ARE ratio has leveled off to a value of 1.12, meaning that at this large a distance, listeners’ errors in kilometers are 12% larger than average. Finally, when speakers and listeners are the farthest distance apart that was present in the data (308 km), the listener’s accent-recognition-error ratio reaches 1.13, or a 13% larger accent-recognition error than average.
The effect of the listener’s origin is shown in Figure 6. The key features in this figure are that speakers from the Randstad (i.e., the west of the country) have slightly higher accent-recognition errors (maximal ARE ratio = 1.03, or a 3% increase in kilometers) and that listeners from the north and south of the country have slightly lower accent-recognition errors (with ARE ratios as low as 0.93, or an 8% decrease compared to the average).
5. Discussion
5.1. Key findings from the present study
In this study, a large-scale online accent-recognition experiment was conducted in the Dutch language area in order to investigate how listener-related factors impact accent recognition. Specifically, we looked at how the listener’s social and linguistic characteristics of age, gender, level of education and place of origin impacted their abilities to map speakers to places on a digital map.
The chosen methodological approach based turned out to be very successful, as it avoids the drawbacks of other traditional methods in perceptual-dialectology research. It also avoids the debate reported by Clopper (Reference Clopper, Pardo, Nygaard, Remez and Pisoni2021) on how fine-grained the response alternatives should be, as we know that overall performance in dialect recognition is at least partially determined by the number of alternatives that are available to the listeners. In fact, the presented map-based task is the most fine-grained alternative possible, as one could in principle zoom in onto the street level. Yet, it does not suffer from any naming/classification issues, since all (and only) names of geopolitical entities are given by the map provider. An artifact of the map-based task design was that accent-recognition patterns are subject to edge effects, as the recognition of a speaker coming from the edges of the country/linguistic area automatically has a larger range of possible values than a speaker from the central part of a country. Results, in fact, depended to some extent on the shape of the country. Our statistical modeling took this inherent source of bias into account by including geographical predictors not only for the mean accent-recognition error but also for the residual error. The presented GAM therefore successfully examined the effects of listener-related factors on listeners’ accent-recognition errors.
The results parallel the findings of prior studies investigating levels of categorization accuracy for speaker origin (e.g., Bent et al., Reference Bent, Atagi, Akbik and Bonifield2016; Gnevsheva, Reference Gnevsheva2018; McKenzie, Reference McKenzie, Huang, Theng Ong and Snodin2019; Preston, Reference Preston1999; Ruch, Reference Ruch2018; Watanabe, Reference Watanabe2017). Although adult listeners were shown to be generally able to identify speakers’ regional origins with reasonable accuracy, their accent-recognition patterns were imperfect. While listeners’ aptitudes at identifying the speakers’ regions of origin were indeed codetermined by the factors of age, level of education, geographical knowledge, and own place of origin, listener gender did not turn out a significant factor. We expand on the significant factors in turn, starting with age.
5.2. Age and the curvilinear pattern
The analysis showed that the effect of listener age (between 18 and 79 years) was not linear, but rather U-shaped. Young adults and older listeners showed more inaccurate recognition patterns than middle-aged listeners. We interpret this curvilinear pattern as a reflection of age-related changes in geographical and social mobility. This parallels the idea of the linguistic marketplace (Bourdieu & Boltanski, Reference Bourdieu and Boltanski1975), introduced into sociolinguistics by Sankoff and Laberge (Reference Sankoff, Laberge and Sankoff1978). Sankoff and Laberge described the “adolescent peak,” which constitutes a peak in the usage of vernacular variants when people reach their twenties, followed by a decline in their frequency of use in later middle age. They proposed the linguistic marketplace as an index that measures how speakers’ social or economic activity requires, or is necessarily associated with, competence in the legitimized language (standard, elite, or educated). Because middle-aged speakers are highly concerned with the use of the right proportion of standard variants in the right contexts (Sankoff & Laberge, Reference Sankoff, Laberge and Sankoff1978), their awareness of language variation is the highest. In our data, listeners around the age of 45 years showed the highest recognition aptitude. Furthermore, this age group probably has a large and solidified social network, since both adolescents and older listeners have smaller, more locally marked networks and possibly a still developing versus decreasing (respectively) sociolinguistic awareness. McCullough et al. (Reference McCullough, Clopper and Wagner2019) and Dossey et al. (Reference Dossey, Clopper and Wagner2020) were also interested in the effect of listeners’ ages on dialect-recognition capacities. McCullough et al. (Reference McCullough, Clopper and Wagner2019) conducted a child-friendly dialect-recognition task with American listeners aged between four and 79 years. Although they were not specifically interested in differences during adulthood, they observed that 50- to 79-year-old listeners declined in performance compared to younger adults for most presented dialect contrasts. They suggested that older listeners’ poorer performances might be explained by diminished working-memory capacities. The task proposed to listeners in the current study did not directly involve working memory in the way McCullough et al.’s (Reference McCullough, Clopper and Wagner2019) task did, so it is unlikely that this explanation also holds for the current U-shaped pattern. Dossey et al. (Reference Dossey, Clopper and Wagner2020) conducted a dialect-perception task with American English listeners aged between four and 71 years old. They observed a peak in classification capacities around age thirty followed by a decline among older adults. Like McCullough et al. (Reference McCullough, Clopper and Wagner2019), they argued that the decline in perceptual capacities is consistent with age-related cognitive declines that begins in early adulthood. It is, however, unclear which cognitive declines were meant related to their specific tasks, and whether the listener-age distribution (with possibly a low number of older participants) might have influenced the outcomes. Since the decline in dialect-recognition performance becomes visible relatively early (around the age of fifty) in both McCullough et al. (Reference McCullough, Clopper and Wagner2019) and Dossey et al. (Reference Dossey, Clopper and Wagner2020), we argue that hearing loss does not appear to be a satisfying explanation either. We suggest that the idea of linguistic marketplace best explains the inaccuracy in dialect recognition in later life shown both in the previous and the current studies.
Not only older adults but also younger adults in their twenties showed more inaccurate dialect recognition patterns than middle-aged listeners. Diercks (Reference Diercks, Long and Preston2002) also observed lower recognition abilities in German young adults and proposed the following explanation: “The influence of the media, the high rate of mobility, especially among the urban population, and the changing ways of spending free time may have leveled off the geographical differences which are still known by the older subjects (ca. 70–80 years old)” (Diercks, Reference Diercks, Long and Preston2002:58). Young adults might thus have less access to cognitive and geographical representations of language variation as a consequence of the way our societies are changing. This suggests more of a generational change than an age-related pattern. At this point, longitudinal panel studies would be helpful to enhance our understanding of the relation between age effects and changing societies in accent recognition. At the same time, our findings related to young adults can be interpreted in the light of Labov et al. (Reference Labov, Sharon Ash, Weldon, Baranowski and Nagy2011). Their study found that a large amount of their younger listeners (between 18 and 23 years) showed no evidence of evaluative sensitivity to the salient sociolinguistic variable (ING). They explained these findings by the development of the sociolinguistic monitor. Younger adults show less sensitivity to salience than older adults: they have not yet acquired the full evaluative schema which constitutes the sociolinguistic monitor. We believe that our explanation in terms of the linguistic marketplace and Labov et al.’s (Reference Labov, Sharon Ash, Weldon, Baranowski and Nagy2011) explanation in terms of sociolinguistic monitor are different formalizations of the same age-related pattern. In general, age patterns turn out to be relevant because they underline the importance of linguistic exposure, geographical and social mobility, and reveal different linguistic sensitivity profiles.
5.3. Social and geographical factors
While age showed a curvilinear pattern, the factors of level of education and geographical knowledge significantly predicted the accuracy of accent recognition in a linear manner. The higher one’s education and geographical knowledge, the better their dialect recognition was. These findings support the conclusions by Kerswill and Williams (Reference Kerswill, Williams, Long and Preston2002) who looked at listeners’ memberships to both social class and social networks. Even though the factor of education level was controlled for in the model, the population sample was biased toward highly educated, as is frequently the case in this type of study. We further investigated post-hoc whether our interpretation of geographical knowledge could have been confounded with age, in that one’s geographical knowledge tends to increase as one gets older, but this turned out not to be borne out: explicitly introducing a tinsor product (the GAM equivalent of an interaction) between these smooth terms did not significantly improve model fit (χ²(2.20) = 1.63, p = .49). Despite the fact that the measure of geographical knowledge was self-reported, it clearly correlated with the accuracy of accent recognition. Therefore, there is no reason to believe that this would be any different with an objective assessment of one’s geographical knowledge.
As expected, listener origin also turned out as a significant predictor of accent recognition. First, it was shown that the larger the distance between the listener’s own place of origin and the speaker’s place of origin, the more difficult accent recognition was. Listeners logically recognized their own accent more easily than other accents. This advantage in recognition decreases as the distance to the speaker origin increases. This linear effect extends our knowledge about this type of familiarity, as the influence of one’s own region was largely shown on the basis of forced-choice categorization designs (e.g., Avanzi & Boula de Mareüil, Reference Avanzi and Boula de Mareüil2017; Baker et al., Reference Baker, Eddington and Nay2009; Williams et al., Reference Williams, Garrett, Coupland and Preston1999). Second, listeners from the central area of the Randstad turned out to be slightly worse at accent recognition. These speakers are known to show less variation than other Dutch speakers due to a range of factors reviewed more extensively in the introduction, including fast and strong dialect loss, standardization history, and dialect leveling as a consequence of migration. These speakers might therefore be exposed to less linguistic variability, making them less familiar with other accents and thus poorer listeners. Ruch (Reference Ruch2018), in contrast, raised the hypothesis that urban speakers are more in contact with different varieties on a daily basis than rural speakers and might therefore be more sensitive to variability. In order to test these hypotheses in future studies, it would make sense to include rurality versus urbanity as a listener factor, together with a measure of listeners’ mobility profiles.
In addition to the above, geographical distances between speaker and listener origins proved to be reliable estimates of proximity effects and therefore significantly impact dialect recognition. This corroborates the key effect of proximity in perceptual dialectology shown by Montgomery (Reference Montgomery2012) and the results by Wieling et al. (Reference Wieling, Nerbonne and Harald Baayen2011), who found that geography is the dominant predictor of linguistic distances between varieties of Dutch. Yet, British studies such as Kerswill and Williams (Reference Kerswill, Williams, Long and Preston2002), Montgomery (Reference Montgomery2012), and Leach et al. (Reference Leach, Watson and Gnevsheva2016) have also shown that geographical distance cannot be an absolute modulator of our recognition capacities. At this stage, it is an open question how this proximity effect would apply to much larger geographic spaces such as the United States or Australia. Furthermore, our perception of language variation is definitely affected by the salience of features, and specifically the relative ability of a linguistic variant to evoke regional meaning. Future research should look at phonetic correlates and examine how the relative salience of variables impacts listeners’ recognition aptitudes.
Like Williams et al. (Reference Williams, Garrett, Coupland and Preston1999), we found that for some places there were considerable differences in recognition rates between two speakers (one man and one woman) from the same location. Results from dialect-recognition studies are generally based on one speaker per place. This study included one male and one female speaker for each place. Methodologically, it is obvious that the more speakers per site, the more reliable the results should become, as the sample becomes more representative of that region’s variety, instead of of idiolects. We recommend that future research find a balance between increasing the complexity and length of the task on the one hand, and achieving a random sampling of linguistic variation on the other. We believe that computer-based dialect-recognition tasks with map providers, like ours, give the opportunity to achieve this balance.
6. Conclusion
This study investigated how social factors impact accent recognition by looking at the Dutch language situation using an innovative map-based recognition task. Based on prior research, we expected that adults’ representations of regional language variation would be shaped by their familiarity with the different regional varieties. Indeed, clear effects of distance between the speaker’s and listener’s origins were shown, and listeners recognized their own accents more easily than others. Moreover, we showed that listeners’ recognition aptitudes were significantly determined by the listener’s age, level of education, geographical knowledge, and place of origin. Hence, the listener with the best sensitivity to regional variation in the case of the Netherlands appeared to be a middle-aged, highly educated listener from the periphery of the country. All these studied factors, either situated at the interaction between listeners’ and speakers’ characteristics or being purely listener-related, modulate familiarity effects in a complex way. Thus, listener-related factors play an important role in shaping sensitivity to language variation and in fostering the capacity to map variation onto geographical representations.
Acknowledgments
We gratefully acknowledge Yosiane White, who provided helpful comments and critiques on an earlier version of the manuscript. This study profited from discussions with Marco Helbich. We thank the colleagues from the Digital Humanities Lab, especially José de Kruif and Gerson Foks, who helped with setting up the experiments.
Ethical approval
The Faculty Ethics Assessment Committee of the Faculty of Humanities (FEtC-H) has reviewed the research project ‘Herken je het accent?” and approved the study (FEtC-H reference number: 3427943-01-2017, September 9, 2017).
Competing interest
The authors declare none.


 Open access