


1. Introduction
Design creativity is a cornerstone of innovation, driving the generation of novel and valuable ideas (Sarkar & Chakrabarti Reference Sarkar and Chakrabarti2008). Creating new products or services involves tackling ill-defined problems and managing iterative processes (Dorst & Cross Reference Dorst and Cross2001; Stempfle & Badke-Schaub Reference Stempfle and Badke-Schaub2002). The early stage of design, commonly referred to as the conceptual design phase, plays a decisive role in shaping the overall direction and potential solutions. This phase differs significantly from the systematic, linear process of detailed design or functional improvement (Stempfle & Badke-Schaub Reference Stempfle and Badke-Schaub2002; Cash et al. Reference Cash, Hicks, Culley and Adlam2015b). Prior research has reported that practitioners face various difficulties during this phase (Rekonen & Hassi Reference Rekonen and Hassi2018; Hölzle & Rhinow Reference Hölzle and Rhinow2019), and this stage has a significant impact on subsequent phases (Howard, Culley, & Dekoninck Reference Howard, Culley and Dekoninck2008; Andreasen, Hansen, & Cash Reference Andreasen, Hansen and Cash2015; Wynn & Eckert Reference Wynn and Eckert2017; Svensson Harari & Fundin Reference Svensson Harari and Fundin2023). Accordingly, understanding the conceptual design phase and developing support for better practice are critical.
The early stage of design is characterized by an iterative process of formulating problem framings and developing solution ideas (Valkenburg & Dorst Reference Valkenburg and Dorst1998; Dorst & Cross Reference Dorst and Cross2001; Stempfle & Badke-Schaub Reference Stempfle and Badke-Schaub2002). However, design teams often encounter moments where the refinement of problem framings and solution ideas slows or halts, leading to persistence and potentially hindering the quality of design (Jansson & Smith Reference Jansson and Smith1991; Purcell & Gero Reference Purcell and Gero1996; Kudrowitz & Wallace Reference Kudrowitz and Wallace2013). For instance, in the design and development of a competitive robot, a low-performing team relied on a single problem framing and spent much time on problem understanding rather than solution development (Valkenburg & Dorst Reference Valkenburg and Dorst1998). We define such a state – where problem framings or solution ideas remain static across consecutive iterations – as stagnation. Stagnation is a signal of an unproductive process that can undermine creativity in the repeated formulation of problems and development of solutions (Gerber & Carroll Reference Gerber and Carroll2012; Wynn & Eckert Reference Wynn and Eckert2017; Ball & Christensen Reference Ball and Christensen2019).
From a practical standpoint, the detection of stagnation is crucial because design teams often struggle to sustain creative momentum in real-world contexts, requiring external facilitation, encouragement for reflection, or structured interventions (Valkenburg & Dorst Reference Valkenburg and Dorst1998; Kleinsmann & Valkenburg Reference Kleinsmann and Valkenburg2008; Kleinsmann et al. Reference Kleinsmann, Deken, Dong and Lauche2012). Yet educators and practitioners lack diagnostic tools for visualizing unproductive iteration during projects. Identifying when and how stagnation occurs can provide appropriate timing for support, enabling instructors, supervisors, or managers to intervene before such anti-patterns solidify into long-term inefficiencies.
This study aims to develop and apply a diagnostic framework for identifying stagnation in design thinking projects that involve iterative cycles by illustrating the trajectory of problem framing and solution ideas. We refer to a trajectory as the result of evolutionary changes or retentions of problem framings and solution ideas during the project period. Specifically, we address the following research questions:
-
• RQ1: How do the trajectories of problem framings and solution ideas showcase stagnation?
-
• RQ2: How do the trajectories of problem framings and solution ideas relate to the evaluation of the final ideas?
-
• RQ3: What are the reasons and actions behind the specific trajectory of problem framings and solution ideas?
This paper is structured as follows: Section 2 provides a basis for the discussion by describing related studies. Section 3 describes the developed framework. Section 4 explains the research method used to validate the developed framework in a five-month design thinking project, outlining the project overview and detailing the data collection and analysis in accordance with the research questions. Section 5 presents the study’s findings, and Section 6 discusses the findings, implications, and limitations of the study, as well as possible future research directions. Finally, Section 7 concludes the paper.
2. Related studies
2.1. The need for practical diagnostics of iteration in conceptual design
The early stage of design is often referred to as the conceptual design phase, where problems and solutions develop simultaneously (Dorst & Cross Reference Dorst and Cross2001; Nordby Reference Nordby2010; Martinec et al. Reference Martinec, Škec, Horvat and Štorga2019). This phase is characterized by an iterative process of refining problem framings and developing solution ideas, and has a significant impact on later stages (Kroll Reference Kroll2013; Andreasen et al. Reference Andreasen, Hansen and Cash2015). Models like five steps of design thinking – empathize, define, ideate, prototype, and test (Liedtka Reference Liedtka2015; Lewrick, Link, & Leifer Reference Lewrick, Link and Leifer2018) – and the Double Diamond – discover, define, develop, and deliver (Design Council 2004) – highlight early stages where problem framing and solution generation are key. User-centered approaches are often employed (McDonagh Reference McDonagh2004; Leonard & Rayport Reference Leonard, Rayport and Leonard2011; van der Bijl-Brouwer & Dorst Reference van der Bijl-Brouwer and Dorst2017), including design thinking (Brown Reference Brown2008; Lewrick et al. Reference Lewrick, Link and Leifer2018), which involves activities such as user interviews and testing. This phase significantly differs from the systematic and linear process of detailed design or functional improvement (Stempfle & Badke-Schaub Reference Stempfle and Badke-Schaub2002; Cash et al. Reference Cash, Hicks, Culley and Adlam2015b).
Practitioners and educators seek support measures and interventions to manage the complex, iterative cycles of conceptual design. However, managing these processes remains challenging because the timing and intent of iterations are often opaque to both teams and coaches (Rekonen & Hassi Reference Rekonen and Hassi2018; Carlson et al. Reference Carlson, Rees Lewis, Maliakal, Gerber and Easterday2020). Without structured visibility, interventions tend to be ad hoc and reactive. When the iteration is left unmanaged, iteration breeds predictable anti-patterns – first-solution fixation, method-choice biases, and prolonged “stuckness” – that depress creativity and inflate downstream correction costs (Sachs Reference Sachs1999; Ezzat et al. Reference Ezzat, Agogué, Le Masson, Weil and Cassotti2020; Leahy et al. Reference Leahy, Daly, McKilligan and Seifert2020; Rao et al. Reference Rao, Kim, Kwon, Agogino and Goucher-Lambert2021). While various supports exist, they often rely on subjective qualitative assessments or resource-intensive manual measurements (Reymen et al. Reference Reymen, Hammer, Kroes, van Aken, Dorst, Bax and Basten2006; Carlson et al. Reference Carlson, Rees Lewis, Maliakal, Gerber and Easterday2020; Inkermann, Gürtler, & Seegrün Reference Inkermann, Gürtler and Seegrün2020; Ammersdörfer et al. Reference Ammersdörfer, Tartler, Kauffeld and Inkerman2022). Furthermore, although reflective practice and early prototyping can mitigate these issues, they are rarely activated at the critical moment when problem reframing – the iterative process of redefining the design space – is actually stalling (Dorst & Cross Reference Dorst and Cross2001; Reymen et al. Reference Reymen, Hammer, Kroes, van Aken, Dorst, Bax and Basten2006; Youmans Reference Youmans2011). A central problem is the lack of diagnostic instrumentation that makes the weekly or monthly dynamics of real projects legible. There is a pressing need to translate well-established insights from existing research into actionable supports for education and practice (Crilly & Cardoso Reference Crilly and Cardoso2017; Cash, Škec, & Štorga Reference Cash, Škec and Štorga2019). Addressing this instrumentation gap is therefore not merely a matter of academic interest but a practical necessity, as it underpins the development of methods that can enhance learning and improve real-world innovation practice.
Taken together, simple methods for diagnosing such signs of stagnation, whether expressed as “stuckness,” stalled reframing, or fixation, in iterative processes remain lacking. This study addresses these needs by focusing on intermediate design outcomes in iterative processes, which are emerging design proposal for each iteration that combines a problem framing with a tentative solution idea. We refer to problem framing as “an expression of how the problem might be understood” (Kelly & Gero Reference Kelly and Gero2022) and it is understood as the temporary formulation of the problem, including the target user, the user’s problem, and hypothesized causes, while solution idea is defined as “value propositions embodied in sketches, mockups, or prototypes” (Reymen et al. Reference Reymen, Hammer, Kroes, van Aken, Dorst, Bax and Basten2006; Lewrick et al. Reference Lewrick, Link and Leifer2018; Stickdorn et al. Reference Stickdorn, Hormess, Lawrence and Schneider2018). This study analyzes how proposals evolve over time, thereby providing a practical basis for timely, evidence-based support.
2.2. Longitudinal tracking of problem framings and solution ideas
The “stuckness” and stalled reframing introduced above are manifestations of a broader concern in the early stages of design: stagnation, an unproductive state that signals dysfunction in the iterative process and can undermine eventual design outcomes (Gerber & Carroll Reference Gerber and Carroll2012; Wynn & Eckert Reference Wynn and Eckert2017; Ball & Christensen Reference Ball and Christensen2019). For instance, Atman et al. (Reference Atman, Chimka, Bursic and Nachtmann1999) found that novice designers who spent a lot of time on problem formulation produced poorer designs than those who did not. Since stagnation can occur in both problem framings and solution ideas, longitudinal studies that track across projects are essential. Prior studies can be broadly classified into those that track solution ideas and those that track problem framings.
Many longitudinal studies track solution ideas with particular attention to prototypes (Yang Reference Yang2005; Erichsen et al. Reference Erichsen, Sjöman, Steinert and Welo2021). Ege et al. (Reference Ege, Goudswaard, Gopsill, Steinert and Hicks2024) longitudinally examined prototypes that were iteratively improved during a four-day hackathon and identified recommended prototyping strategies. Additionally, discussions around prototypes shape shared understanding (Krishnakumar et al., Reference Krishnakumar, Berdanier, McComb and Menold2021), and the prototyping strategy influences design success (Murphy et al. Reference Murphy, Floresca, Fu and Linsey2022). At the cognitive level, several frameworks exist for tracking the evolution of the solution idea. For example, Linkography depicts dependencies between ideas within discussions to compare creative methods for group ideation (Goldschmidt Reference Goldschmidt1990; Kan & Gero Reference Kan and Gero2008; Hatcher et al. Reference Hatcher, Ion, Maclachlan, Marlow, Simpson, Wilson and Wodehouse2018). C-K theory illustrates the design process by expansions and constraints between concept (C) and knowledge (K) spaces (Hatchuel & Weil Reference Hatchuel and Weil2003; Hatchuel, Masson, & Weil Reference Hatchuel, Masson and Weil2004), and is employed to track solution ideas longitudinally (Elmquist & Le Masson Reference Elmquist and Le Masson2009; Agogué et al. Reference Agogué, Kazakçi, Hatchuel, Le Masson, Weil, Poirel and Cassotti2014). Furthermore, creativity, which is frequently used as an indicator of design quality (Dean et al. Reference Dean, Hender, Rodgers and Santanen2006; Sarkar & Chakrabarti Reference Sarkar and Chakrabarti2011; Runco & Jaeger Reference Runco and Jaeger2012), is evaluated to track temporal changes in the quality of solution ideas during ideation sessions (Barbot Reference Barbot2018; Mirabito & Goucher-Lambert Reference Mirabito and Goucher-Lambert2022). Creativity is often considered a function of novelty, usefulness, and feasibility, which can be easily applied to evaluations of solution-idea quality (Singh & Chakrabarti Reference Singh and Chakrabarti2025), since creativity can be assessed at the level of individual ideas and tracked as they evolve across design phases (Ranjan, Siddharth, & Chakrabarti Reference Ranjan, Siddharth and Chakrabarti2018).
By contrast, longitudinal studies focusing on problem framing are still developing (Singh & Chakrabarti Reference Singh and Chakrabarti2025). Suk and Lee (Reference Suk and Lee2021) used protocol coding to examine the problem-framing activities of student design teams working on conceptual design tasks, comparing teams with high and low creativity. Bijl-Brouwer (Reference Bijl-Brouwer2019) studied five public and social innovation agencies and revealed the evolutionary, non-linear, emergent patterns and drivers of problem framing practices. These studies highlight the importance of problem framing in shaping design outcomes, yet longitudinal research in this area remains scarce compared with that on solution ideas.
In the early design stages, evaluating both problem framings and solution ideas is essential, as the two are deeply interrelated. At the cognitive scale, the co-evolution model takes both problem and solution into account, illustrating how cognitive and discursive processes, marked by shifts of attention between problem framing refinement and solution idea development, evolve and shape temporal dynamics (Dorst & Cross Reference Dorst and Cross2001; Gero, Kannengiesser, & Crilly Reference Gero, Kannengiesser and Crilly2022; Maher and Tang, Reference Maher and Tang2003). At the project scale, however, studies that simultaneously track both problem and solution are limited. Existing evaluation approaches have not been fully extended to cover both dimensions: creativity, for instance, maps more naturally onto solution ideas than onto problem framings, as the adequacy or originality of a problem framing is harder to assess along the same dimensions (Singh & Chakrabarti Reference Singh and Chakrabarti2025). This asymmetry suggests that creativity evaluations may not fully capture stagnation in problem framing, even when solution development appears active. A complementary approach that longitudinally tracks how both problem framings and solution ideas evolve across phases is therefore needed to detect such stagnation before it undermines final concept quality.
This study examines whether specific patterns in the evolution of problem framings and solution ideas, as documented in project outcomes, are associated with the creativity of final ideas. This linkage is essential for a longitudinal representation to function not only as a descriptive record but also as an early and practical diagnostic tool for support. In summary, existing research on tracking solution ideas and problem framings, and on microscopic models of design cognition and iteration, provides a theoretical foundation for monitoring the iterative evolution of problem settings and solution ideas. Our contribution is to extend knowledge in prior studies and make them operational over longer periods by using cumulatively recorded problem framing and solution ideas.
3. The framework to diagnose stagnation in the trajectories of problem framings and solution ideas
This study proposes a framework to identify stagnations in the evolution of problem framings and solution ideas during long-term projects. The framework visualizes the trajectory of intermediate design outcomes generated throughout the entire project. The visualization helps diagnose an unproductive iteration in long-term projects by identifying stagnation as the repeated retention of problem framings, solution ideas, or both, which map to the problem and solution spaces. The framework consists of three elements for analyzing the evolution of intermediate design outcomes: (i) transitions, (ii) trajectories, and (iii) paths.
First, transitions, which are the types of change in a concept between two consecutive time periods, consist of three types: Move, Retention, and Reuse. When items are changed, the transition is coded as Move, whereas when items are retained, the transition is coded as non-Move. Here, non-Move corresponds to the definition of stagnation. We further subdivided non-Move transitions into Retention and Reuse. Retention refers to the transition where a concept is carried over from the immediately preceding outcome, whereas Reuse refers to the transition where a concept is reintroduced from an earlier outcome.
Figure 1 illustrates representations of transitions between two consecutive time periods. The horizontal axis indicates time, and the vertical axis represents distinct concepts generated, not the degree of difference between concepts. A Move indicates the generation of a novel concept, which has not appeared before, and the trajectory steps up by one from the previous maximum level. This upward step does not imply that the concept at
$ {t}_{i+1} $
 is “twice as different” from that at
$ {t}_{i-1} $
is “twice as different” from that at
$ {t}_{i-1} $
 compared to
$ {t}_i $
compared to
$ {t}_i $
 ; rather, it simply records that a new and distinct concept has emerged. Retention denotes no change between
$ {t}_i $
; rather, it simply records that a new and distinct concept has emerged. Retention denotes no change between
$ {t}_i $
 and
$ {t}_{i+1} $
and
$ {t}_{i+1} $
 , shown as a horizontal transition. A Reuse denotes a return to a previously generated concept, represented by a step back to the level where that concept first appeared.
Representations of a transition between two continuous time periods. Transitions can be classified into three types: Move, Retention, and Reuse.

Second, based on these rules, the trajectories of problem framings and solution ideas across the project are represented as a sequence of consecutive transitions (Figure 2). A trajectory is the sequence of consecutive transitions in either the problem space or the solution space across the entire project timeline.
Visualized evolutionary trajectory. The trajectory of problem framings and solution ideas is represented as a sequence of continuous transitions.

Figure 2. Long description
The top chart plots delta P on the y-axis, with triangle markers at each time point from t sub i to t sub i plus 4 along the x-axis. At t sub i, a triangle is labeled Retention with a dashed arrow pointing right. At t sub i plus 1, a solid arrow labeled Move leads to the next triangle. At t sub i plus 2, another Move arrow leads to a triangle at t sub i plus 3, which is labeled Retention with a dashed arrow to t sub i plus 4. The bottom chart plots delta S on the y-axis, using square markers at each time point. At t sub i, a solid arrow labeled Move leads to a square at t sub i plus 1. From there, a dashed arrow labeled Reuse points to t sub i plus 2. A solid arrow labeled Move leads to t sub i plus 3, where a square is labeled Retention with a dashed arrow to t sub i plus 4. Both charts use upward-pointing y-axes and a shared x-axis with time points t sub i through t sub i plus 4.
Third, path types, combinations of simultaneous transitions in both the problem space and solution space at a given time step, are classified based on combinations of transitions in problem framings and solution ideas. Since each space has three possible transitions, this yields nine possible combinations. We classified the combinations into four path types based on their respective characteristics (see Figure 3):
-
• M: The path in which the transition in both spaces is coded as Move.
-
• R: The path in which the transition in both spaces is coded as non-Move (Retention or Reuse): in the order of problem and solution space, Retention and Retention, Reuse and Reuse, Retention and Reuse, and Reuse and Retention.
-
• $ {P}_R $
 : The path in which the combination of transitions shows a problem-side non-Move dominance: in the order of problem space and solution space, Retention and Move, and Reuse and Move.
 -
• $ {S}_R $
: The path in which the combination of transitions shows a solution-side non-Move dominance: in the order of problem space and solution space, Move and Retention, and Move and Reuse.


Path type classification rules.

Figure 3. Long description
The diagram is a matrix with three columns labeled Move, Reuse, Retention (top, left to right) and three rows labeled Move, Reuse, Retention (left, top to bottom) for S. The columns are further labeled for P at the top. The first row, Move, contains two cells: the Move column (top-left) labeled M, showing two sets of blue arrows from triangles to squares, and the Reuse column (top-center, shaded) labeled P sub R, showing dashed and solid arrows from triangles to squares and triangles. The Retention column (top-right, shaded) also under P sub R, shows solid and dashed arrows between triangles and squares. The second row, Reuse, contains two cells: the Move column (middle-left, shaded) labeled S sub R, with solid and dashed arrows from triangles to squares, and the Reuse column (middle-center) with similar arrows. The Retention column (middle-right) is labeled R, showing solid and dashed arrows between triangles and squares. The third row, Retention, contains three cells with similar arrow patterns, showing all possible transitions between triangles and squares, with solid and dashed lines. Shaded cells highlight P sub R and S sub R categories. All arrows indicate directionality of transitions, with solid for direct and dashed for indirect or repeated transitions.
Although
$ {P}_R $
 and
$ {S}_R $
and
$ {S}_R $
 include a Move in one space, we still classify them as stagnation because the absence of change in either the problem or solution space is itself an indicator of an unproductive iteration. Within non-Move transitions, Retention and Reuse represent different modes of persistence (maintaining the current state versus returning to a prior state), but we treat them as the same type, as both retain existing concepts.
This four-way classification (M,
$ {P}_R $
 ,
$ {S}_R $
,
$ {S}_R $
 , R) is designed to distinguish not only whether stagnation occurs, but also in which space it occurs. R represents symmetric stagnation, where neither space progresses, while
$ {P}_R $
, R) is designed to distinguish not only whether stagnation occurs, but also in which space it occurs. R represents symmetric stagnation, where neither space progresses, while
$ {P}_R $
 and
$ {S}_R $
and
$ {S}_R $
 represent asymmetric stagnation, where non-Move is concentrated in only one space. For example,
$ {S}_R $
represent asymmetric stagnation, where non-Move is concentrated in only one space. For example,
$ {S}_R $
 can be understood as existing solution ideas applied to an entirely new problem situation, where an idea is repeated and applied to a new context. The same reasoning applies to
$ {P}_R $
can be understood as existing solution ideas applied to an entirely new problem situation, where an idea is repeated and applied to a new context. The same reasoning applies to
$ {P}_R $
 . This classification enables us to distinguish symmetric paths across the two spaces from asymmetric paths, where non-Move is concentrated in only one space. In other words, it clarifies whether a path is balanced across both spaces or biased toward non-Move in either the problem or solution space.
Two critical considerations warrant attention. First, in the visualization, an upward movement merely indicates “a newly appeared concept that does not resemble any of the previous concepts,” and does not imply the extent to which the exploration area has expanded. The visualization emphasizes when and in which space similar content appeared, thereby making the repetition of problem framings or solution ideas visible. Second, although the co-evolution model (Maher & Poon Reference Maher and Poon1996; Dorst & Cross Reference Dorst and Cross2001; Gero et al. Reference Gero, Kannengiesser and Crilly2022) inspires the framework, the interaction between the problem and solution spaces is not evaluated. The framework, instead, only considers the independent changes in each of the problem and solution spaces.
4. Method
4.1. Overview of the focal project
The target project is a five-month new product development project. This project is an industry-academia project carried out at the authors’ university. The goal of the project is to develop functional and tangible innovative products within a design theme provided by a partner company. The themes are open-ended, allowing teams to explore a wide range of ideas (see Table 1). Student teams consist of members from diverse backgrounds and iteratively work through trial and error based on design thinking approaches. The project participants are first-year graduate students majoring in engineering and third-year undergraduate students from other universities who major in arts or design. Teams make all decisions regarding project progress independently, including scheduling, task assignment, role allocation, method selection, and strategy development. Teams conduct various activities, such as user research, including interviews or observations, analysis of a user’s situation, problem framing or reframing, ideation using brainstorming methods, creating mock-ups of ideas, and user testing. Class hours are dedicated to presentations and mentoring, while most design work is completed by teams outside of class. This study collected data from projects belonging to courses given in 2021, 2022, and 2023. Table 1 describes the number of teams, team sizes, number of participants, number of partner companies, and examples of design themes given by the partner companies.
Numerical information on each year’s project and examples of the design theme given to student teams

Table 1. Long description
From left to right, columns are labeled Year, number of teams, number of members per team, number of participants with E for engineering graduate students and A for undergraduate design or art majors, number of partner companies, and examples of design theme. For 2021: 9 teams, 5 to 6 members per team, 47 participants (35 E, 12 A), 4 partner companies, themes include designing a product experience for disaster proximity and a playful outing for urban elderly. For 2022: 11 teams, 5 to 6 members per team, 57 participants (42 E, 15 A), 5 partner companies, themes include supporting parents from afar and supporting farmers in new agriculture. For 2023: 11 teams, 5 to 6 members per team, 57 participants (42 E, 15 A), 7 partner companies, themes include redesigning neighborhood socializing and new end-of-life experiences.
E: Engineering graduate student. A: Undergraduate student majoring in design or art.
All participants were required to attend the lecture held before the project began to learn about design thinking approaches. The prerequisite lecture was project-based, consisting of seven face-to-face sessions, in which students were expected to gain a basic understanding of design thinking, carry out the design process from user research through to creating a tangible prototype, and present their final proposals. Faculty and teaching assistants closely observed students’ behaviors to assess the abilities of each participant.
The focal project lasts for five months and includes 15 face-to-face sessions. The first half period (sessions 1–10) is spent on concept exploration based on user research, iterative prototyping, and testing, and the latter half period (sessions 11–15) is spent on developing a functional and tangible prototype for the final presentation day (see Figure 4).
Timeline of the project. The project consisted of 15 sessions with six presentations.

Figure 4. Long description
The horizontal timeline is anchored at the bottom, labeled Week, with numbered boxes from 1 to 15. Above the timeline, five icons mark progress presentations at weeks 3, 5, 7, 9, 10, and 15, labeled 1st, 2nd, 3rd, 4th, mid., and Final. Below weeks 1 to 10, a dark arrow labeled Exploration of initial concept through user research or testing spans left to right. Above weeks 10 to 15, a dashed arrow labeled Development of prototype for the final presentation extends rightward.
The student teams interact with faculty, teaching assistants, and partner companies, while the stakeholders do not interrupt teams unless the teams request advice. The educators are professors with expertise in either engineering or design and several years of experience in design education. Faculty provide feedback on teams’ intermediate design outcomes after progress presentations. Teaching assistants, who have previously participated in the project, support the facilitation of the lectures and provide peer-to-peer support to the team. The partner companies develop design themes related to their businesses and support student teams in understanding the scope of a design theme throughout the project.
The following describes the contents of each session:
-
• In session 1, teams are formed, and the partner companies introduce their design themes. Team composition is conducted to ensure diversity in terms of gender, disciplinary expertise, and leadership abilities, based on observations by faculty and teaching assistants during the lecture held before the project. Design themes are introduced in conjunction with companies’ technologies or businesses, as well as related social issues.
-
• In session 2, each team is assigned a design theme that aligns with their preferences. Additionally, team-building activities are conducted to foster relationships among team members. After this session, teams start developing a new product.
-
• In sessions 3–9, each team has four opportunities to present their progress and receive feedback from faculty and partner companies, approximately once every two weeks. The presentation must be within five minutes and follow a template that includes the team’s problem framing and solution idea. Teams take responsibility for selecting which advice to follow and planning the next action by reflecting on their process after the feedback.
-
• In session 10, a mid-term presentation is conducted to assess the potential of each team’s proposal. The assessment aims to determine whether teams can proceed in the same direction or must make a pivot. A judgment is made as to whether the intermediate design outcome has the potential to lead to a creative solution (“GO”) or not (“NOGO”). The judgments are made in discussions among approximately 20 people, including faculty members and representatives from partner companies. Evaluation is delivered from various perspectives, for instance, whether the problem framing and solution ideas align with the scope of the theme, whether the problem framing is based on insightful findings from user research, or whether the solution idea is original or effective in resolving a problem.
-
• Sessions 11–14 are allocated for continued team activities, including prototype development and discussions to align the direction with the faculty on proposals. Teams with “GO” focus on finalizing the prototype without drastic changes to problem framing and solution ideas. Teams with “NOGO” continued exploratory user research to determine a concept and move on to prototype development once a good idea is identified. Teams with “NOGO” are required to hold a session with faculty to seek advice on the concept decision. On average, two teams receive “GO” each year.
-
• Session 15 is a final presentation, open to audiences beyond the stakeholders. Teams present and demonstrate their prototypes.
This research has been reviewed and approved by the Ethics Review Committee of the authors’ university.
4.2. Visualization of trajectories of problem framings and solution ideas
This section corresponds to RQ1 and provides detailed methods for visualizing the trajectories of problem framing and solution idea evolution.
4.2.1. Data collection
The presentation materials include four times progress reports, mid-term presentations, and final presentations as intermediate design outcomes during the project. For all 31 teams – 9 in 2021, 11 in 2022, and 11 in 2023 – materials were collected for six presentation sessions, resulting in a total of 186 presentations. Confirmation of research cooperation was conducted after the end of each year’s project. We obtained consent from all the teams, and no compensation was paid for this data collection.
The materials were in digital data, presented as slides in 2021 and 2022, and as documents in 2023. Although the format differed, all presentations followed the provided template, and the amount of information and included items remained the same. The template consists of the following elements: an overview of the proposed concept, key findings from user research, unique insights gained, ideas generated to address the problem, features of the developed prototype, and results from user testing. Figure 5 shows examples of the presentation material.
Example of the presentation material. Student teams were required to present their progress/proposal by following a presentation template.

Figure 5. Long description
The left panel, titled Target User, profiles families who purchased detached houses when their children were born, specifically couples in their 30s with two preschoolers. It lists thoughts and actions toward the house, including wanting to use the garden, finding garden management time-consuming, interest in kitchen gardens and lawns, redirecting for convenience, and using the garden as a playground. The center panel, titled User Journey Map, shows a timeline from buying a house to the present, with icons for parents and children. It highlights children playing in the garden, parents focusing on club activities, and the garden becoming deserted as children lose interest. The right panel, titled Solution, presents the Unit Garden concept with a photo of modular garden units. Purpose is to provide a garden that adapts as the home environment changes. Function lists creating a purpose-built garden, allowing for easy maintenance, and enabling each unit to be replaced individually.
4.2.2. Data analysis
To extract elements from intermediate design outcomes using a deductive coding approach (Mayring, Reference Mayring2021), we adopted the perspectives of problem framing and solution idea. We defined problem framing as comprising three elements: “target user,” “user pain/gain,” and “root causes of unmet pain/gain,” and solution idea as “value proposition” based on existing studies (Reymen et al. Reference Reymen, Hammer, Kroes, van Aken, Dorst, Bax and Basten2006; Lewrick et al. Reference Lewrick, Link and Leifer2018; Stickdorn et al. Reference Stickdorn, Hormess, Lawrence and Schneider2018; Carlson et al. Reference Carlson, Rees Lewis, Maliakal, Gerber and Easterday2020).
The coding criteria are defined as follows: a transition in the problem space is classified as non-Move (Retention or Reuse) if target user is the same or in a job with similar features, in a comparable workplace, or with similar attributes, or if user pain/gain and root causes refer to a similar place or situation. A transition in the solution space is classified as non-Move (Retention or Reuse) if the function, shape, or intended user experience is similar to that of the previous one. Since we focus on the early stage of design, where practitioners are required to explore a wide range of concepts (Liu, Chakrabarti, & Bligh Reference Liu, Chakrabarti and Bligh2003), we consider a trivial change (e.g., adding or removing elements, or rephrasing) to constitute no change, “non-Move.” If the above conditions are not observed, the transition is classified as “Move.”
Table 2 presents an example of the extracted elements from the presentation materials along with evaluations of whether the intermediate design outcomes were changed or not. We extracted four items from the corresponding element of presentation materials using the deductive coding approach (Dean et al. Reference Dean, Hender, Rodgers and Santanen2006): “target user” from facts from user research, “user pain/gain” and “root causes (unmet pain/gain)” from the unique insights gained, and “value proposition” from ideas generated to solve the problem.
Example of extracted contents and results of evaluation

Table 2. Long description
The table has seven columns and multiple rows. The first column contains labels P and S. The second column lists categories: Target user, User Pain/Gain, Root causes, value proposition. The next five columns represent time points: t, Transitions t to t plus 1, t plus 1, Transitions t plus 1 to t plus 2, and t plus 2. For Target user at t, the entry is ‘88-year-old man living alone, early dementia signs. His daughter (60) and son (58) contact via S N S, visit twice a month.’ For t plus 1, ‘88-year-old man, former ink painter. Wife passed away 3 years ago. Only goes out for dog walks, has mobility issues, uses a cane.’ For t plus 2, ‘88-year-old man, wife passed away 3 years ago, uses a cane.’ User Pain/Gain at t is ‘Lack of family conversations.’ At t plus 1, ‘Needs new scenery for artistic inspiration.’ At t plus 2, ‘Needs motivation to walk more.’ Root causes at t are ‘Struggles with unfamiliar topics in conversation.’ At t plus 1, ‘Difficult to carry a heavy camera while walking.’ At t plus 2, ‘Unclear walking goals lower motivation.’ Value proposition at t is ‘Handwritten family newspaper shared 1 to 2 times a month.’ At t plus 1, ‘Product changed from newspaper to cane.’ At t plus 2, ‘Cane that functions as a tripod for photography.’ At t plus 2, ‘Cane changes color based on walking distance, alerts family if user falls.’ Transition types are indicated as Retention or Move in the appropriate cells. Path type row includes P sub R and R in the relevant columns. Each transition column is labeled as ‘Same target user,’ ‘Same concept (Cane),’ or '-'. The table footnote states: ‘Note. Each item was extracted from the presentation materials used for the progress presentation.’
Note. Each item was extracted from the presentation materials used for the progress presentation.
As the design theme sets certain boundaries for the scope of exploration, similarities caused only by themes are not coded for Retention or Reuse. For instance, when the design theme is related to agriculture, focusing on farmers was not considered as Retention. Retention was coded by evaluating farming characteristics (e.g., crop types, organic cultivation). The evaluation among the extracted items was conducted independently by the first and second authors. The differences in the evaluation were resolved through discussion.
The evaluations were conducted for pairs of two consecutive presentations; thus, with 31 teams and five transitions between six presentation periods (1st–2nd, 2nd–3rd, 3rd–4th, 4th–mid, mid–final), a total of 155 instances were evaluated. The transitions were qualitatively evaluated to determine whether the current intermediate design outcomes contained elements similar to those of the previous ones. Both the first and second authors had been involved in the project as part of the teaching team. After the evaluation, the evolution in problem framings and solution ideas was visualized as a graph. Analyzing a single team, extracting items from the presentation, coding, discussion for agreement, and visualization, took 10 minutes, with analyzing all data requiring about 5 hours.
4.3. Analysis of relationships between idea evaluation results and visualized trajectories
This section corresponds to RQ2 and provides detailed methods for investigating the relationships between idea evaluations and visualized patterns.
4.3.1. Creativity evaluation of the final presentation
The creativity evaluation of the ideas at the final presentation was conducted explicitly for this study based on the evaluation framework proposed by Dean et al. (Reference Dean, Hender, Rodgers and Santanen2006). Dean et al. (Reference Dean, Hender, Rodgers and Santanen2006) was chosen because the study provides a detailed evaluation procedure. The evaluation employed a 7-point scale across three criteria: Originality (the degree of not only rarity but also ingenuity, imagination, and surprise), Effectiveness (the degree to which the idea will solve the problem), and Implementability (the degree of ease in implementing the idea). The three criteria were chosen since a creative idea is understood as an idea applicable to the problem, an effective and implementable solution, and a novel idea (Dean et al. Reference Dean, Hender, Rodgers and Santanen2006).
Two evaluators were employed, including the second author and a graduate student with experience in design-related research. The evaluation was performed with five steps: data standardization, evaluator training, evaluation, review, and reliability assessment. First, to standardize data, eight elements were extracted from the final presentation materials by the deductive coding approach (Mayring, Reference Mayring2021): design theme, target users, user problems, proposed product, prototype images, product features, mechanisms, and prototype overview. Next, to ensure consistency in evaluation, the evaluators conducted training using a separate dataset irrelevant to the project. Inter-rater reliability, measured by Cronbach’s alpha (Taber Reference Taber2018), was calculated for each evaluation criterion. Training rounds were conducted until Cronbach’s alpha exceeded 0.8. After the training, the evaluators individually evaluated the randomly ordered dataset with eight extracted elements. Once evaluations were completed, evaluators reviewed their results and resolved significant discrepancies through discussion, refining their understanding of the evaluation criteria. After the review, the evaluators then repeated the evaluation and finalized scores. Finally, to confirm the inter-rater agreement, the weighted Cohen’s kappa (quadratic weighting) was calculated. The values were more than 0.8, assuring high reliability for each criterion (Landis & Koch Reference Landis and Koch1977). The creativity score for each idea was calculated as an average score of three criteria evaluated by two evaluators.
4.3.2. Comparison among teams on trajectory features and idea evaluations
The relationships between idea evaluation and the visualized trajectory were statistically analyzed. Specifically, teams were grouped based on characteristics observed in their visualized trajectories, and we tested whether these groups differed significantly in the final creativity scores of their ideas. Among each path type, we analyzed the distributions in advance and defined groups for statistical comparisons. We employed the nonparametric Mann–Whitney U test (Mann & Whitney Reference Mann and Whitney1947; Fay & Proschan Reference Fay and Proschan2010) and compared the distributions between two independent groups, specifically, (i) with GO versus with NOGO, (ii) without multiple M versus with multiple M, (iii) with multiple
$ {P}_R $
 versus without multiple
$ {P}_R $
versus without multiple
$ {P}_R $
 , (iv) with multiple
$ {S}_R $
, (iv) with multiple
$ {S}_R $
 versus without multiple
$ {S}_R $
versus without multiple
$ {S}_R $
 , and (v) with multiple R versus without multiple R. For groups (ii)–(v), we set the threshold for grouping after analyzing the data distribution. Note that for the group related to R, we excluded the period mid-fin to avoid conflating GO teams who legitimately repeated their proposal with teams that genuinely stagnated. A two-tailed alpha level of 0.05 was used, and effect size was measured using
$ r=Z/\sqrt{N} $
, and (v) with multiple R versus without multiple R. For groups (ii)–(v), we set the threshold for grouping after analyzing the data distribution. Note that for the group related to R, we excluded the period mid-fin to avoid conflating GO teams who legitimately repeated their proposal with teams that genuinely stagnated. A two-tailed alpha level of 0.05 was used, and effect size was measured using
$ r=Z/\sqrt{N} $
 , where
$ Z $
, where
$ Z $
 is the standardized test statistic and
$ N $
is the standardized test statistic and
$ N $
 is the total sample size (Fritz, Morris, & Richler Reference Fritz, Morris and Richler2012). Effect size was reported as an indicator of the magnitude of the observed differences (Funder & Ozer Reference Funder and Ozer2019; Sullivan & Feinn Reference Sullivan and Feinn2012; Wilkinson and Task Force on Statistical Inference, American Psychological Association, Science Directorate, Reference Wilkinson1999). A qualitative analysis of the visualized trajectories was conducted to deepen our understanding of the results of the statistical tests.
4.4. Analysis of reasons and actions behind the path types
4.4.1. Data collection
Semi-structured interviews were conducted with 24 students across six teams in 2022 to reveal reasons and actions behind each period. Three to five members from each team participated, allowing for a multifaceted understanding of each team’s situation. One- to two-hour online interviews were conducted by the first author within one month after the end of the 2022 project. The example question was “What was the topic you were focusing on at that time?” or “Why did you change the proposal?” The complete set of questions prepared for the interviews is shown in Appendix A. The interview questions were kept consistent regardless of the observed path types.
The first author directly contacted students to request their participation, and consent was obtained. Participants were compensated for their time with 1000 Japanese yen (about 7.5 dollars) per hour upon completion of the study. All audio recordings were fully transcribed for analysis after the interviews were conducted.
4.4.2. Data analysis
To reveal reasons and actions behind the path type, the semi-structured interview was analyzed using the inductive coding approach (Mayring, Reference Mayring2021) in MAXQDA. Each interview transcript was segmented into meaning units – self-contained expressions of an action, Result, or its trigger, Cause – based on thematic coherence. The coding proceeded in three steps: (1) summarizing the unit’s key message, (2) organizing the summarized segments in terms of a project period (1st–2nd, 2nd–3rd, 3rd–4th, 4th–mid, or mid–final), and (3) inductively coding the types of Cause and Result. The inductive coding was conducted manually with iterative refinement of codes through constant comparison. Examples of segments and codes are shown in Figure 6. The inductive coding process involved discussion between the first and second authors, with disagreements resolved through discussion.
Examples of paraphrased segments and corresponding codes.

Figure 6. Long description
The table has four columns labeled Team (Period), Paraphrase, Cause, and Result. The first row is Team 1 (4th-mid) with a paraphrase about clarifying an unclear problem, cause coded as P-Define with low specificity, and result as P-Iteration to fix interviewees. The second row is Team 16 (2nd-3rd) with a paraphrase about concerns over idea structure, cause coded as S-Idea for design specification issues, and results as S-Change to discard prior ideas and S-Iteration to refine existing ideas. The third row is Team 6 (4th-mid) with a paraphrase about concerns over idea effectiveness, cause coded as S-Idea for limited usefulness, and results as P-Iteration to repeat interviews and S-Iteration to refine existing ideas. Coded causes and results are highlighted in blue and green respectively.
5. Findings
The proportion of the four path types taken by 31 teams across five different periods, totaling 155 instances, was calculated to see the diversity of visualized patterns. Eighty-four instances (54.2%) were classified as M, 37 instances (23.9%) as R, 11 instances (7.1%) as
$ {S}_R $
 , and 23 instances (14.8%) as
$ {P}_R $
, and 23 instances (14.8%) as
$ {P}_R $
 . The classification results for each team are shown in Appendix B.
5.1. Evolutionary trajectories of problem framings and solution ideas
Figure 7 displays examples of visualized results, illustrating variations in the transitions. For instance, Team 27 exhibits continuous changes in both problem and solution throughout the entire project, whereas Team 31 displays a notable stagnation. The visualization indicates how many times the concepts are reused; for example, Team 8 retains the first problem framing in both the 3rd and mid-presentations.
Example of visualized results. The characteristics of the visualization vary depending on the teams; some teams exhibit continuous evolution (M) in both spaces (Teams 27), while others display a continuous retention tendency (Teams 8 and 31).

Figure 7. Long description
From left to right, each panel is labeled Team 8, Team 27, and Team 31. All panels have x-axes labeled 1st, 2nd, 3rd, 4th, mid, fin. Above the x-axes, gray italicized labels appear: for Team 8, M, P sub R, S sub R, R, M; for Team 27, M repeated; for Team 31, R, P sub R, S sub R, R, R. The y-axes are not labeled. In each panel, two lines are plotted: a dark blue line with triangle markers for Problem, and a light blue line with square markers for Solution, as indicated by the legend on the far right. For Team 8, the Problem line fluctuates, peaking at 3rd and final stages, while the Solution line rises steadily. For Team 27, both lines increase linearly, with the Problem line always above the Solution line. For Team 31, both lines are nearly flat, with the Problem line consistently higher than the Solution line, which remains low. The legend on the right uses a triangle for Problem and a square for Solution, with corresponding colors.
To define the groups for statistical comparisons, we analyzed the distribution of path types and integrated it with our theoretical focus on “stagnation.” First, our data reveal that M is the dominant path type, accounting for 54.2% of all transitions (appearing 2.5 times on average). This establishes M as baseline behavior, representing continuous exploration. Conversely, non-M (
$ {P}_R $
 ,
$ {S}_R $
,
$ {S}_R $
 , R), which correspond to the definition of stagnation (where problem framings or solution ideas remain static), appear less frequently. While a single occurrence of a non-M path might indicate a momentary pause, we argue that stagnation is characterized by the persistence of a static state rather than a one-time event. Empirically, only three of 31 teams exhibited any single non-M path more than twice. Therefore, observing a specific non-M path two or more times signals a distinct behavioral pattern that deviates from baseline exploration. From these alignments, we set the threshold to 2.
5.2. Relationships between idea evaluation and path types
The distributions of the creativity score related to teams that receive a “GO” and teams that receive a “NOGO” in the mid-term presentation are shown in Figure 8. The Mann–Whitney U test did not show a significant difference (p = 0.542 > 0.05). This suggests that receiving a “GO” evaluation in the mid-term presentation did not necessarily correlate with higher creativity ratings.
The results of the Mann–Whitney U test comparison of creativity scores between teams with “GO” and without “GO.”

The visualized path types of teams with highly evaluated ideas at the mid-term and final presentations were qualitatively analyzed. Teams with “GO” commonly exhibited consecutive occurrences of the M by the mid-term presentation; however, regardless of the shared characteristic visualization of teams with “GO,” teams that scored high creativity of final ideas showed diverse patterns and no commonalities (see Appendix B).
The relationships between the visualized trajectories and the creativity scores of final ideas were investigated among the visualization groups defined in sub-section 4.3.2. Figure 9 (left) shows the distribution of creativity scores depending on the number of M per team. The Mann–Whitney U test indicated that teams without multiple M (median: 4.33) had a significantly lower creativity score than teams with multiple M (median: 5.00), with p = 0.009 (< 0.05) and r = −0.46. Figure 9 (right) shows the comparisons between the teams with multiple
$ {P}_R $
 (median: 4.33) and teams without multiple
$ {P}_R $
(median: 4.33) and teams without multiple
$ {P}_R $
 (median: 5.00). The Mann–Whitney U test indicated teams with multiple
$ {P}_R $
(median: 5.00). The Mann–Whitney U test indicated teams with multiple
$ {P}_R $
 had significantly lower creativity scores (p = 0.029 (< 0.05), r = −0.39). However, the Mann–Whitney U test did not indicate a difference in the distribution between groups, depending on
$ {S}_R $
had significantly lower creativity scores (p = 0.029 (< 0.05), r = −0.39). However, the Mann–Whitney U test did not indicate a difference in the distribution between groups, depending on
$ {S}_R $
 (p = 0.52 (> 0.05)) and R (p = 0.34 (> 0.05)).
Results of the Mann–Whitney U test between two groups: teams without multiple M versus with multiple M; teams with multiple
$ {P}_R $
 versus without multiple
$ {P}_R $
versus without multiple
$ {P}_R $
 .
.

Figure 9. Long description
From left to right, the first panel compares teams without multiple M to teams with multiple M. The y-axis is labeled Creativity score, ranging from 1 to 7. The boxplot for teams without multiple M is blue, centered at a lower median than the gray boxplot for teams with multiple M. A double asterisk above the plot indicates statistical significance. Below, Mann-Whitney U test results are shown: p equals 0.009, r equals negative 0.46. The second panel compares teams with multiple P sub R to teams without multiple P sub R. The blue boxplot for teams with multiple P sub R has a lower median than the gray boxplot for teams without multiple P sub R. Statistical significance is marked with a double asterisk. Mann-Whitney U test results are p equals 0.029, r equals negative 0.39. Both panels indicate that teams with multiple M or multiple P sub R have significantly different creativity scores compared to their counterparts.
Note that teams with multiple M or without multiple
$ {P}_R $
 did not necessarily receive high creativity ratings. For example, Teams 26 and 27 exhibited the M at every stage of the project; however, their creativity scores were low (4.17). Among the teams that exhibited the M three times, some had high creativity scores (Team 9: 5.33), whereas others had lower scores (Team 6: 4.00). Similarly, among teams in which the
$ {P}_R $
did not necessarily receive high creativity ratings. For example, Teams 26 and 27 exhibited the M at every stage of the project; however, their creativity scores were low (4.17). Among the teams that exhibited the M three times, some had high creativity scores (Team 9: 5.33), whereas others had lower scores (Team 6: 4.00). Similarly, among teams in which the
$ {P}_R $
 never appeared, both high-performing teams (Team 1: 6.33) and low-performing teams (Team 6: 4.00) were present. The results of classified transitions and idea evaluation for all teams are presented in Appendix B.
5.3. Reasons and actions behind the path types
We analyzed 30 instances (five periods of six teams) to interpret the reasons (Causes) and ensuing actions (Results) associated with visualized path types. Table 3 summarizes the interviewed teams and the path types observed across periods. The distribution of instances across path types broadly mirrored the pattern frequencies reported in Section 5.1 within these interviewed teams.
Overview of the teams targeted at the semi-structured interview

Table 3. Long description
The table has nine columns. The first column lists Team numbers 1, 6, 8, 12, 16, and 26. The next five columns, labeled as Path types, are 1st to 2nd, 2nd to 3rd, 3rd to 4th, 4th to mid, and mid to fin. For Team 1, the path types are S sub R, M, M, R, R. For Team 6, M, M, M, R, R. For Team 8, M, P sub R, S sub R, R, M. For Team 12, M, M, P sub R, R, M. For Team 16, M, R, R, M, P sub R. For Team 26, M, M, P sub R, P sub R, M. The seventh column is Mid-term eval., with values GO for Teams 1 and 6, NOGO for Teams 8, 12, 16, and 26. The eighth column is Final eval., with values 6.33, 4.00, 5.67, 5.17, 5.00, and 4.17 for Teams 1, 6, 8, 12, 16, and 26 respectively. The ninth column is Number of participants of the interview, with values 4, 5, 4, 3, 3, and 5 for Teams 1, 6, 8, 12, 16, and 26 respectively.
Through the inductive coding to identify the characteristics of the process underlying the evolution of problem framings and solution ideas, we gained categories for both Cause and Result (Table 4). Cause was coded for content related to the reasons of design activities, including reasons for an action, considerations before a concrete activity, or other factors that affect decision-making. For Cause, five categories were generated: problem, problem-solving, solution, process, and others. Result was coded for the content that related to the actions in the design process, including the approach used or the result of decision-making. For Result, three categories were generated: problem, solution, and process.
Summary of categories and codes of Cause and Result generated through an inductive coding approach (Mayring, Reference Mayring2021)

Table 4. Long description
The table is divided into two main sections, Cause and Result, each with subcategories and associated codes and content. Under Cause, the Problem (P) category includes codes P-Target (ease of contact, user characteristics), P-Define (difficulty identifying issues, low salience, low specificity, inadequate specification), and P-Evaluation (buy-in or interest in the problem). Problem-solving includes P-S (root-cause difficulty, solution-problem misfit). Solution (S) includes S-Idea (limited societal impact, lack of novelty, feasibility constraints, limited usefulness, design specification issues) and S-Evaluation (lack of conviction in solution). Process includes Scope (misalignment with theme, mismatch with other requirements) and Approach (theme interpretation, low interview quality, conduct new interviews, low user-testing quality, user feedback, existing outputs available). Others include Internal factor (reluctance to pivot, insight from shadowing) and External factor (time constraints). The Result section lists Problem (P) with P-Iteration (repeat interviews, broaden interview sample, fix interviewees, refine problem definition, reuse prior research) and P-Change (field observation, adjust interview strategy, change target population, tighten focus). Solution (S) includes S-Iteration (increase idea quantity, refine existing ideas, refine prototype, reuse prior ideas) and S-Change (discard prior ideas, set ideation direction, change solution strategy). Process includes Cross-Process (maintain theme interpretation), Activity change (conduct extra user testing, theme scope alignment), and Available (reuse prior outputs, compromise proposal).
Interestingly, reasons and actions behind M varied across teams, although the statistical analyses linked multiple Ms with a high creativity score. Figure 10 presents selected segments corresponding to the M. A member of Team 6, who scored lower on creativity, mentioned that the team struggled to identify core issues, encountered the limitations of the interview, and decided to incorporate observation as a new research approach. Team 1, who scored high in creativity, stopped blindly repeating the design process and instead revisited the data they had already collected after presenting a proposal they were uncertain about. In contrast, Teams 12 and 16, who received poor ratings for creativity, adjusted their problem-related activities based on issues identified in a previous presentation. Team 16 found their problem framing insufficiently specific and changed their interview strategy to ensure alignment between the problem and the solution. Team 12 faced a lack of alignment between the solution and their design theme, and changed their target user to investigate further.
Examples of paraphrased segments and corresponding codes of M.

Figure 10. Long description
The table has four columns labeled Team (Period), Paraphrase, Cause, and Result. Row one: Team 6 (2nd-3rd) paraphrase is highlighted in blue, cause is Approach (low interview quality) in blue, result is P-Change (field observation) in green. Row two: Team 1 (3rd-4th) paraphrase includes blue highlight, cause is S-Evaluation (lack of conviction in solution) in blue, result is P-Iteration (reuse prior research) in green. Row three: Team 16 (4th-mid) paraphrase has blue highlight, causes are P-Define (low specificity) and P-S (solution-problem misfit) in blue, result is P-Change (set/adjust interview strategy) in green. Row four: Team 12 (2nd-3rd) paraphrase has blue highlight, causes are Scope (misalignment with theme) and P-Target (user characteristics) in blue, result is P-Change (change target population) in green. Each row links paraphrased team reflections to specific causes and coded results, with color coding distinguishing cause and result categories.
Regarding the reasons and actions behind a path type significantly associated with lower creativity scores,
$ {P}_R $
 (retention in the problem space), retention in the problem space occurred when teams were unable to make drastic changes to their activities. Figure 11 shows the reasons and corresponding actions behind
$ {P}_R $
(retention in the problem space), retention in the problem space occurred when teams were unable to make drastic changes to their activities. Figure 11 shows the reasons and corresponding actions behind
$ {P}_R $
 . Team 16 became aware of the need for a transition after receiving feedback that the solution’s value its solution provided to users was limited. However, rather than making a drastic change, Team 16 drew on past research data to refine their understanding of the user’s situation. Team 26 was informed that its proposal deviated from the scope of the given design theme; however, the team believed the issue could be resolved by simply revising their ideas. As a result, Team 26 proceeded with the idea generation without conducting any user research. Team 8 decided to pivot from its existing proposal and initiated a process to explore a new problem; however, due to the time constraints, Team 8 ended up presenting an idea that had been generated earlier, without thorough discussion. As described above, the processes behind
$ {P}_R $
. Team 16 became aware of the need for a transition after receiving feedback that the solution’s value its solution provided to users was limited. However, rather than making a drastic change, Team 16 drew on past research data to refine their understanding of the user’s situation. Team 26 was informed that its proposal deviated from the scope of the given design theme; however, the team believed the issue could be resolved by simply revising their ideas. As a result, Team 26 proceeded with the idea generation without conducting any user research. Team 8 decided to pivot from its existing proposal and initiated a process to explore a new problem; however, due to the time constraints, Team 8 ended up presenting an idea that had been generated earlier, without thorough discussion. As described above, the processes behind
$ {P}_R $
 exhibited an inability to make drastic changes in activities.
Examples of paraphrased segments and corresponding codes of
$ {P}_R $
 .
.

Figure 11. Long description
The table has four columns: Team (Period), Paraphrase, Cause, and Result. Three rows are present, each for a different team and period. Row one: Team 16 (3rd–4th), paraphrase in blue italics notes limited value of the proposed solution and refinement using research data; cause is S-Idea (limited societal impact) in blue; result is P-Iteration (reuse prior research) in green. Row two: Team 26 (3rd–4th), paraphrase in black with blue and green highlights describes misalignment with theme and generating a new idea; cause is Scope (misalignment with theme) in blue; results are P-Iteration (reuse prior research) and S-Iteration (increase idea quantity), both in green. Row three: Team 8 (2nd–3rd), paraphrase in black with blue and light blue highlights discusses concerns with the proposed idea and time constraints; causes are S-Idea (limited usefulness) in blue and External factor (time constraints) in light blue; result is Available (compromise proposal) in black. Color coding: blue for S-Idea, green for P-Iteration and S-Iteration, light blue for external factors. All codes are parenthesized and mapped to paraphrased segments.
6. Discussion
6.1. Relational evaluation of intermediate outcomes as a means to identify stagnation in design projects
The proposed framework visualizes the development of problem framings and solution ideas across project stages by comparing intermediate design outcomes at consecutive stages drawn from routine project documentation. The relations between path types of visualization and final idea evaluations revealed two conditions when teams showed lower creativity: (i) without multiple M and (ii) with multiple
$ {P}_R $
 . The results suggest that two path types associated with low creativity scores can act as early diagnostic signals for stagnation. Thus, the proposed framework provides a means to identify teams at risk of low-creativity outcomes.
The relational evaluation of consecutive intermediate design outcomes addresses a key limitation of existing approaches: these outcomes are inherently incomplete and often unsuitable for absolute evaluation, such as creativity evaluation by experts (Dean et al. Reference Dean, Hender, Rodgers and Santanen2006; Sarkar & Chakrabarti Reference Sarkar and Chakrabarti2011). In addition, the absolute evaluation was often limited to solution ideas (Singh & Chakrabarti Reference Singh and Chakrabarti2025), although design thinking models emphasize the importance of iterative changes to both problem framings and solution ideas in the early stages of design (Wynn & Eckert Reference Wynn and Eckert2017; Wynn & Clarkson Reference Wynn and Clarkson2018). The relational approach thus circumvents both issues: comparisons between consecutive outcomes remain meaningful even when individual proposals are incomplete, and the framework evaluates both problem framings and solution ideas in tandem.
The proposed framework tracks the evolution of problem framings and solution ideas throughout the project life cycle. Analyses that simultaneously trace problem framings and solution ideas over time have largely focused on short-term activities such as Linkography, which quantifies idea-to-idea connectivity within individual sessions (Kan & Gero Reference Kan and Gero2008; Hatcher et al. Reference Hatcher, Ion, Maclachlan, Marlow, Simpson, Wilson and Wodehouse2018), and co-evolution analysis of design episodes (Dorst & Cross Reference Dorst and Cross2001; Wiltschnig, Christensen, & Ball Reference Wiltschnig, Christensen and Ball2013). The proposed framework has the potential to bridge this gap by identifying which transitions in a project warrant closer micro-level investigation: particular path types such as M and
$ {P}_R $
 can serve as flags that guide where session-level protocol analyses (Cash, Hicks, & Culley Reference Cash, Hicks and Culley2015a) or framing reviews (Kelly & Gero Reference Kelly and Gero2022) should be applied.
6.2. Team reasoning behind the low-creativity outcomes
The results show the two conditions hindering creativity and the reasons behind the path types.
A low frequency of M signals a breakdown in co-evolutionary design (Dorst & Cross Reference Dorst and Cross2001; Wiltschnig et al. Reference Wiltschnig, Christensen and Ball2013; Gero et al. Reference Gero, Kannengiesser and Crilly2022): one or both of the problem and the solution spaces show no substantive change across most phases. The absence of M suggests two possible reasons: either a biased focus on one space produced changes confined within the space, or activity was balanced across both spaces but affected neither problem framing nor solution ideas. Even among teams in which M occurred, however, the interview revealed why M arose differently in teams with low and high creativity. Lower-creativity teams mentioned challenges related to problem definition (P-Define), misalignment between problem and solution (P-S), and process management issues (Scope, Approach). This investment in problem-related activities aligns with findings that excessive time spent on problem formulation often undermines design outcomes (Christiaans & Dorst Reference Christiaans and Dorst1992; Atman et al. Reference Atman, Chimka, Bursic and Nachtmann1999). By contrast, higher-creativity teams referred to solution evaluation (S-Evaluation), aligning with the value of trial-and-error prototyping (Gerber & Carroll Reference Gerber and Carroll2012; Murphy et al. Reference Murphy, Floresca, Fu and Linsey2022).
Our findings extend prior evidence that problem-biased action reduces creativity, showing that this tendency holds even across multi-month design projects. However, the reasons and actions behind M varied substantially across teams, suggesting that frequent M is a necessary but not sufficient condition for high creativity. Whether activities were directed toward problem formulation or solution evaluation, and whether they substantively shifted either space, proved equally important in characterizing the quality of the iterative process.
Lower creativity was associated with multiple
$ {P}_R $
 paths, where the problem framing remains fixed across consecutive phases while solution ideas continue to change. This form of stagnation implies an entrenchment in problem framing, which may be a project-scale manifestation of design fixation. Design fixation, characterized by attachment to early representations that narrow exploration (Jansson & Smith Reference Jansson and Smith1991; Crilly Reference Crilly2015; Vasconcelos & Crilly Reference Vasconcelos and Crilly2016; Crilly & Cardoso Reference Crilly and Cardoso2017; Ezzat et al. Reference Ezzat, Agogué, Le Masson, Weil and Cassotti2020), has been associated with poorer design outcomes (Christiaans & Dorst Reference Christiaans and Dorst1992; Valkenburg & Dorst Reference Valkenburg and Dorst1998); our findings extend this insight to the project scale. The pattern is detectable from routine project documentation and carries a diagnostic signal. The interview reveals why teams accumulated
$ {P}_R $
paths, where the problem framing remains fixed across consecutive phases while solution ideas continue to change. This form of stagnation implies an entrenchment in problem framing, which may be a project-scale manifestation of design fixation. Design fixation, characterized by attachment to early representations that narrow exploration (Jansson & Smith Reference Jansson and Smith1991; Crilly Reference Crilly2015; Vasconcelos & Crilly Reference Vasconcelos and Crilly2016; Crilly & Cardoso Reference Crilly and Cardoso2017; Ezzat et al. Reference Ezzat, Agogué, Le Masson, Weil and Cassotti2020), has been associated with poorer design outcomes (Christiaans & Dorst Reference Christiaans and Dorst1992; Valkenburg & Dorst Reference Valkenburg and Dorst1998); our findings extend this insight to the project scale. The pattern is detectable from routine project documentation and carries a diagnostic signal. The interview reveals why teams accumulated
$ {P}_R $
 paths despite recognizing the need to change: several teams avoided problem reframing or additional user research, instead relying on revising or reusing existing solution ideas due to time constraints (Figure 11). This pattern resonates with decision traps identified in behavioral research, including sunk costs (Arkes & Blumer Reference Arkes and Blumer1985) and confirmation bias (Nickerson Reference Nickerson1998), and echo accounts of stuckness in design studios (Sachs Reference Sachs1999). By visualizing these retention patterns at the project scale, the proposed framework may help identify moments when such traps are taking hold, thereby bridging the gap between cognitive-level fixation research and project-level observation (Cash et al. Reference Cash, Hicks and Culley2015a; Cash et al. Reference Cash, Škec and Štorga2019).
The findings on M and
$ {P}_R $
 point to the absence of a change in problem framing as the core of creative stagnation, while the underlying processes differ. Even in the case M path exists, low creative outcomes stemmed from problem-related struggles rather than from solution evaluation. This problem-biased focus, even during mutual change, shows a failure to leverage the iterative interdependence between problem formulation and solution development effectively. In the case of
$ {P}_R $
point to the absence of a change in problem framing as the core of creative stagnation, while the underlying processes differ. Even in the case M path exists, low creative outcomes stemmed from problem-related struggles rather than from solution evaluation. This problem-biased focus, even during mutual change, shows a failure to leverage the iterative interdependence between problem formulation and solution development effectively. In the case of
$ {P}_R $
 , teams recognize the need to reframe yet cannot act on it, resulting in an entrenchment that persists despite continued changes in the solution space. The non-significant effect of
$ {S}_R $
, teams recognize the need to reframe yet cannot act on it, resulting in an entrenchment that persists despite continued changes in the solution space. The non-significant effect of
$ {S}_R $
 further clarifies that retaining solution ideas is not inherently detrimental, provided problem framing continues to evolve. Across both path types, the diagnostic value of the trajectory thus hinges on substantive revisions to problem framing, positioning it as a key indicator of productive iterative progress.
6.3. Implications for practice
The proposed framework can benefit design practice from two perspectives: as a diagnostic tool for educators or facilitators who support the teams, and as a self-assessment tool for teams themselves.
The framework helps educators or facilitators decide when and how to intervene even when they monitor multiple teams simultaneously (Nespoli, Hurst, & Gero Reference Nespoli, Hurst and Gero2021; Spruce, Moriarty, & Norcross Reference Spruce, Moriarty and Norcross2024). Teams’ trajectories showing a few M paths signal that a team’s iterative process has potentially stalled. Instructors can respond by offering stimuli to overcome fixation (Casakin & Goldschmidt Reference Casakin and Goldschmidt1999; Chan, Dow, & Schunn Reference Chan, Dow and Schunn2015), or by encouraging solution-oriented activities such as sketching and prototyping (Yang Reference Yang2005; Dow et al. Reference Dow, Glassco, Kass, Schwarz, Schwartz and Klemmer2012; Gerber & Carroll Reference Gerber and Carroll2012; Brun, Le Masson, & Weil Reference Brun, Le Masson and Weil2016; Camburn et al. Reference Camburn, Viswanathan, Linsey, Anderson, Jensen, Crawford, Otto and Wood2017; Murphy et al. Reference Murphy, Floresca, Fu and Linsey2022; Ma & Wei Reference Ma and Wei2025). Teams’ trajectories accumulating
$ {P}_R $
 paths signal entrenchment in a fixed problem framing. In such cases, interventions that create structured opportunities for reflection may be more appropriate than stimuli aimed at idea generation because the teams face difficulties in redirecting the design process rather than generating new concepts (Fleck & Fitzpatrick Reference Fleck and Fitzpatrick2010; Hartmann, Vinke-de Kruijf, & van Weesep Reference Hartmann, Vinke-de Kruijf and van Weesep2023; Ito et al. Reference Ito, Taoka, Wan, Sadek, Mougenot and Saito2024).
The proposed framework can also serve as a self-assessment tool for teams, as design teams are expected to reflect on their processes throughout iterative cycles to derive lessons for future action (Schön Reference Schön1987, Reference Schön1983; Hartmann et al. Reference Hartmann, Vinke-de Kruijf and van Weesep2023). The proposed framework enables structured, evidence-based self-reflection that strengthens metacognition (Ball & Christensen Reference Ball and Christensen2019; Carlson et al. Reference Carlson, Rees Lewis, Maliakal, Gerber and Easterday2020), unlike retrospective narrative diaries, which are often incomplete or produced too late to influence ongoing work (Reymen et al. Reference Reymen, Hammer, Kroes, van Aken, Dorst, Bax and Basten2006; Inkermann et al. Reference Inkermann, Gürtler and Seegrün2020; Ammersdörfer et al. Reference Ammersdörfer, Tartler, Kauffeld and Inkerman2022). By reviewing the visualized trajectory at each milestone, teams can objectively assess how their problem framings and solution ideas changed or failed to change. This assessment prompts reflection not only on what was produced but also on how and why proposals evolved or stagnated. Embedding trajectory review into existing reflection routines thus extends reflective-practice pedagogy (Schön Reference Schön1983; Valkenburg & Dorst Reference Valkenburg and Dorst1998).
6.4. Limitations and future research
This study has several limitations. First, our data derive from student teams in structured educational projects; external validity to professional teams under market and regulatory constraints remains to be tested. The data were collected from a single project held at a Japanese university, which may limit the generalizability of the findings and their applicability to other cultures (Taoka, Kagohashi, & Mougenot Reference Taoka, Kagohashi and Mougenot2021). We therefore conducted data collection over three years to ensure sample diversity; however, validation across various settings is essential to strengthen the findings. Second, due to differences in duration across the four iterations and between the midterm and final presentations, the analysis included two potentially distinct team dynamics. While teams that received GO repeated their proposals, teams with NOGO continuously explored a potential concept. Thus, the last period potentially differ from others by including several iterations. Third, for statistical comparison, the criteria for group division were not predetermined but determined after analyzing the data distributions. Although the findings require confirmation with independent data, they can be interpreted as hypothesis-generating, suggesting that a specific path type may serve as an early warning of stagnation. Fourth, the non-significant results for R and GO/NOGO warrant interpretation. For R paths, excluding the mid-to-final period, which is applied to avoid conflating teams that legitimately repeated their GO proposals with those that genuinely stagnated, may have reduced statistical power and obscured a real effect. For GO/NOGO, the absence of a significant relationship with final creativity scores suggests that mid-term faculty assessment does not straightforwardly predict final concept quality, and that trajectory patterns after the midpoint deserve further attention. Fifth, since the post-interview was conducted after the five-month project completion, there are concerns about the accuracy of the information. To ensure the accuracy of the content, we conducted interviews with multiple team members. Sixth, the assessment of transition types (Move/Retention/Reuse), which is based on concept-level classification rather than quantitative similarity thresholds, may be subject to evaluators’ judgment. In this study, we sought to ensure reliability by having two researchers conduct the coding. Given that our findings suggest the value of assessing changes/retentions in intermediate design outcomes, future work should develop a more rigorous evaluation framework, as has been the case for creativity evaluation of ideas. Seventh, relationships do not prove that increasing M or reducing
$ {P}_R $
 will raise creativity; unmeasured factors, such as team expertise, uncertainty perception, or organizational enablers, may moderate the effects (Stewart Reference Stewart2006; Kleinsmann et al. Reference Kleinsmann, Deken, Dong and Lauche2012; Cash & Kreye Reference Cash and Kreye2018). Thus, studies linking trajectories to those factors are required.
We outline complementary directions for future work: First, combining project-level trajectories with various analyses is recommended to characterize the activity signatures of each path type. The integration of insights from protocol analyses or project scale in existing studies with the proposed framework enables bridging the cross-scale gap that has been recognized as a challenge in design research (Cash et al. Reference Cash, Hicks and Culley2015a; Cash et al. Reference Cash, Škec and Štorga2019). For instance, recording team discussions at various stages of the project and conducting semantic analysis could provide insights into how particular transition patterns emerged (Sukhov et al. Reference Sukhov, Sihvonen, Netz, Magnusson and Olsson2021; Zhang Reference Zhang2024). In addition, linking the proposed framework to existing theories may further enrich the insights obtained. For example, C–K theory explains the design process as the creation of new concepts and knowledge through the interaction of the concept and knowledge spaces (Hatchuel & Weil Reference Hatchuel and Weil2003; Hatchuel et al. Reference Hatchuel, Masson and Weil2004; Nagel et al. Reference Nagel, Pittman, Pidaparti, Rose and Beverly2017; Boudier et al. Reference Boudier, Sukhov, Netz, Le Masson and Weil2023). The present framework may be interpreted in relation to this theory by replacing or associating problems and solutions with these spaces. For instance, M could be understood as an extension of the C-space, whereas
$ {P}_R $
 might be interpreted as stagnation in the K-space. In this way, by connecting the framework to other established theories – such as the FBS model (Gero & Kannengiesser Reference Gero and Kannengiesser2004), Linkography (Hatcher et al. Reference Hatcher, Ion, Maclachlan, Marlow, Simpson, Wilson and Wodehouse2018), the co-evolution model (Maher & Poon Reference Maher and Poon1996; Dorst & Cross Reference Dorst and Cross2001; Gero et al. Reference Gero, Kannengiesser and Crilly2022), or the ASE model (Asimow Reference Asimow1962; Watts Reference Watts1966; Martinec et al. Reference Martinec, Škec, Horvat and Štorga2019) – it may be possible to explore the relationship between transitions observed in intermediate design outcomes and micro-level phenomena.
Second, deepening research on problem framing is recommended. Problem framing is one of the key characteristics of the early stage of design, and it has been primarily studied through protocol analyses (Bijl-Brouwer Reference Bijl-Brouwer2019; Kelly & Gero Reference Kelly and Gero2022; Paton & Dorst Reference Paton and Dorst2011). The present findings suggest the retention of problem framing may hinder creativity in the early stages of design. A more detailed analysis focusing on how problem framings are formed and revised within iterative processes is expected to shed light on how such hindrances occur. By integrating this perspective with prior studies on processes such as empathy (Kouprie & Visser Reference Kouprie and Visser2009; Hess & Fila Reference Hess and Fila2016; Surma-aho & Hölttä-Otto Reference Surma-aho and Hölttä-Otto2022), and team problem framing (Dorst Reference Dorst2011; Yuan & Hsieh Reference Yuan and Hsieh2015; Suk & Lee Reference Suk and Lee2021), further advanced investigation can be pursued.
Finally, boundary conditions deserve attention: When is low M acceptable (e.g., when an initially strong frame exists)? Under what risk, uncertainty, and stakeholder-conflict profiles does
$ {P}_R $
 reasonably dominate? Mapping such conditions would refine the prescriptive use of our diagnostic, enabling educators and managers to target frame mobility where it matters most while avoiding unnecessary churn.
7. Conclusion
This paper aims to develop and apply a diagnostic framework for identifying stagnation in design thinking projects that involve iterative cycles. This study collected data from a five-month design thinking project, and analysis with the proposed framework revealed two significant findings: a lack of changes in both problem framings and solution ideas, and multiple retentions of problem framings were associated with low creativity. Interview analyses revealed that lower-performing teams were more likely to be biased toward problem-related actions, while higher-performing teams were distinguished by solution-oriented reasons and process-related actions. In addition, retention of problem framings occurred because of the inability to make drastic changes to their activities despite recognizing issues in their processes.
The contribution is twofold. First, the framework provides concrete, comparable evidence of the evolution of problem framings and solution ideas with minimal effort. Second, the framework offers early warnings and supports structured self-reflection, enabling educators and teams to recognize when strategic adjustments are necessary. Embedding trajectory visualization into routine reflection helps teams focus on how and why proposals change – not only on what was produced.
Acknowledgments
The authors would like to thank all participants who volunteered their time for this study.
Financial support
This work was supported by SECOM Science and Technology Foundation (Y.T.); the Sumitomo Electric Group Social Contribution Fund (Y.T.); the Tobe Maki Foundation (Y.T.); the Japan Science and Technology Agency, Support for Pioneering Research Initiated by the Next Generation (A.I., grant number JPMJSP2106); and the Amano Institute of Technology Graduate Scholarship (A.I.).
Declaration of generative AI and AI-assisted technologies in the writing process
During the preparation of this work, the authors used ChatGPT, Gemini, and Claude in order to improve grammatical accuracy, readability, and language editing. After using this tool, the authors reviewed and edited the content as needed and took full responsibility for the publication’s content.
Questions for semi-structured interview

Appendix A. Long description
The table begins with a bolded header reading Complete set of questions. The first row asks What did you do during this period between presentations. The next section contains a bulleted list with the following items in order: What kind of users did you encounter, What problems did you discover, How did you define those problems, What ideas did you generate, What prototypes did you create, Who did you test and how. The following rows, each as a single cell, ask What was the schedule for activities during that period and What happened as a result of each activity, What did your team discuss in response to those activities, What decisions did your team make to arrive at this proposal, What were the challenges you faced during this period, What feedback did you receive on this proposal during progress reports, What discussions did your team have in response to that feedback, and What decisions did you make for the next steps. All questions are presented in a single column, top to bottom, with no additional columns or data.
Classification of each transition and results of idea evaluation

Appendix B. Long description
The table has eight columns: Team, 1st to 2nd, 2nd to 3rd, 3rd to 4th, 4th to mid, mid to fin, mid eval., and Creativity score. The header row is followed by 31 team rows, numbered 1 to 31. For each team, the phase columns contain codes: M, R, S sub R, P sub R, GO, or NOGO. For example, Team 1: S sub R, M, M, R, R, GO, 6.33. Team 2: M, M, M, M, R, GO, 5.83. Team 4: M, M, M, S sub R, S sub R, GO, 4.83. Teams 7 to 31 show various combinations of M, R, S sub R, P sub R, GO, and NOGO. The last column lists creativity scores, ranging from 6.33 (Team 1) to 3.83 (Teams 30 and 31). Codes indicate phase outcomes: M for met, R for revised, S sub R for special review, P sub R for provisional review, GO for go, NOGO for no go.
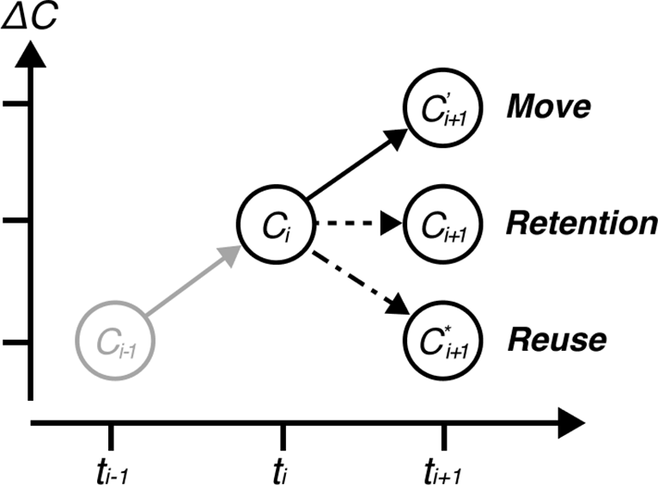
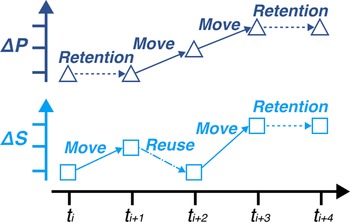
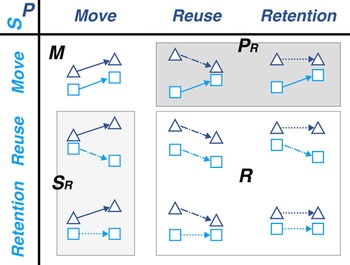

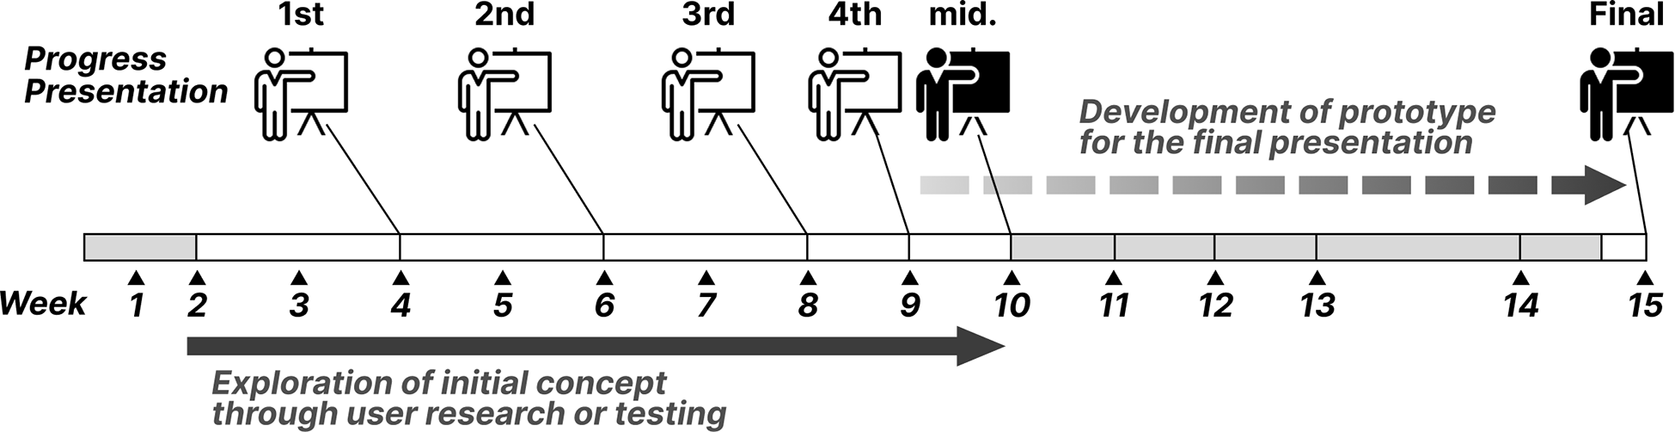

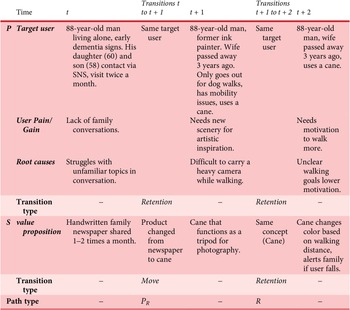

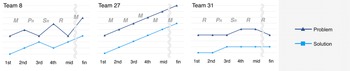
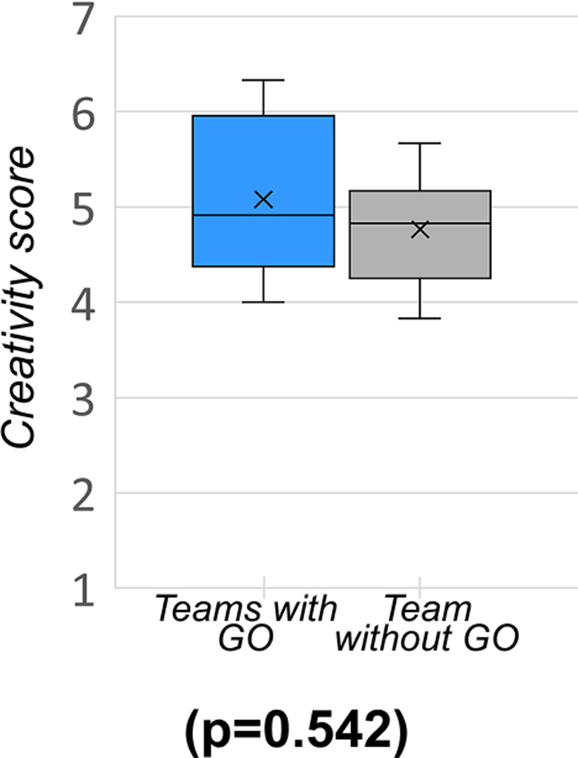
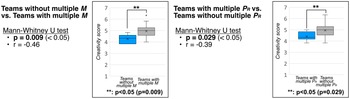


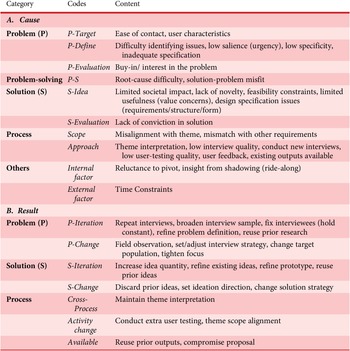


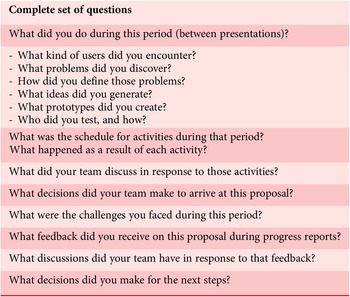


 Open access