

Phosphorus homeostasis in dairy cattle has received increased attention recently because of the possible association between hypophosphataemia and the downer cow syndrome as well as because of increasing concerns about the environmental impact of excessive amounts of P in manure(Reference El-Amrusi and Hofmann1, Reference Satter2). In an effort to reduce faecal P output, the National Research Council recently reduced dietary P recommendations for dairy cows, with the justification that a lower P intake does not interfere with fertility, milk yield or health of dairy cattle(Reference Wu and Satter3). Nonetheless, with continuously increasing productivity of the modern dairy cow, P requirements concomitantly increase, thereby presenting a growing challenge for the regulation of P homeostasis, particularly at the onset of lactation when cows suddenly change from a period of low P requirements to a phase of high P requirements while feed intake is at its nadir(Reference Grünberg4).
Hypophosphataemia is commonly observed in early lactating cows with a number of periparturient diseases such as milk fever, abomasal disorders or fatty liver(Reference Grünberg4–Reference Grünberg, Staufenbiel and Constable6). Although hypophosphataemia is considered to be a consequence rather than the cause of these conditions, treatment of hypophosphataemia is nonetheless recommended in the literature because P depletion is associated with anorexia, which may aggravate the clinical presentation of a sick animal and hamper or delay recovery from disease(Reference Grünberg4, Reference Milton and Ternouth7). Treatment of hypophosphataemia in ruminants consists of either oral or parenteral administration of phosphate salts. Whereas sodium phosphate salts are most commonly used for either oral or intravenous treatment in cattle, calcium phosphate salts have also been proposed for oral treatment in periparturient dairy cows because hypophosphataemia in these animals is frequently associated with hypocalcaemia(Reference Grünberg4).
Controversy exists over the most appropriate therapeutic approach for hypophosphataemia in dairy cattle. Whereas some authors deem oral treatment of hypophosphataemia unsuitable because of a minimal effect and a time delay of several hours between oral treatment and increase of plasma inorganic P (Pi) concentration, other studies report marked peaks in plasma Pi concentration within 1–2 h of oral treatment(Reference Cheng, Goff and Horst8–Reference Horner and Staufenbiel10). Debate also exists over the role of the reticulorumen as a site of Pi absorption and of the reticular groove reflex in adult cattle(Reference Yano, Yano and Breves11, Reference Carruthers, Phipps and Bakker12). Although the permeability of the rumen mucosa for Pi is well documented, the importance of the reticulorumen as a site for Pi absorption has been questioned, as only insignificant amounts of Pi appear to cross the rumen wall(Reference Yano, Yano and Breves11). The effect of oral administration of phosphate salts on the reticular groove reflex has received little attention in the past although a functioning groove reflex would have the potential to markedly improve phosphate absorption kinetics and could thus explain plasma Pi concentration peaks occurring shortly after treatment. Although results are inconsistent, Na salts such as NaHCO3 or NaCl have been reported to be able to trigger the reticular groove reflex at least incidentally. The effect of sodium phosphate on the reticular groove to our knowledge has not yet been studied(Reference Carruthers, Phipps and Bakker12).
The objective of the present study was therefore to study the absorption kinetics of Pi after enteral administration of different phosphate salts, focusing on Pi absorption from the reticulorumen and the role of the reticular groove reflex. It was hypothesised that transruminal Pi absorption in adult cattle would be quantitatively negligible and that the reticular groove reflex would not consistently be triggered by oral administration of sodium phosphate salt solutions.
Materials and methods
Animals, housing, and feeding
The national and institutional guidelines for the care and use of experimental animals were followed and all experimental procedures were approved by the Utrecht University Institutional Animal Care and Use Committee (DEC; permit no 2011.III.08.087).
A total of six healthy lactating and non-pregnant Holstein–Friesian cows fitted with permanent rumen cannulas were used for this experiment. Cows included in the present study were aged between 3 and 4·5 years and weighed between 526 and 658 kg. Mean milk production over 305 d of the first lactation was 6950 (sd 842) kg. All cows were between 50 and 150 days in milk of their second or third lactation and were healthy on the basis of physical examination. Animals were housed in individual tie stalls bedded with rubber mats covered with sawdust in a temperature-controlled environment. Feed was offered twice daily between 06.00 and 07.00 hours and between 18.00 and 19.00 hours as total mixed ration (TMR) based on maize silage, grass silage, soyabean meal, beet pulp, perennial ryegrass seed straw and urea formulated to meet the requirements of lactating dairy cows based on the recommendations of the National Research Council (NRC) with the exception of P content (Table 1)(13). The P content of the ration DM was slightly below NRC recommendations (3·2–4·2 g P/kg DM for lactating dairy cows) in order to induce mild hypophosphataemia in the studied animals(13). Cows enrolled in the present study were allowed to adjust to this diet for 7 d before the first experimental treatment was administered. To minimise day-by-day variation in feed composition the TMR for the entire trial period was mixed on the same day in two batches. The feed was then packed in plastic bins and stored at − 24°C until fed. Cows were milked twice daily between 06.00 and 07.00 hours and between 18.00 and 19.00 hours.
Ingredients and composition of the total mixed ration (TMR) fed during the acclimatisation and experimental phases
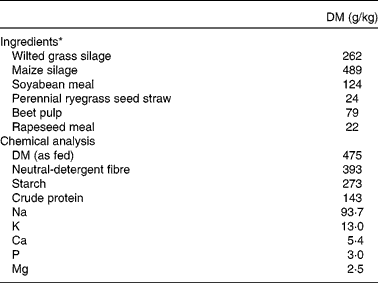
* Urea (10 g/cow per feeding) was manually mixed into the TMR at the time of feeding.
Experimental study
All cows underwent five treatments in randomised order consisting of administration of a test solution containing either 302 g NaH2PO4 dihydrate or 333 g CaHPO4 dihydrate dispersed in 2 litres of deionised water at approximately 38°C. These amounts of NaH2PO4 dihydrate and CaHPO4 dihydrate contain approximately 60 g of Pi, equivalent to the amount of Pi recommended in the current literature for oral Pi supplementation in dairy cattle(Reference Cheng, Goff and Horst8, Reference Constable14). Test solutions were either administered orally, into the ventral rumen sac or into the abomasum with a washout period of 48 h between treatments. Administration into the ventral rumen sac was achieved by inserting a large-bore silicone tube through the rumen cannula into the ventral rumen sac. The test solution was then infused within 1 min while the tip of the tube was manually kept in place. The silicone tube was then removed without further stirring the rumen content. For intra-abomasal infusion a large-bore silicone tube was passed from the rumen cannula through the reticulo-omasal and omaso-abomasal orifice into the abomasum. The correct position of the tip of the tube was confirmed by manually feeling the smooth abomasal mucosa while holding the tube in place. Deionised water (500 ml) was first passed through the tube and the absence of back-flow of fluid at the height of the omaso-abomasal orifice was determined manually, confirming proper flow into the abomasum. The test solution was then infused within 1 min while manually maintaining the tip of the tube in the abomasum and paying attention to turbulences at the height of the omaso-abomasal orifice that would be suggestive of back-flow of part of the test solution into the forestomach system. For oral administration a drench gun commonly used in cattle practice was inserted into the buccal cavity repeatedly and 250 ml of the test solution was administered at a time. No attempt was made to quantify the volume of test solution that was spilled during oral administration. The treatment groups were: (a) CaRu (CaHPO4 administered into the ventral rumen sac); (b) CaAbo (CaHPO4 administered into the abomasum); (c) NaRu (NaH2PO4 administered into the ventral rumen sac); (d) NaAbo (NaH2PO4 administered into the abomasum); and (e) NaOr (NaH2PO4 administered orally).
Acetaminophen (AP; N-acetyl-4-aminophenol) was added to each test solution at a dose of 50 mg/kg body weight. When administered orally AP is absorbed from the small intestines with the rate-limiting step for absorption being the rate of gastric emptying in animals with normal small-intestinal function(Reference Clements, Heading and Nimmo15). In the present study AP was used to confirm proper administration of the test solution into the abomasum and to determine the role of the reticular groove when administering NaH2PO4 orally. These objectives were achieved by comparing the plasma AP concentration curve after oral administration with the concentration curve after intraruminal infusion ( = no closure of the reticular groove) and intra-abomasal infusion of the test solution ( = complete closure of the reticular groove). Comparison of the plasma AP and Pi concentration–time curve was used as a crude parameter to assess the degree of transruminal Pi absorption after intraruminal administration of NaH2PO4 or CaHPO4.
A 16-gauge catheter (Angiocath; Becton-Dickinson) was aseptically fitted into a jugular vein at least 12 h before the first treatment to which an extension set (Discofix C-3, 10 cm; Braun Melsungen AG) was attached for blood collection. Cows were weighed using a calibrated digital large-animal scale in the evening before the first treatment. The determined weight was used to calculate the amount of AP to be added to each test solution.
Treatments were administered on the trial days between 09.00 and 09.30 hours and at least 2 h after feeding. Blood samples were obtained from the jugular catheter immediately before treatment as well as at 15, 30, 45, 60, 75, 90, 105, 120, 150, 180, 210, 240, 300, 420, 480, 720 and 1440 min after each treatment. At each sampling time, the catheter was flushed with 3 ml of heparinised saline (40 IU of sodium heparin per ml of 0·9 % NaCl) and 5 ml of blood were withdrawn through the catheter. A quantity of 10 ml blood was then aspirated into a separate syringe and immediately transferred to a 10 ml tube containing lithium heparin as anticoagulant. Blood was kept at room temperature and centrifuged within 30 min of collection at 1500 g for 15 min at room temperature. Harvested plasma was stored at − 24°C until analysed.
In the morning of each study day rumen cannula lids were replaced by specially prepared lids through which a small-bore silicone tube was passed into the ventral rumen sac for rumen fluid collection. The intraruminal tip of the tube was attached to a cage magnet, serving as weight that was placed in the ventral rumen sac. Rumen fluid was collected using a 100 ml syringe that was connected to the silicone tube immediately before treatment as well as at 15, 60, 120, 180, 240, 480, 720 and 1440 min after each treatment. Before rumen fluid collection tubing was cleared from remaining fluid by injecting 100 ml of air before aspirating approximately 50 ml of rumen fluid. The silicone tube was clamped off after rumen fluid collection. Collected fluid was then transferred into a 10 ml plastic tube and centrifuged within 30 min at 1500 g for 15 min. A sample of the supernatant fraction was harvested and stored at − 24°C until analysed.
Biochemical analysis
Plasma concentrations of inorganic phosphate (Pi, ammonium molybdate) and acetaminophen (AP, turbidimetric inhibition immunoassay) were determined spectrophotometrically, total Ca concentration was determined by indirect potentiometry (ion selective electrodes) using an automated analyser (DXC-600, Beckman Coulter Inc.). Total protein concentration was determined by refractometry using a temperature-controlled refractometer.
Rumen fluid was analysed for concentrations of Ca and Pi as described for plasma using appropriate dilutions.
Data analysis
For each treatment the maximal plasma Pi concentration (CPmax) and the time to maximal plasma Pi concentration (TPmax) were obtained from a plot of the plasma Pi concentration–time data. Furthermore, the increment in plasma Pi concentration relative to T0 (CPDiff) was calculated by subtracting the baseline Pi concentration from the Pi concentration measured at each time point and the maximal increment of plasma Pi concentration (CPmaxDiff) was calculated by subtracting the baseline Pi concentration from CPmax. The areas under the plasma Pi concentration increment–time curves for the first 120 min (AUCPDiff120) and 240 min (AUCPDiff240) after treatment were calculated using the trapezoidal rule.
To characterise the plasma AP absorption curve the maximal AP concentration (CAPmax) and the time to maximal AP concentration (TAPmax) were derived from a plot of the plasma AP concentration–time data. The areas under the plasma AP concentration–time curves for the first 60 min (AUCAP60) and 120 min (AUCAP120) after treatment were calculated as described above.
Statistical analysis
Data are expressed as mean values with their standard errors or as medians and interquartile ranges for data that were not normally distributed. P< 0·05 was considered to be significant. Values were log transformed when necessary to achieve a normal distribution. Repeated-measures ANOVA was used to detect differences in measured parameters between treatment groups and over time using an autoregressive (AR(1)) covariance matrix with animal ID as the repeated variable (PROC MIXED, SAS 9.2; SAS Institute, Inc.). Terms in the model used were treatment, time and the interaction of treatment and time. Post hoc tests were conducted to compare treatment, time and treatment–time interaction effects. Bonferroni-corrected P values were used to assess differences within and between treatment groups (within group compared with time = 0; between groups at the same time). A statistical software package was used for all analyses (SAS 9.2; SAS Institute, Inc.).
Results
All cows enrolled in the present study completed the entire trial receiving all experimental treatments. Back-flow of fluid at the height of the omaso-abomasal orifice was noticed while infusing the test solution (CaAbo) into the abomasum of one cow. Analysis of plasma AP concentration–time curve as well as determination of CAPmax for this specific treatment confirmed that the test solution was not entirely administered into the abomasum. Data obtained from this treatment were therefore excluded from data analysis.
The mean baseline plasma Pi concentration at the end of the adaptation period immediately before the first treatment was 1·12 (sem 0·16) mmol/l. On the second, third, fourth and fifth study days baseline plasma Pi concentrations were 1·23 (sem 0·11), 1·12 (sem 0·12), 1·36 (sem 0·10) and 1·23 (sem 0·11) mmol/l. The baseline values did not differ significantly between treatment days.
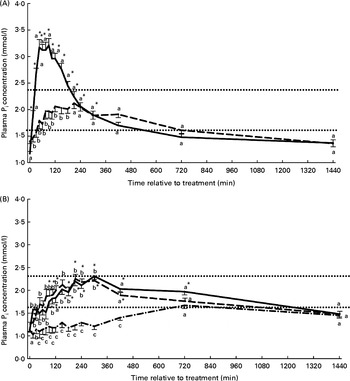
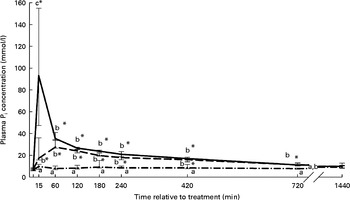
The plasma Pi concentration–time curves stratified by treatment are presented in Figs. 1(A) and (B). The mean or median values for CPmax, CPmaxDiff, TPmax as well as AUCPDiff120 and AUCPDiff240 are summarised in Table 2. Significant treatment, time and treatment–time effects were identified for plasma Pi concentration, CPmax and CPmaxDiff but not for TPmax (Table 2, Figs. 1(A) and (B)). Plasma Pi concentration differed between groups with the exception of the NaRu, NaOr and CaAbo groups. The highest, most rapid but also the most short-lived increases in plasma Pi concentration were determined in the NaAbo group (Fig. 1(A), Table 2). In the CaAbo group similar values for CPmax and CPmaxDiff were determined to those in the NaRu and NaOr groups (Table 2). Non-significant, delayed increases in plasma Pi concentration were observed in the CaRu group (Fig. 1(B)) and CPmaxDiff was lower in the CaRu group compared with the NaAbo and NaRu groups. The NaOr and NaRu groups showed very similar plasma Pi concentration–time curves with significant increases in plasma Pi concentration from 90 to 720 and from 120 to 340 min, respectively (Fig. 1(B)). The AUCPDiff120 differed significantly between all groups with the exception of the NaRu and NaOr groups. The AUCPDiff120 in these groups was lower than in the NaAbo group but higher than in the CaRu and CaAbo groups (Table 2). Plasma Pi concentrations above the reference range for dairy cattle were only found in the NaAbo group.
Plasma phosphate concentration according to treatment and relative to baseline (T0) in the NaH2PO4 administered into the abomasum (NaAbo; ![]() ; A), CaHPO4 administered into the abomasum (CaAbo;
; A), CaHPO4 administered into the abomasum (CaAbo; ![]() ; A), NaH2PO4 administered into the ventral rumen sac (NaRu;
; A), NaH2PO4 administered into the ventral rumen sac (NaRu; ![]() ; B), NaH2PO4 administered orally (NaOr;
; B), NaH2PO4 administered orally (NaOr; ![]() ; B) and CaHPO4 administered into the ventral rumen sac (CaRu;
; B) and CaHPO4 administered into the ventral rumen sac (CaRu; ![]() ; B) groups.
; B) groups. ![]() , Upper and lower limits of the reference range for plasma inorganic phosphorus (Pi) concentration in dairy cattle. Values are means, with their standard errors represented by vertical bars. * Mean value was significantly different from that at T0 (P< 0·05, Bonferroni corrected). a,b,c Mean values with unlike letters were significantly different between groups (P< 0·05).
, Upper and lower limits of the reference range for plasma inorganic phosphorus (Pi) concentration in dairy cattle. Values are means, with their standard errors represented by vertical bars. * Mean value was significantly different from that at T0 (P< 0·05, Bonferroni corrected). a,b,c Mean values with unlike letters were significantly different between groups (P< 0·05).
Maximal plasma acetaminophen concentration (CAPmax), time to maximal plasma acetaminophen concentration (TAPmax), areas under the plasma acetaminophen concentration–time curves for the first 60 min (AUCAP60) and 120 min (AUCAP120) after treatment stratified by treatment group, maximal plasma phosphate concentration (CPmax), maximal plasma phosphate concentration increment (CPmaxDiff), time to maximal plasma phosphate concentration (TPmax), and areas under the plasma phosphate concentration increment–time curves for the first 120 min (AUCPDiff120) 240 min (AUCPDiff240), 420 min (AUCPDiff420) and 720 min (AUCPDiff720) after treatment stratified by treatment group (Mean values with their pooled standard errors of all groups or medians and interquartile ranges (IQR))
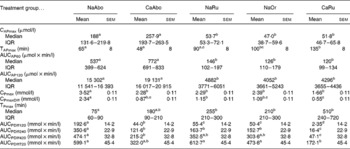
NaAbo, NaH2PO4 administered into the abomasum; CaAbo, CaHPO4 administered into the abomasum; NaRu, NaH2PO4 administered into the ventral rumen sac; NaOr, NaH2PO4 administered orally; CaRu, CaHPO4 administered into the ventral rumen sac.
a,b,c,d Values within a row with unlike superscript letters were significantly different (P< 0·05, Bonferroni corrected).
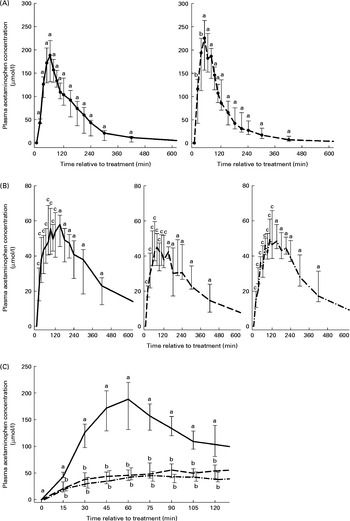
The CAPmax, TAPmax, AUCAP60 and AUCAP120 characterising the AP absorption kinetics are summarised in Table 2. The plasma AP concentration–time curves are presented in Figs. 2(A) and (B). Significant treatment, time and treatment–time effects on plasma AP concentration were identified. Peak plasma AP concentration was significantly higher after intra-abomasal than after intraruminal treatment. A faster increase in plasma AP concentration was observed in the CaAbo group compared with the NaAbo group, with a significantly higher plasma AP concentration 15 min after treatment in the former group (Fig. 2(A)). No difference in AP absorption was observed between the two intraruminal treatments. Oral treatment resulted in lower AP concentration compared with both intra-abomasal treatments but similar AP concentration as measured after both intraruminal treatments (Figs. 2(A) and (B)). Accordingly, CAPmax was the highest for the CaAbo and NaAbo groups, with values in the NaAbo group ranging approximately one-third below peak values determined in the CaAbo group (Fig. 2(A), Table 2). The AUCAP60 and AUCAP120 were higher after intra-abomasal treatment with either phosphate salt when compared with intraruminal or oral treatment with either salt but did not differ between the CaRu, NaRu and NaOr groups. The CAPmax and AUCAP120 in the NaOr group ranged barely 10 % below values measured in the NaRu group (Table 2). The slope and amplitude of the plasma AP concentration–time curve were identical in the NaRu and NaOr groups for the first 120 min (Fig. 2(C)).
Plasma acetaminophen concentration according to treatment and relative to baseline (T0) in the NaH2PO4 administered into the abomasum (NaAbo; ![]() ; A, left panel), CaHPO4 administered into the abomasum (CaAbo;
; A, left panel), CaHPO4 administered into the abomasum (CaAbo; ![]() ; A, right panel), NaH2PO4 administered into the ventral rumen sac (NaRu;
; A, right panel), NaH2PO4 administered into the ventral rumen sac (NaRu; ![]() ; B, left panel), NaH2PO4 administered orally (NaOr;
; B, left panel), NaH2PO4 administered orally (NaOr; ![]() ; B, middle panel) and CaHPO4 administered into the ventral rumen sac (CaRu;
; B, middle panel) and CaHPO4 administered into the ventral rumen sac (CaRu; ![]() ; B, right panel) groups. Values are medians, with interquartile ranges represented by vertical bars. a,b,cMedian values with unlike letters were significantly different between groups (P< 0·05). (C) Detailed view of plasma acetaminophen concentration–time curves for the time period 0–120 min for the NaAbo (
; B, right panel) groups. Values are medians, with interquartile ranges represented by vertical bars. a,b,cMedian values with unlike letters were significantly different between groups (P< 0·05). (C) Detailed view of plasma acetaminophen concentration–time curves for the time period 0–120 min for the NaAbo (![]() ), NaRu (
), NaRu (![]() ) and NaOr (
) and NaOr (![]() ) groups. Values are medians, with interquartile ranges represented by vertical bars. a,bMedian values with unlike letters were significantly different between groups (P< 0·05). Data of NaOr are slightly offset with respect to time to improve readability.
) groups. Values are medians, with interquartile ranges represented by vertical bars. a,bMedian values with unlike letters were significantly different between groups (P< 0·05). Data of NaOr are slightly offset with respect to time to improve readability.
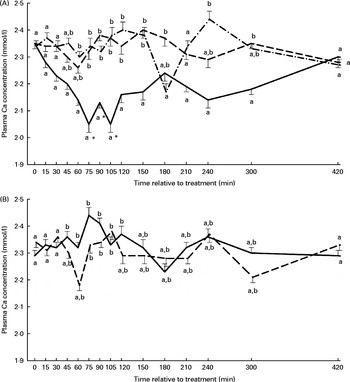
The plasma Ca concentration–time curves stratified by treatment are presented in Figs. 3(A) and (B). Treatment and time effects on plasma Ca concentration were significant, with the NaAbo group differing from all other groups, but with no differences between the remaining groups. Plasma Ca concentration in the NaAbo group was found to be significantly lower compared with baseline values from 75 to 105 min after treatment (Fig. 3(A)).
Plasma calcium concentration according to treatment and relative to baseline (T0) in the NaH2PO4 administered into the abomasum (NaAbo; ![]() ; A), NaH2PO4 administered into the ventral rumen sac (NaRu;
; A), NaH2PO4 administered into the ventral rumen sac (NaRu; ![]() ; A), NaH2PO4 administered orally (NaOr;
; A), NaH2PO4 administered orally (NaOr; ![]() ; A), CaHPO4 administered into the abomasum (CaAbo;
; A), CaHPO4 administered into the abomasum (CaAbo; ![]() ; B) and CaHPO4 administered into the ventral rumen sac (CaRu;
; B) and CaHPO4 administered into the ventral rumen sac (CaRu; ![]() ; B) groups. Values are means, with their standard errors represented by vertical bars. * Mean value was significantly different from that at T0 (P< 0·05, Bonferroni corrected). a,bMean values with unlike letters were significantly different between groups (P< 0·05).
; B) groups. Values are means, with their standard errors represented by vertical bars. * Mean value was significantly different from that at T0 (P< 0·05, Bonferroni corrected). a,bMean values with unlike letters were significantly different between groups (P< 0·05).
Rumen Pi concentration–time curves, stratified by treatment for groups having received phosphate salts either orally or into the rumen, are presented in Fig. 4. Treatment, time and treatment–time effects on the rumen Pi concentration were significant. Rumen Pi concentration was significantly increased relative to baseline values from 15 to 420 min and from 15 to 720 min post-treatment in the NaOr and NaRu groups, respectively. The CaRu, CaAbo and NaAbo treatments did not alter rumen Pi concentration. Peak Pi concentration in rumen fluid was significantly higher in the NaRu group (84·8 (sem 24·4) mmol/l) compared with the NaOr group (30·8 (sem 3·6) mmol/l).
Rumen phosphate (Pi) concentration according to treatment and relative to baseline (T0) in the NaH2PO4 administered into the ventral rumen sac (NaRu; ![]() ), NaH2PO4 administered orally (NaOr;
), NaH2PO4 administered orally (NaOr; ![]() ) and NaH2PO4 administered into the abomasum (NaAbo;
) and NaH2PO4 administered into the abomasum (NaAbo; ![]() ) groups. Values are medians, with interquartile ranges represented by vertical bars. * Median value was significantly different from that at T0 (P< 0·05, Bonferroni corrected). a,b,cMedian values with unlike letters were significantly different between groups (P< 0·05).
) groups. Values are medians, with interquartile ranges represented by vertical bars. * Median value was significantly different from that at T0 (P< 0·05, Bonferroni corrected). a,b,cMedian values with unlike letters were significantly different between groups (P< 0·05).
Rumen Ca concentration–time curves are presented in Fig. 5. A significant decline in rumen Ca concentration by over 50 % was observed in the NaRu group within 15 min of treatment. A numerical decline in rumen Ca concentration observed in the NaOr group with a nadir 15 min after treatment was not significant (Fig. 5).
Rumen calcium concentration according to treatment and relative to baseline (T0) in the NaH2PO4 administered into the ventral rumen sac (NaRu; ![]() ; A), NaH2PO4 administered orally (NaOr;
; A), NaH2PO4 administered orally (NaOr; ![]() , A), NaH2PO4 administered into the abomasum (NaAbo;
, A), NaH2PO4 administered into the abomasum (NaAbo; ![]() ; A), CaHPO4 administered into the abomasum (CaAbo;
; A), CaHPO4 administered into the abomasum (CaAbo; ![]() ; B) and CaHPO4 administered into the ventral rumen sac (CaRu;
; B) and CaHPO4 administered into the ventral rumen sac (CaRu; ![]() ; B) groups. Values are means, with their standard errors represented by vertical bars. * Mean value was significantly different from that at T0 (P< 0·05, Bonferroni corrected). a,bMean values with unlike letters were significantly different between groups (P< 0·05).
; B) groups. Values are means, with their standard errors represented by vertical bars. * Mean value was significantly different from that at T0 (P< 0·05, Bonferroni corrected). a,bMean values with unlike letters were significantly different between groups (P< 0·05).
Discussion
The main objective of the study presented here was to study the absorption kinetics of phosphate after enteral administration of either NaH2PO4 or CaHPO4 from the bovine gastrointestinal tract and to evaluate the biological relevance of phosphate absorption from the bovine reticulorumen. Furthermore, it was intended to explore the role of the reticular groove reflex in phosphate absorption kinetics after oral administration of NaH2PO4. For this purpose a mildly P-deficient ration, containing 3·1 g Pi/kg DM was fed for 1 week before starting experimental treatments to induce P depletion in study animals. Mean baseline plasma Pi concentrations obtained in the morning of each treatment day were below the reference for plasma Pi concentration in cattle (1·4–2·3 mmol/l), suggesting that dietary Pi content as well as the length of the acclimatisation period were sufficient to mildly deplete the cows of Pi in the study.
An important finding of the present study was that approximately 300 g NaH2PO4 rapidly increased plasma Pi concentration in mildly phosphate depleted, but otherwise healthy, lactating dairy cows for at least 7 h. This finding is in line with studies that monitored plasma Pi concentration in healthy as well as hypocalcaemic cows after administrations of sodium phosphate via orogastric tube, where peak Pi concentration were not measured earlier than 4 h post-treatment(Reference Braun, Dumelin and Liesegang9, Reference Braun, Bryce and Liesegang16), but differs markedly from another study reporting peak plasma Pi concentration within 1 h of oral treatment with NaH2PO4(Reference Cheng, Goff and Horst8).
Other studies reported no, or only very mild, effects on plasma Pi concentration after oral administration of Na2HPO4 solutions but were either conducted on cows that were not P deficient and fed a ration with an adequate dietary P supply during the experiment or were treated with extremely low doses of Na2HPO4 (20 mg/kg)(Reference Horner and Staufenbiel10, Reference Jagadeeswaran and Jagadishkumar17). Part of the discrepancy between the results presented in the present and other studies is likely to have resulted from the use of different sodium phosphate salts with different solubility and bioavailability. The considerably higher solubility of NaH2PO4 (869 g/l water at 20°C) when compared with Na2HPO4 (77 g/l water at 20°C) is likely to result in faster passage through the bovine forestomach system and increased bioavailability.
Assuming a turnover rate of 10 % of the liquid phase of the rumen content per h, and an abomasal emptying rate of approximately 1 h in lactating dairy cows, a peak plasma Pi concentration within 1 h after oral treatment with a solution containing NaH2PO4 is plausible only if the liquid either bypasses the reticulorumen, as this occurs with closure of the reticular groove, or by transruminal Pi absorption in biologically relevant quantities(Reference Hartnell and Satter18, Reference Wittek, Schreiber and Fürll19). In the present study direct administration of a NaH2PO4 solution into the abomasum, mimicking complete closure of the reticular groove, led to peak plasma Pi concentration within approximately 1 h, but plasma Pi peaks were of considerably higher amplitude and of shorter duration when compared with the results of Cheng et al. (Reference Cheng, Goff and Horst8) after oral drenching. Lower and more sustained peaks after oral drenching, as described by those authors, would be conceivable with partial closure of the reticular groove allowing a fraction of the test solution to bypass the reticulorumen with the remainder subsequently entering the small-intestinal tract after some delay having transited through the forestomach system. The AP concentration–time curve after intra-abomasal infusion revealed an abomasal emptying time of 50–60 min in the present study, which is in agreement with previously reported results(Reference Wittek, Schreiber and Fürll19, Reference Ehsani-Kheradgerdi, Sharifi and Mohri20). In the present study we attempted to mimic complete closure of the reticular groove reflex by directly infusing a test solution into the abomasum. By bypassing the oral route this approach circumvents the stimulation of gastric relaxation and gastric accommodation, two reflexes triggered by the passage of food through the oesophagus, thereby causing relaxation of the stomach wall(Reference Olsson and Holgren21). With hampered gastric accommodation, direct infusion of 2 litres of fluid into the abomasum is likely to have resulted in a marked increase in abomasal luminal pressure, potentially forcing fluid from the abomasum into the duodenum(Reference Marshall, Constable and Crochick22). It is therefore probable that slopes of the plasma concentration–time curves for AP and Pi determined after intra-abomasal infusion of the test solutions in the present study are steeper than what would be observed in healthy animals orally ingesting the same test solution with complete closure of the reticular groove.
Slope and amplitude of the AP concentration–time curve after oral administration of the test solution in the first 2 h after treatment were identical to the curve obtained after intraruminal treatment, but differed markedly from the curve obtained after intra-abomasal infusion (Fig. 2(C)). This result shows that AP absorption kinetics was the same after oral and intraruminal treatment and thus that only very little, if any, of the test solution can have bypassed the reticulorumen after oral treatment in the present experiment.
Considering the previously mentioned turnover rate of the rumen liquid phase in lactating dairy cows of approximately 10 % per h, and the fact that a certain but varying amount of orally ingested fluid always bypasses the rumen, a peak plasma Pi concentration 4 h after oral treatment is conceivable without involvement of the reticular groove reflex and with no or minimal Pi absorption from the reticulorumen(Reference Hartnell and Satter18, Reference Woodford, Murphy and Davis23). An important clinical implication of these results is that the efficacy of oral phosphate supplementation at the dose and concentration used in the present study relies strongly on adequate rumen motility. With no or only minimal absorption of phosphate from the forestomach system, delayed rumen motility and thus delayed oroduodenal transit time are likely to hamper the efficacy of oral phosphate supplementation.
Several studies have reported that oral administration of solutions containing Na salts, such as NaCl or NaHCO3, were potentially able to trigger the reticular groove reflex in growing cattle up to 2 years of age(Reference Wester24, Reference Reik25). In older cattle the effects of Na and other salts on the reticular groove appear to be inconsistent and to wane with age, but NaHCO3 solutions (5·9 mol/l) were found to at least partially bypass the reticulorumen in the majority of treated animals(Reference Carruthers, Phipps and Bakker12). Furthermore, clinical studies investigating the caustic effect of Ca salts used for oral Ca supplementation have suggested that calcium chloride may also at least incidentally trigger closure of the reticular groove even in older cows(Reference Braun, Bryce and Liesegang16, Reference Wentink and van den Ingh26). In the present study cows were drenched with 2 litres of a 1 m-NaH2PO4 solution whereas Cheng et al. (Reference Cheng, Goff and Horst8) used 0·5 litres of a 3 m-NaH2PO4 solution. Since osmolarity and taste of the solution administered into the bovine buccal cavity were among the possible factors contributing to closure of the reticular groove it is conceivable that at least part of the discrepancy between the present results and other studies is caused by this methodological difference(Reference Titchen and Newhook27).
Comparison of the slope of the concentration–time curves as well as the time to reach maximal plasma concentrations for AP and Pi indicate that gastrointestinal absorption of Pi is slower than AP absorption. Assuming that AP occurs predominantly in the proximal duodenum and that AP absorption from the forestomach system is near nil it can be concluded that phosphate absorption from the reticulorumen does not occur in biologically relevant quantities as this would have resulted in a steeper slope and earlier peak plasma Pi concentration after intraruminal administration of the test solution compared with AP. The permeability of the mucosa of the reticulorumen for Pi has been demonstrated in several studies(Reference Breves, Gäbel and Martens28–Reference Beardsworth, Beardsworth and Care30). Nonetheless the physiological relevance of the reticulorumen as a site for Pi absorption has been questioned, as only insignificant amounts of Pi appear to cross the rumen wall(Reference Yano, Yano and Breves11). However, in vivo transruminal phosphate absorption has not been conclusively quantified.
As previously reported in the literature dicalcium phosphate (CaHPO4) proved to be less effective than sodium phosphate salts to supplement Pi orally in cattle(Reference Cheng, Goff and Horst8). With a maximal solubility of 0·2 g/l water at 25°C dicalcium phosphate is practically insoluble in water, explaining the nearly unchanged rumen Ca concentration and Pi concentration after intraruminal administration of CaHPO4 measured in the present study. Sedimentation of the undissolved salt in the rumen is likely to explain the time delay and weak effect of this salt on the plasma Pi concentration in treated cows. Administration of CaHPO4 directly into the abomasum, the compartment of the ruminant gastrointestinal tract with the highest acidity improved bioavailability of Pi originating from CaHPO4 which nonetheless remained considerably lower than from Pi substituted as NaHPO4. Improved bioavailability of CaHPO4 after intra-abomasal infusion when compared with intraruminal administration could be due to better solubility in acidic solution or just to the shorter oroduodenal transit time. Dicalcium phosphate that is frequently used in dairy cattle, presumably because it combines the administration of Pi with Ca, showed no measurable effects on either rumen or plasma Ca concentration.
The increase in plasma AP concentration was slower and the peak plasma AP concentration after intra-abomasal administration of NaH2PO4 was lower compared with peaks measured after administration of CaHPO4 solution of the same molarity directly into the abomasum. It is probable that this effect is due to the different solubility characteristics of the compounds used and the ensuing large difference in osmolarity of both test solutions. The abomasal emptying rate is strongly influenced by the osmolarity of the abomasal content(Reference Marshall, Constable and Crochick22). Assuming a solubility for NaH2PO4 of 869 g/l in water (20°C) v. 0·2 g/l in water (20°C) for CaHPO4, a theoretical osmolarity for the test solution containing NaH2PO4 of approximately 2000 mOsmol/l can be calculated compared with an osmolarity of 1·5 mOsmol/l for the solution containing CaHPO4.
Intra-abomasal administration NaH2PO4 showed the most rapid and strongest effects on plasma Pi concentration, increasing it far above the reference range for Pi in dairy cattle. Concomitantly a marked decline in plasma Ca concentration mirroring the increase in plasma Pi concentration was observed after intra-abomasal treatment with NaH2PO4, a well-described complication of hyperphosphataemia associated with the precipitation of excessive amounts of Pi as calcium phosphate(Reference Goff31).
Peak rumen Pi concentration after oral and intraruminal treatment with NaH2PO4 of approximately 30 and 80 mmol/l, respectively, were measured 15 min after treatment. Assuming an average volume of the liquid phase of the reticulorumen of 90 litres in a lactating dairy cow, administration of approximately 2000 mmol Pi would have increased the Pi concentration in rumen fluid by approximately 22 mmol/l to a total of 32 mmol/l(Reference Hartnell and Satter18). It is therefore proposed that peak concentrations measured in the ventral rumen sac after intraruminal administration of the test solution containing NaH2PO4 are not representative of the entire fluid phase of the reticulorumen, but are an artifact of incomplete mixing of the rumen content during the first 15 min. Accordingly the marked decline in Ca concentration in the ventral rumen sac noted after intraruminal administration of NaH2PO4, which presumably was caused by precipitation of calcium phosphate, is unlikely to reflect the mean Ca concentration in rumen fluid after complete mixing. Much milder declines of rumen Ca concentration were measured in the ventral rumen sac after oral treatment, which are more likely to reflect average Ca concentration of the rumen fluid. Neither oral nor intraruminal treatment with NaH2PO4 had a noticeable effect on the Ca concentration in plasma in treated animals.
During oral administration of the test solution with a drench gun an undetermined volume of test solution was lost as it drooled out of the buccal cavity of treated animals. By comparing peak plasma AP concentration as well as the area under the plasma AP concentration–time curve after oral and intraruminal treatment we crudely estimated that the mean volume lost during oral administration cannot have exceeded 10 % of the administered volume as for both parameters values obtained after oral treatment were less than 10 % below values measured after intraruminal treatment. Losses of NaH2PO4 while drenching cows could potentially also explain lower peak plasma Pi concentration as well as area under the plasma Pi concentration curve when compared with intraruminal administration of NaH2PO4.
Acetaminophen (N-acetyl-4-aminophenol) is a widely used analgesic and antipyretic agent that is absorbed from the proximal small-intestinal tract but not from the stomach in single-stomached species when administered orally(Reference Clements, Heading and Nimmo15). Determination of specific parameters characterising the absorption kinetics of AP such as the plasma AP concentration at specific times, CAPmax, TAPmax or area under the AP concentration–time curve for different time intervals after oral treatment have been validated as indirect quantitative parameters for gastric emptying after administration of liquid meals in humans and other single-stomached species including pre-ruminating calves(Reference Marshall, Constable and Crochick22, Reference Sharifi, Grünberg and Soroori32). The acetaminophen absorption test (APAT) consisting of oral administration of a liquid containing AP and subsequent repeated blood sample collections to obtain a plasma AP concentration–time curve has also been used in adult and juvenile bovines and in goat kids to study the function of the reticular groove reflex(Reference Sharifi, Grünberg and Soroori32–Reference Bakker, Jorritsma, Tielens and Opsomer35). Whereas in single-stomached species the plasma AP concentration is mainly the result of overlapping processes such as intestinal absorption and metabolism and excretion in liver and kidney, respectively, in ruminants absorption from the reticulorumen is a potential confounder that has not been studied in detail(Reference Schaer, Herrli-Gygi and Kosmeas33, Reference Forrest, Clements and Prescott36). The flat slope and low amplitude of the AP concentration–time curve after administration of a test solution containing AP into the rumen compared with curves obtained after AP administration directly into the abomasum either by direct infusion or stimulation of the reticular groove reflex led to the widely held assumption that the amount of AP absorbed from the reticulorumen is negligible, if not nil(Reference Goff31–Reference Schaer, Herrli-Gygi and Kosmeas33). The TAPmax, which is a main outcome variable of the APAT and frequently referred to as gastric emptying time, in ruminants is more appropriately referred to as ‘oroduodenal transit time’ since the appearance of AP in plasma in ruminants is not mainly driven by the abomasal emptying rate but also depends on either rumen motility or function of the reticular groove reflex(Reference Schaer, Herrli-Gygi and Kosmeas33, Reference Herrli-Gygi, Steiner and Doherr34). In calves and goat kids significantly higher and earlier CAPmax values have been reported in animals with a functional reticular groove after oral AP administration(Reference Sharifi, Grünberg and Soroori32, Reference Herrli-Gygi, Steiner and Doherr34). Another study conducted in cannulated dairy cows also reported significantly higher AP peaks after intra-abomasal compared with intraruminal administration of an AP-containing solution, suggesting that the APAT is a valuable, cheap and minimally invasive tool to study the activation of the reticular groove reflex in ruminants(Reference Herrli-Gygi, Steiner and Doherr34, Reference Bakker, Jorritsma, Tielens and Opsomer35).
In conclusion, it is reported that the treatment with approximately 300 g NaH2PO4 dissolved in 2 litres of water and administered as an oral drench is suitable to correct hypophosphataemia in mildly Pi-depleted dairy cows for approximately 8 h. Peak concentrations after oral treatment are observed 4 h after treatment, indicating that neither transruminal Pi absorption nor stimulation of the reticular groove reflex affected the absorption kinetics of orally administered NaH2PO4 at the dose and concentration used in the present study. Dicalcium phosphate administered into the rumen is of little use as a Pi supplement in dairy cows.
Acknowledgements
The present study was conducted at the Department for Farm Animal Health, Utrecht University, Yalelaan 7, 3584C N Utrecht, The Netherlands.
The present study was partially supported by Boehringer Ingelheim Vetmedica GmbH, Ingelheim, Germany. This sponsor had no involvement in study design, the collection, analysis or the interpretation of data, writing the report, or the decision to submit the report for publication.
The responsibilities of the authors were as follows: W. G. designed and carried out the study as well as the data analysis and wrote the paper. P. D. contributed to designing the study, formulated the experimental ration and contributed to the manuscript. G. B. contributed to designing the study and writing the manuscript. All authors read and approved the final manuscript.
The authors declare not to be subject to any conflict of interest.


