

Introduction
Sentinel-1 is the first space-borne synthetic aperture radar (SAR) mission in the frame of the Copernicus program for Earth Observation directed by the European Commission in partnership with the European Space Agency (ESA). The main objective of the Sentinel-1 mission is to ensure the continuity of C-band SAR data acquisitions for global monitoring applications [Reference Torres, Snoeij, Geudtner, Bibby, Davidson, Attema, Potin, Rommen, Floury, Brown, Navas Traver, Deghaye, Duesmann, Rosich, Miranda, Bruno, L'Abbate, Croci, Pietropaolo, Huchler and Rostan1]. The mission consists of two satellites (Sentinel-1A and Sentinel-1B) flying in near-polar sun-synchronous orbits and each operating a SAR at C-band (5405 MHz). The first satellite of this constellation, Sentinel-1A (S-1A) which is the subject of this study, was launched on April 3, 2014.
Sentinel-1 provides different acquisition modes which mainly differ by its observation coverage and spatial resolution [Reference Geudtner, Torres, Snoeij, Davidson and Rommen2]. For the Stripmap mode one of the six available beams (S1–S6) is selected which operates with a specific antenna elevation range; but each of the Stripmap beams covers a swath wide of about 80 km with a spatial resolution of 5 m×5 m. To enlarge the covered observation area during an overpass a novel technique is used by the Sentinel-1 instrument: the terrain observation with progressive scan (TOPS) [Reference De Zan and Monti Guarnieri3]. Therefore, the antenna is electronically steered from back to fore to sequentially acquire different sub-swathes and thus allow full coverage (without spatial gaps) in flight-direction (azimuth). The interferometric wide swath (IW) mode enables a coverage of about 250 km with a spatial resolution of 5 m (range) by 20 m (azimuth) by switching between three sub-swathes (IW1, IW2, IW3). For the extra-wide swath (EW) mode five sub-swathes (EW1–EW5) are implemented which offer products with a swath width of 400 km and a resolution of 20 m (range) by 40 m (azimuth). The three modes (Stripmap, IW, EW) which are analyzed in the current study are operated in dual-polarization (HH+HV, VV+VH).
Since precise radiometric calibration of a spaceborne radar instrument (SAR or scatterometer) is difficult to achieve on-ground, a lot of effort is required in-flight during calibration and validation campaigns (e.g. for ALOS [Reference Shimada, Isoguchi, Tadono and Isono4], for TerraSAR-X [Reference Schwerdt, Brautigam, Bachmann, Döring, Schrank and Hueso Gonzalez5], for RISAT-1 [Reference Mishra, Patel, Shukla and Shukla6], for ASCAT [Reference Anderson, Figa-Salda na, Wilson and Ticconi7]). Two different calibration philosophies are pursued in general:
(1) a relative radiometric calibration using large, uniformly distributed targets like rainforest areas and
(2) an absolute radiometric calibration using point targets with a well-known radar cross section (RCS).
For the first method, the radiometric behavior of a wide antenna elevation angle range can be evaluated but spatial and temporal variability exist and allow only a radiometric calibration in a relative sense [Reference Long and Skouson8,Reference Woodhouse, van der Sanden and Hoekman9]. For the latter method an adequate number of precise reference targets are needed, which have to be developed, manufactured, deployed, and maintained during the respective calibration campaigns [Reference Ulander, Hawkins, Livingstone and Lukowski10–Reference Li, Tang, Ma, Zhou, Gao, Wang, Li, Wang and Zhu12].
Radiometric and polarimetric calibration of a SAR system and subsequent long-term monitoring of its radiometric stability are essential tasks to ensure the quality of the SAR data. Such high quality and stable SAR products are needed for a number of applications which focus on intensity changes of sequent SAR images [Reference Ajadi, Meyer and Webley13,Reference El Hajj, Baghdadi, Zribi and Angelliaume14] as needed for biomass estimation, deforestation or ice monitoring. Indeed, the detected changes should be caused by different target scattering conditions but not due to an improperly calibrated or unstable SAR system.
Sentinel-1 should allow a very application-oriented operation in this sense: the absolute radiometric accuracy was defined to be 1 dB (3σ) for all operation modes, a novelty for space-borne SAR systems. Reaching this overall accuracy is a challenging task which increases the calibration accuracy requirements to be considered. For this purpose, The German Aerospace Center (DLR) has developed an efficient system calibration concept for Sentinel-1 [Reference Schwerdt, Döring, Zink and Schrank15] which consists of following tasks:
• a geometric calibration (to assign the SAR data to the geometric location on the Earth's surface),
• an internal calibration (to analyze the instrument performance and stability using internal calibration pulses),
• an antenna pointing determination (to obtain a correct beam pointing of the antenna),
• an antenna model verification (to ensure the precision of the reference pattern required for the radiometric correction across the swath) and
• an absolute radiometric calibration for the radiometric bias correction of the SAR data.
After the launch of S-1A, a SAR system calibration was performed by ESA and their partners during the commissioning phase. Additionally an independent verification of this S-1A system calibration was carried out by the DLR on behalf of ESA [Reference Schwerdt, Schmidt, Tous Ramon, Castellanos Alfonzo, Döring, Zink and Prats16]. Such an independent system calibration was also performed for S-1B by DLR in 2016 [Reference Schwerdt, Schmidt, Tous Ramon, Klenk, Yague-Martinez, Prats-Iraola, Zink and Geudtner17]. S-1A commissioning phase was executed under non-ideal conditions and the strong requirement for the absolute radiometric accuracy could therefore not be achieved. Thus, in order to improve the radiometric and polarimetric performance of S-1A, DLR has been offering further support and executing additional calibration activities during the routine operation.
This paper is organized as follows: the DLR reference targets are introduced in the Section “DLR calibration facility”, the results from the radiometric calibration campaign are presented in the Section “Radiometric and polarimetric calibration”. After finishing this calibration campaign ESA performed a radiometric refinement. The radiometric stability has been analyzed for a period of about 1.5 years after the activation of the refinement; the corresponding results are presented in the Section “Radiometric stability and long-term monitoring”, the conclusion is given in the Section “Conclusion”.
DLR calibration facility
The DLR SAR Calibration Center of the Microwave and Radar Institute established a calibration field in Southern Germany able to support multiple SAR missions. Therefore, innovative passive and active point targets were newly developed and manufactured by DLR [Reference Jirousek, Döring, Rudolf, Raab and Schwerdt18]. Six of them (three corner reflectors and three C-band transponders) were deployed and installed, and have been continuously operated for the Sentinel-1 mission since the launch of S-1A.
The C-band transponders (Fig. 1 - left) have a nominal RCS of about 60 dB m2. Each transponder is individually calibrated in an absolute sense [Reference Rudolf, Döring, Jirousek, Raab, Reimann and Schwerdt19]. The two antennas allow the simultaneous reception and transmission of electromagnetic pulses. The receiving pulses can be recorded and evaluated to determine the potential pointing error of the SAR instrument and to verify the antenna patterns in azimuth [Reference Schwerdt, Schmidt, Tous Ramon, Castellanos Alfonzo, Döring, Zink and Prats16]. The compact, thermally controlled housing of the transponders ensures the radiometric stability of the point targets with values better than 0.02 dB. The trihedral corner reflectors (Fig. 1 - right) have a leg length of 2.8 m and a radar cross-section of 49.2 dB m2 at the center frequency of Sentinel-1. Both target types have an absolute radiometric accuracy of 0.2 dB [Reference Schwerdt, Schmidt, Tous Ramon, Klenk, Yague-Martinez, Prats-Iraola, Zink and Geudtner17,Reference Rudolf, Döring, Jirousek, Raab, Reimann and Schwerdt19].
DLR point targets, remotely controlled, and autonomous operable for calibrating SAR instruments: C-band transponder (left) and 2.8 m corner reflector (right).
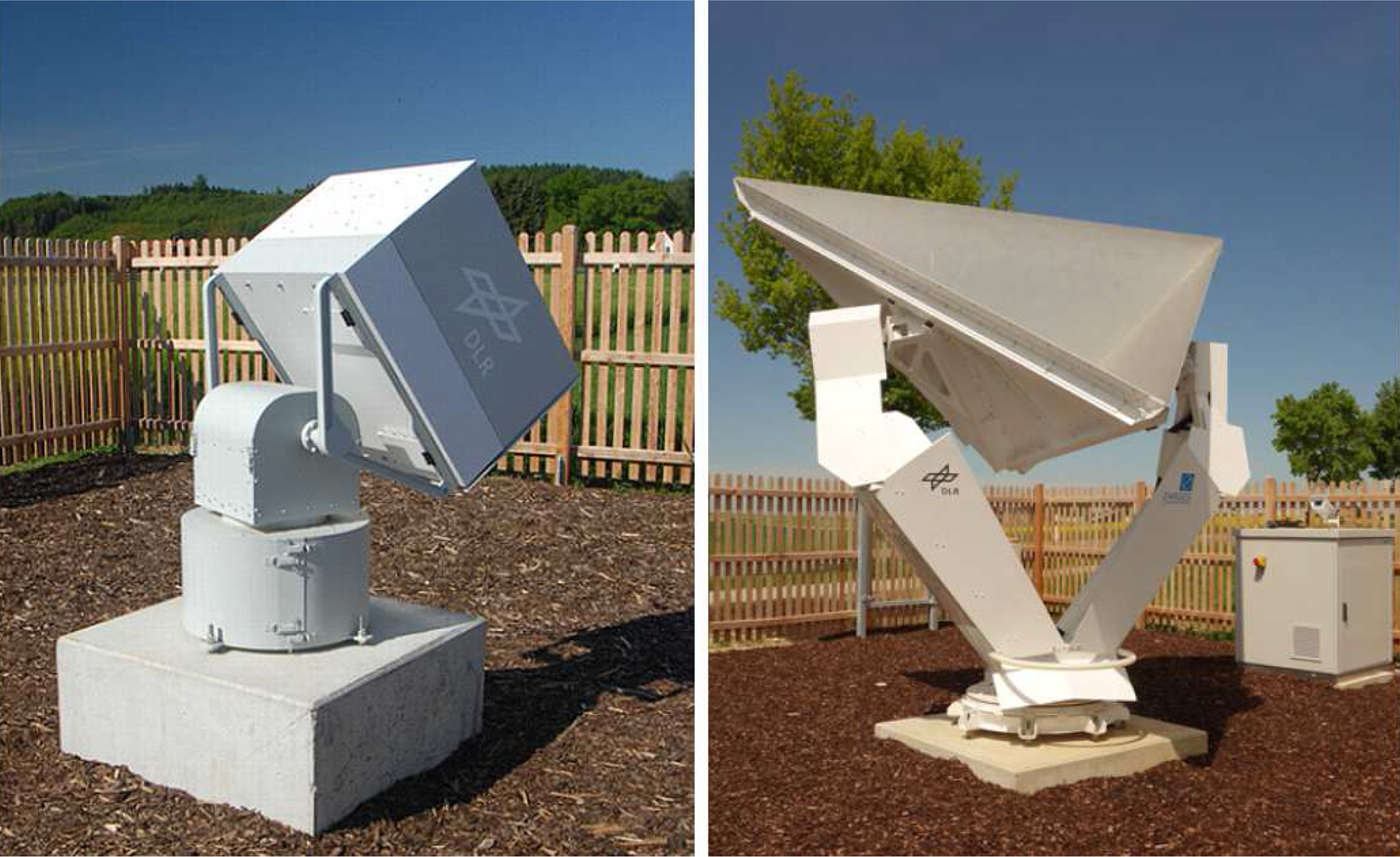
The DLR point targets are remotely controlled and can be operated autonomously following a given time schedule. This supports a flexible and fast configuration time for different mission setups [Reference Reimann, Schwerdt, Schmidt, Tous Ramon, Castellanos Alfonzo, Döring, Walter Antony, Rudolf, Raab and Zink20]. The positioner system allows the rotation in azimuth and elevation of both corner reflectors and transponders. This ensures satellite observation constellations in line-of-sight from the target over the full range covering the celestial sphere. The exact alignment of the targets is calculated before the overpass using the predicted orbit of the satellite. Then, the targets are autonomously aligned in line-of-sight towards the satellite right on time. Between consecutive overpasses, the targets are moved back into a “park” position to be protected from object impacts and extreme weather conditions.
Radiometric and polarimetric calibration
Estimating the absolute calibration factor from SAR images
A SAR image contains in general the backscattering of the observation area. The backscattering power of a (usually complex) SAR pixel is related to its amplitude. Providing sufficient spatial resolution, orographic, rural or urban features of a mapped scenery can be identified. Figure 2 depicts a S-1A observation of a rural area of approximately 12 km×12 km where crop fields, forests, and villages can be discerned. The image power can be converted to a RCS (in dBm2) by using the absolute calibration factor and the spatial resolution in both dimensions which are annotated within the given SAR product.
Sentinel-1A SAR image (left) of a scene containing the impulse response of a DLR transponder (center). The area around the point target is zoomed out within the white square at the bottom left corner. The pixel power, related to the target impulse response (right), is extracted from the SAR image along a cut in range (horizontal) and azimuth (vertical) dimension. The black lines depict the interpolated response based on used SAR image pixels (red crosses).
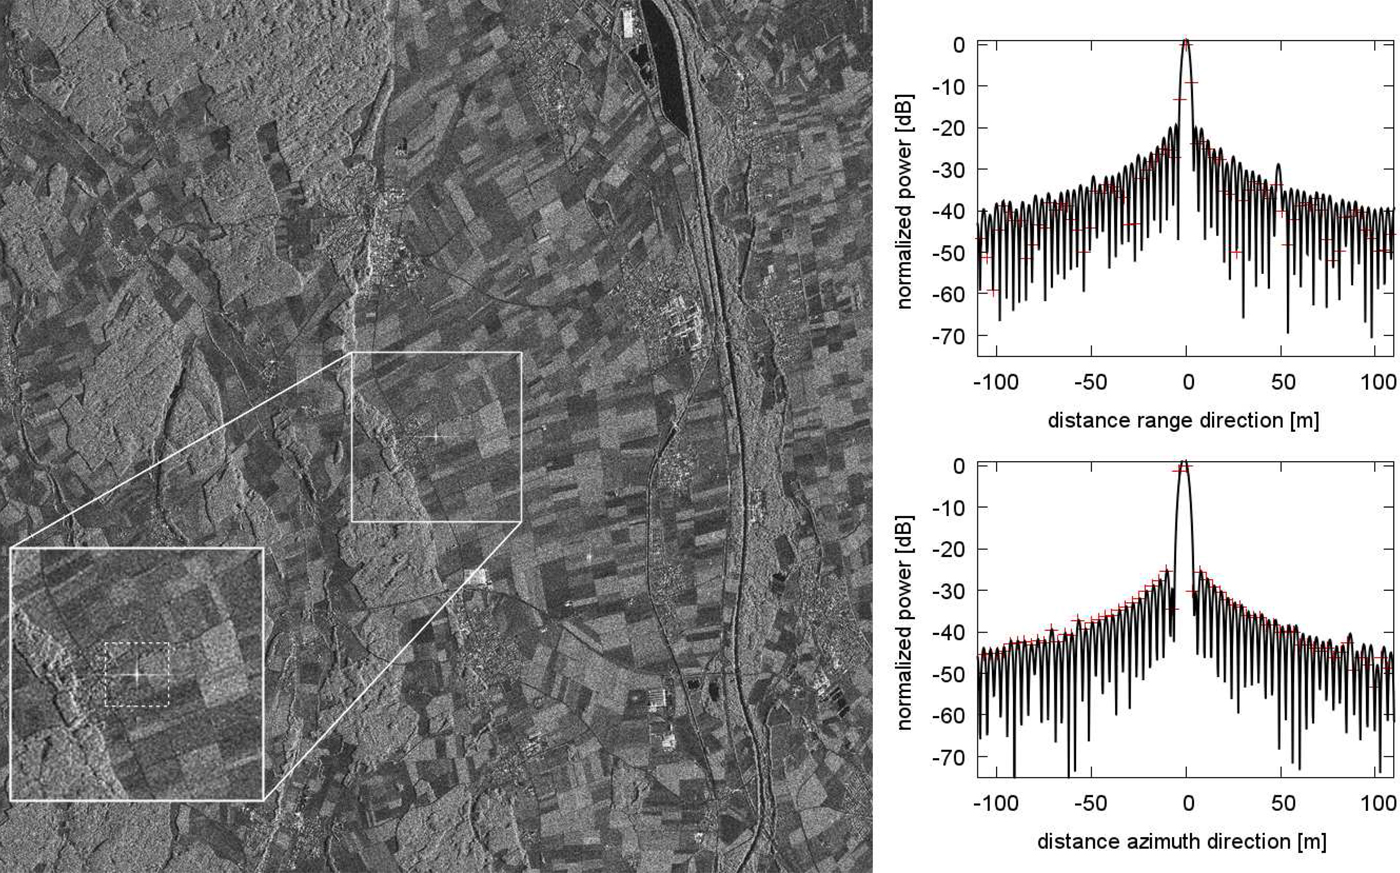
In order to verify the annotated calibration factor, point targets are used as radiometric references. By applying the known RCS of a point target the absolute radiometric bias is then derived from its impulse response. In the center of Fig. 2 such a target response, related to one of the DLR's transponders, is visible. To estimate the target's backscattering power precisely, the integrated pixel method is applied [Reference Gray, Vachon, Livingstone and Lukowski21]. For this the image pixel power is integrated over the area impacted by the target response mainly along the cut in range and azimuth through the impulse peak (Fig. 2, right). The target backscatter power is estimated from the interpolated data considering the background clutter by subtracting the noise level as described by [Reference Freeman22].
In this study the absolute calibration factor is determined from DLR point targets using different modes, beams and polarization channels. For a well-adjusted SAR system a constant absolute calibration factor is expected valid for all modes, beams, and polarization channels. From the variation of the absolute calibration factor the radiometric accuracy of the SAR system is derived.
Statistics for each beam and polarization
Calibration factor statistics are depicted in Fig. 3 for all beams analyzed and for all four polarization combinations (HH, HV, VH, VV); symbols indicate the mean value of each group, error bars the corresponding standard deviation. Filled triangles represent the co-polarization channels (HH, VV), while open triangles the cross-polarization ones (HV, VH); up looking triangles indicate H on transmit (HH, HV), down looking V on transmit (VH, VV).
Absolute calibration factors for all modes and beams observed; the mean values for each polarization are depicted by a symbol, the standard deviation by an error bar.

The beam order as depicted in Fig. 3 is related to the antenna elevation angle; the full elevation range is covered for Stripmap and EW modes from low elevation (S1, EW1) to high elevation angles (S6, EW5). The IW mode covers a range from mid to high elevation angles.
Beam-to-beam gain offsets of up to 0.6 dB are visible when focusing on the same polarization and comparing different beams of the same mode (e.g. between S3 and S6 for VV or between IW2 and IW3 for HH).
Furthermore, the standard deviation indicates the variation within one beam. It is in the order of 0.3 dB for most of the co-polarized channel data although higher values are observed for EW mode. EW1 is the beam with the widest elevation range; its standard deviation increases up to 1.2 dB.
Figure 3 also shows the clear polarization dependency of S 1A's absolute calibration factor for this observation period: the HV channel shows the highest calibration factor for almost every beam, while the VH channel the lowest.
Analyzing the differences between both polarization channels (HH, VV), a clear elevation angle dependency is observed. In particular, the highest difference between both co-polarized channels is observed for low and high elevation angles (EW1 and EW5) with values of up to 1.5 dB and with VV always higher than HH. However, no significant distinction is found due to the orbit direction (not shown in plot). Finally, the calibration factors for Stripmap and EW mode are approximately at the same level; these show an offset of about 1 dB with respect to IW mode absolute calibration factor.
In order to investigate the reasons for mode and elevation dependent deviations the impact of the antenna pattern is further analyzed in the following section.
Channel imbalance analysis to investigate the radiometric accuracy within the beam
The DLR transponders are operated with a polarization orientation of 45°, that means the received signal from the satellite (in H- or V-polarization) is re-transmitted in both polarizations (H and V) simultaneously by the transponder. Thus, it is possible to estimate the instrument channel imbalance in amplitude and phase from the processed co- and cross-polarized SAR images.
On-ground SAR processing performs several geometric calculations based on external parameters (e.g. a digital elevation model). Such external parameters include additional error sources which can be canceled out by analyzing the channel imbalance instead of the radiometric profile from a single polarization channel. The reason behind is the same geometric assumptions and corrections are used for both polarizations during processing; this impact is canceled out when subtracting one from another.
In the case of a perfectly calibrated SAR system, the H and V signals coming back from a transponder with 45° orientation are expected to have the same amplitude independently on the polarization channel on receive. For this ideal case, an amplitude channel imbalance of 0 dB is expected.
The channel imbalance in amplitude computed as the ratio between cross- and co-polarized channels (or differences in dB) is depicted in Fig. 4 for the observed acquisition modes (green: EW, red: IW, blue: Stripmap). An opposite trend is indicated for the different transmit polarizations: the channel imbalance for H-on-transmit (HV–HH) is almost always above 0 dB, for V-on-transmit (VH–VV) below 0 dB but both curves show a similar elevation dependency and similar absolute values.
Channel imbalance in amplitude between cross- and co-polarized channel derived from transponder responses for H- (filled diamonds) and V-polarizations (open diamonds) on transmit and for several acquisition modes (green: EW, red: IW, blue: Stripmap).
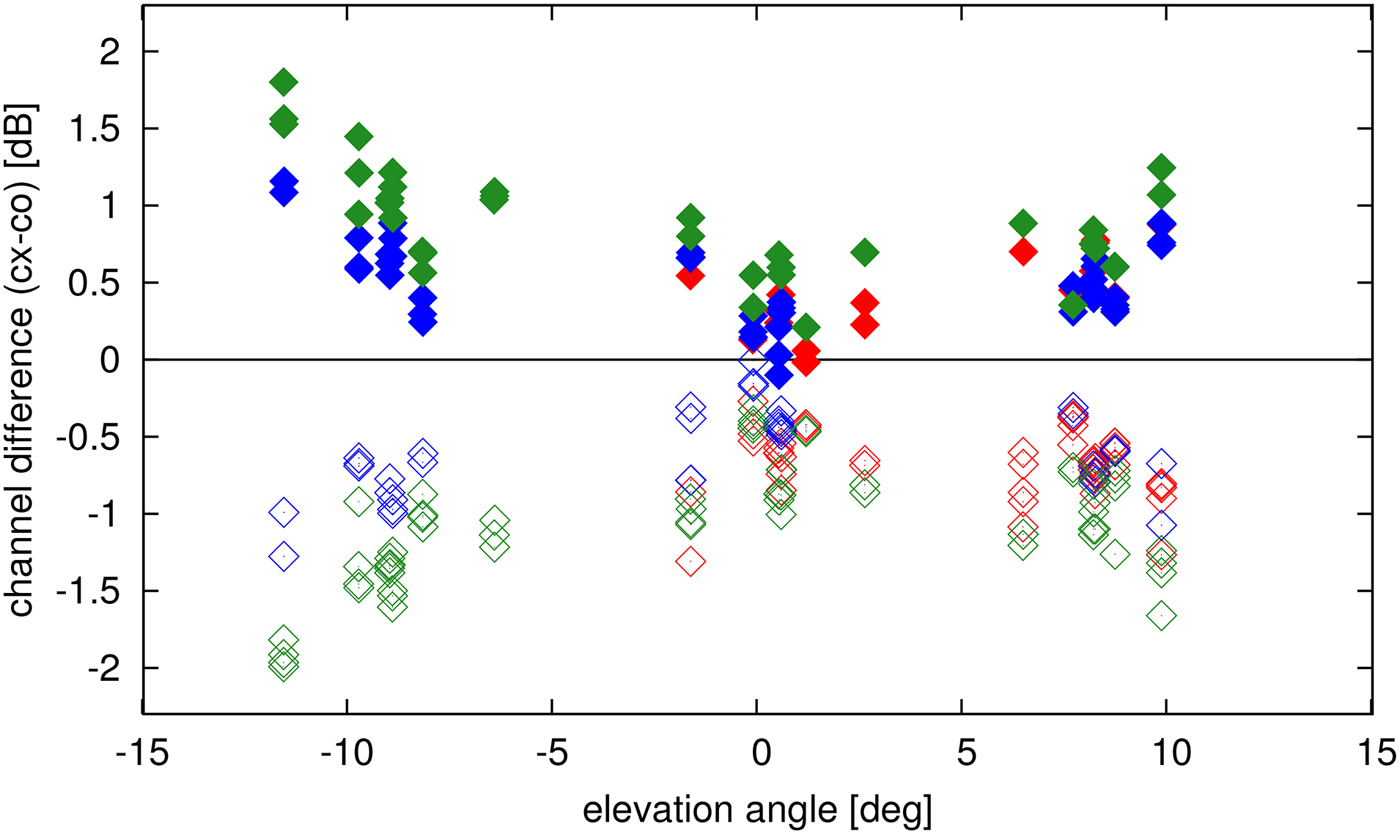
By inverting the sign for one pair on transmit we obtain the same imbalance behavior for both polarization combinations, e.g. the lower curve is folded upwards when the sign for V on transmit (VV–VH) is inverted. The impact of the transmit polarization is canceled out by using such channel combinations (HH–HV, VH–VV). Thus, the remaining imbalance and the observed characteristic shape over elevation angle seen in Fig. 4 arise from the receiving channels rather than from the transmitting ones.
Furthermore, the antenna patterns used to correct the SAR data during on-ground processing (calculated from the antenna model) have been reverted from the final product in order to analyze their effect to point target responses. In an ideal case, the channel imbalance measured for each point target would match the imbalance profile predicted from the antenna model.
Figure 5 shows the channel imbalance analysis for EW mode acquisitions considering both transmit polarizations (blue: H on transmit with HH–HV; red: V on transmit with VH-VV). The data points depict the imbalance derived from the transponder responses after reverting the antenna pattern correction. The black lines show the channel imbalance on receive (H–V) for all EW beams as predicted by the antenna model.
Channel imbalance on receive (H–V) for EW mode as predicted by the antenna model (black lines) and measured by the transponder responses without pattern correction for HH-HV (blue) and VH–VV (red).
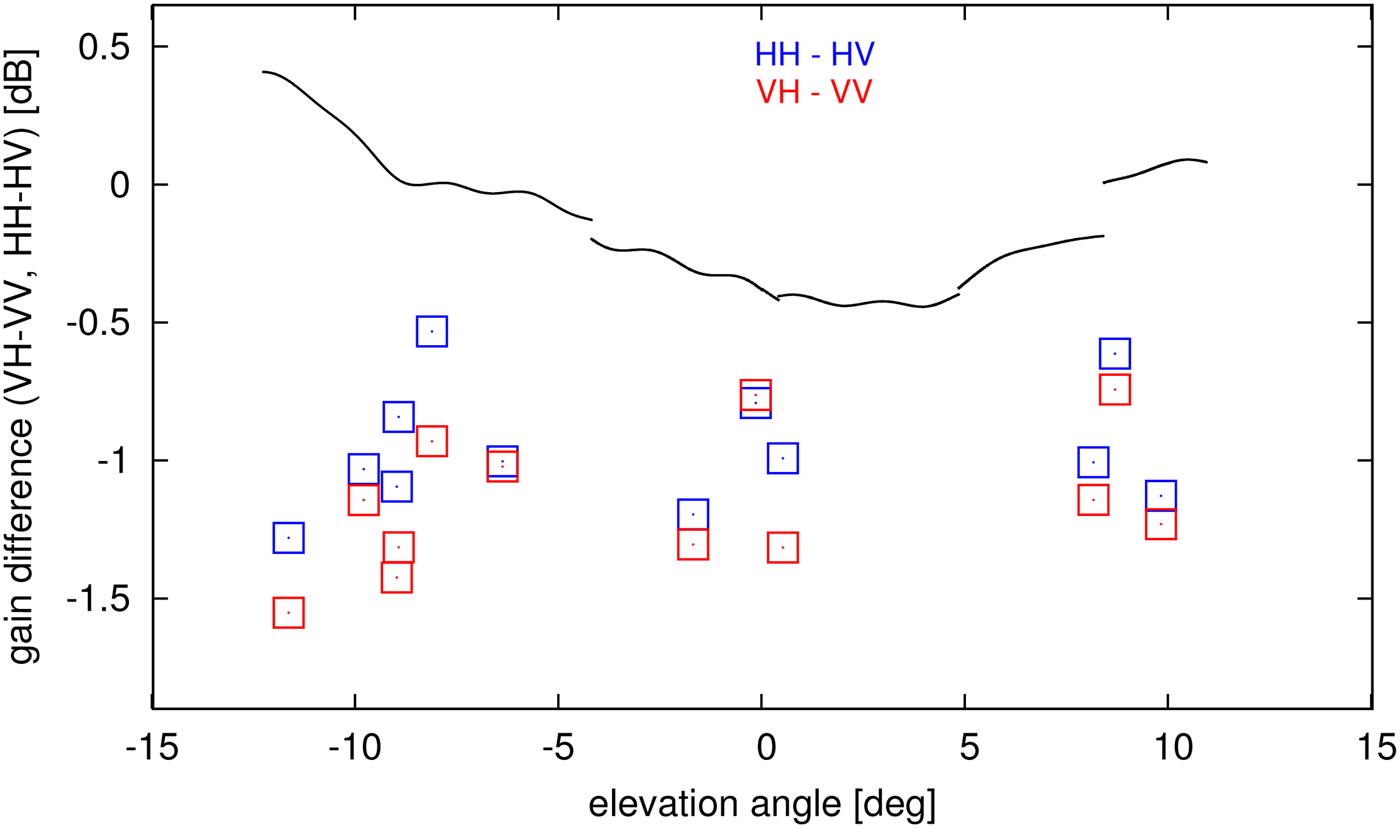
From Fig. 5 it is discernable that the predicted antenna pattern does not match the in-orbit measurements. While the measured data combinations show a more or less constant channel imbalance over the whole elevation angle range of about – 1 dB in average, the antenna pattern profile has a characteristic shape which is not reflected by the data.
By comparing the channel imbalance from the data with the one obtained from the antenna patterns (see Fig. 5) it is observed that the antenna pattern correction overcompensates the antenna pattern contribution in the SAR data. The differences between measured and expected profiles are large for low and high elevation angles. Note that the same behavior is also observed for rainforest data [Reference Schmidt, Schwerdt, Castellanos and Tous Ramon23].
Radiometric refinement for pattern correction derived by ESA
In order to improve the radiometric accuracy of S-1A and to benefit from the findings of the radiometric calibration described before, a radiometric refinement was performed by ESA [Reference Miranda24]. This refinement introduces individual gain bias corrections for each beam and polarization. Furthermore, in order to address the observed elevation-dependent gain shape (e.g. seen in Fig. 4), the operational antenna patterns used for TOPS mode acquisitions have been updated. The new antenna pattern includes an elevation dependent linear ramp with specific parameters for each beam and polarization. It should be noted that all these correction factors used for the refinement were empirically derived using the present calibration results. All S-1A SAR data acquired since November 2015 have been processed and corrected according to the refinement results.
Radiometric stability and long-term monitoring
The radiometric accuracy and the channel imbalance are determined for the main operation mode, the IW mode with V-polarization on-transmit. Therefore, the point target responses have been evaluated for an observation period of 1.5 years after the radiometric refinement carried out by ESA and have then been compared with the results obtained during the calibration campaign. Furthermore, the radiometric stability and the long-term radiometric behavior of the SAR system are analyzed. Therefore the absolute calibration factor has been evaluated as a function of time since November 25, 2015 focusing on IW mode with V-polarization on-transmit. Beyond that the radiometric performance of the instrument has been analyzed for each module-based using the radio frequency characterization (RFC) mode.
Radiometric accuracy and channel imbalance for IW mode
The absolute calibration factor statistics (mean value and standard deviation) have been derived for each IW beam acquired with V-polarization on transmit for the monitoring period of 1.5 years, i.e. since November 2015 (see Fig. 6). The differences between the mean values of all three beams (IW1, IW2, IW3) are very small with values below 0.15 dB.
Absolute calibration factor covering the 1.5-years monitoring period for all the three beams of the IW mode acquired with V-polarization on transmit; the mean values are depicted by a symbol, the standard deviation by an error bar.

However, a slightly higher variation is observed for cross-polarized data (VH) of all three beams compared with the respective co-polarized data (VV). In comparison with the results obtained before the refinement (see VV and VH channels of IW1-3 in Fig. 3), the radiometric offset for IW mode data has nearly vanished in Fig. 6 to an average of 0.08 dB. Furthermore, the radiometric accuracy is improved by 0.13 dB and the standard deviation for IW with V-polarization on-transmit is of 0.30 dB (1σ) over the 1.5 years observation period.
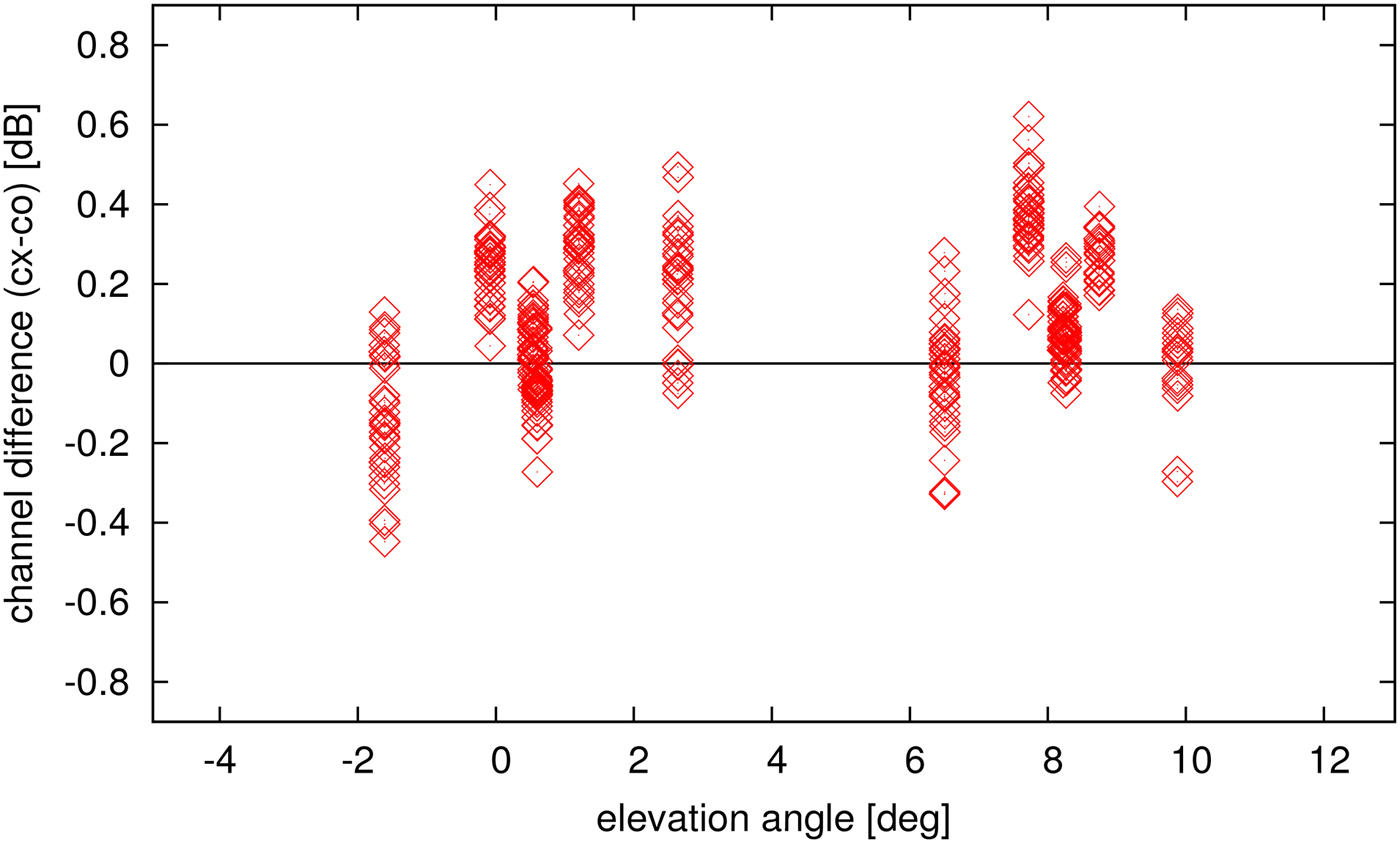
The polarimetric characteristics have also been analyzed after the refinement performed by ESA. The resulting channel imbalance in amplitude is depicted in Fig. 7 for the IW mode acquired with V-polarization on-transmit as a function of elevation angle. The channel imbalance determines the ratio between VV and VH transponder responses within processed SAR images. Comparison of the results before (red open diamonds in Fig. 4) and after the refinement (Fig. 7) shows that the channel imbalance is reduced from −0.63 dB (before) to 0.15 dB (after). The small but present elevation dependency of the channel imbalance in Fig. 7 indicates an insufficient antenna pattern correction applied during SAR processing. However, the standard deviation of the channel imbalance of IW mode with V polarization is improved from 0.21 dB (before) to 0.14 dB (after).
Channel imbalance in amplitude for IW mode with V-polarization on-transmit covering the 1.5 years monitoring period.
Phase imbalance
Similar to the channel imbalance in amplitude, the phase difference between the co- and the cross-polarized channel is estimated from the transponder responses extracted from the complex SAR images. In an ideal case this phase difference should be 0° because the same signal, re-transmitted by the transponder, is seen in both SAR images (co- and cross-polarization) at the identical geometric position.
The remaining phase imbalance as a function of elevation angle is depicted in Fig. 8 covering observations before the refinement and considering all the three modes (green: EW, red: IW, blue: Stripmap). The phase differences of DH-polarization (HH–HV) are almost always below 0°; of the DV-polarization data (VV-VH) usually above 0°. The absolute phase difference is below 5° with no significant differences between different modes which confirms a good quality of S-1A data with respect to the phase. Since only gain values are changed by the refinement the updated antenna elevation pattern has no impact on the phase.
Phase imbalance between co- and cross-polarized channel derived from the transponder responses for H- (filled diamonds) and V-polarization (open diamonds) on transmit and for different acquisition modes (green: EW, red: IW, blue Stripmap).
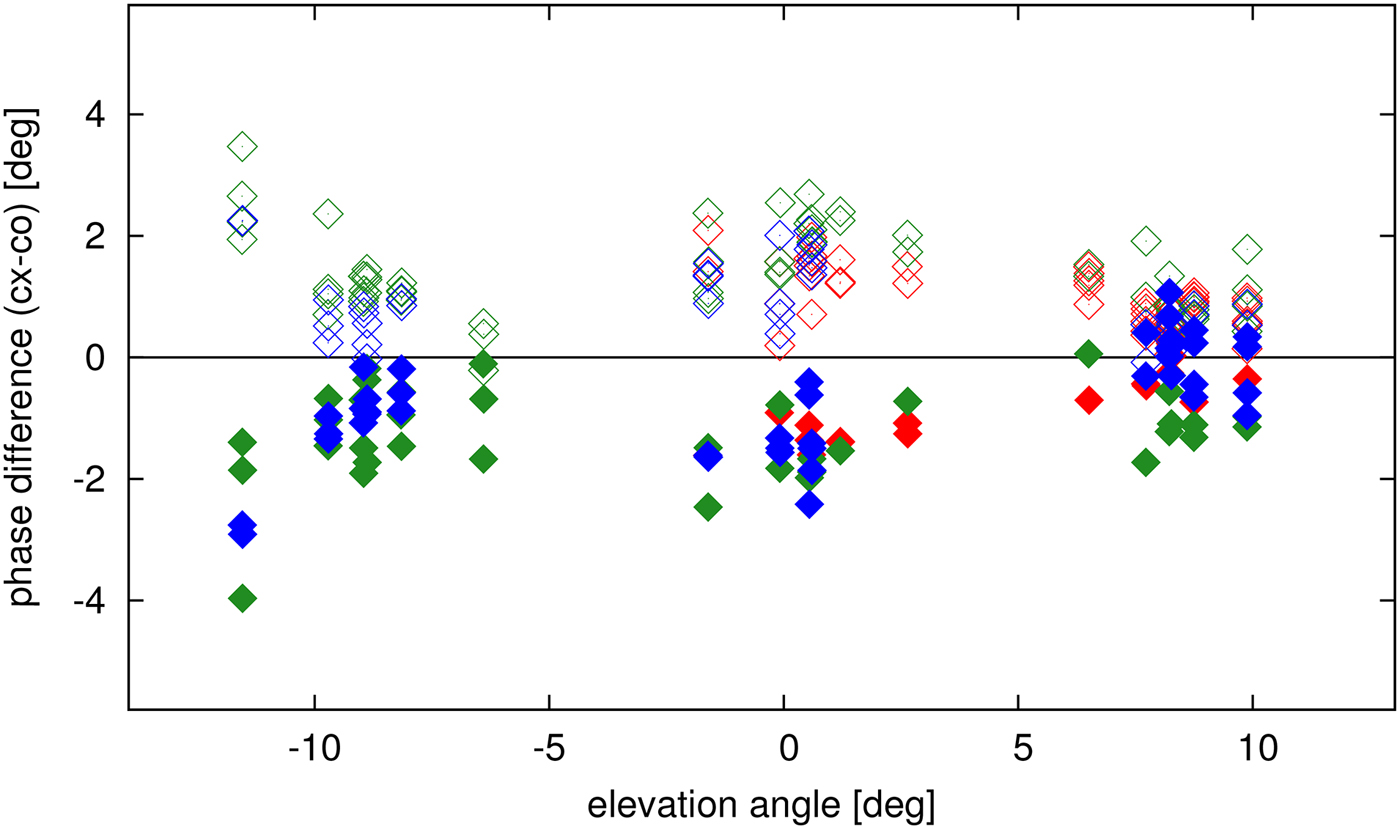
Nevertheless, similar to the channel imbalance in amplitude the opposite behavior of both polarization pairs indicates that the remaining phase difference trend arise from the receiving channels rather than from the transmit channels.
Timeline of calibration factors derived by point targets
In order to focus on temporal variation the absolute calibration factor for IW mode acquisitions covering all the three IW beams is depicted over time in Fig. 9. A small data gap is recognizable at the end of June 2016 according to a SAR anomaly reported at this time [25]. Moreover, DLR reference targets could not monitor S-1A between December 2016 and March 2017 because they were blocked by other calibration campaigns.
Absolute calibration factor over time for IW mode acquisitions; two reference targets are selected (red) to trace the radiometric performance under similar geometric conditions (i.e. same elevation angle) for the IW1 beam.
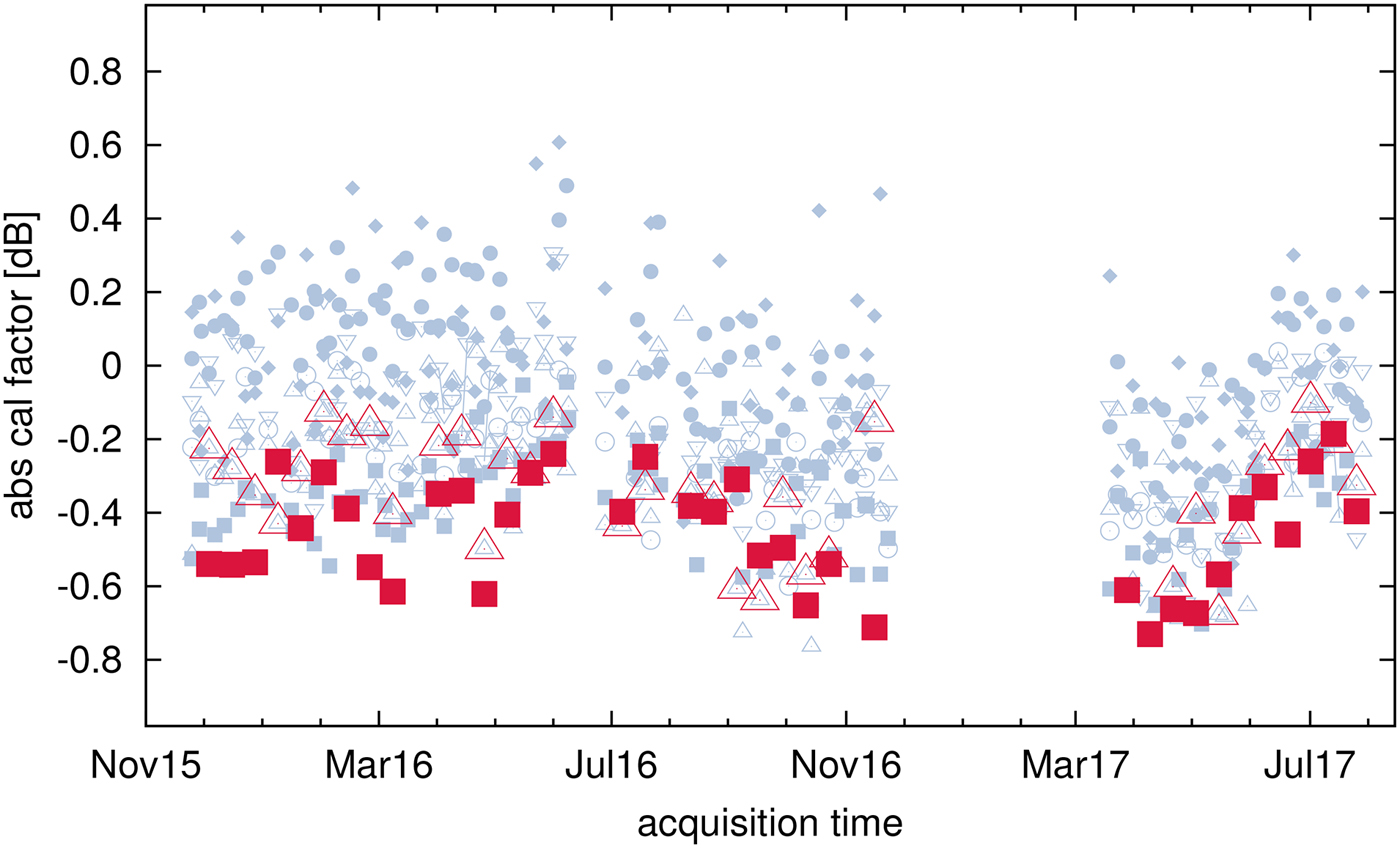
In order to recognize trends within the radiometric performance, the calibration factor of two targets is highlighted and traced by individual (red) symbols in Fig. 9. These results consider data acquired under similar geometric conditions, i.e. consecutive products acquired over the specific target and with a constant elevation angle. Both targets highlighted in Fig. 9 are covered by the IW1 beam with descending orbit direction.
In general, the calibration factor of IW monitored in Fig. 9 is relatively stable over time with a minimum of −0.75 dB in October 2016 and a maximum of 0.6 dB in May 2016. But small trends in the radiometric performance can be indicated: a decreasing trend from July to December 2016, an increasing trend from March to August 2017 and a more stable period from November 2015 to June 2016. These trends are in particularly visible for the highlighted targets within IW1.
By applying the internal calibration during SAR data processing a stable averaged calibration factor is expected over time. Variations may arise from seasonal changes of the atmospheric attenuation, e.g. more frequently rainy days occurred in summer compared with winter season. Furthermore, temporal trends of transmission and receive modules (TRM) in the instrument front-end could change the resulting antenna patterns. These individual TRM trends are further evaluated in the next section.
RFC measurements long-Term analysis
The TRMs of S-1A are continuously monitored in-orbit using the radio frequency characterization (RFC) mode. The RFC mode contains internal calibration measurements acquired with the pulse coded calibration technique which is similar to the pseudo-noise gating characterization mode used for TerraSAR-X and TanDEM-X [Reference Hounam, Schwerdt and Zink26]. The method allows measuring the individual excitation coefficients of an active phased array antenna simultaneously and under most realistic conditions.
A total of 280 TRMs in H-polarization and 280 TRMs in V-polarization compose the front-end antenna. These are grouped into 14 tiles, i.e. each tile allocates 20 TRMs for each polarization on transmit. RFC mode products are used for TRM health monitoring. Therefore, in-flight measurements are compared against previously defined reference values to detect any anomaly, drift or failure. In-flight reference values are used to obtain deviations in amplitude and phase for the transmission and the reception paths in both polarizations.
In order to evaluate temporal trends, the amplitude of individual excitation coefficients for V-polarization on transmit is depicted in Fig. 10 for the period between November 2015 and July 2017. Higher amplitude deviations of several front-end TRMs are observed since the end of June 2016. Half of the TRMs in tile number 11 show an amplitude deviation of about −10 dB with respect to the reference (not shown in plot). Figure 10 focuses on amplitude deviations between −3 and 1 dB and depicts that the other half of the TRMs in tile number 11 (red lines) are also affected by this anomaly in contrast to TRMs of all other tiles (grey lines).
Amplitude of individual excitation coefficients for VV-polarization derived from RFC measurements acquired between November 2015 and July 2017; TRMs of tile number 11 (red curves) are affected by an anomaly occurred in June 2016.
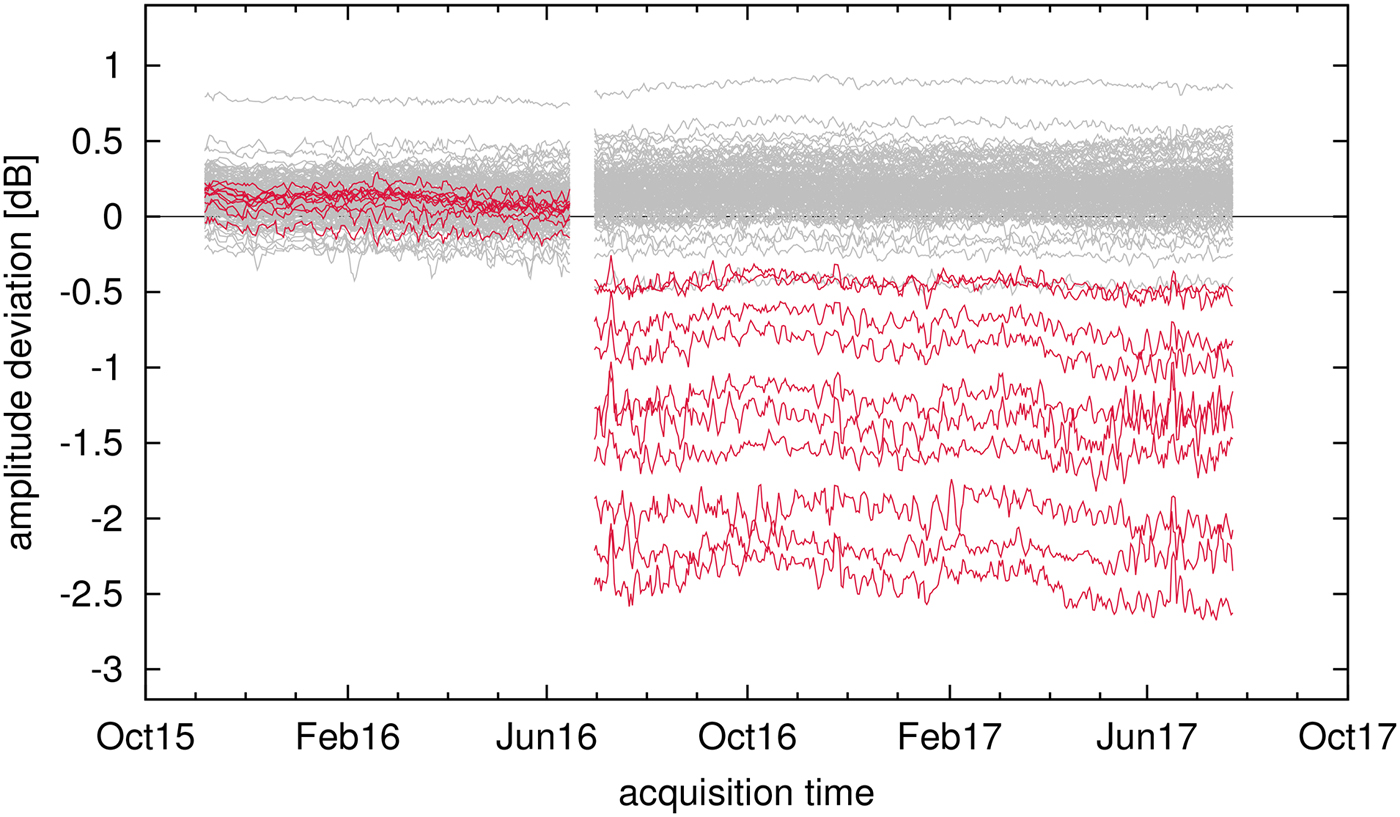
A change of the total instrument power is detected and corrected by the internal calibration of the SAR instrument. This correction seems to be properly implemented as the drop of the TRM power in June 2016 (red lines in Fig. 10) is not reflected in the absolute calibration factor (Fig. 9). Furthermore, it is not expected that the variation of only 10 out of 280 TRMs could have a noticeable impact on the resulting antenna pattern. However, further investigations and further long-term monitoring are needed to find the reason for the radiometric performance trend within the absolute calibration factor.
Cross-talk determined from trihedral corner reflectors
At a trihedral corner reflector the incoming wave is usually reflected three times and consequently the reflected wave is re-transmitted in the same direction as the incident wave. As a result a trihedral corner reflector does not rotate the polarization of the incoming wave, i.e. the related response within the SAR image should only be observable for the co-polarized channel, but not for the cross-polarized one. By relating the impulse responses of both channels it can be evaluated which portion of the co-polarized channel is also visible within the cross-polarization. The resulting cross-talk characterizes the instrument quality for separating both channels.
The cross-talk results for S-1A are shown in Fig. 11 covering the whole observation period; the different modes are indicated by color. The mean cross-talk for all acquired products is of about −40 dB. The lower spatial resolution in particular of the EW mode leads to a higher signal clutter causing a higher variation. This limits the capability to verify such a low instrument cross-talk.
Cross-talk during routine operations derived from DLR corner reflectors for different modes (blue: Stripmap, red: IW, green: EW).
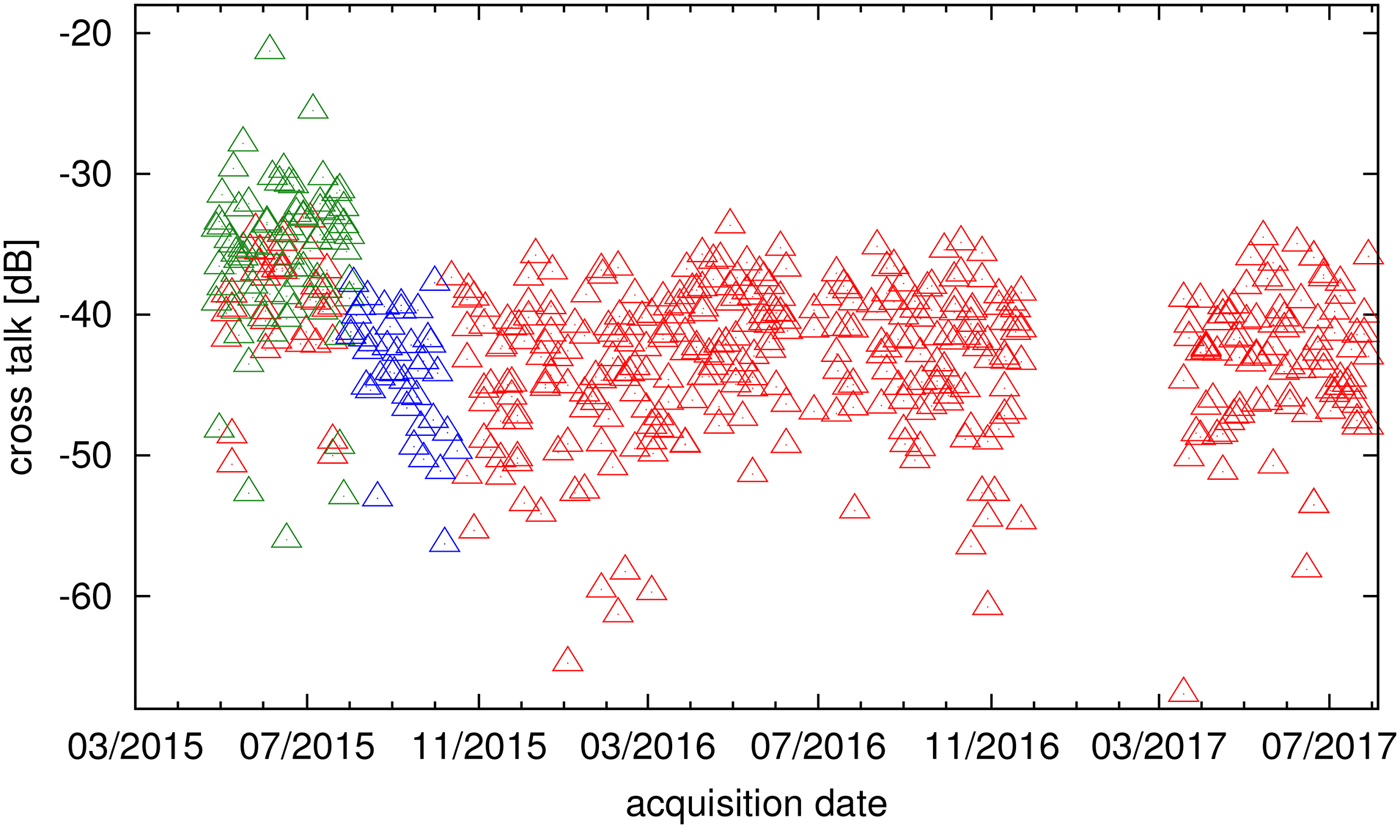
The cross-talk derived from Stripmap mode is always below −37 dB, for IW mode below −32 dB and confirms the very good quality concerning the separation of the co- and cross-polarization channels of the instrument receiving paths.
Conclusion
DLR point targets (corner reflectors and transponders) have been successfully used for the radiometric and polarimetric calibration of the space-borne SAR system S-1A. Almost all modes and beams (considering all the four polarizations) were intensively investigated for the S-1A radiometric and polarimetric calibration performed during its routine operation phase. The mean absolute calibration factor and its standard deviation are determined for each beam and polarization showing beam-to-beam offsets of up to 0.6 dB and a clear polarization dependency. Furthermore, the analysis of the channel imbalance shows an elevation dependency caused by the correction of SAR data with improper antenna patterns during on-ground processing.
ESA performed a radiometric refinement in order to define new correction parameters and improve S-1A radiometric accuracy. IW mode acquisitions with V-polarization on-transmit were analyzed after ESA's refinement for a time period of 1.5 years to evaluate the radiometric performance. Results show that the radiometric offsets for IW have been compensated and its radiometric accuracy has been improved with a standard deviation for this period of 0.30 dB (1σ). In addition, the channel imbalance in amplitude is also reduced from 0.63 dB to 0.15 dB with an improved accuracy of 0.14 dB (1σ). The remaining phase imbalance below 5° is not impacted by the refinement as expected. The low cross-talk of less than −37 dB for Stripmap mode confirms the very good isolation of both polarization receiving channels.
Small temporally trends have been observed for the absolute calibration factor and in particular since a SAR anomaly occurred at the end of June 2016. This anomaly affected several transmit and receive modules in tile number 11 as observed by the analysis of RFC measurements. Since then also higher variations have been seen for both the absolute calibration factor and the excitation coefficients of a number of TRMs. However, the trend of the absolute calibration factor should be monitored and analyzed further on.
Acknowledgements
The work of this paper was partially funded by the ESA under contract no. 4000114100/15/I-SBo.
 Kersten Schmidt received the Diploma degree in physics from University of Freiburg in 1998, the Ph.D. degree in atmospheric science from the University of Munich in 2007 with a thesis on lightning detection by analyzing lightning induced electromagnetic pulses. Since 2009 he has been with German Aerospace Center (DLR) in Oberpfaffenhofen, Germany. Since 2012 he works as project engineer and scientist at Microwave and Radar Institute at DLR with the Calibration Group for SAR satellite systems. There he is responsible for the calibration support for different satellite SAR missions in the field of geometric and radiometric calibration. Currently his major research interests include electromagnetic wave propagation, remote sensing, and SAR system calibration.
 Núria Tous Ramon received the Telecommunications Engineering degree from the Universitat Politècnica de Catalunya, Barcelona, Spain, and the Double Diploma degree in electrical engineering from the Technical University of Darmstadt, Darmstadt, Germany, in 2006. In 2006, she started working with the Microwaves and Radar Institute, German Aerospace Center (DLR) in the TerraSAR-X System Engineering and Calibration Group (SEC). She supported the launch and successful Commissioning Phase of the TerraSAR-X and TanDEM-X satellites, and is part of the Synthetic Aperture Radar (SAR) Instrument Operations Team. In 2010 she joined the Calibration Group of the Microwaves and Radar Institute, DLR. Her work is focused on the development and analysis of internal calibration algorithms.
 Macro Schwerdt received the Dipl.-Ing. degree in electrical engineering and the Dr.-Ing. degree from the Technical University Berlin. Since 1998, he has been with the Microwave and Radar Institute at the German Aerospace Center (DLR). Since 2000, he has been the head of the Calibration Group performing various radar calibration activities for different SAR missions like XSAR/SRTM. He was responsible for the successful calibration of the German TerraSAR-X and TanDEM-X satellites, launched in 2007 and 2010 respectively. In the frame of the European Copernicus Program from 2012 to 2016 on behalf of the European Space Agency he was also responsible for conducting DLR's independent Sentinel-1A and Sentinel-1B SAR system calibration. Under his leadership, the DLR's comprehensive radar calibration facilities, including innovative targets and novels tools for product quality control and performance analysis, have been maintained and extended. His major research interest includes the development of innovative and efficient calibration methods.


 Open access