


The prevalence of obesity is rapidly increasing in the UK, with about two-thirds of the adult population now either overweight or obese(1). Overweight and obesity are associated with a host of adverse health outcomes such as diabetes, CVD and certain cancers(2). Although the specific underlying causes of weight gain in adults remain unclear, a number of environmental factors have been identified as drivers of an excess energy intake (EI) in the face of reduced energy needs.
One particular alteration in dietary patterns which has been associated with promoting obesity is the trend towards larger food portions. Consumers may be increasingly underestimating their portion sizes and EI as they eat out of the home more often or eat larger portions within the home(Reference Nielsen and Popkin3, Reference Smiciklas-Wright, Mitchell, Mickle, Goldman and Cook4). It has also been suggested that consumers cannot precisely judge the amount of food they consume over the course of a few days or weeks(Reference Frobisher and Maxwell5). The passive over-consumption associated with large food portions could potentially lead to increased EI at the time of eating and over subsequent days, and, if not compensated for, could be a significant factor contributing towards excess weight gain and obesity. Thus, the reliance on self-monitoring to control food and EI to maintain a healthy body weight has becoming increasingly difficult in our obesogenic environment.
Larger food portions have been shown to increase EI in adults at single eating occasions(Reference Rolls, Morris and Roe6–Reference Wansink, Painter and North11) and over the course of 2(Reference Rolls, Roe and Meengs12) and 11 d(Reference Rolls, Roe and Meengs13), under semi-controlled laboratory conditions. To date, only one study(Reference McCarthy, Robson, Livingstone, Kiely, Flynn, Cran and Gibney14) has examined the extent to which large food portions affect EI in free-living populations.
The aim of the present study was to examine the association between the portion sizes of foods consumed with indices of obesity status (BMI and waist action level (WAL)) in free-living adults aged 19–64 years in the British National Diet and Nutrition Survey (NDNS).
Methods
Survey design
The NDNS is a programme of cross-sectional surveys of different age groups designed to be representative of Great Britain. This analysis is based on the survey undertaken between July 2001 and June 2002 in adults aged 19–64 years. The survey methodology has been described in detail elsewhere(Reference Henderson, Gregory and Swan15). Data from the NDNS adult survey were obtained from the UK Data Archive, University of Essex.
Dietary measures
Subjects completed a 7-d weighed dietary record of all foods and drinks consumed both within and outside of the home. Each subject was issued a set of digital food scales and two recording diaries: the ‘home record’ and a smaller ‘eating and drinking away from home’ diary. The subjects were also issued with a pocket-sized notebook for recording any of this information in circumstances where they were reluctant, or it was inappropriate, to carry the ‘eating out’ diary. They were shown how to weigh and record leftovers and how to record any food that was spilt or otherwise lost. The ‘eating out’ diary was intended for use only when it was not possible to weigh the food items. In these cases, the subjects were asked to record as much information as they could about each food item consumed, in particular the portion size consumed and an estimate of leftovers, in addition to descriptions, brand names, price and the time and the place where food was purchased. Intakes of nutrients were calculated from the records of food consumption using the Food Standards Agency nutrient databank(Reference Henderson, Gregory and Swan15). All foods from the NDNS dataset were assigned to thirty different food groups. Twenty-eight of these food groups were calculated by the Office for National Statistics(Reference Henderson, Gregory and Swan15). An additional two food groups – confectionery and soft drinks – were also calculated, because of their potential association with overweight and obesity(Reference Bell and Swinburn16, Reference Ludwig, Peterson and Gortmaker17). Only subjects who consumed the foods from a particular food group were included in the analyses of that food group. The total quantity (g/d) of each food group consumed on a daily basis and median daily portion size of each food group consumed were calculated.
Under-reporting
Using data from the physical activity diaries that were kept concurrently with the dietary record, physical activity levels were calculated to assign the appropriate estimated energy requirements (EER) equation to the individual's activity needs(Reference Rennie, Coward and Jebb18). Physical activity levels were calculated from the time spent in sleep, light, moderate and vigorous intensity activities for each day of recording for each subject. The time spent in each type of activity was multiplied by a metabolic equivalent to give a total metabolic equivalent hours of activity per day. These were summed up to give a mean metabolic equivalent score for the week and were then divided by 24 h to give a physical activity level. The published equations of the 2002 Institute of Medicine of the National Academies were used to calculate EER on an individual basis(19). These equations, which are derived from doubly labelled water energy expenditure data, are sex and age specific, and are based on the age, weight and height of the subject. They categorise four levels of activity: sedentary; low activity; active; very active. Potential misreporting of dietary EI was identified using the following equation:

Anthropometric measurements
Anthropometric measurements recorded have been described previously(Reference Ruston, Hoare, Henderson, Gregory, Bates, Prentice, Birch, Swan and Farron20). Height was measured in duplicate to the nearest 0·1 cm in bare feet using a portable stadiometer (Leicester height measure; CMS Weighing Equipment, Ltd., London, UK). Body weight was measured in duplicate to the nearest 0·1 kg using digital scales. Waist circumference was measured in duplicate to the nearest 0·1 cm midway between the top of the hip bone and the lower rib. The subjects were categorised according to the WHO BMI cut-offs for obesity(2) as follows: normal weight (BMI 18·5–24·9 kg/m2), overweight (BMI 25·0–29·9 kg/m2) and obese (BMI ≥ 30·0 kg/m2). Abdominal obesity categories were defined as WAL, according to Lean et al. (Reference Lean, Han and Morrison21), as follows: men – below action level = 0–93·99 cm, WAL 1 = 94–101·9 cm, WAL 2 = >102·0 cm; women – below action level = 0–79·9 cm, WAL 1 = 80·0–87·99 cm, WAL 2 = >88·0 cm.
Exclusions
At the end of the dietary recording period, the subjects completed questionnaires about illness during the recording period and whether this illness affected their eating. They were also asked questions on whether or not they were dieting to lose weight. Those who reported dieting (n 415) or that illness had affected their eating (n 210) during the recording period were excluded from the analysis. Subjects who were underweight (BMI < 18·5 kg/m2; n 58) and without complete dietary or anthropometry data were also excluded. The analyses were subsequently carried out on 1519 subjects.
Statistical analyses
All analyses were performed using SPSS version 11.5 (Statistical Package for Social Sciences, Chicago, IL, USA). Differences between men and women in baseline characteristics were assessed using t tests; weight-status category, WAL and social class category were assessed by χ2 tests. All the data were assessed for normality and owing to the high level of skewness within the food groups, the groups were split into sex-specific quartiles for analysis. Mann–Whitney U tests were used to assess the differences between men and women for the portion size (g) of food groups consumed. UR between weight-status categories and quartiles of portion size was assessed using ANOVA. Multinomial logistic regression analyses were used to determine the associations between the portion sizes of food groups with weight-status category and WAL. This type of analysis was chosen as the proportion of overweight and obese subjects was much greater than that of the normal weight group; therefore, binomial logistic comparisons between normal weight and overweight/obese were not possible. Models were adjusted for age (model 1), social class, physical activity level (model 2) and model 2 plus UR (percentage of UR as a continuous variable; model 3). If model 1 was NS, no further analyses were done. Analyses were done separately for men and women. Results were considered significant at P < 0·05.
Results
Subjects
Subject characteristics, anthropometric measurements and social class categories of the 1519 subjects (689 men and 830 women) are presented in Table 1. There was no difference in age between the men and women (P = 0·946). Women were significantly shorter (P < 0·001), lighter (P < 0·001), had a lower BMI (P = 0·036) and were more likely to be of normal weight than men (P < 0·001). There were no differences in the proportion of men and women who were classified as either overweight (P = 0·387) or obese (P = 0·705). Significantly more women than men were classified as having ‘WAL 1’ (P < 0·001). No differences were observed in ‘below action level’ (P = 0·110) or ‘WAL 2’ (P = 0·175) between men and women.
(Mean values and standard deviations or percentages)
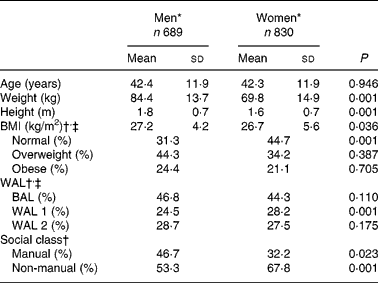
WAL, waist action level; BAL, below action level.
* Data between men and women are compared using independent t tests.
† BMI, WAL and social class categories compared using χ2 tests.
‡ BMI categories are as follows: normal weight, 18·5–24·9 kg/m2; overweight, 25·0–29·9 kg/m2; obese, ≥ 30·0 kg/m2. WAL categories are as follows: BAL – men < 93·99 cm, women < 79·9 cm; WAL 1 – men = 94–101·9 cm, WAL 1 – women = 80·0–87·99 cm; WAL 2 – men>102·0 cm, WAL 2 – women>88·0 cm.
Under-reporting
UR was found to be 34 and 33 % of estimated energy needs in men and women, respectively. UR was found to significantly increase with the weight-status categories (Fig. 1), and was the highest among the obese category in both men and women (37·1 and 38·2 % of energy needs, respectively; P < 0·001) compared with the normal and overweight categories.
Estimated under-reporting as a percentage of energy needs by weight-status category in the British National Diet and Nutrition Survey 2001.  , normal;
  , overweight;
  , obese. Data are presented as mean (sd), and are analysed using ANOVA. Men: normal–overweight, P = 0·014; normal–obese, P < 0·001. Women: normal–overweight, P < 0·001; overweight–obese, P = 0·010; normal–obese, P < 0·001.

Portion sizes
Men had significantly higher median intakes for almost all of the food groups compared with women (Table 2). The exceptions were low-fat milks, yoghurts, vegetables, fruits, juices and nuts, fish and beverages where there were no significant differences between the sexes. In the majority of food groups, the highest level of UR was observed in the lowest quartile of portion size.
(Medians and interquartile ranges (IQR))

* Number and percentage of consumers of food group.
† Data between men and women are compared using Mann–Whitney U tests.
Eating occasions and energy intakes within and outside of the home
Compared with the men, the women recorded significantly more (8·6 (sd 3·4) v. 7·6 (sd 3·6); P < 0·001) in-home eating occasions but recorded significantly less (3·1 (sd 2·7) v. 4·9 (sd 3·2); P < 0·001) out-of-home eating occasions. Table 3 displays the mean daily in-home and out-of-home eating occasions and related EI for men and women across weight-status categories. In-home or out-of-home eating occasions or EI did not vary by weight-status category in men. However, overweight women recorded significantly more in-home eating occasions compared with obese women (P = 0·027), while normal weight women recorded significantly more out-of-home eating occasions compared with overweight women (P = 0·011). EI consumed outside of the home was also significantly higher for normal weight women compared with overweight women (P < 0·001).
(Mean values and standard deviations)
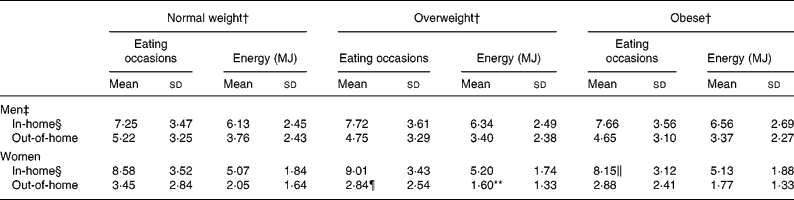
* Data are presented as mean daily eating occasions (frequency) and EI (MJ) per eating occasion by weight-status category. Data across weight-status categories are assessed using ANOVA.
** Significantly different from normal weight out-of-home EI.
† Normal weight (BMI 18·5–24·9 kg/m2), overweight (BMI 25·0–29·9 kg/m2), obese (BMI ≥ 30·0 kg/m2).
‡ Significantly different from women for in-home and out-of-home eating occasions.
§ Significantly different from out-of-home eating occasions.
∥ Significantly different from overweight in-home eating occasions.
¶ Significantly different from normal weight out-of-home eating occasions.
Portion sizes and BMI weight status
Few positive associations were found between the portion sizes of food groups and BMI weight-status category (Table 4). In men, only three positive associations were found (whole milk, potatoes, and fresh meat). When the adjustment was made for UR, a further three food groups (breads and rolls, low-fat spreads and vegetables) became significantly positively associated with weight-status groupings. In women, only two positive associations were found (low-fat spreads and fish). When the adjustment was made for UR, a further four food groups (breads and rolls, low-fat milks, chips and processed potatoes and meat products) became significantly positively associated with weight-status groupings.
Associations between portion sizes (g) of food groups consumed with BMI status category in men and women in the National Diet and Nutrition Survey (NDNS) of British adults 2001*

* Data are analysed using multinomial logistic regression analysis. Numbers represent P values. P values are trends across the BMI categories.
† BMI categories are as follows: normal weight, 18·5–24·9 kg/m2; overweight, BMI 25·0–29·9 kg/m2; obese, BMI ≥ 30·0 kg/m2.
‡ Model 1 adjusted for age, model 2 adjusted for age, physical activity level and social class, and model 3 = model 2+adjusted for percentage of UR. All significant associations are positive. P >0·05 in model 1 is NS.
Portion sizes and abdominal obesity categories
Similar to BMI, few positive associations were found between the portion sizes of food groups with WAL (Table 5). In the men, no positive associations were found until the adjustment was made for UR, when two food groups (breads and rolls and low-fat spreads) became positively associated with WAL. In the women, four food groups (whole milk, chips and processed potatoes, meat products and beverages) were positively associated with WAL. After the adjustment was made for UR, a further three food groups (low-fat spreads, confectionery and soft drinks) were found to be positively associated with WAL.
Associations between portion sizes (g) of food groups consumed and waist action level (WAL) category in men and women in the National Diet and Nutrition Survey (NDNS) of British adults 2001*

BAL, below action level.
* Data are analysed using multinomial logistic regression analysis. Numbers represent P values. P values are trends across the WAL categories.
† WAL categories are as follows: BAL (men < 93·99 cm, women < 79·9 cm); WAL 1 men = 94–101·9 cm, WAL 1 women 80·0–87·99 cm; WAL 2 = men>102·0 cm, WAL 2 women>88·0 cm.
‡ Model 1 adjusted for age, model 2 adjusted for age, physical activity level and social class, and model 3 = model 2+adjusted for percentage of UR. All significant associations are positive.
Discussion
Recently, interest has been focused on the contribution that larger portion sizes may be making to the over-consumption of energy and thus the increasing prevalence of obesity. Studies carried out under semi-controlled laboratory conditions have shown that increasing food portion size can positively influence EI(Reference Rolls, Morris and Roe6–Reference Rolls, Roe, Meengs and Wall8, Reference Rolls, Roe and Meengs12, Reference Rolls, Roe and Meengs13, Reference Rolls, Roe and Meengs22) in the short term, but data on associations between the measures of adiposity with the amounts of foods consumed in free-living populations are extremely limited(Reference McCarthy, Robson, Livingstone, Kiely, Flynn, Cran and Gibney14).
When these associations were examined in the NDNS (2001) adult survey, portions of some food groups (men: breads and rolls, low-fat spreads and vegetables; women: breads and rolls, low-fat milks, chips and processed potatoes and meat products) were not initially significantly positively associated with obesity status (BMI) but became so after the adjustment for the estimated degree of UR of EI. Similarly, five food groups (men: breads and rolls, low-fat spreads; women: low-fat spreads, confectionery and soft drinks) were only positively and significantly associated with abdominal obesity status (WAL) when the model was adjusted for UR of EI. These data demonstrate the importance of taking into account UR when assessing the association between diet and obesity status if false associations are to be avoided.
The present study has shown that in both men and women, irrespective of their weight-status category, the majority of eating occasions reported over the 7-d recording period occurred within the home. Although the reported frequency of in-home eating occasions was higher than out-of-home eating occasions, it is not clear whether this is a true reflection of their usual eating patterns.
Only one previous observational study has attempted to quantify the risk of excess body fatness with food portion sizes of foods consumed by free-living adults(Reference McCarthy, Robson, Livingstone, Kiely, Flynn, Cran and Gibney14). Adiposity was positively associated with the consumption of large portions of specific foods (savoury snacks, butter, full-fat spreads, meat products and dishes and chips and processed potatoes) in Irish adults. By contrast, a different range of food groups (breads and rolls, whole milk, low-fat spreads, chips and processed potatoes, fresh meat, meat products) were positively associated with a higher BMI or waist circumference in British adults. Both studies, however, found that increased portion sizes of specific food groups were associated with increased BMI and WAL. The food groups examined in both studies were very similar and some of these food groups (meat products, chips and processed potatoes) were found to be strongly associated with measures of adiposity in both studies.
Although both surveys were conducted in a representative sample of free-living adults using 7-d dietary record methodology, in the present study food intake was quantified by direct weighing, while the earlier study relied on estimating food weights using standardised portion sizes. To what extent the difference in the methods of assessing portion weights of foods eaten explains these findings are unclear. On the other hand, it may be that there are real dietary differences between the two populations. Both studies adjusted for the potential impact of energy misreporting. McCarthy et al. (Reference McCarthy, Robson, Livingstone, Kiely, Flynn, Cran and Gibney14) used the ratio of EI to estimated BMR (EI:BMR), whereas a more specific calculation using physical activity data and a continuous variable based on collated doubly labelled water energy expenditure data(19) was used in the present analyses. As previously reported, there is a high level of UR in the NDNS(Reference Rennie, Jebb, Wright and Coward23). In the present analyses, UR of energy needs was estimated at 34 and 33 % in the men and women, respectively, and furthermore there was a higher level of UR among overweight and obese adults compared with those of a normal weight adult, which has been previously observed(Reference Heitmann and Lissner24, Reference Prentice, Black, Coward, Davies, Goldberg, Murgatroyd, Ashford, Sawyer and Whitehead25). The adjustment for UR is a vital consideration when assessing possible relationships between dietary intakes and variables of interest, since this may lead to the attenuation of associations when levels of misreporting are high(Reference Livingstone and Black26). The results of the present study emphasised the importance of adjusting for UR when examining the relationships between the portion sizes of food groups consumed with measures of adiposity. The high levels of UR of EI observed in the NDNS and the subsequent adjustment for UR in the statistical models did have an impact on the associations between the portion sizes of food groups consumed with BMI and WAL in both the men and women. If the UR of energy needs had not been adjusted for, the observed associations may have been missed or it could have been concluded that there are no associations between the portion sizes of food groups consumed with obesity status.
A number of issues of UR are pertinent to the present discussion. First, whether misreporting is due, at least partially, by misrepresentation of usual portion sizes consumed. We found that adjustment for UR significantly affected the interpretation of associations between food portion sizes and measures of body fatness (BMI and WAL). Since dietary intake in free-living individuals in studies is self-reported, there is the opportunity for both measurement error and misreporting of food portion size, which in turn affects the estimate of overall EI.
Second, it is possible that any associations were masked by study participants who used the recording period as an opportunity to change their eating behaviour or to diet. Since under-eating while recording food intake has been observed in lean and obese adults(Reference Westerterp and Goris27), we were careful to exclude from the analysis, those subjects who reported dieting during the recording period. Nevertheless, it is likely that the dataset did include subjects who were limiting their intake during the recording period but who consciously or subconsciously failed to declare this. Body weight was only measured once during the recording period; therefore, it was not possible to examine the changes in body weight as a means of detecting under-consumption of food intake.
The third issue is whether UR is associated with the achievement of a self-presentation goal on the part of the study participant. It has been suggested that instead of modifying the diet, specific foods are under-reported or omitted in order to appear in a socially favourable light(Reference Hebert, Clemow, Pbert, Ockene and Ockene28). Lafay et al. (Reference Lafay, Mennen, Basdevant, Charles, Borys, Eschwege and Romon29) suggested that the UR of food intake seems to concern food items that are generally considered ‘bad for health’. This may have been the case in the NDNS, where there may have been a possible tendency to under-report or even exclude the foods that are considered to be ‘unhealthy’ or associated with obesity, such as savoury snacks, creams, ice creams and desserts, biscuits, cakes and soft drinks. However, it was not possible to systematically assess whether there was UR of specific foods in the NDNS as only estimates of UR of EI were feasible. There is also the possibility that foods that were perceived as healthy may have been over-reported; however, there are no available data to support this contention. Consequently, the causal associations between food portion size and obesity remain unclear, owing not only to the cross-sectional nature of food consumption surveys but also to the misreporting of food intake of unknown magnitude and direction.
In the present study, it is highly likely that UR may have masked any true associations between the food portion sizes consumed with measures of obesity. Alternatively, portion sizes of specific foods or food groups in isolation may not be major contributing factors to obesity risk, rather it may be the consumption of a larger range of foods and food groups. Gaining a better understanding of the influence of food portion size on EI and obesity may be a crucial step in identifying a modifiable dietary factor that may be influencing the current epidemic of overweight and obesity.
Acknowledgements
This research was commissioned by the Food Standards Agency (research project N09021). Ethical approval for the NDNS survey was granted by a Multi-centre Research Ethics Committee (MREC). Approval was also sought from National Health Service Local Research Ethics Committees (LREC) in the areas where the fieldwork took place. There are no conflicts of interest. The contributions of the authors were as follows: M. B. E. L. was the principal investigator and is the guarantor. M. T. K. and K. L. R. performed data analysis and wrote the manuscript. M. B. E. L., J. M. W., P. J. R., R. W. W. and M. P. H. F. contributed to data analysis and to the writing of the manuscript.
The present paper forms part of the dissemination of the Food Standards Agency-commissioned research project N09021.



