
In June 2001, the European Council of Gothenburg (Sweden) added an environmental dimension to the Lisbon Agenda, constituting the European plan for sustainable development. Under this new framework, public policies in Europe should adopt a long-term vision to deal with issues such as ratification of the Kyoto Protocol and promotion of renewable energies. In this regard, the European Union (EU) has set a binding target for renewable energy at 20% of the EU's total energy needs by 2020. As Figure 1 shows, renewable energy production has rapidly increased in Europe since 2001. In fact, the contribution of renewables to electricity increased from less than 13% in 2001 to almost 17% in 2008. While hydropower has the lion's share of production of renewable energy, solar power production registered an increase by a factor of 60 over the same period, as illustrated in Figure 2. Finally, Figure 3 ranks renewables by generation cost and shows that solar energy still has great potential for improvement.
Share of Renewable Energies in Total Electricity Consumption in EU-25

Primary Production of Solar Power in EU-25

Base-case Levelized Cost of Energy, First Quarter 2009

Figure 4 shows the “second boom” of the solar industry: after a period of stagnation in the early 1990s, the count of patent applications related to solar energy, which we use as one of the measures of technological progress in this sector, has been booming in the 2000s, going from roughly 100 in 1995 to almost 700 in 2008. This time frame has been deeply analyzed by the induced innovation literature because it coincided with the launch of many public policies in the area of renewable energies in several European countries, as discussed in the next subsection.
Number of EPO Patent Applications in Solar Energy in 11 Countries

Figure 5 confirms that innovation in solar energy is still concentrated in a few countries, namely Germany, Japan, and the United States. According to Dechezlepretre et al. (Reference Dechezleprêtre, Glachant, Hascic, Johnstone and Meniere2011), these three nations covered ⅔ of total innovations in environmentally friendly technologies in 2003, while Japan alone accounted on average for 40% of worldwide “green” innovations. In addition, Peters et al. (Reference Peters, Schneider, Griesshaber and Hoffmann2012) showed that these three countries were among the first movers in the “first boom” of the solar energy (1974–1985) and that they further reinforced their position of leadership in the solar industry during the “second boom” (1995–2008). In this period, Germany became the largest market for photovoltaic (PV) installations, and US patenting activity in this industry grew by more than a factor of eleven, allowing the United States to overtake Japan. Furthermore, these authors answer an interesting question about the location of solar industry activities by providing evidence that policies implemented in one country can benefit innovation in other countries thanks to knowledge spillovers. This issue will also be addressed in this paper by weighting our policy measures based on the intensity of international trade, as explained in the specific section.
Top 3 Countries Ranked by Number of EPO Patent Applications in Solar Energy

Our study aims at investigating the effects of public policies on the rate of innovation in solar energy with a focus on the common framework developed in Europe and includes the top eight European countries in addition to the three industry leaders: Germany, Japan, and the United States.Footnote 1
Technology and Environmental Policy
The relationship between technology and environmental policy has been under scrutiny for the last twenty years. Seminal contributions to this field include Lanjouw and Mody (Reference Lanjouw and Mody1996) and Jaffe and Palmer (Reference Jaffe and Palmer1997). The former found a positive correlation between lagged regulatory compliance costs and patenting activity in environmental technologies, whereas the latter found no significant effect of compliance expenditures on inventive output over twenty-four manufacturing industries across many sectors of the economy. By restricting the analysis only to environmentally related patents and not to overall innovation, Brunnermeier and Cohen (Reference Brunnermeier and Cohen2003) provided evidence of a small positive impact of pollution abatement expenditures on environmental innovation.
Jaffe, Newell, and Stavins (Reference Jaffe, Newell and Stavins2005) showed the design of effective policies in the energy market to be complex because these policies must address not one, but two market failures. The first is the presence of negative externalities in the form of pollution costs that firms do not internalize, thus generating overproduction of electricity from nonrenewable sources, whereas the second is the existence of positive externalities in the form of knowledge spillovers that posit a problem of underproduction in the creation and diffusion of new technologies. Here, public expenditure on R&D can be seen as a source of variety and flexibility, reducing uncertainty that may be associated with research investments, allowing a larger number of trajectories. In particular, Callon (Reference Callon1994) contrasted market forces, which tend to be path-dependent by focusing only on a narrow set of highly profitable alternatives, with government protection that can allow promising research opportunities to grow, thanks to its long-term vision. However, government intervention is not a panacea. To protect against the risk of failure, Jaffe, Newell, and Stavins (Reference Jaffe, Newell and Stavins2005) argued in favor of a portfolio of policies in which technology and environmental policies complement each other and cautioned against the implementation of a single policy that cannot target all the possible future scenarios, which are unpredictable at the beginning of the project. In their extensive literature review of federal research in the field of energy and the environment, the authors found that the benefits of a few successes can justify the overall portfolio investments because R&D investments made in several projects experience different payoffs under different future market conditions.
Carrión-Flores and Innes (Reference Carrión-Flores and Innes2010) provided evidence that technology and environmental policy are not just complements, but they are also jointly determined. Their study showed that causality is not unidirectional because environmental policy can foster innovation, which in return leads to a further tightening of regulation. For this reason, these authors proposed to address the problem of endogeneity of emissions and patent counts by building a structural model of bidirectional links and found that environmental innovation is induced in part by policy, but mainly by technological progress, ultimately resulting in stricter emission standards.
According to IEA (2004), a portfolio of policies has been adopted by several countries to spur the growth of renewable energies. First, support for R&D in the 1970s, then incentives for investing, tax credits, price-support policies, and, finally, tradable certificates. This study focuses on three policy initiatives.Footnote 2 The first is public expenditure on R&D, which is a typical example of a technology-push policy because it stimulates innovation from the supply side by lowering the cost and the risk of private research efforts in this sector. Several European countries along with Japan and the United States have also financed large R&D budgets in solar energy, as shown in Figure 6. The second is feed-in tariffs, which is an example of a demand-pull policy that spurs technical change by specifically targeting the demand for each type of renewable energy. Its objective is to increase market volumes and thus to decrease uncertainty for producers of solar power both by lowering the higher (private) generation costs from each renewable source and by guarantying a fixed amount per kWh for a long period along with access to the grid. After the introduction of feed-in tariffs in Germany and Denmark in the early 1990s, Austria, Greece, Italy, Luxembourg, and Spain have followed this road in the mid-1990s, trailed by France and the Netherlands in the early 2000s. The third and last one is renewable energy targets, which is another example of a demand-pull policy, but more specifically of a command-and-control regulation because it mandates electricity retailers to include a certain portion of total electricity sales from renewable energies, without explicitly distinguishing between them. In this case, firms have their choice of how to comply with this regulation, and they opt for the most cost-effective renewable sources.
Government R&D Budgets in Germany, Japan, and USA in Solar Power

Approach
Induced Technological Change in the environmental field has been studied from several angles since Hicks (Reference Hicks1932) formulated the hypothesis that a change in relative (energy) prices induces innovation by substituting for the factor that has become more expensive. Johnstone, Hascic, and Popp (Reference Johnstone, Hascic and Popp2010) offered a major study regarding the effects of different environmental policies on innovation, with the most comprehensive analysis of patent data in five renewable energies (solar, wind, ocean, geothermal, and biomass) in twenty-five countries from 1978 to 2003. These authors found important differences across technologies: specific policies are needed to develop less-competitive sources such as solar power, while more broad-based policies favor more mature technologies such as wind and geothermal energy. They also concluded that generally policies rather than energy prices play the key role in fostering innovation in these technologies. Nesta, Vona, and Nicolli (Reference Nesta, Vona and Nicolli2014) built on their study by addressing the issue of endogeneity of the policy variables, thanks to the introduction of both within-sample and out-of-sample instruments. In modeling the relationship between technology and environmental policy, we closely follow their approach and add a similar set of instrumental variables to the econometric analysis presented in this paper.
However, none of the studies mentioned in the above literature review accounts for the large fluctuations experienced by the productivity of R&D when oil prices change so abruptly. In fact, omitting a control for the productivity of past innovation could lead to a severe underestimation of the contribution of public policies to technological change in renewable energies. Using patent citations, this paper provides estimates of R&D productivity in solar energy in eleven countries over the period 1990–2008 to address this omitted-variable bias. To our knowledge, this is the first study to contribute to this research question in multiple countries after the pioneering contribution given by Popp (Reference Popp2002), which was limited only to the United States. Despite its limitations, the analysis of this additional variable provides useful insight for governments about the timing of policy instruments – in particular about the appropriate time to adjust public support to solar energy – in reaction to rapidly changing market circumstances. In fact, IEA (2011) estimated that from 2000 to 2010 solar energy was the fastest-growing power technology worldwide, in terms of the annual rate of market growth, making it cost competitive compared to retail electricity prices in some favorable markets. This boom may have resulted in the creation of so-called “PV bubbles” in a few countries, such as Spain, Italy, France, and Germany, where larger-than-expected amounts of PV have been installed. The purpose of introducing an additional control for the productivity of R&D is also to caution policymakers against the implementation of generous subsidies to solar energy (e.g., feed-in tariff payments in Germany amounted to roughly $66 billion in 2010 (Peters et al. Reference Peters, Schneider, Griesshaber and Hoffmann2012)) during a period of rising energy prices, as these policies unintendedly exaggerate the expectations of future market growth.
Data
Dependent variable: Patent data have been widely used as a measure of innovative activity since the pioneering work of Griliches (Reference Griliches1990). For patent statistics, we refer to the European Patent Office (EPO)’s PATSTAT.Footnote 3 The main advantage of this approach is that every patent application is registered using the International Patent Classification (IPC) system, which categorizes inventions by product or process. An IPC code is composed of a letter denoting the IPC section, followed by two-digit number referring to the IPC class, and another letter denoting the IPC subclass (e.g., F03G). Optionally, there is a number (up to 3 digits) indicating the IPC main group and another number (up to 3 digits), separated by a slash, which refers to the IPC subgroup. This classification is thus composed of an alphanumerical code of up to eleven digits that carefully disaggregates the scope of the patent. Following the literature on environmental innovation, in particular the work of Johnstone, Hascic, and Popp (Reference Johnstone, Hascic and Popp2010) and Dechezlepretre et al. (Reference Dechezleprêtre, Glachant, Hascic, Johnstone and Meniere2011), and after consulting the World Intellectual Property Organization classification of renewable energies, we select a set of IPC codes for solar power.Footnote 4
The major shortcoming of this approach is that the propensity to patent inventions varies across countries. In addition, patents do not protect perfectly against imitation, thus lowering the incentives to patent all new ideas. Finally, patent values follow a highly skewed distribution, because only a few are very valuable, while many do not become a commercial success (Nagaoka, Motohashi, and Goto Reference Nagaoka, Motohashi, Goto, Hall and Rosenberg2010). To account for heterogeneity in patent quality, this paper uses patent families rather than the raw count of patent applications. Harhoff, Scherer, and Vopel (Reference Harhoof, Scherer and Vopel2003) regarded a patent family to be the number of jurisdictions in which the same invention seeks protection, and found a significant correlation between the family size of EPO patents and the value of patents, obtained from a survey of German patent holders. In building the dependent variable, we follow Popp, Hascic, and Medhi (Reference Popp, Hascic and Medhi2011), who treated each member of a patent family as a separate invention. Hence, a patent application receives a weight equal to the number of countries where the patent grant has been sought. Here, the intuition is that filing a patent in multiple countries is costly, and therefore only the most valuable inventions will be patented in several offices, as they are expected to accrue enough profits to recover the filing costs. To exclude low-value inventions, our study introduces an additional quality hurdle by including only EPO patents, which have higher filing costs than those filed at any single national patent office in Europe.Footnote 5
As standard in the literature, we use the application year of the patent for our analysis because it signals when the invention is really conceived and because it is a consistent measure over time. According to Harhoof and Wagner (Reference Harhoof and Wagner2009), the time lag between the application and the granting of a patent is not constant over time, because it depends on several factors such as the complexity of the patent and institutional changes at the EPO. For the purpose of our paper, it is worth recollecting that the EPO started its operation in 1978, and the number of patent applications has been increasing considerably since then. Unfortunately, examination capacities at the EPO cannot be adjusted right away because patent examiners have to undergo a lengthy training before achieving the technical knowledge required to operate in their field of expertise. For example, a shortage of examiners has to be blamed for a longer examination period in the late 1990s. On the other hand, computerization of the EPO records (e.g., Espacenet) has significantly shortened the search and examination period in the 2000s.
Renewable energy policies: For the annual budget devoted to R&D in renewable energies, we use data from the International Energy Agency (IEA)’s Energy Technology Research and Development Database.Footnote 6 The IEA sends a questionnaire annually to national administrations, regarding government energy technology R&D budgets, which are calculated by identifying all the budget items involving R&D and measuring or estimating their R&D content in terms of funding. Despite their efforts, coverage of the data depends on the information delivered by national data collectors; unfortunately, it contains several missing observations.
For feed-in tariffs, the source of the data is the IEA's Global Renewable Energy Database, covering different kinds of policy initiativesFootnote 7 , and a survey of literature by Sijm (Reference Sijm2002). For renewable energy targets, we use data from the European Commission,Footnote 8 from the US Department of EnergyFootnote 9 and from the Japanese Minister of Economy, Trade, and Industry.Footnote 10 Finally, the World Bank estimates the variable Tensys to measure the democracy longevity in each country.Footnote 11
Market measures : For the price of electricity, we refer to the IEA's Energy Prices and Taxes Database.Footnote 12 As discussed in the introduction, despite the major increase in the share of electricity generated from renewables in total electricity consumption, hydropower has the lion's share of electricity generation; while other renewable sources such as solar power still have a small proportion of the electricity market and hence cannot significantly influence electricity prices. For this reason, we consider the price of electricity as exogenous. According to IEA (2010), the cost of electricity in the coming years will depend mainly on the costs of raising financial capital and the price of carbon. For electricity consumption we rely on the IEA's Electricity Information Database.Footnote 13 Following Johnstone, Hascic, and Popp (Reference Johnstone, Hascic and Popp2010), we use percentage growth in electricity consumption to measure expectations for future growth in the electricity market. The final dataset contains observations at the country and year level for the top nine European countries, Japan, and the United States over the period 1990–2008 and covers solar power.
Methods
Estimating the Productivity Parameter
As discussed in the introduction, neglecting to control for changes in the usefulness of knowledge over time might cause underestimation of the role of technological change induced by public policies, and overestimation of the positive effects of higher energy prices on environmental innovation. A growing literature, starting with the pioneering contribution of Trajtenberg (Reference Trajtenberg1990), has looked at the number of citations a patent receives as a valid estimator of the knowledge flow available to inventors in any given year. In particular, if a patent receives numerous citations, the knowledge embodied in that patent must have contributed significantly to the technological progress in that particular year. As a consequence, the marginal productivity of research should increase right after a technological breakthrough. To estimate the pattern of R&D productivity over time, our study looks at the probability of being cited for patents granted in any given year.Footnote 14 So, we sort potentially cited patents by year of grant and denote them nCTD, while we rank citing patents by year of application and denote them nCTG.
Hence, the dataset is composed by cohorts of patents sorted by cited years (CTD: 1980– 2008), by citing years (CTG: 1982– 2009), and by technology (j: solar, wind, geothermal, and ocean). For example, one cohort may be composed of the number of citations (csolar) to all solar energy patents granted in 2000 (CTD) made by solar energy patents applied for in 2002 (CTG). As a consequence, the probability of citation for a patent within each cohort is given by:
 $${\rm p}_{{\rm j\comma CTG\comma CTD}} = \displaystyle{{{\rm c}_{{\rm j \comma CTG \comma CTD}}} \over {{\rm n}_{{\rm CTG}}{\rm n}_{{\rm CTD}}}}$$
However, looking at the likelihood of citation alone would be misleading because this probability is affected by other factors that change over time. Following closely the work of Popp (Reference Popp2002), we propose an exponential distribution to estimate the probability of citation among cohort members, where we include the following control variables:
 $$\eqalign{{\rm p}_{{\rm j,CTG,CTD}} & = {\rm \alpha} _{{\rm j,CTD}}{\rm \psi} _{{\rm CTG}}{\rm \gamma} _{{\rm j\;}} {\rm exp} [{{\rm -} {\rm \beta} _{\rm 1}\lpar {{\rm CTG - CTD}} \rpar}] \cr & \quad \times \left\{ {{\rm 1 - exp} [{{\rm -} {\rm \beta} _{\rm 2}\lpar {{\rm CTG - CTD}} \rpar}]} \right\}{\rm +} {\rm \varepsilon} _{{\rm j,CTG,CTD}}}$$
-
• αj,CTD is the parameter on a set of dummy variables that change according to cited years and technology. It represents the likelihood that patents in year CTD and in technological group j will be cited by subsequent patents and measures the marginal productivity of R&D;
-
• ψCTG is the parameter on a set of dummy variables that change according to citing years. It stands for the frequency by which patents in year CTG cite earlier patents, as we fear that several institutional changes at the EPO may influence the likelihood of citations over time. Because these changes would similarly affect all the groups, ψCTG is not indexed by technology;
-
• γj is the parameter on a set of dummy variables that change according to each technology. It is used to control for the breadth of each of the four technological groups, as we expect that the broader the group, the less related the subclasses, and the less likely the citations;
-
• β1 and β2 control for the rate of obsolescence and of diffusion of knowledge, respectively. As time passes by, widening the gap between the citing year (CTG) and the cited year (CTD), two opposite effects contrast. On the one hand, the knowledge embodied in older patents becomes obsolete, less likely to be cited by subsequent inventors because innovations are substituted by newer and better ones. On the other hand, the knowledge embodied in newer patents will become more likely to be cited as it spreads through society.
We estimate this model using nonlinear least squares, and we repeat this regression for all the eleven countries in the study in order to obtain estimates of αj,CTD , which is our parameter of interest.Footnote 15 In fact, an increase of this parameter in one year indicates an improvement of the productivity of research because the knowledge embodied in patents granted in that year proved to be very useful to future inventors, as shown by the higher number of citations.
First we notice that the exponential distribution seems to fit well the citation data. In fact, all the estimates for the productivity parameters in all the technologies are significant. Figure 7 shows the estimates of αsolar,CTD over the period 1980–2008 for Germany, the country leader in terms of solar energy patents. In line with the theory of diminishing returns to research, we find a steady decline of this parameter over time, implying that ever-increasing investments in R&D are required to acquire new knowledge. The renewables cost function is indeed convex in its knowledge stock due to the declining quality of available locations (Fischer and Newell, Reference Fischer and Newell2008). By contrast, a few years of increased productivity can signify periods of recharge; highly productive inventions expand the current technical frontier (Evenson, Reference Evenson1993).
R&D Productivity Estimates for Solar Energy (
![]() solar, CTD) in Germany, Base Year (1980) Normalized to 1
solar, CTD) in Germany, Base Year (1980) Normalized to 1

Furthermore, these results are in line with the conclusions of Popp (Reference Popp2002) and of Newell, Jaffe, and Stavins (Reference Newell, Jaffe and Stavins1999). The former noticed that patenting activity in the energy field in the United States responds quickly to a rise in energy prices, but then it falls due to invention potential exhaustion; the latter found that most of the technological change in the efficiency of air conditioners occurs in the five years following an increase in energy prices. In our case, a rise in marginal productivity occurs in the early 1990s and mid 2000s, a plausible response to contemporaneous soaring energy prices.
Table 1 shows the estimates of the other parameters in the regression for Germany. In this case, we find a rate of obsolescence (β1) and one of diffusion (β2), very similar to those estimated by Jaffe and Trajtenberg (Reference Jaffe and Trajtenberg1996) and by Popp (Reference Popp2002), while there is no clear trend in ψCTG. In fact, we observe an initial increase in these estimates, followed by a slight decrease in the late 1990s, and then a more vigorous increase in the 2000s. These results are consistent with the account given by Harhoof and Wagner (Reference Harhoof and Wagner2009) and could be explained by the institutional changes that occurred at the EPO over this period, as described in the previous section.
Miscellaneous Nonlinear Least-Squares Regression Results for Germany (1982–2009)

Note: Standard errors are given in parentheses.
Once we have obtained the productivity parameters for solar energy (αsolar, t) in each of the eleven countries in the dataset, we use lagged values of this parameter (
![]() it−1) as estimates for the expected marginal productivity of research in a country (i) and at a time (t) in the next section. Because the decrease in the marginal productivity of research seems to be larger when R&D expenditure is higher, often occurring in proximity to a peak in oil prices, it is particularly important to control for this variable when there are large fluctuations in energy prices.
it−1) as estimates for the expected marginal productivity of research in a country (i) and at a time (t) in the next section. Because the decrease in the marginal productivity of research seems to be larger when R&D expenditure is higher, often occurring in proximity to a peak in oil prices, it is particularly important to control for this variable when there are large fluctuations in energy prices.
Estimating the Effects of Public Policies
By including the estimates of the productivity of R&D from the previous section, we can now improve the estimation of the effects of public policies on the development of solar energy in two ways. First, following the induced innovation literature, we can control for supply-side factors (e.g., the productivity of R&D) and demand-side factors (e.g., energy prices). Second, we can include an additional control for changes in the quality of patents. As discussed above, highly valuable patents correspond to those with a higher probability of being cited αj,CTD.
To further explore this correlation, we propose the following econometric model:
 $$\eqalign{F_{{\rm it}} & = \beta _0 + \beta _1{\rm RD}_{{\rm it}} + \beta _2{\rm RET}_{{\rm it}} + \beta _3{\rm TARIFF}_{{\rm it}} + \beta _4{\rm PRICE}_{{\rm it}} + \beta _5{\rm CONS}_{{\rm it}} \cr & \quad + \beta _6{\rm EPO}_{{\rm it}} + {\rm \beta _7} {\hat {\alpha}} _{{\rm it - 1}} + {\rm \nu _i} + {\rm \tau _t} + {\rm \varepsilon} _{{\rm it}}}$$
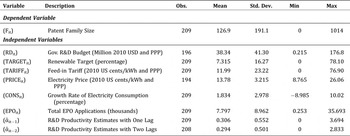
where Fit is the family size of patent applications for solar energy in country (i) and at time (t), RD is the annual public budget devoted to research and development in solar power, RET is the renewable energy target that is a common target to be jointly reached by all renewables, TARIFF is the amount of feed-in tariffs specifically set for solar energy, PRICE is the price of electricity, CONS is the percentage growth of electricity consumption, EPO is the total number of EPO patent applications in each country,
![]() it−1’s are estimates of R&D productivity with one lag, νi is a country-fixed effect, and finally τt’s are year dummies, as summarized in Table 2. As we suspect overdispersion in our dataset, we propose a negative binomial model that ensures positivity for any value of the covariates. This model is necessary because patent family size is a count variable that takes on nonnegative integer values, as in Hausman, Hall, and Griliches (Reference Hausman, Hall and Griliches1984).
it−1’s are estimates of R&D productivity with one lag, νi is a country-fixed effect, and finally τt’s are year dummies, as summarized in Table 2. As we suspect overdispersion in our dataset, we propose a negative binomial model that ensures positivity for any value of the covariates. This model is necessary because patent family size is a count variable that takes on nonnegative integer values, as in Hausman, Hall, and Griliches (Reference Hausman, Hall and Griliches1984).
Description of Variables and Summary Statistics for 11 Countries (1990–2008)
From the perspective of policy measures, the interest is on the coefficients β1, β2, and β3: do countries with higher public expenditures on R&D, higher renewable energy targets, and higher feed-in tariffs also experience an increase in the number of patents? Based on the previous discussion, we expect these coefficients to be positive and significant. From the market perspective, we ask if higher electricity prices can increase the competitiveness of renewable energies with respect to more traditional sources, and if the growth of electricity consumption can promote technological progress by increasing investments from incumbent firms, and also by attracting other innovative firms. In this case, we focus on the coefficients β4 and β5.
Finally, we include several control variables. First, we control for changes in the productivity of R&D by adding lagged estimates (
![]() it−1 or
it−1 or
![]() it−2) obtained in the previous section. We expect β7 to be positive and significant because firms will increase their level of investments in the solar industry after observing a high level of productivity in the previous one or two years. In fact, investors attempt to anticipate the future innovative capacity of the solar industry, and an increase in productivity would generate optimistic beliefs about future larger returns from R&D investments. Second, we control for country effects by adding country dummies (νi’s) and also by including the variable EPO, as we fear that European countries may express a “home bias” in terms of EPO patent applications, not just in solar energy but in all the technological sectors. Third, we add year dummies (τt’s) to control for time trends, such as macroeconomic cycles.
it−2) obtained in the previous section. We expect β7 to be positive and significant because firms will increase their level of investments in the solar industry after observing a high level of productivity in the previous one or two years. In fact, investors attempt to anticipate the future innovative capacity of the solar industry, and an increase in productivity would generate optimistic beliefs about future larger returns from R&D investments. Second, we control for country effects by adding country dummies (νi’s) and also by including the variable EPO, as we fear that European countries may express a “home bias” in terms of EPO patent applications, not just in solar energy but in all the technological sectors. Third, we add year dummies (τt’s) to control for time trends, such as macroeconomic cycles.
Results and Discussion
The overall results support the basic validity of the model, as most of the parameters are estimated precisely both in terms of their expected sign and of reasonable magnitude. Moreover, the presence of overdispersion in the data, which we suspected from the statistics shown in Table 2, is confirmed in Table 3 by the likelihood ratio test of the dispersion parameter that rejects the null hypothesis of equality between the mean and the variance of the dependent variable, making the negative binomial model preferable over the Poisson one.
Estimated Coefficients of the Negative Binomial Model for 11 Countries (1990–2008)

Note: *p ≤ 0.05. **p ≤ 0.01. ***p ≤ 0.001. Country and year dummies are included in all specifications. Huber-White robust standard errors are given in parentheses. Likelihood-ratio tests for model selection: Assumption: Model (1) is nested in (2) LR = 6.64 (Prob. = 0.01). Assumption: Model (1) is nested in (3) LR = 15.24 (Prob. = 0.001)
In particular, the first column of Table 3 shows the results of the regression excluding the estimates of R&D productivity. The coefficients on public R&D and on feed-in tariff are positive and significant for solar power, while the ones on renewable energy target are not significant. As discussed in the introduction, targets are broad policy measures that allow renewable energies to compete against each other to get access to the grid. Because other renewable energies have lower generation costs than solar power, this policy is not particularly effective for solar energy. On the other hand, feed-in tariffs are set specifically to guarantee access to the grid for each renewable source, which contributes to explaining their effectiveness for solar power. This result is the pathway to the second part of the analysis. From a market perspective, we find that the coefficient on electricity prices is positive and significant, while the one on the growth of the electricity market is never significant. We interpret this result as further evidence that solar power is still less competitive than other renewable energies and thus is still sensitive to changes in electricity prices. Furthermore, the coefficient on electricity prices is much larger than the one on feed-in tariffs. Although they both contribute to the development of solar energy from the demand side of the market, their level of correlation is unexpectedly low (0.14). From a policy perspective, the ideal level of correlation would be equal to −1, so that a decrease in feed-in tariffs automatically follows an increase in electricity prices. If this were the case, feed-in tariffs would be a (perfect) substitute of electricity prices: the policy stimulus would not add its effects to the market forces, thus lowering the risk of creating PV bubbles. On the other hand, a low level of correlation between these two variables has the clear advantage of guarantying both a stable policy framework and access to the grid for producers of solar power by reducing the high uncertainty associated with fluctuations in electricity prices.
Finally, all the coefficients on the year dummies are negative, indicating the presence of technological change. Because the base year is 2008, which is the last year included in the analysis, a series of negative signs can be graphically interpreted as an upward intercept shift across time. In particular, this result implies that greater numbers of resources are needed as time passes by, further reinforcing the evidence of diminishing returns to research over time presented in the previous section. However, the comparison between Figures 7 and 8 shows that the estimates of R&D productivity follow a different pattern, and thus patent citations still provide valuable information that is not fully captured by the time trend. The second and third column of Table 3 introduce the R&D productivity estimates with one and two lags, respectively.
Estimated Coefficients on Year Dummies from First Specification of Table 3, Base Year (2008) Normalized to 0

First, we notice that lagged estimates of R&D productivity play a pivotal role in explaining the technological progress of solar energy. In this industry the sign on productivity estimates (αit−1 and αit−2) is positive and significant. Then we observe that the coefficients on public expenditures on R&D and on feed-in tariffs are still statistically significant and increase as more lags are added. These results provide evidence to our intuition that not controlling for changes in the productivity of research over time may attribute a smaller effect on policy measures. By contrast, we find that the coefficient on electricity price is now smaller, a possible sign that a fraction of the contribution attributable to R&D productivity is erroneously bestowed on electricity prices if the productivity estimates are omitted. Table 4 shows the average marginal effects for the variables of interest, which confirm our conclusions.Footnote 16
Average Marginal Effects of the Negative Binomial Model for 11 Countries (1990–2008)

In line with the conclusions of Nesta, Vona, and Nicolli (Reference Nesta, Vona and Nicolli2014), we interpret these results in terms of patent quality. In the case of a supply-side shock, an increase in productivity corresponds to highly valuable patents, those more likely to be cited by subsequent patents. In this instance, new highly productive inventions enter the market, and the effects of public policies become larger as the new knowledge diffuses through society with a delay of one or two years. In the case of a demand-side shock, an increase in energy prices implies a rapid decline in the productivity of research because even the least valuable inventions become feasible when oil prices soar. This second observation is also consistent with Popp (Reference Popp2002), who noticed that some technologies are available before the energy crisis, but they are brought to the market only when energy prices are high enough to justify their introduction. All in all, these results should caution against implementing generous public policies during a period of rising energy prices because their effects risk being short lived due to the rapid decline in the marginal productivity of R&D.
Alternative Specifications
Adding International Knowledge Spillovers
As discussed in the introduction, the locus of innovation might not coincide with the location of solar industry activities. In other words, innovation in solar energy may react both to domestic and foreign policy stimulus. A few studies have looked at the effects of international knowledge spillovers on environmentally friendly technologies. In particular, Popp (Reference Popp2006) found that environmental regulation leads to increased domestic patenting in Germany, Japan, and the United States. Though the author noticed that inventors react mainly to domestic regulations, he argued that foreign knowledge can indirectly be used as an input for domestic innovation, as he observed flows of patent citations across countries. Building on these premises, Verdolini and Galeotti (Reference Verdolini and Galeotti2011) found that a lower geographical distance, greater similarity among countries (even in terms of language) and membership in the same trade area help increase the likelihood of knowledge transfer across borders. In addition, Peters et al. (Reference Peters, Schneider, Griesshaber and Hoffmann2012) examined whether Germany finances the production of solar panels across the globe and found that demand-pull policies implemented in one country benefit innovation in other countries, thanks to knowledge spillovers, while they did not notice a similar effect for technology-push policies. To further investigate this issue, we propose a slightly different specification of the model presented in the previous section:
 $$\eqalign{{\rm F}_{{\rm it}} &= {\rm \beta} _{\rm 0}{\rm +} {\rm \beta} _{\rm 1}\tilde{{RD}}_{{\rm it}}{\rm +} {\rm \beta} _{\rm 2}\tilde{{RET}}_{{\rm it}}{\rm +} {\rm \beta} _{\rm 3}\tilde{{TARIFF}}_{{\rm it}}{\rm +} {\rm \beta} _{\rm 4}{\rm PRICE}_{{\rm it}}{\rm +} {\rm \beta} _{\rm 5}{\rm CONS}_{{\rm it}} \cr & \quad{\rm +} {\rm \beta} _{\rm 6}{\rm EPO}_{{\rm it}}{\rm +} {\rm \beta} _{\rm 7}\hat \alpha _{{\rm it - 1}} + {\rm \beta} _8{\rm KYOT}{\rm O}_{it} + {\rm \nu} _{\rm i}{\rm +} {\rm \tau} _{\rm t}{\rm +} {\rm \varepsilon} _{{\rm it}}}$$
where we weight each national measure of environmental policy ( $\tilde{{RD}}$
,
$\tilde{{RD}}$
, $RE\tilde{{T}}$
, and
$RE\tilde{{T}}$
, and $\tilde{{{\rm TARIFF}}}\rpar \comma$
based on the intensity of international trade.Footnote
17
In line with the aforementioned literature, we focus on European countries, where knowledge spillovers seem to be stronger across the “fallen” borders. Here, the intuition is that the more openness a country exhibits towards trade, especially in the context of a large custom and political union such as the European Union, the more it will benefit from public policies implemented in neighboring states. Following Johnstone, Hascic, and Popp (Reference Johnstone, Hascic and Popp2010), we add a dummy variable (Kyoto), which takes the value of one, beginning in 1998 for countries that ratified the Kyoto protocol. As discussed in the introduction, the Kyoto protocol laid the foundation for the European Council of Gothenburg that established the common policy framework towards sustainable development in the European Union. The results of this alternative specification are shown in Table 5. All the estimated coefficients have the same sign and similar magnitude to the ones presented in Table 3, but the coefficient on Kyoto is negative and not significant, likely due to the high correlation with the policy variables.
$\tilde{{{\rm TARIFF}}}\rpar \comma$
based on the intensity of international trade.Footnote
17
In line with the aforementioned literature, we focus on European countries, where knowledge spillovers seem to be stronger across the “fallen” borders. Here, the intuition is that the more openness a country exhibits towards trade, especially in the context of a large custom and political union such as the European Union, the more it will benefit from public policies implemented in neighboring states. Following Johnstone, Hascic, and Popp (Reference Johnstone, Hascic and Popp2010), we add a dummy variable (Kyoto), which takes the value of one, beginning in 1998 for countries that ratified the Kyoto protocol. As discussed in the introduction, the Kyoto protocol laid the foundation for the European Council of Gothenburg that established the common policy framework towards sustainable development in the European Union. The results of this alternative specification are shown in Table 5. All the estimated coefficients have the same sign and similar magnitude to the ones presented in Table 3, but the coefficient on Kyoto is negative and not significant, likely due to the high correlation with the policy variables.
Estimated Coefficients of the Negative Binomial Model for 11 Countries (Weighted) (1990–2008)

Note: *p ≤ 0.05. **p ≤ 0.01. ***p ≤ 0.001. Country and year dummies are included in all specifications. Huber-White robust standard errors are given in parentheses.
Addressing Endogeneity
In this section we address the endogeneity problem, which may be due to the possibly omitted variables and to the likely two-way causation between the technology and environmental policy, as pointed out by Carrión-Flores and Innes (Reference Carrión-Flores and Innes2010). The literature that follows the reduced-form approach addresses this problem in several different ways. Peters et al. (Reference Peters, Schneider, Griesshaber and Hoffmann2012) preferred a log-linear model; whereas Nesta, Vona, and Nicolli (Reference Nesta, Vona and Nicolli2014) estimated a version of the Poisson specification via a generalized method of moments (GMM). Here, we use the Poisson specification with linear persistency control as our functional form. We prefer to avoid the full log transformation because of the empirical limitations imposed by the many zeros and by the negative values present in our dataset. Furthermore, we suspect our estimators to be heteroskedastic, which may lead to inconsistency when the log transformation is employed.
Following Nesta, Vona, and Nicolli (Reference Nesta, Vona and Nicolli2014), we use two-year lags of the policy variables in addition to the length and durability of the democratic institutions (Tensys), as our instruments. These authors believed Tensys to be a good candidate as an instrument for their application because the level and age of democracy in a country likely affect its policy activities. In particular, countries with well-established democratic systems may also be more responsive to their citizens’ preferences. Following Peters et al. (Reference Peters, Schneider, Griesshaber and Hoffmann2012), we also use public R&D funding for wind power as an instrument. The public funding for wind energy research will likely be correlated with the research funding for solar energy since a government supporting a certain alternative energy source will likely do the same for more than one type of energy. Though, the research funding for wind power will less likely impact the patent activity for solar energy directly.
Having established a set of instruments, we continue our discussion with the estimation strategy that follows Nesta, Vona, and Nicolli (Reference Nesta, Vona and Nicolli2014), who use the pre-sample mean estimator developed by Blundell, Grith, and Vindmeijer (Reference Blundell, Grith and Windmeijer2002). This estimator adds pre-sample information for the left-hand side variable in the Poisson model to account for unobserved heterogeneity, which is traditionally captured by fixed effects in the literature. Blundell et al. (Reference Blundell, Grith and Windmeijer2002) achieved consistency for a large enough pre-sample size, whereas the fixed effects models fail to do so. Pre-sample means per panel units are included in the econometric model to account for persistent differences among them. The estimation is conducted via GMM and our estimating equation is shown below:
 $$F_t={\rm \rho} F_{{\rm t - 1}} + {\rm exp}\lpar {{\tilde X}_t{\rm \beta +} X_t^e {\rm \delta + \theta ln}{\bar f}_p} \rpar + \varepsilon _t$$
where $\tilde X$
are the price of electricity, the percentage growth of electricity consumption, the total number of patent applications, and the first lag of R&D productivity. X
e
are the endogenous policy variables. On the other hand,
$\tilde X$
are the price of electricity, the percentage growth of electricity consumption, the total number of patent applications, and the first lag of R&D productivity. X
e
are the endogenous policy variables. On the other hand, $\bar f_p$
are the pre-sample means, which are calculated by averaging the family size of patent applications (F) per country over the pre-sample period of 1980–1989. Each variable in the equation above is of size equal to the number of countries. Following Nesta, Vona, and Nicolli (Reference Nesta, Vona and Nicolli2014), the first lag of the left-hand side variable is added linearly to be able to bound the always positive exponential function. Apart from X
e
, we assume that all the variables listed above are exogenous. In addition to these, a full set of instruments (Tensys, wind R&D, and
$\bar f_p$
are the pre-sample means, which are calculated by averaging the family size of patent applications (F) per country over the pre-sample period of 1980–1989. Each variable in the equation above is of size equal to the number of countries. Following Nesta, Vona, and Nicolli (Reference Nesta, Vona and Nicolli2014), the first lag of the left-hand side variable is added linearly to be able to bound the always positive exponential function. Apart from X
e
, we assume that all the variables listed above are exogenous. In addition to these, a full set of instruments (Tensys, wind R&D, and $X_{t - 2}^e$
) is included. Finally, we estimate this model using GMM with heteroscedasticity and autocorrelation consistent (HAC) standard errors and present our results in Table 6.Footnote
18
$X_{t - 2}^e$
) is included. Finally, we estimate this model using GMM with heteroscedasticity and autocorrelation consistent (HAC) standard errors and present our results in Table 6.Footnote
18
Estimated Coefficients of the Presample Mean GMM Model for 11 Countries (1990–2008)

Note: HAC robust standard errors are given in parentheses. Elasticities are obtained from the following equivalency: $\displaystyle{{{\rm dlny}} \over {{\rm dlnx}}} \approx {\rm \; } \displaystyle{{{\rm dy}} \over {{\rm dx}}}.\displaystyle{x \over y}$
When compared to the results in Table 3, we notice that the signs of the estimates are the same in Table 6. Hence, our prior conclusions on the directions of the marginal effects still hold. However, we notice differences in the magnitudes of the estimated coefficients, which result from the likely endogeneity and also from the different functional forms, making the coefficients not directly comparable. For this reason, we also present marginal effects, as well as elasticities in Table 6. First, we see that the coefficient on EPO, the total number of patent applications, is now significant. We suspect that the insignificance noted before was due to the country dummies. As explained above, the model presented in this section does not include country-fixed effects. Then, we notice that the marginal effects of the policy variables and of the lagged productivity are different from the ones presented in Table 4. We observe that the estimated average marginal effects are now larger for the three policy variables, and they are all significant. On the other hand, the estimated marginal effect for the lagged R&D productivity is much smaller. Our results indicate that the failure to account for endogeneity amplifies the marginal effect of the lagged productivity, which may be in part due to the two-way causation. Although the estimated average marginal effect is now smaller, the sign is still positive and the effect is still significant, confirming the need to control for the lagged R&D productivity.
In order to assess our findings further, we also calculate elasticities. Among the policy measures, the lowest elasticity is observed for target. This finding supports our earlier argument that targets are broader policy initiatives than tariffs and public R&D funding. Another interesting finding is that the elasticity of the electricity consumption growth is much smaller than the one of electricity price, which is also consistent with our findings from the previous section. In conclusion, we can see that the size of the coefficients changes once we account for endogeneity, but the estimates presented in this section confirm that the policy variables still have a positive and significant impact on patent family size, providing further evidence of the positive effect of environmental policy on technological progress.
Conclusions
This paper delves into the role that relevant changes in the public policy framework played in fostering technological change in solar energy in a panel of eleven countries over the period 1990–2008, which has been regarded as the second boom of this industry in the literature. Three key findings emerge from our empirical analysis and are robust to different specifications. First, specific policies, such as public expenditure on R&D and feed-in tariffs, had a positive and significant impact on the development of solar energy. Second, the price of electricity added its own positive and significant effects to the policy stimulus. Third, the productivity of research, estimated by means of patent citations, significantly affected the rate of innovation of this sector.
Despite its limitations, this study contributes to the vast literature on the development of solar energy by estimating the productivity of R&D in the solar industry for eleven countries and by showing that this variable seems to be a central driver for innovation in this industry. In this paper, we discuss several reasons in favor of introducing this additional control in the model, the most relevant being that the omission of a control for changes in R&D productivity over time leads to an underestimation of the contributions of public policies to innovation in solar energy. In addition, we observe large fluctuations in this variable over time and across countries. This result has important consequences for the timing of policy initiatives. On the one hand, we argue in favor of more active policies in granting support to innovative firms during periods of declining productivity. In this case, the aim of policy initiatives should be to reduce the high volatility in R&D investments that is associated with a negative shock because it can be detrimental to innovation. Hall (Reference Hall and Shane2008) estimated that the wages of highly educated workers account for more than half of private R&D investments. As a consequence, innovative firms face high costs in adjusting their R&D budget over time. In this case, specific policy measures can sustain private research spending during a downturn so that firms can avoid layoffs in their skilled workforce, which constitutes their main asset in the long run, as the firm's knowledge base is embedded in its scientists and engineers. On the other hand, we caution against generous incentives in case of a positive productivity shock, because we fear the creation of other PV bubbles, as discussed in the introduction. For example, Spain, among the first countries to heavily promote solar power generation thanks to implementing high feed-in tariffs, had an installed PV capacity of 4GW in 2008, which is almost ten times more than the official target at that time (IEA, 2011). In this and other recent cases, governments should constraint policy support, so that public intervention facilitates private investment, but it does not crowd it out. In general, our results show an important role for public policies in the development of solar energy, but they also suggest that the level of public support should be adjusted according to the productivity cycle, a point emphasized in more general terms by Aghion and Cagè (Reference Aghion, Cagè, Canuto and Leipziger2012).
Finally, our results reiterate the need to further investigate the causes of shocks to research productivity because it appears that they asymmetrically affect different countries. Initially, Popp (Reference Popp2002) argued that fluctuations in R&D productivity in a total of twenty-two technology groups related to environmental innovations in the United States are synchronized with soaring energy prices. However, this explanation seems not to suffice anymore when the analysis is extended to other countries. In fact, our results suggest that different countries experience productivity shocks in different years. This conclusion is at odds with a single shock caused by a sudden increase in the world oil price that would simultaneously affect all the states.
An interesting extension of this paper would be to build a model of international diffusion of knowledge where countries such as Germany, Japan, and the United States, which are expanding the technological frontier in solar energy, experience the productivity shock before the followers.
Appendix
List of Countries Included in the Analysis
List of IPC Codes Used in the Analysis


 Open access