


Introduction
Host shifts of parasites can lead to biological invasions and result in emerging infectious diseases with devastating effects on the populations of the new hosts (Pimentel et al., Reference Pimentel, Zuniga and Morrison2005; Kumschick et al., Reference Kumschick, Bacher, Evans, Markova, Pergl, Pysek, Vaes-Petignat, van der Veer, Vila and Nentwig2015; Wells and Clark, Reference Wells and Clark2019). A better knowledge of the drivers of host shifts in the natural distribution areas of parasites could help mitigating their negative effects, preventing future invasions (Kolar and Lodge, Reference Kolar and Lodge2001; Woolhouse et al., Reference Woolhouse, Haydon and Antia2005) and can contribute to a better understanding of the coevolution between hosts and parasites (Thompson, Reference Thompson1994). Host shifts can be promoted by high parasite genetic diversity, low host specificity and by introgression between species (Longdon et al., Reference Longdon, Brockhurst, Russell, Welch and Jiggins2014; Depotter et al., Reference Depotter, Seidl, Wood and Thomma2016; Wells and Clark, Reference Wells and Clark2019), all of which can be studied using molecular tools (Criscione et al., Reference Criscione, Poulin and Blouin2005; de Meeus et al., Reference de Meeûs, McCoy, Prugnolle, Chevillon, Durand, Hurtrez-Boussès and Renaud2007).
The Western honey bee, Apis mellifera, is a good model species to study host shifts. Because of the pollination service it provides and its economic importance (Klein et al., Reference Klein, Vaissière, Cane, Steffan-Dewenter, Cunningham, Kremen and Tscharntke2007; Kleijn et al., Reference Kleijn, Winfree, Bartomeus, Carvalheiro, Henry, Isaacs, Klein, Kremen, Gonigle, Rader, Ricketts, Williams, Adamson, Ascher, Báldi, Batáry, Benjamin, Biesmeijer, Blitzer, Bommarco, Brand, Bretagnolle, Button, Cariveau, Chifflet, Colville, Danforth, Elle, Garratt, Herzog, Holzschuh, Howlett, Jauker, Jha, Knop, Krewenka, Le Féon, Mandelik, May, Park, Pisanty, Reemer, Riedinger, Rollin, Rundlöf, Sardiñas, Scheper, Sciligo, Smith, Steffan-Dewenter, Thorp, Tscharntke, Verhulst, Viana, Vaissière, Veldtman, Westphal and Potts2015), colonies of this social insect have been translocated to where beekeepers deemed appropriate and beneficial. Consequently, A. mellifera has been introduced to ecosystems beyond its natural distribution range and frequently exposed to parasites and pathogens never encountered before. In Asia, the ectoparasitic mite Varroa destructor successfully shifted to A. mellifera following its introduction into territories occupied by the Eastern honey bee, Apis cerana, the original host of this parasite (Rosenkranz et al., Reference Rosenkranz, Aumeier and Ziegelmann2010). Lacking the necessary adaptive mechanisms against the parasite, most A. mellifera populations are unable to survive infestations, with negative consequences climaxing in colony failure within a few years (Rosenkranz et al., Reference Rosenkranz, Aumeier and Ziegelmann2010). Subsequently, V. destructor has become the most detrimental biotic threat to A. mellifera by negatively affecting the development of honey bee brood, on which the parasite feeds and reproduces (Rosenkranz et al., Reference Rosenkranz, Aumeier and Ziegelmann2010), and by transmitting viruses (Wilfert et al., Reference Wilfert, Long, Leggett, Schmid-Hempel, Butlin, Martin and Boots2016). This pest has led to the near eradication of wild A. mellifera populations in the Northern hemisphere (Le Conte et al., Reference Le Conte, de Vaublanca, Crausera, Jeanne, Roussellec and Bécarda2007; Jaffé et al., Reference Jaffé, Dietemann, Allsopp, Costa, Crewe, Dall'Olio, de la Rúa, El-Niweiri, Fries, Kezic, Meusel, Paxton, Shaibi, Stolle and Moritz2009) and to high losses of managed colonies worldwide (Genersch et al., Reference Genersch, Von der Ohe, Kaatz, Schroeder, Otten, Büchler, Berg, Ritter, Mühlen, Gisder, Meixner, Liebig and Rosenkranz2010; Guzmán-Novoa et al., Reference Guzmán-Novoa, Eccles, Calvete, Mcgowan, Kelly and Correa-Benìtez2010; Le Conte et al., Reference Le Conte, Ellis and Ritter2010; Nguyen et al., Reference Nguyen, Ribière, vanEngelsdorp, Snoeck, Saegerman, Kalkstein, Schurr, Brostaux, Faucon and Haubruge2011; Smith et al., Reference Smith, Loh, Rostal, Zambrana-Torrelio, Mendiola and Daszak2013) with high economical and societal costs (Kumschick et al., Reference Kumschick, Bacher, Evans, Markova, Pergl, Pysek, Vaes-Petignat, van der Veer, Vila and Nentwig2015).
Since V. destructor invaded Europe and the Americas in the 1970s and 1980s, an intense research activity on its biology in A. mellifera has been undertaken with the main aim of finding effective control methods to protect colonies (Rosenkranz et al., Reference Rosenkranz, Aumeier and Ziegelmann2010; Dietemann et al., Reference Dietemann, Pflugfelder, Anderson, Charrière, Chejanovsky, Dainat, de Miranda, Delaplane, Dillier, Fuch, Gallmann, Gauthier, Imdorf, Koeniger, Kralj, Meikle, Pettis, Rosenkranz, Sammataro, Smith, Yañez and Neumann2012). Comparatively, little attention has been devoted to the interaction between Varroa spp. mites and their original host, A. cerana (Dietemann et al., Reference Dietemann, Pflugfelder, Anderson, Charrière, Chejanovsky, Dainat, de Miranda, Delaplane, Dillier, Fuch, Gallmann, Gauthier, Imdorf, Koeniger, Kralj, Meikle, Pettis, Rosenkranz, Sammataro, Smith, Yañez and Neumann2012; Wang et al., Reference Wang, Lin, Dietemann, Neumann, Wu, Hu and Zheng2018), despite the fact that several other mite haplotypes shifted host (Beaurepaire et al., Reference Beaurepaire, Truong, Fajardo, Dinh, Cervancia and Moritz2015; Roberts et al., Reference Roberts, Anderson and Tay2015). Although they did not yet lead to new large-scale invasions, these new shifts show the propensity of the mite genus to generate more ecological and economic problems. Even though high genetic diversity has been shown in the genus Varroa (Anderson and Fuchs, Reference Anderson and Fuchs1998; de Guzman et al., Reference de Guzman, Rinderer, Stelzer and Anderson1998; Anderson and Trueman, Reference Anderson and Trueman2000; Warrit et al., Reference Warrit, Smith and Lekprayoon2006; Navajas et al., Reference Navajas, Anderson, de Guzman, Huang, Clément, Zhou and Le Conte2010; Beaurepaire et al., Reference Beaurepaire, Truong, Fajardo, Dinh, Cervancia and Moritz2015; Roberts et al., Reference Roberts, Anderson and Tay2015), little knowledge currently exists on host specificity and their potential to hybridize, making it difficult to evaluate risks for new host shifts and invasions. Indeed, previous studies in the endemic range of Varroa spp. rarely reported whether the mites collected were reproducing in their host brood, preventing a systematic evaluation of host specificity (see Roberts et al., Reference Roberts, Anderson and Tay2015 for an exception). In addition, the genetic markers used to define species and haplotype distribution of these mites (i.e. mitochondrial markers), do not allow for the detection of introgression. Indeed, mitochondrial DNA is maternally inherited and only reflects maternal gene flow (Harrison, Reference Harrison1989), giving only a partial picture of population structure. Even though paternal transmission can seem insignificant due to the reproductive system of the Varroa mites (mother mites produce one son and several daughters that mate together in the brood cells, Rosenkranz et al., Reference Rosenkranz, Aumeier and Ziegelmann2010), recent studies showed that paternal gene flow is not negligible. In fact, reproduction can occur between inbred lineages when occupying the same cell (Beaurepaire et al., Reference Beaurepaire, Krieger and Moritz2017a). Therefore, the use of nuclear DNA markers such as microsatellites can help completing the picture by unravelling finer levels of genetic structuring of populations than mitochondrial DNA (Beaurepaire et al., Reference Beaurepaire, Truong, Fajardo, Dinh, Cervancia and Moritz2015; Roberts et al., Reference Roberts, Anderson and Tay2015).
Here, we studied the population genetic structure of V. destructor and Varroa jacobsonii mites in Thailand using both mitochondrial DNA and microsatellite markers to unravel phenomena promoting host shifts. In this country, the sympatric occurrence of the two hosts and several mite species (Warrit et al., Reference Warrit, Smith and Lekprayoon2006) leads to opportunities for host shifts. Yet, in the former study, a single mite was sampled per colony and a small fragment of the COI gene (328 bp) was used to determine the prevalence of mite haplotypes and species. We conducted a more intense sampling at a local scale and observed the ability of these mites to reproduce on the host they were collected from by monitoring their reproductive status. This allowed us to increase chances of detecting phenomena that promote host shifts (e.g. drifting of mites, introgression) or host shifts per se (e.g. reproduction in a new host's brood). Surveying the distribution of mitochondrial haplotypes in the same regions as Warrit et al. (Reference Warrit, Smith and Lekprayoon2006) more than a decade later, we also assess temporal changes in population structure. Our results show that genetic structure and host specificity in the genus Varroa is more labile than previously thought. We detected the occurrence of several phenomena promoting host shifts, which could represent a threat to the honey bee populations of Asia and beyond.
Methods
Populations, sampling
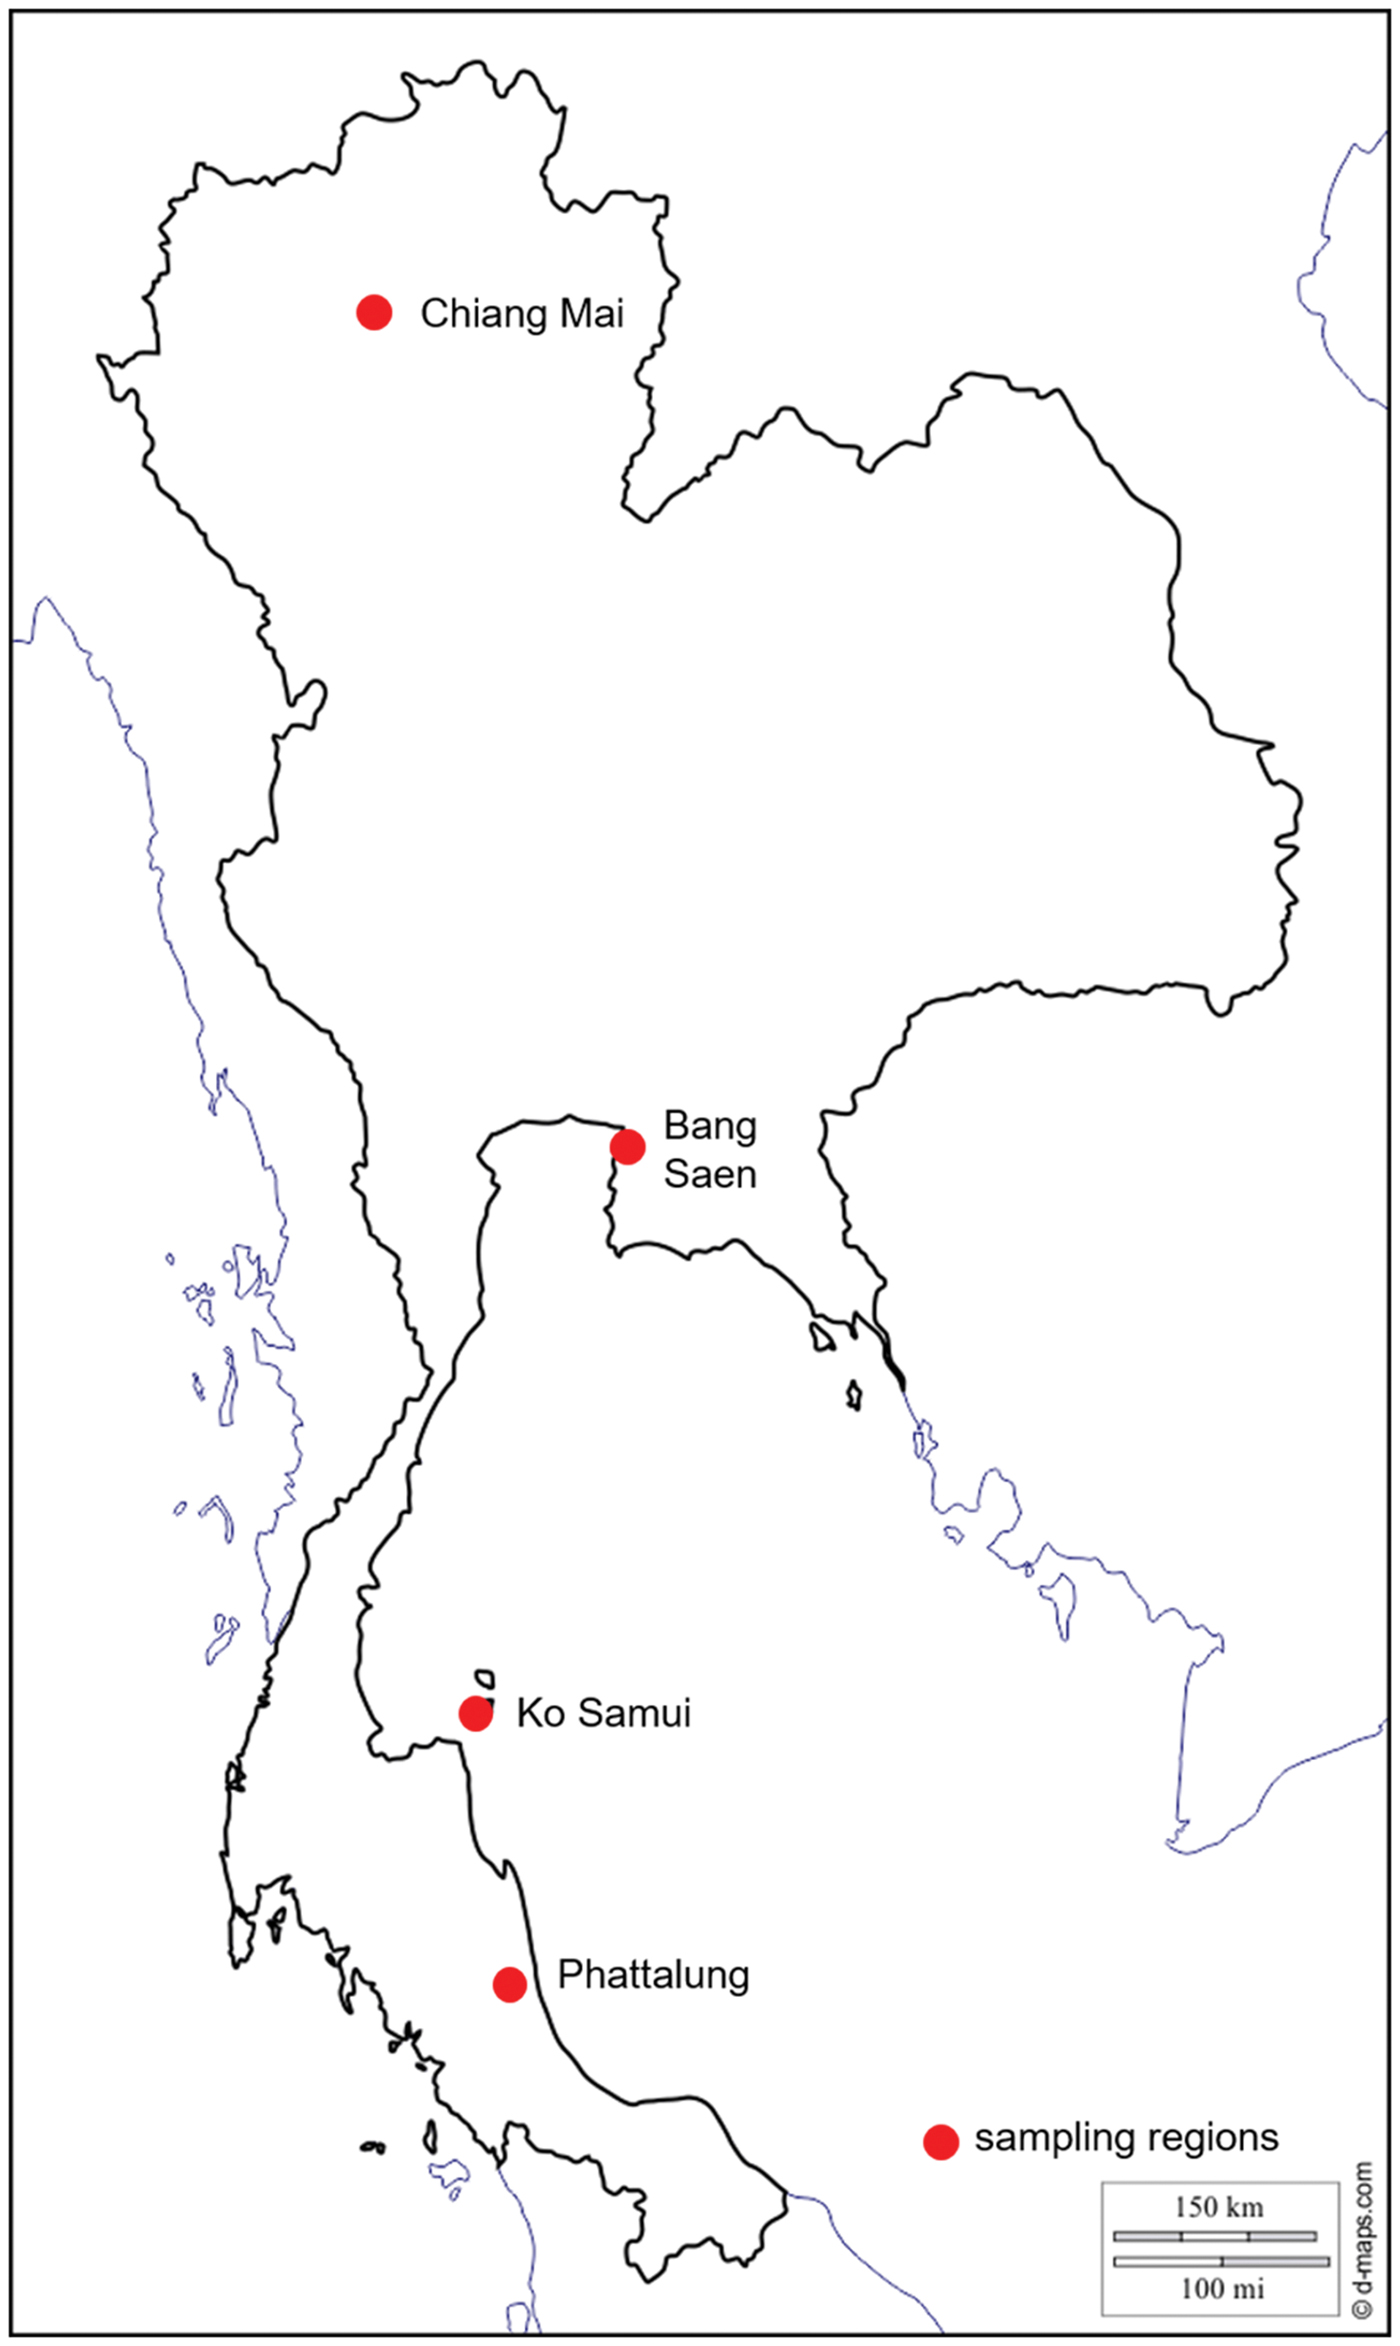
Between 2013 and 2015, 200 Varroa spp. mites were collected from drone brood cells of A. cerana in one to five apiaries from four regions of Thailand (Table 1, Fig. 1): (1) Chiang Mai (North) where V. jacobsonii haplotype North Thai and V. destructor Vietnam were reported in A. cerana (above 1000 m for the latter); (2) Bang Saen (Chon Buri, central Thailand) with V. jacobsonii haplotype North Thai; (3) Ko Samui (island) with V. jacobsonii Samui; (4) Phattalung (South) with V. jacobsonii Malay (Warrit et al., Reference Warrit, Smith and Lekprayoon2006). North of the Isthmus of Kra (North and centre locations), A. mellifera hosting the host shifted lineage of V. destructor Korea can be found. A sample of 172 mites was thus collected from drone and worker brood cells of A. mellifera in Chiang Mai and Bang Saen (Table 1, Fig. 1). Although A. mellifera is occasionally kept south of the Isthmus, they do not survive there for long periods and have to be imported regularly from the North (P. Chantawannakul unpublished) and were therefore not screened in this region.
Map of Thailand showing the sampling locations (see Table 1). In the text, these locations are referred to as North for Chiang Mai, centre for Bang Saen, island for Ko Samui and South for Phattalung. Apis mellifera colonies were screened in the North and centre and Apis cerana at all locations.
Sampling region, host species of origin and number of Varroa spp. mites genotyped for mtDNA and microsatellites. The table also indicates the numbers of mite drifts between host species and of introgression events between mite species

Drift and introgression were identified based on mitochondrial DNA and microsatellite data. Introgression was first detected based on the Instruct results and then verified by visual inspection of the mite genotypes (Table S8). ‘Likely’ hybrids were identified based on a probability over 5% of belonging to the other cluster revealed by Instruct. A less conservative threshold set at 2.5% probability identified further ‘less likely’ hybrids.
Mite reproductive status
Upon opening of infested host brood cells, the reproductive state of mite foundresses was determined (Dietemann et al., Reference Dietemann, Nazzi, Martin, Anderson, Locke, Delaplane, Wauquiez, Tannahill, Frey, Ziegelmann, Rosenkranz and Ellis2013). The occurrence of at least one offspring of any sex confirmed that the foundresses were fertile, unless host developmental stage preceded oviposition. These cases, together with infertile foundresses were considered as non-reproductive. Percentage of reproductive foundresses is reported out of the total number of foundress mites found (fertile and non-reproductive). Mites were placed in 75% EtOH and frozen at −20 °C until DNA extraction.
DNA extraction
DNA of individuals used for sequencing were extracted with phenol-chloroform (N = 193; Evans et al., Reference Evans, Schwarz, Chen, Budge, Cornman, de la Rúa, de Miranda, Foret, Foster, Gauthier, Genersch, Gisder, Jarosch, Kucharski, Lopez, Lun, Moritz, Maleszka, Muñoz and Pinto2013) and with TaKaRa lysis buffer for microorganisms (N = 32; Takara Bio Inc., Otsu, Japan). For the latter, the tubes were heated at 65 °C for 30 min and then at 100 °C for 10 min before adding 40 µL double distilled H20. The tubes were then vortexed and centrifuged. Ten microlitres of 2X GenStar PCR-ready mix (with Taq + loading dye), 7 µL double distilled H20, 1 µL forward, 1 µL reverse primers and 1 µL of DNA extract was added to PCR tubes. Total DNA of mites collected in Bang Saen (n = 51) was isolated according to Beaurepaire et al. (Reference Beaurepaire, Krieger and Moritz2017a). DNA of individuals used for microsatellite analyses (N = 164) were extracted with Chelex: the ethanol used to preserve the mites was rinsed twice in double distilled H2O and each mite was placed individually in 100 µL 5% Chelex solution in a 96 well plate and crushed with a pestle. Finally, 5 µL proteinase K were added and the plate was placed in a thermocycler with standard Chelex cycling conditions (Walsh et al., Reference Walsh, Metzger and Higuchi1991).
PCR amplification and sequencing
PCR assays were performed to amplify regions of the cytochrome oxidase subunit I (cox1) gene of the mites sampled from the North, South and island locations (Evans et al., Reference Evans, Schwarz, Chen, Budge, Cornman, de la Rúa, de Miranda, Foret, Foster, Gauthier, Genersch, Gisder, Jarosch, Kucharski, Lopez, Lun, Moritz, Maleszka, Muñoz and Pinto2013; Table S1). The analyses were performed by using MyTaq™ kit (Bioline, London, UK) following the manufacturer's recommendations. Briefly, 2 µL 10-fold-diluted of the extracted DNA, 5X reaction buffer, forward and reverse primers (final concentration of 0.4 µ m each) and Taq polymerase (0.63 units) were mixed in 25 µL final reaction volume. Primers given in Table S1 were used to produce 380 and 800 bp amplicons.
The PCR cycling protocols are given in Table S2. The PCR products were analysed with a 2% two-dimensional agarose gel electrophoresis. The gels were stained GelRed (Biotium, Hayward, CA, USA) for visualization under UV light. The PCR products were purified using the NucleoSpin® Gel and PCR Clean-up kit (Macherey-Nagel, Co., Düren, Germany) following the manufacturer's recommendations. Purified PCR products were commercially sequenced. Each PCR product was sequenced in both directions.
Haplotype network analyses
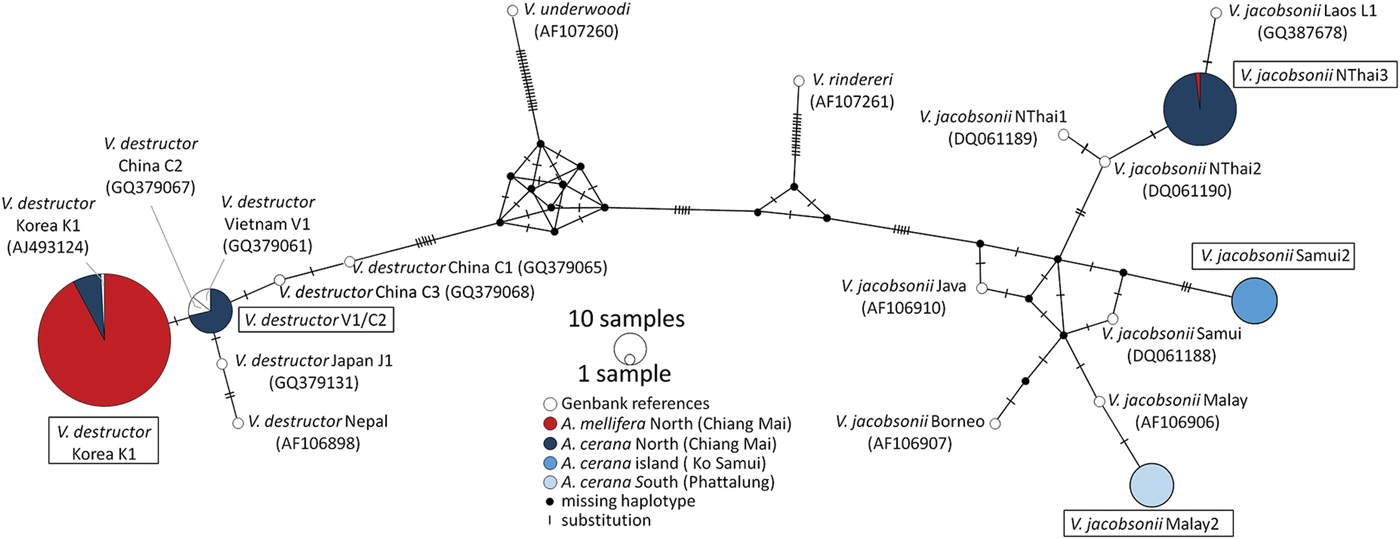
A dataset including the overlapping region of the 380 and 800 bp sequences together with GenBank references (Anderson and Trueman, Reference Anderson and Trueman2000; Warrit et al., Reference Warrit, Smith and Lekprayoon2006; Navajas et al., Reference Navajas, Anderson, de Guzman, Huang, Clément, Zhou and Le Conte2010) was generated (Fig. 2). Median-Joining haplotype networks of this 290 bp region were obtained in PopART with epsilon = 0 (http://popart.otago.ac.nz).
Haplotype Network (Median-Joining) based on mtDNA of Varroa spp. sampled in three regions of Thailand (Chiang Mai, Ko Samui, Phattalung, Table 1) and from reference collections (Anderson and Trueman, Reference Anderson and Trueman2000; Warrit et al., Reference Warrit, Smith and Lekprayoon2006; Navajas et al., Reference Navajas, Anderson, de Guzman, Huang, Clément, Zhou and Le Conte2010). Haplotypes detected during the present survey are highlighted with a box. Reference samples are shown without boxes and followed by their accession numbers between parentheses. Host species of origin are coded with colours: red for A. mellifera and blue for A. cerana. Location latitude is coded with shades: dark to light from north to south.
The sequence of one representative mite per host species and region was uploaded to GenBank with the accession numbers MN179648–MN179654.
Microsatellite DNA analyses
Varroa spp. mites collected at all locations were genotyped at eight DNA microsatellite loci (VD305, VD307, VD112, VJ292, VJ294, Vdes-01, Vdes-02, Vdes-04; Evans, Reference Evans2000; Solignac et al., Reference Solignac, Cornuet, Vautrin, Le Conte, Anderson, Evans, Cros-Arteil and Navajas2005) using the Fragment Profiler software V. 1.2 of the MEGABACE DNA Analysis System (GE Healthcare Life Science, Buckinghamshire, England). Samples with missing information for more than three loci were excluded, resulting in a dataset of 147 mites (Table 1). Hardy–Weinberg equilibrium and linkage disequilibrium tests were performed within samples for each marker using Fstat V. 2.9.3 (Goudet, Reference Goudet1995).
Identification of drifters
To identify putative drifters (mites found in colonies of an atypical host, i.e. V. destructor Korea in A. cerana and V. jacobsonii in A. mellifera), an analysis not relying on a priori information was conducted with the software InStruct (Gao et al., Reference Gao, Williamson and Busta-mante2007). InStruct is an alternative to the software STRUCTURE (Pritchard et al., Reference Pritchard, Stephens and Donnelly2000) that can handle analyses of inbred or partially self-fertilizing species, as is the case for Varroa spp. The number of clusters in the dataset (K) varied from 1 to 12 and 20 chains for each run were performed with 50 000 burn-in iterations and 100 000 total iterations for each chain using the Admixture model. The most likely number of clusters was then estimated manually following the method described in Evanno et al. (Reference Evanno, Regnault and Goudet2005). The results of the runs were combined with the software CLUMPP (Jakobsson and Rosenberg, Reference Jakobsson and Rosenberg2007) and the software Distruct (Rosenberg, Reference Rosenberg2004) was used to draw the corresponding figures. To match the genotype clusters to known mite species using the nucleotide BLAST tool on the NCBI platform (Altschul et al., Reference Altschul, Gish, Miller, Myers and Lipman1990), a subset of 15 mites used in the microsatellite analysis were sequenced with the 929 bp COI primer from Navajas et al. (Reference Navajas, Anderson, de Guzman, Huang, Clément, Zhou and Le Conte2010). See section ‘Mitochondrial DNA analysis’ for methodology.
Identification of hybrids
To identify hybrids between V. destructor and V. jacobsonii, the cluster membership probabilities of each individual over the 20 chains obtained for K = 2 with the software CLUMPP were compared. Individuals with a probability to belong to both clusters superior to 5% was considered as a likely hybrid. Any individual with a probability superior to 2.5% to belong to two clusters was considered as a less likely hybrid. Introgression of alleles was then confirmed based on the occurrence of heterospecific alleles, i.e. common to the two species. When the allele frequency in one of the species was 5-fold that of the same allele in the other species, we considered that the allele very likely belonged to the former species. When the ratio of allele frequencies was below five, we did not propose an origin for the allele.
Analyses of the genetic diversity and population structure
To estimate the level of genetic diversity and population structure of the different Varroa taxa found in Thailand, all drifters identified by InStruct were removed from the dataset. The number of alleles (N A), allelic richness (R) and the expected (H e) and observed heterozygosity (H o) indexes were then calculated for each mite group sampling location using the software Fstat V. 2.9.3 (Goudet, Reference Goudet1995).
Several estimates of genetic differentiation (F ST, G ST, D est) were calculated using GenAlex V. 6.503 (Jost, Reference Jost2008; Peakall and Smouse, Reference Peakall and Smouse2012). F ST index quantifies how the reduction in gene flow among populations affects their level of heterozygosity. In addition, it reflects the variance in allele frequencies for markers with two alleles. When markers have more than two alleles, interpreting F ST is more challenging (Jost, Reference Jost2008). We nevertheless report F ST since it is the most commonly used estimate of the reduction in heterozygosity due to population structure in population genetics studies (Whitlock, Reference Whitlock2011). To work around this bias, we also calculated G ST, which is a corrected estimate of F ST, adjusted for markers with more than two alleles (Nei, Reference Nei1973). A third estimate, Jost's D est (Jost, Reference Jost2008) was calculated. It focuses on variance in allele frequencies among populations. Thus, we report the three estimates to provide complementary information on the genetic differences among the mites of the different populations as recommended in Meirmans and Hedrick (Reference Meirmans and Hedrick2011). In case several individuals sharing the same genotype were found in a colony, only one sample was included to estimate levels of genetic differentiation in order to avoid biasing the analysis with highly related individuals. This led to the exclusion of 25 individuals, leaving 116 for the analyses.
In addition, a pairwise distance-based AMOVA with 1000 permutations was performed for each species using the software Arlequin V.3.5.1.3 (Excoffier et al., Reference Excoffier, Laval and Schneider2005). These analyses were based on the microsatellite dataset without drifters but with putative hybrids and individuals sharing the same genotype to identify the distribution of genetic variation in each species.
Finally, a Principal Component Analysis (PCA) was conducted on the same dataset to identify the main genetic clusters among the mite samples. Since we were interested in the occurrence of putative hybrids, we performed the PCA including the data of both species. The R package Adegenet (Jombart, Reference Jombart2008) in R v. 3.5.2 (R core Team, 2018) was used.
Results
Mite distribution and reproduction
With a single exception, mitochondrial DNA sequences of the mites collected from A. mellifera colonies in North Thailand (N = 118) were identified as the V. destructor Korean haplotype 1 (K1) (Figs 2 and 3). Twenty eight of these mites (24%) had reproduced, while the remaining mites (N = 89) either had not reproduced or were collected from early host brood stages on which reproduction is not yet detectable. The exception was a non-reproductive V. jacobsonii mite in an A. mellifera colony (Table 1). This individual belonged to a novel haplotype that we named NorthThai3.
Average (±s.d.) allelic richness vs heterozygosity in Varroa spp. mite populations of two host species (Am: Apis mellifera, Ac: Apis cerana) in four regions of Thailand.

Varroa destructor K1 mites were also found in two years in ten drone brood cells of four A. cerana colonies in the North (Fig. 2). Eight of these mites (80%) had successfully produced offspring (Table 1). In A. cerana colonies screened in this region, we also found V. destructor of the Vietnam haplotype 1 (V1) or of the China haplotype 2 (C2, the region sequenced did not allow for discriminating between these haplotypes, Fig. 2). Three of the V1/C2 mites (60%) had reproduced in drone cells. The haplotype found most frequently (75%) in A. cerana colonies in the North was the newly described V. jacobsonii NorthThai3 (Fig. 2). It differed from NorthThai1 and NorthThai2 identified by Warrit et al. (Reference Warrit, Smith and Lekprayoon2006) in two and one nucleotides, respectively, and from the Laos mite haplotype L1 in one nucleotide (Fig. 2). Twenty-six of these mites (53%) had reproduced on drone brood. In the South, the mites found in A. cerana colonies differed from the V. jacobsonii Malay haplotype (Warrit et al., Reference Warrit, Smith and Lekprayoon2006) by one nucleotide (Fig. 2). We named this new haplotype Malay2. Thirteen of these mites (72%) had produced offspring in infested drone cells. Similarly, the V. jacobsonii mite haplotype collected from A. cerana colonies on the island differed from that reported earlier. We found a difference of four nucleotides and this newly reported haplotype was called Samui2 (Fig. 2). Eleven of the Samui2 mites (55%) collected from drone brood were fertile. The haplotype network inferred several haplotypes that were not sampled during our screening.
MtDNA genotyping showed that four A. cerana colonies in the North were infested by the two mite species simultaneously (Table 1). One of these colonies was infested with V. jacobsonii NorthThai3 as well as with two haplotypes of V. destructor (K1 and V1/C2). Each of these mite species and haplotypes reproduced on drone brood in at least one occurrence in these four colonies.
Genetic diversity and population structure of Varroa spp. in Thailand
Out of the eight microsatellites we used, none of the locus pairs was significantly linked after Bonferroni correction (Table S3). These markers were polymorphic, with a range of 3–16 alleles per locus (8.9 ± 4.3, mean ± s.d., Table S4). The average allelic richness per locus varied from 2.1 to 6.4 (4.7 ± 1.5, mean ± s.d., Table S5). With the exception of low values for V. jacobsonii Samui2, the two genetic diversity parameters were inferior by a factor 2 in V. destructor compared to V. jacobsonii (Tables S4 and S5, Fig. 3). Given the low observed level of heterozygosity (H o, Table S6), none of the populations sampled were at a Hardy–Weinberg equilibrium. Notably, H o was higher by a factor 2 in V. jacobsonii than in V. destructor, again with the exception of V. jacobsonii Samui2 (Table S6, Fig. 3). The V. jacobsonii in the North had the high allelic richness typical of the other continental V. jacobsonii but associated with heterozygosity values as low as that of the island population (Fig. 3).
The analysis of population structure using InStruct showed that the most likely number of clusters in our dataset is K = 2 (ΔK2 = 915.4). Plotting the individuals belonging to the two genetic clusters revealed a strong host specificity at most locations (Fig. 4). However, untypical host–parasite pairs (N = 5 in A. cerana and N = 1 in A. mellifera) were detected in the North of the country (Fig. 4). Since a portion of the individuals that were genotyped were also sequenced, microsatellite data could be associated with mtDNA haplotypes (Table S7). To do so, the nucleotide BLAST tool was used to match the individuals to known Varroa species. This analysis revealed that the individuals sampled in A. mellifera colonies shared >99.70% identity with V. destructor (GenBank accession GQ379056.1, 100% query cover) and that mites sampled in A. cerana colonies shared >98.90% identity with V. jacobsonii (GQ387678.1, 96–98% query cover, Table S7).
Results of population structure InStruct analysis of Varroa spp. mites infesting A. cerana and A. mellifera in Thailand. The Y-axis represents the likelihood for each individual to belong to a genetic cluster. Each cluster is represented by a distinct colour. The X-axis shows the different individuals, their location (North, centre, South or island) and host (Apis mellifera or Apis cerana).

Individuals with a probability of belonging simultaneously to the two clusters above 5% (likely hybrids) were found in A. cerana in the North (N = 1) and the South (N = 1) and in both hosts in the centre (N = 3, Fig. 4, Table S8). Lowering the cut-off to 2.5% revealed five additional less likely hybrids in the southern population of A. cerana. Visual inspection of the genotype of these individuals confirmed the presence of shared alleles in all these individuals and identified an additional seven putative hybrids. Shared alleles occurred at one or at up to three markers simultaneously in these individuals (Table S8, Tables 1 and 2).
Allele frequencies per microsatellite locus and ratio of frequencies between V. destructor and V. jacobsonii

*: alleles rare in V. destructor but common in V. jacobsonii; **: alleles rare in V. jacobsonii but common in V. destructor (ratio of higher/lower frequency >5). ***: alleles common to both species but of uncertain origin (ratio of higher/lower frequency <5).
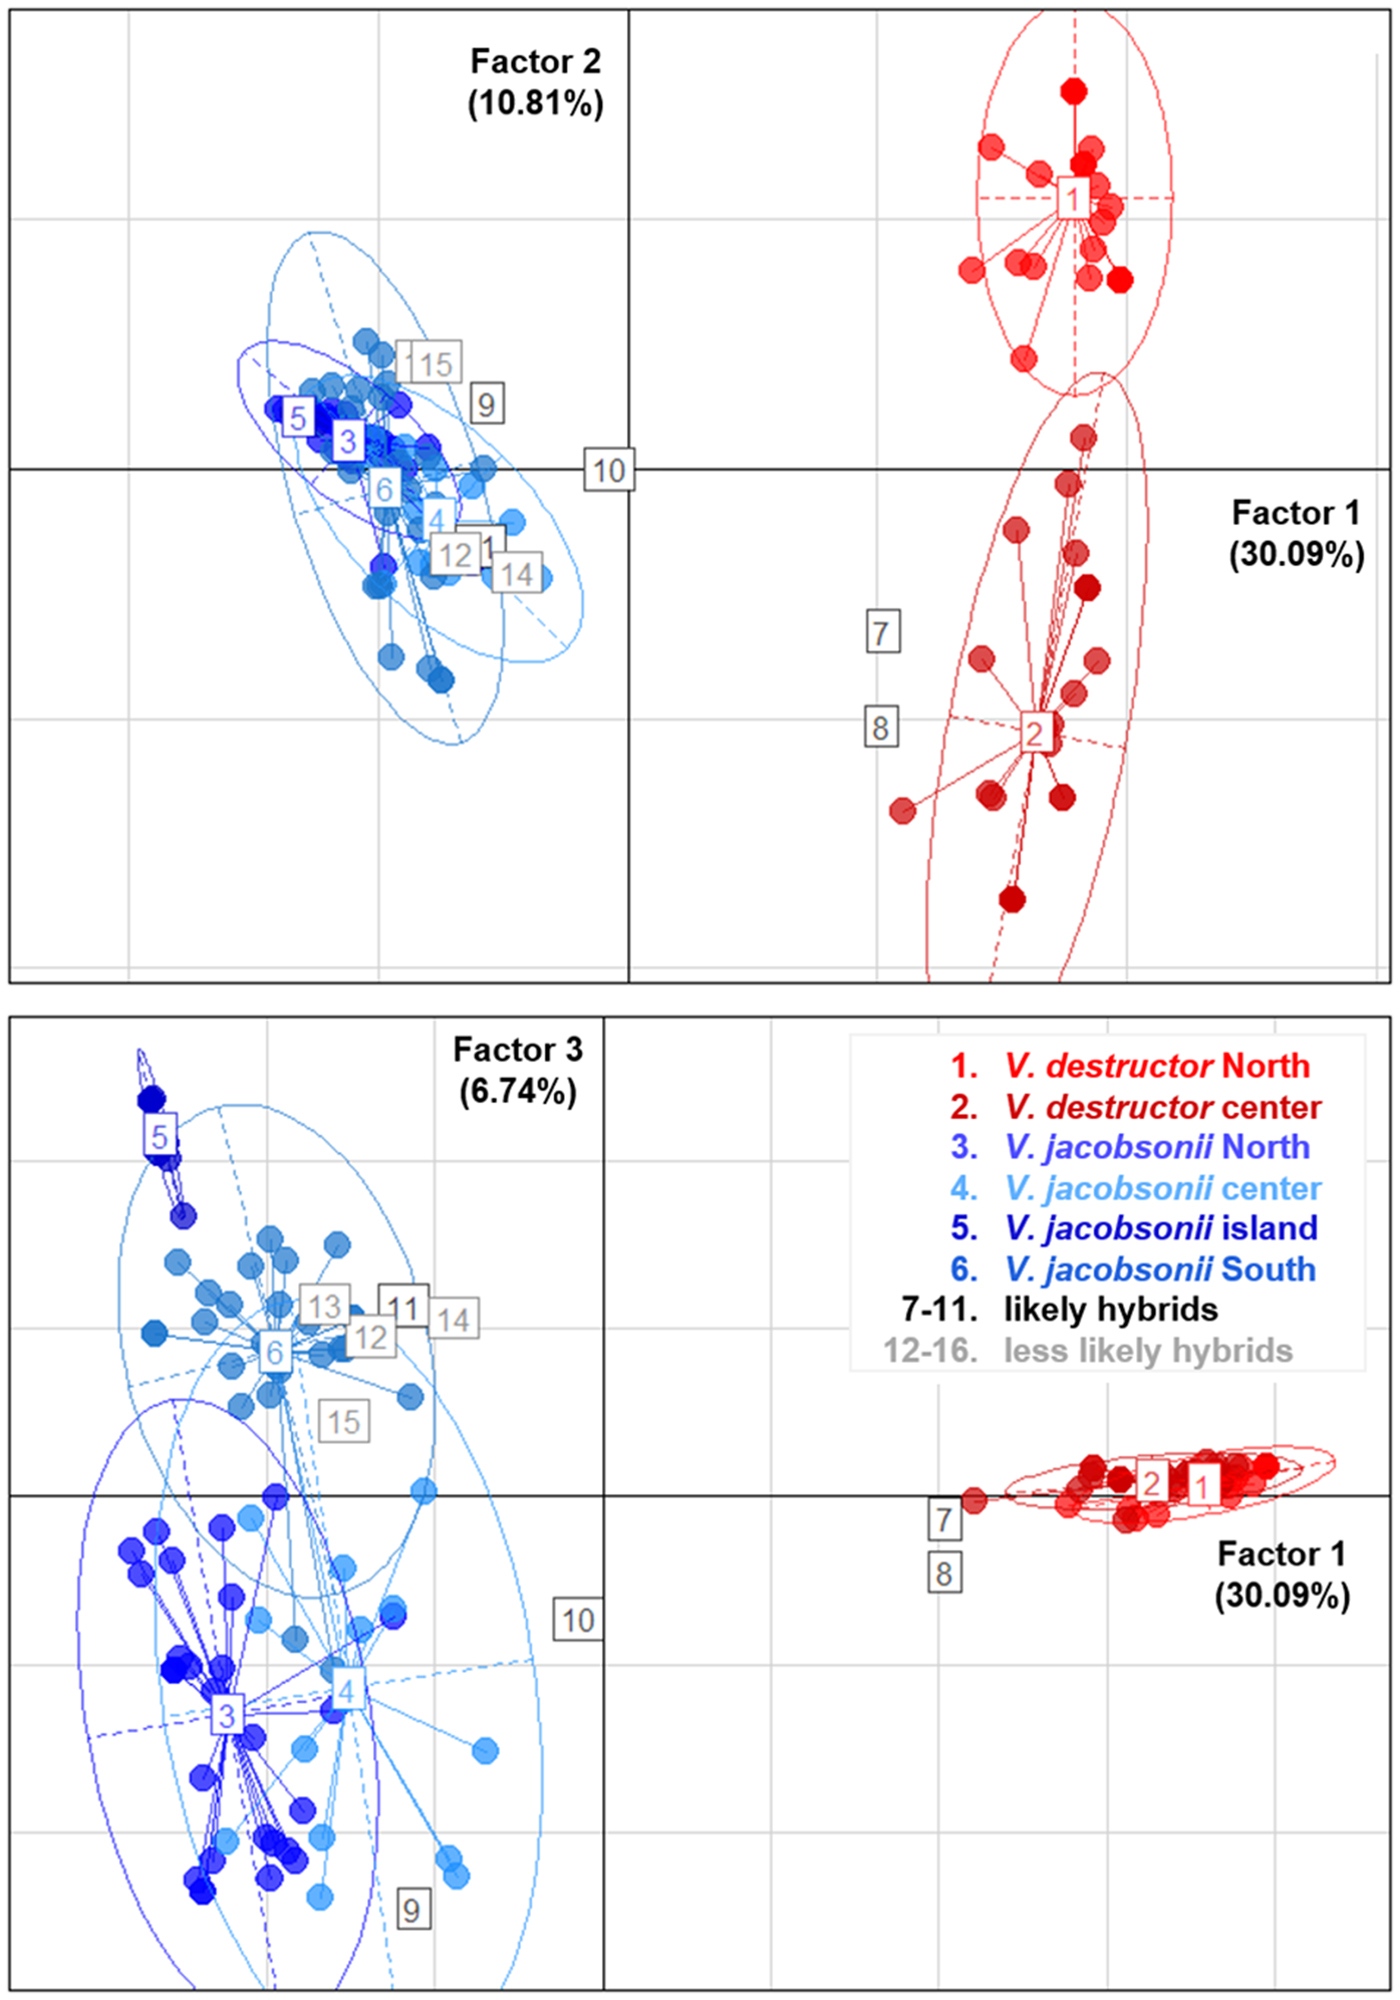
The PCA placed most of the putative hybrids between V. jacobsonii and V. destructor, along the axis 1, which separated the species, and which explained 30% of the genetic variance (Fig. 5). These individuals did not cluster half way between their suspected parental groups because they only showed heterospecific alleles at one to two loci and were thus closer to the parent they shared most alleles with. Four of them (corresponding to the individuals defined as likely hybrids, Tables 1 and S8) clustered outside the 95% confidence ellipses of their parent groups (Fig. 5). All other suspected hybrids (likely and less likely hybrids) lied within the ellipses. Factor 2 of the PCA explained 11% of the variance and separated the northern from the central V. destructor populations. Factor 3 (7% of the variance) did not separate V. jacobsonii from the North and the centre of Thailand, but these two populations were separated from the island and the South populations on the third axis (Fig. 5).
Principal Component Analyses. Genetic clustering based on eight microsatellite markers of mite populations occurring in four regions of Thailand and parasitizing imported Apis mellifera (Varroa destructor, shades of red) and endemic Apis cerana (Varroa jacobsonii, shades of blue). The three factors explaining most of the variance are plotted. Percentage of explained variance is indicated on each axis. Putative hybrids identified by InStruct are indicated with numbered squares from 7 to 16. Ellipses represent 95% confidence intervals.
The pairwise comparison of population differentiation estimates (F ST, G ST and D est) showed strong significant differences between the mites parasitizing the two host species in the northern and central locations (Table S9, Fig. 6). Differences between mites parasitizing A. mellifera in the two regions were strong and significant (Table S5). In mites infesting A. cerana, the population differentiation estimates were highest when comparing the continental populations (North, centre and South) to the island population (Table S9, Fig. 6).
D est values between mite populations at different locations in Thailand and host species. Thickness of arrows on the maps is proportional to D est value. Intraspecific D est values are presented for each host species as well as for the interspecific comparison in the North and the centre. Ellipses designate sampled locations. From North to South: Chiang Mai, Bang Saen, Ko Samui, Phattalung. Statistical differences (1000 bootstrap) of D est values between populations are denoted with asterisks (*** P < 0.001).

The AMOVA results indicated that genetic differences among mites infesting colonies of the same location were the least important in A. cerana and A. mellifera (13.8 and 5.3%, respectively, Table 3). The highest level of genetic structuring was within colonies for mites infesting A. cerana (57.4%), and among locations for mites infesting A. mellifera (60.9%).
Results of two independent pairwise distance-based AMOVAs performed with the microsatellite data. Represented is the level of genetic structuring for each host species among locations, colonies and within colonies

Levels of significance were calculated based on 1000 permutations (*** P < 0.001; ** P < 0.01 and n.s. non-significant).
Discussion
Our data confirm the Varroa spp. haplogroups detected previously (Smith and Hagen, Reference Smith and Hagen1996; Warrit et al., Reference Warrit, Smith and Lekprayoon2006), but the haplotypes we found differed in 1–4 nucleotides from those described earlier. The reproductive status of the sampled mites further confirmed that these haplotypes were indeed parasites of the host populations they were collected from. Spillbacks of V. destructor to A. cerana and spillovers of V. jacobsonii mites to A. mellifera colonies were observed. Genotyping revealed infestation of single host colonies with both V. destructor and V. jacobsonii as well as with several haplotypes of V. jacobsonii, thereby setting the stage for hybridization, which the microsatellites indicated in up to 17 out of 147 mites genotyped.
Distribution, reproduction and genetic diversity of Varroa spp. in Thailand
All haplogroups reported earlier (Warrit et al., Reference Warrit, Smith and Lekprayoon2006; Navajas et al., Reference Navajas, Anderson, de Guzman, Huang, Clément, Zhou and Le Conte2010) were confirmed. Yet, our choice to sequence a mitochondrial genome region common to several previous studies (Warrit et al., Reference Warrit, Smith and Lekprayoon2006; Navajas et al., Reference Navajas, Anderson, de Guzman, Huang, Clément, Zhou and Le Conte2010) led to compromises in mite identification. For instance, the V1 and C2 haplotypes and hence the V and C haplogroups of V. destructor could not be distinguished from each other using the chosen region. Since the V1 haplotype was reported earlier (Warrit et al., Reference Warrit, Smith and Lekprayoon2006), it seems likely that this is the V. destructor haplogroup, which we sampled in the North of Thailand. Interestingly, the Japanese V. destructor haplogroup was not detected, emphasizing that its presence in Thailand is dubious (Warrit et al., Reference Warrit, Smith and Lekprayoon2006). The distribution patterns of the remaining haplogroups described by Warrit et al. (Reference Warrit, Smith and Lekprayoon2006) were confirmed in broad terms based on reproductive data and genotyping: V. destructor K1 was found to infest A. mellifera, while V. jacobsonii North Thai, Malay and Samui infested A. cerana in the North (Chiang Mai), South (Phattalung) and on Samui Island, respectively.
The V. jacobsonii haplotypes detected here varied from one to four nucleotides compared to those described over a decade earlier (Warrit et al., Reference Warrit, Smith and Lekprayoon2006). The haplotype network indicates that the novel NorthThai3 haplotype of V. jacobsonii has not emerged recently because of its intermediate position between the NorthThai2 and Laos1 haplotypes, but has probably not been sampled previously. Despite the collection of a high number of mites in the same region, some previously described haplotypes (Warrit et al., Reference Warrit, Smith and Lekprayoon2006) were not confirmed, which could be due to a sampling bias. Indeed, the haplotype network inferred the existence of a few non-sampled haplotypes. Irrespective of their cause, the differences between studies and the high genetic diversity measured suggest that the mite population structure is dynamic in time or space. A more accurate description of the population structure and dynamics of Varroa spp. in their original range thus requires even higher sampling efforts.
The number of mites we sampled nevertheless allowed for the detection of unexpected host–parasite associations. Reproduction of the Korea haplotype of V. destructor was repeatedly observed for the first time on A. cerana drone brood outside of its natural range, thereby demonstrating a lower host specificity than previously suspected (see Navajas et al., Reference Navajas, Anderson, de Guzman, Huang, Clément, Zhou and Le Conte2010). Possible differences in drone brood entombing (Rath, Reference Rath1999) and/or susceptibility of host worker brood (Page et al., Reference Page, Lin, Buawangpong, Zheng, Hu, Neumann, Chantawannakul and Dietemann2016) between populations may explain why this particular lineage has not invaded all A. cerana populations sympatric with infested A. mellifera. Despite the ubiquity of imported A. mellifera in Asia, none of the studies investigating population genetics in Varroa spp. reported the invasive Korean lineage of V. destructor (K1) infesting A. cerana outside its original distribution range (Anderson and Trueman, Reference Anderson and Trueman2000; Fuchs et al., Reference Fuchs, Tu Long and Anderson2000; Solignac et al., Reference Solignac, Cornuet, Vautrin, Le Conte, Anderson, Evans, Cros-Arteil and Navajas2005; Navajas et al., Reference Navajas, Anderson, de Guzman, Huang, Clément, Zhou and Le Conte2010; Beaurepaire et al., Reference Beaurepaire, Truong, Fajardo, Dinh, Cervancia and Moritz2015). The number of surveys remains small and spillbacks of the V. destructor Korea haplotype into non-native host populations of A. cerana could have gone undetected. Yet, the spillback of the virulent V. destructor lineage or its hybridization with endemic mites could have dramatic consequences for populations of A. cerana (Depotter et al., Reference Depotter, Seidl, Wood and Thomma2016). Moreover, its propensity to vector a large diversity of viruses represents a threat to honey bees and other pollinators (Fürst et al., Reference Fürst, McMahon, Osborne, Paxton and Brown2014; Wilfert et al., Reference Wilfert, Long, Leggett, Schmid-Hempel, Butlin, Martin and Boots2016).
Using mtDNA sequencing, we also detected the occurrence of a single V. jacobsonii mite spillover from A. cerana to A. mellifera. The observed frequency of 1% (once in 117 cases), suggests that opportunities for host shifts by this mite species (e.g. in Papua New Guinea, Roberts et al., Reference Roberts, Anderson and Tay2015) are not extremely rare. Whether this V. jacobsonii mite reproduced on its A. mellifera host could not be established. Nevertheless, this finding is alarming and highlights the risks of host shifts by mite lineages of further haplogroups.
Drifting of mites between host species, as well as the natural sympatry of several haplotypes of mites, can lead to infestations of single host colonies and even brood cells by mites of multiple haplotypes and species, thereby setting the stage for hybridization. Indeed, such cases were detected in five A. cerana colonies and in one A. mellifera colony. In addition, the relatively high frequency of multiply infested drone cells in these populations (up to 13% of infested cells, Wang et al., in prep.) supports the idea that opportunities for hybridization can indeed be frequent.
Putative introgression between mite species
The occurrence of several species and haplotypes in single colonies leads to the possibility of foundress mites of different taxa entering the same host brood cell to reproduce (Beaurepaire et al., Reference Beaurepaire, Krieger and Moritz2017a). The cohabitation of their sexually mature offspring sets the stage for hybridization. Indeed, our analysis with Instruct revealed that five likely hybrids could not unambiguously be assigned to a single genetic cluster. In complement, visual inspection of the genotypes of these individuals revealed that they carried alleles usually found on mites infesting the other host species at up to three markers (Table S8). On the PCA, some of the likely hybrids were also found outside of the 95% confidence ellipses of their group. However, given that the Adegenet PCA function incorporates missing data as averaged alleles, the other individuals (likely and less likely hybrids) carrying heterospecific alleles could not be clearly distinguished from the rest using this method. Although the presence of an identical allele in the mite species may be due to size homoplasy, this event alone does not seem sufficient to explain the patterns we observed, with the presence of shared alleles in six loci out of eight (Table S8). The large size difference with a putative parent allele strengthens our argument. For instance, we found the allele ‘175’ at locus VD307 in an individual with a dominant V. destructor genotype and 99.88% identity to the K1 COI haplotype (Tables S7 and S8). The closest allele found in the gene pool of V. destructor is 165 (75% prevalence). With a repeat motif of this microsatellite of 2 bp, at least five additions/deletions would be necessary to generate homoplasy, which seem highly unlikely.
The introgression of alleles of V. destructor in the gene pool of V. jacobsonii from the centre and the South of Thailand at some but not all loci suggests the presence of second or third generation hybrids and indicates that the two species are capable of interbreeding and of producing fertile offspring. Introgression suggests that reproductive barriers between these species are absent and questions the segregation of V. destructor and V. jacobsonii into two species. Differences in behaviour, morphology and virulence promoted the investigation of genetic divergence within the genus Varroa (Anderson and Fuchs, Reference Anderson and Fuchs1998; de Guzman et al., Reference de Guzman, Rinderer, Stelzer and Anderson1998; Anderson, Reference Anderson2000). The percentage of divergence measured resulted in the definition of V. destructor as a new species (Anderson and Trueman, Reference Anderson and Trueman2000). Yet, whether the typical biological basis for species definition is fulfilled (i.e. the absence of interbreeding and production of fertile offspring, Mayr, Reference Mayr1942) has never been tested. Therefore, the potential of hybridization between these two mite species needs to be investigated experimentally to provide direct evidence of what our data suggest. In case it is confirmed, the relative scarcity of hybrids found to date requires an explanation. Post-zygotic isolation mechanisms, for example, have been suggested to limit the occurrence of hybrids between the Korea and Japan haplotypes of V. destructor (Solignac et al., Reference Solignac, Cornuet, Vautrin, Le Conte, Anderson, Evans, Cros-Arteil and Navajas2005).
Population structure and reproductive system
The difference between expected and observed heterozygosity (Table S6) indicates that the sampled Varroa populations were not in Hardy–Weinberg equilibrium, which is in line with the mites' inbred reproductive system (Rosenkranz et al., Reference Rosenkranz, Aumeier and Ziegelmann2010). This mating system also explains the low levels of genetic diversity, which were further exacerbated by a genetic bottleneck due to host shift (for the invasive V. destructor, Solignac et al., Reference Solignac, Cornuet, Vautrin, Le Conte, Anderson, Evans, Cros-Arteil and Navajas2005) and to isolation on an island (V. jacobsonii Samui2; Oldroyd and Wongsiri, Reference Oldroyd and Wongsiri2006). As a result of these bottlenecks, the number of alleles and allelic richness of these populations was inferior to that of the mites in other A. cerana populations. A notable inconsistency was observed for the northern (Chiang Mai) population, which showed the high range in allelic richness typical for V. jacobsonii (except Samui2), but a lower range of heterozygosity (similar to Samui2; Fig. 5). This suggests a higher inbreeding rate in this population, but without loss of allelic richness, of which the causes remain unknown. Overall, the range of genetic diversity of the V. jacobsonii populations in Thailand was similar to that found in other populations of this mite taxon (Roberts et al., Reference Roberts, Anderson and Tay2015).
Our investigations of the population structure with microsatellite markers show that the gene flow between V. destructor and V. jacobsonii was overall low (Table S5) but may be mediated by occasional hybridization. The comparison of the different indexes of population differentiation revealed contrasting patterns in the mites infesting the two host species. The two indexes F ST and G ST were generally higher in A. mellifera than D est. This trend was reversed for the mite populations infesting A. cerana. These discrepancies can be explained by the differences in the number of alleles and heterozygosity levels within these two groups (Meirmans and Hedrick, Reference Meirmans and Hedrick2011), with V. destructor subpopulations being less diverse than those of V. jacobsonii.
The pattern of genetic structure among the A. cerana mite populations mostly correlated with geographic distance and isolation (Table S5, Figs 4–6). In the native host, mite subpopulations from the continent may have exchanged alleles frequently, probably as a consequence of A. cerana colonies migrating seasonally (Oldroyd and Wongsiri, Reference Oldroyd and Wongsiri2006). Notably, lower levels of genetic differentiation were detected between mites from the North and the centre compared to the mites from the South (Figs 5 and 6), probably reflecting mite adaptation to the local host haplotypes (Rueppell et al., Reference Rueppell, Hayes, Warrit and Smith2011). However, we found evidence of nuclear gene flow across the Kra Isthmus, which physically separates A. cerana Mainland and Sundaland subpopulations. These results support the hypothesis that host–parasite associations in the Apis–Varroa system are not only due to local coevolution, but can be influenced by biogeographic history and population migration (Rueppell et al., Reference Rueppell, Hayes, Warrit and Smith2011). The genetic distinctiveness of the Samui island mite population mirrors its host's geographical isolation (see Rueppell et al., Reference Rueppell, Hayes, Warrit and Smith2011). Gene flow between the continental and the Samui populations was likely interrupted 18 000 to 10 000 years ago as the sea level rose (Oldroyd and Wongsiri, Reference Oldroyd and Wongsiri2006). Using the substitution rates proposed by Solignac et al. (Reference Solignac, Cornuet, Vautrin, Le Conte, Anderson, Evans, Cros-Arteil and Navajas2005), this timespan corresponds to a range of 3–14 substitutions on the COI gene when comparing the island with the other V. jacobsonii haplotypes, fitting with our mtDNA results (Fig. 2).
In accordance with the genetic differentiation estimates, the two AMOVAs revealed different patterns of genetic structuring in A. mellifera mites and in mites of the native host. The gene flow of the new host is likely a consequence of human transportation of colonies, as feral colonies of A. mellifera do not occur in Asia (Oldroyd and Wongsiri, Reference Oldroyd and Wongsiri2006). Although trade and the associated translocation of hosts along the country's North-South axis (Chantawannakul, Reference Chantawannakul, Chantawannakul, Williams and Neumann2018) could be expected to level out population structuring in the parasite, we found high population differentiation levels in mites infesting A. mellifera (Figs 5 and 6). These may be due to mite introductions of different origins and genotypes and/or due to local adaptation.
Additionally, we detected a low genetic structuration among colonies of the same location in V. jacobsonii and V. destructor, most likely reflecting that mites readily disperse among colonies (Dynes et al., Reference Dynes, De Roode, Lyons, Berry, Delaplane and Brosi2016; Beaurepaire et al., Reference Beaurepaire, Ellis, Krieger and Moritz2017b). The analysis of genetic structure at the lowest scale (within colony) revealed that the genetic diversity between V. jacobsonii mite infesting the same colonies was considerable. Indeed, the V. jacobsonii genotypes in A. cerana colonies were sampled only once (Table S8). In contrast, the moderate genetic variance at this level in V. destructor reflects the lack of diversity of the Korea haplotype outside its natural distribution (Solignac et al., Reference Solignac, Cornuet, Vautrin, Le Conte, Anderson, Evans, Cros-Arteil and Navajas2005). Altogether, given the peculiar patterns of Varroa population structure, varying in space, time and according to its host species, a broader sampling scheme will be necessary to seize the extent of this parasite's complex biogeography in Asia.
Conclusion
Several of the phenomena known to promote host shifts have been observed in our screening of natural infestations of A. cerana and A. mellifera by V. jacobsonii and V. destructor. Genetic diversity of V. jacobsonii was higher compared to V. destructor. Spillbacks of invasive V. destructor mites from A. mellifera into A. cerana and spillovers of endemic V. jacobsonii mites from A. cerana to introduced A. mellifera were observed. These events resulted in infestations of single colonies with both mite species and microsatellite marker based evidence suggested hybridization between V. destructor and V. jacobsonii. The relatively high frequency of these phenomena indicate risks of further host shifts, which could threaten honey bee populations of Asia and beyond.
Supplementary material
The supplementary material for this article can be found at https://doi.org/10.1017/S003118201900091X
Acknowledgments
Ana Paula Machado, Zheguang Lin and Kaspar Roth for assistance with genotyping; Zongyot Chaiwong, Weeraya Sommana and Weerapon Hounjam for outstanding assistance in the field and for accommodation; Laurent Genoud for accommodation. Guntima Suwannapong is acknowledged for providing mites from central Thailand.
Financial support
This research was supported by the Swiss National Science Foundation (V.D., P.N. grant number 31003A_147363), by the Vinetum Foundation (P.N.), by Agroscope (V.D.) and by the Thailand Research Fund (P.C., grant number RSA6080028) and the Ricola foundation Nature and Culture (P.N. and P.C.).
Conflict of interest
None.
Ethical standards
Not applicable.


 Open access