


1. Introduction
Acoustically coupled combustion dynamics has been studied over many years to gain a better understanding of combustion instabilities, which remain a significant challenge in the development of aerospace propulsion systems. These self-induced instabilities are driven by the coupling mechanism between unsteady heat release and pressure oscillations within a combustion chamber. The well-known Rayleigh criterion (Rayleigh Reference Rayleigh1896) states that when pressure and heat release oscillations are sufficiently in phase, the oscillations can become amplified, leading to the growth of combustion instabilities (Harrje Reference Harrje1972; Candel Reference Candel1992). While the Rayleigh criterion describes the driving mechanism of instabilities in various combustion configurations (Candel Reference Candel1992; McManus, Poinsot & Candel Reference McManus, Poinsot and Candel1993; Anderson & Yang Reference Anderson and Yang1995; Candel Reference Candel2002; Ducruix et al. Reference Ducruix, Schuller, Durox and Candel2003; O'Connor, Acharya & Lieuwen Reference O'Connor, Acharya and Lieuwen2015), detailed quantification of local acoustically coupled flame dynamics is often required to predict and control these instabilities.
In the past, our group at UCLA has explored acoustically coupled combustion of liquid neat fuel and nanofuel droplets (Sevilla-Esparza et al. Reference Sevilla-Esparza, Wegener, Teshome, Rodriguez, Smith and Karagozian2014; Karagozian Reference Karagozian2016; Bennewitz et al. Reference Bennewitz, Valentini, Plascencia, Vargas, Sim, Lopez, Smith and Karagozian2018; Sim et al. Reference Sim, Plascencia, Vargas and Karagozian2020a) using optical diagnostics, and recently the focus has been on the combustion of gaseous jets emanating from single microjets (Sim et al. Reference Sim, Vargas, Ahn and Karagozian2020b). In these prior studies, the influence of an applied acoustic standing wave was manifested in a bulk flame deflection away from the pressure node (PN) in the waveguide, consistent with the presence of an acoustic radiation force (Tanabe et al. Reference Tanabe, Morita, Aoki, Satoh, Fujimori, Sato, Tanabe, Aoki and Fujimori2000; Dattarajan et al. Reference Dattarajan, Lutomirski, Lobbia, Smith and Karagozian2006), in addition to temporal flame oscillations related to the forcing frequency and specific flameholding and strain field characteristics (Sevilla-Esparza et al. Reference Sevilla-Esparza, Wegener, Teshome, Rodriguez, Smith and Karagozian2014; Bennewitz et al. Reference Bennewitz, Valentini, Plascencia, Vargas, Sim, Lopez, Smith and Karagozian2018). The acoustic radiation force is relevant here in that the standing wave interacts with a small region of low density and higher temperature gas. The effective acoustic radiation force is analogous to buoyancy, as explained in detail in Tanabe et al. (Reference Tanabe, Morita, Aoki, Satoh, Fujimori, Sato, Tanabe, Aoki and Fujimori2000) and Sevilla-Esparza et al. (Reference Sevilla-Esparza, Wegener, Teshome, Rodriguez, Smith and Karagozian2014), acting to deflect the flames in a bulk manner away from the PN and toward the pressure antinode (PAN) as the flames themselves oscillate.
The study of laminar jet and microjet combustion is in part motivated by its simplicity, in the case of the latter, consisting of a millimetre-sized laminar diffusion flame that is readily stabilized in a quiescent environment for a range of flow rates (Choudhuri et al. Reference Choudhuri, Camacho, Wicker and Gollahalli2002; Matta et al. Reference Matta, Neumeier, Lemon and Zinn2002). Diagnostics and analysis methods developed to study microjet flames can readily be scaled to study a larger-scale flame dynamics. Cheng et al. (Reference Cheng, Chen, Chen, Li, Wu and Chao2006) find good agreement between experimental and numerical simulations for the shape, structure and stability regime based on the quenching velocity and blow-off limits for these microjet flames. It is thought that heat recirculation through the burner wall assists in the stabilization of the small flame (Chen et al. Reference Chen, Chao, Cheng, Chen and Wu2007; Gao, Hossain & Nakamura Reference Gao, Hossain and Nakamura2017). Additionally, microjet configurations are attractive for future micro-power devices due to low soot production and high energy density resulting from a large surface-to-volume ratio. Others have shown that multiple micro-flames may be used to enhance heating performance with special attention to flame–flame interactions that can induce undesirable merging of the individual flames (Hirasawa et al. Reference Hirasawa, Gotanda, Masuda and Nakamura2012; Kuwana et al. Reference Kuwana, Kato, Kosugi, Hirasawa and Nakamura2014).
The present work builds upon prior studies of the acoustically coupled droplet combustion of neat fuels (Sevilla-Esparza et al. Reference Sevilla-Esparza, Wegener, Teshome, Rodriguez, Smith and Karagozian2014; Karagozian Reference Karagozian2016; Bennewitz et al. Reference Bennewitz, Valentini, Plascencia, Vargas, Sim, Lopez, Smith and Karagozian2018) and liquid nanofuel mixtures (Sim et al. Reference Sim, Plascencia, Vargas and Karagozian2020a), and more recently gaseous methane laminar jets (Sim et al. Reference Sim, Vargas, Ahn and Karagozian2020b). The present focus is on laminar gaseous jets emanating from both single- and multiple-port burner geometries, with emphasis on the analysis of the flame dynamics and transitions in the combustion process. The proper orthogonal decomposition (POD) method (Lumley Reference Lumley1967) was employed to extract space–time modes from time-resolved visible flame imaging. The analysis then focused on just a few of the most energetic modes as a means of exploring the dynamics in greater detail as well as understanding characteristic signatures associated with dynamical transitions. This approach could yield the potential for a reduced-order model (ROM) to be developed, with the aim of predicting the transitions that arise due to varying levels of external acoustic excitation, with implications for flame stabilization in the presence of growing or severe acoustic instabilities.
2. Experimental and analysis methods
The laminar jets in this experiment burned within a closed, optically accessible cylindrical waveguide, operating at atmospheric pressure and with loudspeakers situated at each end of the waveguide (see figure 1), as used in prior experiments (Sevilla-Esparza et al. Reference Sevilla-Esparza, Wegener, Teshome, Rodriguez, Smith and Karagozian2014; Bennewitz et al. Reference Bennewitz, Valentini, Plascencia, Vargas, Sim, Lopez, Smith and Karagozian2018; Sim et al. Reference Sim, Plascencia, Vargas and Karagozian2020a). The length of the waveguide could be altered by moving the speakers, but in the experiments described here, the distance between the speakers was fixed at approximately 61 cm. The speakers were operated out of phase under sinusoidal input to produce a standing wave with resonant acoustic frequency  $f_a = 332$ Hz (Bennewitz et al. Reference Bennewitz, Valentini, Plascencia, Vargas, Sim, Lopez, Smith and Karagozian2018), hence with a wavelength approximately twice that of the actual waveguide length. This created a PN, or corresponding velocity antinode (VAN), mid-way between the speakers. We note that the acoustic time scale associated with excitation at frequency $f_a=332$ Hz was considerably greater, by at least an order of magnitude, than time scales associated with the reaction process in the methane fuel jets. The fact that the speaker position could be altered while fixing the distance between them meant that the PN/VAN could be moved to different locations relative to the burning jet, thus enabling the flame to experience a net acoustic radiation force acting away from the PN (Tanabe et al. Reference Tanabe, Morita, Aoki, Satoh, Fujimori, Sato, Tanabe, Aoki and Fujimori2000), as observed in prior droplet and jet combustion experiments (Sevilla-Esparza et al. Reference Sevilla-Esparza, Wegener, Teshome, Rodriguez, Smith and Karagozian2014; Sim et al. Reference Sim, Vargas, Ahn and Karagozian2020b). The amplitude of acoustic excitation was characterized by the amplitude of the maximum pressure perturbation, $p'_{max}$, measured at the PAN closest to the central PN. Values of $p'_{max}$ explored in the present studies ranged from 100 to 225 Pa. Local perturbation pressures $p'$ in the vicinity of the flame, offset from the PN by shifting speaker locations, were determined via localized pressure measurements within the waveguide. Such measurements were obtained via a Kulite XCS-093-5D miniature pressure transducer embedded in the waveguide wall and located at the flame's axial position. Prior studies have verified that the waveguide's spatial pressure distribution corresponds to a standing wave at resonant conditions (Sevilla-Esparza et al. Reference Sevilla-Esparza, Wegener, Teshome, Rodriguez, Smith and Karagozian2014; Bennewitz et al. Reference Bennewitz, Valentini, Plascencia, Vargas, Sim, Lopez, Smith and Karagozian2018).
Waveguide apparatus with movable speaker assembly and optical access for high-speed visible imaging of a gaseous laminar jet diffusion flame. Configurations for both single and triple jet fuel injectors are shown.
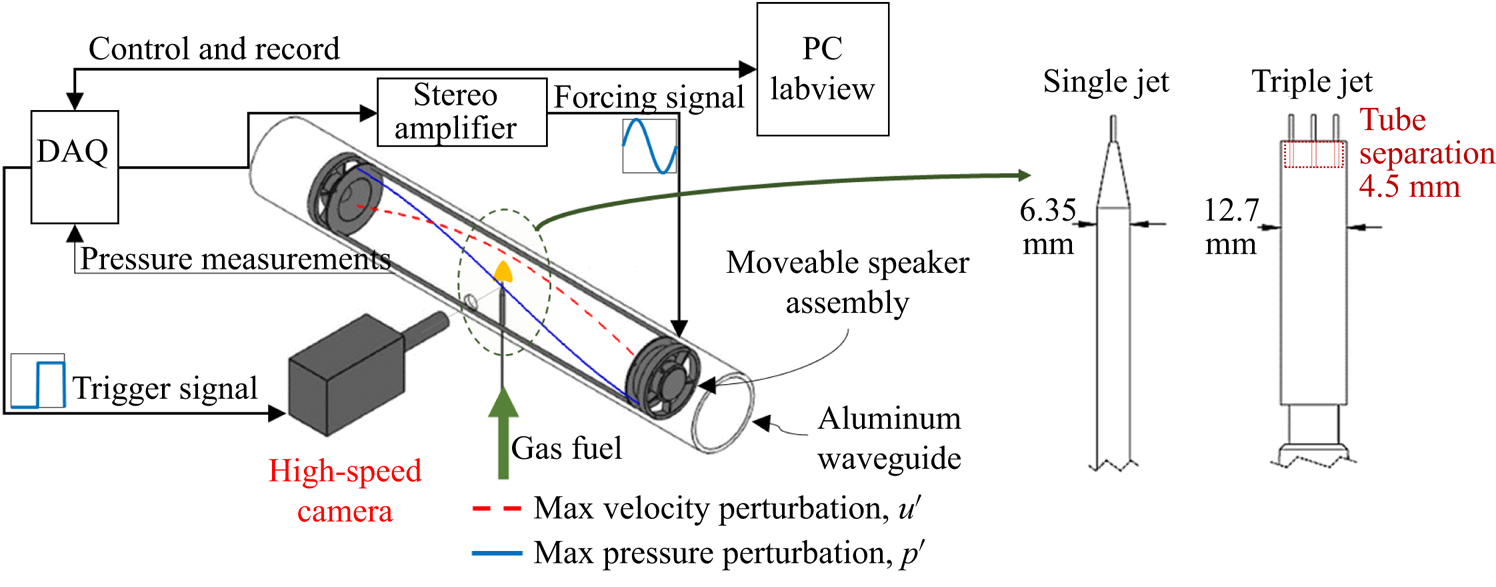
Fuel delivery configurations in the present study primarily consisted of single as well as triply configured methane fuel jets, emanating from stainless steel tubes with an outer diameter of 0.794 mm (standard 1/32 in.) and an inner diameter of 0.457 mm. In the case of the triple jet, the tubes were situated at a distance of 4.6 mm from one another, aligned in a co-linear fashion in the direction of the waveguide axis. While earlier studies have focused on the characteristics of single microjet flames under acoustic forcing (Sim et al. Reference Sim, Vargas, Ahn and Karagozian2020b), additional single jet results at different jet Reynolds numbers, for comparison with the triple jets, will be shown and discussed here. In the present configurations, the volume flow rate  $Q$ was varied to study jets with Reynolds numbers ranging from 20 to 100, based on the jet's inner diameter and bulk jet velocity. For the triple jet configuration, the centre-to-centre separation distance between tubes, 5.67 diameters, was selected after trial and error experiments determined that this spacing enabled the flames to burn in a generally localized fashion at the lower flow rates, showing three distinct flames, rather than always having a merger of the flames into one structure, as occurred for the higher flow rates. A subset of single and triple jet results will be discussed in detail in this paper; a complete set of results is documented in the PhD dissertation of Vargas (Reference Vargas2022).
Transient flame dynamics during acoustic excitation was captured using a high-speed monochrome camera (Photron Mini AX200) with a 200 mm macro lens. The camera was operated at 2000 frames per second with a shutter speed that was approximately equal to the inverse of the frame rate. Images of the small blue flame were post-processed to counteract the significant signal dropout due to the short exposure times. The images were enhanced via pixel binning, a fixed minimum intensity threshold, and denoising using the block-matching and 3D filtering (BM3D) algorithm (Dabov et al. Reference Dabov, Foi, Katkovnik and Egiazarian2007).
Modal decomposition methods such as POD or dynamic mode decomposition (DMD) can reveal important information on dominant characteristics in a complex flow field by projecting the large-scale problem onto a dynamical system with fewer degrees of freedom. The POD method is used to extract the most dominant mode structures in a field of data (Berkooz, Holmes & Lumley Reference Berkooz, Holmes and Lumley1993), where the structures extracted from the analysis are ordered according to fluctuation energy content. Snapshot POD (Sirovich Reference Sirovich1987) may be used to extract mode structures from instantaneous, time-resolved snapshots of the flow, even in relatively sparse datasets (per cycle), as in the present case, as long as there are sufficient numbers of realizations used. Snapshot POD was the approach used in extracting proper orthogonal modes (POMs) in the present high-speed visible imaging. While the POD of a complex flow provides information on the most energetic modes, it does not reveal the frequencies associated with the modes. The DMD method, in contrast, typically requires time-resolved data (Schmid Reference Schmid2010) to be able to extract dynamic information via the singular value decomposition, and while the modes are not ordered in terms of energy content, dominant frequencies can be identified. Both approaches were used in analysing visible flame images for the single fuel jet in earlier studies (Sim et al. Reference Sim, Vargas, Ahn and Karagozian2020b; Vargas Reference Vargas2022), demonstrating consistency between POD and DMD analyses, although an emphasis in the present paper was placed on POD analysis results.
3. Results
Representative instantaneous images of the unforced flames for both single and triple fuel jet injectors, for a range of jet Reynolds numbers, are shown in figure 2. In the case of the unforced single jet flame, the smallest flame at  $Re=20$ was close to the quenching limit, below which a flame could not be stabilized, while the longest flame at $Re=100$ tended to form a high-intensity soot region. For the triple fuel jet injectors, at lower $Re$, the flames tended to envelop each of the injectors in a rather distinct manner, while at higher $Re$, above 40, the flame structure tended to envelop all three jets, becoming more lifted for $Re = 80$. As noted above, the spacing of the multiple jets was selected to enable exploration of this range of flame configurations. For each injector and for a range of values of $Re$, acoustically forced experiments were conducted by systematically increasing the speaker forcing amplitude to trigger a transition from sustained oscillatory combustion (SOC) into periodic lift-off and reattachment (PLOR) and blow-off (BO). In these experiments, the applied frequency creating the standing wave was fixed at 332 Hz, and the speakers were altered such that the fuel injector was situated at a fixed location $x = 3$ cm to the right of the PN, corresponding to a relative location $x/ \lambda = +0.029$. In all cases, increasing the forcing amplitude led to bulk deflection of the flame away from the PN, consistent with the notion of the acoustic radiation force (Tanabe et al. Reference Tanabe, Morita, Aoki, Satoh, Fujimori, Sato, Tanabe, Aoki and Fujimori2000), although with differences in flame structure and dynamical characteristics.
Instantaneous visible imaging snapshots of (a) the single jet flames and (b) triple jet flames at various jet Reynolds numbers  $Re$ in the absence of acoustic excitation.

3.1. Single fuel jet observations and dynamics
Earlier studies (Sim et al. Reference Sim, Vargas, Ahn and Karagozian2020b) explore the dynamics of single jet diffusion flames exposed to external acoustic excitation in the present acoustic waveguide, but at a single jet Reynolds number,  $Re = 65$. The present studies extended the experiments to a wider range of jet Reynolds numbers, amplitudes of excitation and at a higher camera framing rate, enabling quantification of transitions in the flame dynamics (e.g. from SOC to PLOR to BO) for a larger parameter space with improved temporal resolution. At very low Reynolds numbers for the single jet, e.g. for $Re = 20$, even relatively high amplitude acoustic excitation (e.g. local $p' = 30.8$ Pa, corresponding to
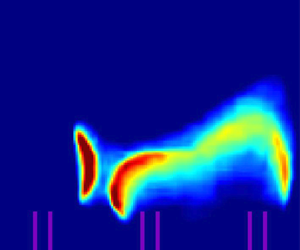
  $p'_{max} = 170$ Pa) produced relatively small oscillations in the flame cap formed over the injector, demonstrating SOC behaviour without periodic lift-off. For these conditions, figure 3 shows the following: in figure 3(a), a sequence of 6 instantaneous flame images over a single acoustic cycle, with repetitive back-and-forth flame oscillations in response to velocity perturbations; in figure 3(b), the first four POD mode shapes and associated modal energy content, with consistency to the back-and-forth flame oscillations and relatively strong energetic content in the first and second modes; in figure 3(c), plots of POD mode coefficients with respect to one another, creating phase portraits from the sequence of images, with fairly clear and symmetric periodic behaviour; and in figure 3(d), power spectral density (PSD) plots extracted from each of the four POD modes, demonstrating peaks at the applied frequency (332 Hz) and its higher harmonics. While the phase portraits here appeared a bit more smeared than for the higher jet Reynolds number conditions (as in Sim et al. (Reference Sim, Vargas, Ahn and Karagozian2020b) and in cases described below), this in part was a result of the higher camera frame rate with a lower relative image intensity than in Sim et al. (Reference Sim, Vargas, Ahn and Karagozian2020b). Yet the clear periodicity in the coupling of the dominant dynamical modes, and the relative symmetry in the phase portraits, even in the higher and less energetic modes, suggested a lock-in to the applied excitation, with clear higher-mode coupling. For this very low $Re = 20$ case, excitation conditions beyond the amplitude shown in figure 3 produced flame BO, with no substantial detection of PLOR behaviour prior to BO. This was an unusual feature of very low Reynolds number single jet flames.
Visible images over one period (a) and POD results for modes 1–4 (b–d) for the single jet burner with  $Re=20$ and local perturbation pressure $p'=30.8$ Pa. (a) Visible imaging over one cycle. (b) First four POD modes. (c) The POD-based phase portraits. (d) The POD mode spectra.

At the more moderate  $Re = 40$ condition, where the unforced flame enveloped the injector more completely (figure 2a), the flame transitions became more clearly visible with increasing amplitude. With increased excitation amplitude, the single jet flame transitioned from low-level SOC to moderate SOC with a clearly deflected flame to PLOR, as shown, for example, in figures 4, 5 and 6, respectively. For the low-level excitation producing SOC in figure 4, as at lower Reynolds numbers, there was consistency in the POD mode shapes with the nearly symmetric back-and-forth oscillations in the bulk-deflected flames, and relatively strong energetic content in the first and second POD modes, as also seen in prior single jet experiments (Sim et al. Reference Sim, Vargas, Ahn and Karagozian2020b). The phase portraits in figure 4(c) showed fairly clear and periodic behaviour in terms of mode coupling, with either symmetric or antisymmetric shapes, again consistent with lock-in to the applied acoustic excitation and simple oscillations in the flame. There was rather interesting periodic coupling at higher modes (e.g. in modes 3 and 4), and in this and other cases, it was likely that the phase portraits reflected the interactions of the applied frequency (332 Hz) and its higher harmonics, as observed in the spectra shown in figure 4(d). As the excitation amplitude increased, it produced more significant transverse flame oscillations with a slight bulk deflection away from the PN, consistent with the orientation of the acoustic radiation force (Tanabe et al. Reference Tanabe, Morita, Aoki, Satoh, Fujimori, Sato, Tanabe, Aoki and Fujimori2000; Sevilla-Esparza et al. Reference Sevilla-Esparza, Wegener, Teshome, Rodriguez, Smith and Karagozian2014). The flame dynamics documented in figure 5 displays slight reductions in energetic content of the first two modes (figure 5b) and more asymmetric and complex phase portraits (figure 5c), with the latter representing continuing alterations in the Lissajous figures consistent with lock-in prior to dynamical transitions (Li & Juniper Reference Li and Juniper2013).
Visible images over one period (a) and POD results for modes 1–4 (b–d) for the single jet burner with  $Re =40$ and local perturbation pressure $p'=18.1$ Pa. (a) Visible imaging over one cycle. (b) First four POD modes. (c) The POD-based phase portraits. (d) The POD mode spectra.

Visible images over one period (a) and POD results for modes 1–4 (b–d) for the single jet burner with  $Re=40$ and local perturbation pressure $p'=29.9$ Pa. (a) Visible imaging over one cycle. (b) First four POD modes. (c) The POD-based phase portraits. (d) The POD mode spectra.

Visible images over one period (a) and POD results for modes 1–4 (b–d) for the single jet burner with  $Re =40$ and local perturbation pressure $p'=37.1$ Pa. (a) Visible imaging over one cycle. (b) First four POD modes. (c) The POD-based phase portraits. (d) The POD mode spectra.

For single jet flames at  $Re = 40$ but at a higher excitation amplitude, periodic lift-off and reattachment was observed, as shown, for example, in the instantaneous images taken over one acoustic cycle in figure 6(a). At amplitudes somewhat above a local perturbation pressure of $p' = 37.1$ Pa, the flame could no longer stabilize on the single jet burner and experienced BO. For PLOR, as shown in figure 6(a), the deflected flame ceased to simply oscillate back and forth, but rather periodically detached from the burner edge closest to the PN, later reattaching to the burner. While SOC caused the flame to oscillate in direct response to the applied acoustic excitation, when the forcing amplitude was increased to the extent shown in figure 6, the flame began to lift-off from the side of the injector opposite to the direction of bulk flame deflection, but in a periodic fashion. It is likely that the local lift-off occurred due to an increased degree of local flame strain, hence when the local strain field relaxed periodically, but at a different time scale from that of the acoustics, the flame became anchored again at the burner edge. The time scale at which the PLOR occurred thus resulted in the PLOR's frequency being far smaller than that of the acoustic cycle. Hence the sequence of images in figure 6(a) did not constitute a single PLOR cycle. In prior phase-locked chemiluminescence imaging of such single flames, synchronized to the forcing frequency, this phenomenon produces smeared OH* images (Sim et al. Reference Sim, Vargas, Ahn and Karagozian2020b). The POD analysis applied to high-speed visible imaging of this PLOR condition revealed other clear influences of the periodicity in the lift-off process. The POD mode shapes in figure 6(b) show that the energetic content in POD mode 1 was significantly diminished, having been distributed to the higher POD modes. Mode shapes were also different from those with lower amplitude excitation, reflecting the alterations in flame shape during the coupling to both the applied frequency and the lift-off frequency, which, according to the spectra in figure 6(d), was $f_l \approx 16$ Hz. The POD mode coefficient plots/phase portraits in figure 6(c) showed much larger periodic structures, corresponding to the lower frequency oscillations, but with smaller-scale oscillations (appearing to be smeared in the coefficient plots) associated with the applied acoustic frequency. The fact that both the applied frequency and periodic lift-off frequency, as well as linear combinations thereof, were visible in figure 6(d), suggested a quasi-periodic response and coupling in the single flame during the altered dynamics. Animations corresponding to the single jet flame oscillations and the phase portraits in figures 4, 5 and 6 are shown in the supplementary materials for this paper available at https://doi.org/10.1017/jfm.2023.714, in the files named movie 1, movie 2 and movie 3, respectively. The moving red dot on the animation in the phase portrait corresponds to the individual visible image frame shown, and so oscillations associated with PLOR (figure 6) can be more clearly distinguished from those for SOC (figures 4 and 5). This transition in the phase portrait to larger-scale motions, but with smearing associated with the higher frequency oscillations on top of the lower frequency motion, was consistent with PLOR in prior single jet studies (Sim et al. Reference Sim, Vargas, Ahn and Karagozian2020b). It was similarly seen in different coaxial injector geometries in separate experiments (Vargas Reference Vargas2022), representing a characteristic signature quite distinct from that for SOC behaviour. Hence, the time scales for liftoff and reattachment were dependent on many different factors, including injector geometry, applied frequency and, clearly, fuel characteristics.
Extensive additional datasets, similar to those in figures 3–6, were taken for the single jet case, involving Reynolds numbers up to 100 and for a range of excitation conditions (Vargas Reference Vargas2022). For the most part, these flames exhibited similar dynamical behaviour to that documented in figures 4 and 5 for SOC, and in figure 6 for PLOR. For the range of Reynolds numbers examined,  $Re=20\unicode{x2013}100$, the amplitudes that led to a transition from SOC to PLOR and eventually to BO may be extracted from datasets such as the above. Findings for these conditions are summarized in figure 7, representing the local perturbation pressure $p'$ required to achieve either PLOR or BO for single jets at different Reynolds numbers. The data points fit linear trends for the approximate boundaries for these different regimes of flame response. It was observed that higher $Re$ flames required a greater amplitude of forcing to trigger the transition from SOC to PLOR, and that the amplitude that produced BO also linearly increased with $Re$ but at a greater rate, leading to an increasingly wider regime of amplitudes that could accommodate PLOR for higher amplitude excitation. In contrast, for the lowest Reynolds value ( $Re=20$), transition to PLOR was not observed during the present experiments.
Points of transition based on forcing amplitude for the single jet for  $Re = 20\unicode{x2013}100$, corresponding to acoustic forcing $f_a=332$ Hz and a relative flame location $x/\lambda = +0.029$. Red circle markers represent forcing amplitude $p'$ creating the transition from SOC to PLOR, and blue crosses represent the amplitude causing flame BO/extinction. The dashed lines represent a linear fit of these boundaries.

Not only were POD analyses such as those documented in those in figures 3–6 useful in quantifying characteristic signatures for flame transitions, they also provided insights into the essential features of the dynamics required to be captured in ROMs. Expanding on the observation that energetic content in the first few modes was reduced as excitation amplitude and thus flame–acoustic coupling increased, one can explore the variation in cumulative energy for the different types of flame dynamical behaviours. As an example, figure 8 shows the cumulative mode energy distribution for the single fuel jet under two different excitation amplitudes, producing SOC and PLOR, in addition to the unforced case, for  $Re = 40$. The plot represents the number of POD modes required to achieve a given cumulative mode energy percentage. The flame experiencing SOC required as few as two POMs to represent 90 % of the cumulative mode energy for that condition, while a flame undergoing PLOR required more than 10 modes to create 90 % of the cumulative energetic content. This latter observation, consistent with observations in figures 3–6 for spectra and mode shapes, suggested that a ROM representing the PLOR dynamics would require significantly greater complexity and number of modal components than a model representing simple SOC behaviour. In the unforced flame, for which POD did not recover a clear dynamics, in theory even more POD modes would be required to represent flame features, as compared with PLOR conditions, per figure 8. Yet the lack of detectable natural oscillations using the present diagnostics, in this case, would not make such an analysis particularly fruitful.
Cumulative POD modal energetic content as a function of mode number for the single fuel jet under unforced and forced conditions with  $f_a=332$ Hz and flame relative location $x/ \lambda = +0.029$. Forcing conditions creating SOC correspond to local excitation amplitude $p' = 23.5$ Pa, while PLOR corresponds to excitation at $p' = 37.1$ Pa.

3.2. Triple fuel jet observations and dynamics
Similar experiments were performed for the response of triple fuel jets to external acoustic perturbations for a fixed excitation frequency and jet position (relative to the PN), and for a range of jet Reynolds numbers and increasing excitation amplitudes. For example, time-series snapshots in figure 9 for  $Re = 40$, taken over approximately 30 acoustic cycles, demonstrated for all cases a bulk deflection away from the PN, consistent with the orientation of the acoustic radiative force (Tanabe et al. Reference Tanabe, Morita, Aoki, Satoh, Fujimori, Sato, Tanabe, Aoki and Fujimori2000). Yet different amplitudes of excitation affected the flames associated with the three microjets to different degrees. At the local pressure perturbation $p' =31.7$ Pa, for example, shown in figure 9(a), the leftmost jet flame (of the three) was observed to undergo PLOR, with severe curvature changes that caused clipping of the group flame, although the majority of the oscillating group flame remained attached to the right two jets. Increasing the local forcing amplitude further, to $p' = 37.7$ Pa, led to even greater bulk deflection of the flame structures (figure 9b), where the group flame enveloping the two rightmost injectors was periodically swept away by the bulk flow, although a small flame persisted, near the rightmost jet, enabling periodic full reignition of the group flame. As with the single jet flame, the reignition process was dependent on a time scale that was much slower than the applied acoustic time scale. While the flame response behaviour in figure 9(a) could not be considered to be full-scale PLOR, the periodic lift-off by the leftmost flame indicated a transitional behaviour somewhere between SOC and PLOR for these multi-jet flames. Behaviour in figure 9(b), in contrast, exhibited full-scale PLOR, with a greater degree of complexity in the flame structure arising from multiple fuel injectors. The modal decomposition analysis discussed below enabled the identification of additional frequencies as well as dynamical signatures of the highly perturbed flame.
Representative time-series images of triple jet diffusion flames with  $Re=40$ under acoustic forcing with $f_a=332$ Hz, located at $x/ \lambda = +0.029$ and local pressure perturbation amplitudes (a) 31.7 Pa and (b) 37.7 Pa. Panels show (a) $p'_{max}=175$ Pa (or $p' = 31.7$ Pa); (b) $p'_{max}=205$ Pa (or $p' = 37.7$ Pa).

The POD analysis applied to the time-series images for the acoustically coupled triple fuel jet flames enabled additional insights to be derived, including alterations in the flame dynamics as excitation amplitude was systematically increased. For example, figures 10(a)–10(c) show the results from POD analysis applied to imaging of the triple jet flame responses to relatively low forcing amplitudes,  $p'=9$, 18.1 and 26.2 Pa, all of which exhibited SOC behaviour, but the latter of which narrowly preceded transitional behaviour. In figures 10(a)–10(c), POD mode shapes for the four most energetic modes are shown, in addition to three-dimensional phase portraits representing the POD mode coefficient plots for the first three modes, $a_1$, $a_2$ and $a_3$. Even at very low amplitude acoustic excitation, as shown in figure 10(a), there was a clear dominance of the first mode based on the relative percentage of energetic content. The mode shape of POD mode 1 represented clear transverse oscillations, while the higher modes (2–4) with much lower percentages relate to minor changes along the flame boundary. Unlike the single jet, the triple jet had the potential to exhibit a locally emerging dynamics associated with the individual jets. Gradual growth in the asymmetric nature of the phase portraits in various dimensions may be seen in the three-dimensional plots in figure 10, in addition to the size of the trajectories, reflective of an increase in the magnitude of the flame oscillations and thus the POD mode coefficients with increasing excitation amplitude.
The POD analysis results for 332 Hz excitation at different forcing amplitudes for the triple jet ( $Re=40$) at the location $x/ \lambda = +0.029$, for local pressure amplitudes (a) $p'=9.0$ Pa, (b) $p'=18.1$ Pa and (c) $p'=26.2$ Pa. Results include the first four POD mode structures with the associated percentage of energetic content and sample plots of the POD mode coefficients against one another for the first three modes.

A comparison of the results of POD analysis for various triple jet excitation cases, with one another and with the single jet dynamics, provides useful insights. For relatively low amplitude acoustic excitation, the group flame oscillated back and forth with no substantial bulk deflection or partial flame lift-off at any of the injectors, as shown in figure 10(a). At successively increasing amplitudes of excitation, initiation of a small asymmetry was observed in the POD mode shapes and three-dimensional phase portraits in figures 10(b) and 10(c). For these relatively low amplitude excitation conditions, the phase portraits were relatively clean, showing clear periodicity among the various modes. A more detailed example of the periodicity is shown in figure 11, representing the triple jet flame at the excitation amplitude corresponding to the case in figure 10(c) ( $p'= 26.2$ Pa), including: (a) visible images over one acoustic cycle, (b) the first four POD mode shapes, (c) POD-based two-dimensional phase portraits involving coefficients for modes 1–4 and (d) spectral characteristics for each of the four modes. The spectra showed clear peaks at only the excitation frequency, 332 Hz, and at higher harmonics of this frequency. This spectral character, in addition to the shapes of the phase portraits, clearly showed behaviour that can be categorized as SOC. Such characteristics were similar to those for the single jet at a moderate amplitude of excitation, producing SOC lock-in to the excitation, as in figure 4. Yet for the triple jet, the POD coefficient plots/phase portraits had additional loops and exhibited initiation of asymmetry in the coefficient trajectories, suggestive of the beginning of a transition to increased complexity in the dynamics of flame–acoustic coupling, due in part to the more complex burner geometry.
Visible images over one period (a) and POD results for modes 1–4 (b–d) for the triple jet burner with  $Re=40$ and local perturbation pressure $p'=26.2$ Pa. (a) Visible imaging over one cycle. (b) First four POD modes. (c) The POD-based phase portraits. (d) The POD mode spectra.

Indeed, when the amplitude of excitation was increased to just above that producing SOC in figure 11, a slight periodic lift-off by the leftmost flame ensued, similar to the behaviour discussed previously in connection with figure 9(a). At a slightly higher amplitude of excitation, e.g. when  $p'= 27.1$ Pa as shown in figure 12, a transitional behaviour lying somewhat between SOC and PLOR was observed for the multiple jet flames, where there was a small degree of lift-off at the left side of the burner and simple oscillations of the group flame at the right side. This flame dynamics, with partial periodic lift-off of an individual jet, similar to the oscillating flame sequence in figure 9(a), created a quasi-periodicity involving both applied and lift-off frequencies, with the former more dominant overall. These phenomena were manifested in more distorted POD mode shapes and a significant reduction in the energetic content of the first two POD modes, seen in figure 12(b), with evidence of the slower periodic lift-off process in the lower frequency peaks, along with linear combinations of the lift-off and applied frequencies, appearing in PSD plots (figure 12d). The small increase in applied perturbation amplitude created a rather abrupt transition in the flame dynamics, and this behaviour continued at higher amplitudes of excitation, e.g. for $p'= 31.7$ Pa in figure 13. The flame response in figures 13(a)–13(d), with partial periodic lift-off of an individual jet at the left side of the burner, corresponded to the sequence in figure 9(a), demonstrating a quasi-periodicity involving both applied and lift-off frequencies. The phase portraits resulting from that additional lower frequency periodicity in the flow appeared to be more smeared, with the larger trajectories reflecting the lower frequency lift-off and the smaller oscillations associated with the applied frequency (figure 13c). This result was somewhat unexpected in that the actual degree of periodic lift-off for this condition was not as great as for single jets (for example, compare figures 6(a) and 13(a) for single and triple jets, respectively). Nevertheless, the alteration in the phase portraits provided a clear dynamical signature for the SOC–PLOR transition condition in flame–acoustic coupling, which for the triple jet at $Re = 40$ occurred at roughly $p' = 27.1$ Pa.
Visible images over one period (a) and POD results for modes 1–4 (b–d) for the triple jet burner with  $Re=40$ and local perturbation pressure $p'=27.1$ Pa. (a) Visible imaging over one cycle. (b) First four POD modes. (c) The POD-based phase portraits. (d) The POD mode spectra.

Visible images over one period (a) and POD results for modes 1–4 (b–d) for the triple jet burner with  $Re=40$ and local perturbation pressure $p'=31.7$ Pa. (a) Visible imaging over one cycle. (b) First four POD modes. (c) The POD-based phase portraits. (d) The POD mode spectra.

Full-scale PLOR in the triple jet flame manifested itself in much more vigorous flame distortion, as seen previously for  $p' = 37.7$ Pa in figure 9(b); this is shown as well for $p' = 37.1$ Pa in the sequences of images over one cycle in figure 14(a). There continued to be multiple frequencies apparent in the POD-based modal spectra (figure 14d), associated with periodic lift-off and applied excitation and their harmonics and linear combinations, evidence of quasi-periodic behaviour but with greater dominance of the lift-off phenomenon. Interestingly, the energetic content of the first POD mode was larger here (figure 14b) than for the transitional case in figure 13(b), revealing the increasing dominance of the lift-off process and its lower frequency in the overall dynamics. Moreover, the phase portraits revealed much larger-scale trajectories associated with the larger-scale periodic lift-off, but still with evidence of the smaller-scale oscillations associated with applied excitation. Beyond this amplitude of excitation, the triple jet flame experienced a full-scale flame BO. Video animations of the oscillating triple flames and associated POD coefficient plots/phase portraits may be seen in the supplementary files named movie 4, movie 5, movie 6 and movie 7, for the results shown in figures 11, 12, 13 and 14, respectively.
Visible images over one period (a) and POD results for modes 1–4 (b–d) for the triple jet burner with  $Re=40$ and local perturbation pressure $p'=37.1$ Pa. (a) Visible imaging over one cycle. (b) First four POD modes. (c) The POD-based phase portraits. (d) The POD mode spectra.

The extensive range of datasets involving the triple fuel jet burner enabled characterization of the flame transition boundaries (from SOC to transitional SOC/PLOR to full-scale PLOR to BO) as well as quantification of the variation in cumulative energetic content for the different types of flame dynamical behaviours. Plots of the local perturbation amplitudes required us to create transitional SOC/PLOR, PLOR and BO for the triple jet flame as a function of jet Reynolds number and are shown in figure 15. An example of the cumulative energetic content for the different dynamical behaviours reflected in figures 11–14, in addition to other conditions, may be found in figure 16.
Points of transition based on forcing amplitude for the triple fuel jet for  $Re = 20\unicode{x2013}80$, corresponding to acoustic forcing $f_a=332$ Hz and a relative flame location $x/\lambda = +0.029$. Green circle markers represent forcing amplitude $p'$ creating the transition from SOC to SOC/PLOR behaviour, red circles represent the transition for relatively full-scale PLOR and blue crosses represent the amplitude causing flame BO/extinction. The dashed lines represent a fit of the points representing these boundaries.

Cumulative POD modal energetic content as a function of mode number for the triple fuel jet under various amplitudes of excitation associated with  $f_a= 332$ Hz and flame relative location $x/ \lambda = +0.029$. Forcing conditions corresponding to a transition between SOC and the SOC/PLOR behaviour occurred between $p' = 26.2$ and 27.1 Pa.

In the transition boundary plot of figure 15 one sees a monotonic increase in the forcing amplitude required to achieve transition with increasing jet Reynolds number, similar to the single jet case in figure 7. But of course the ‘transitional’ SOC/PLOR behaviour, in which one fuel jet demonstrated lift-off and the others did not, was unique to the triple jet. Overall, both single and triple fuel jet configurations exhibited a similar flame dynamics at similar amplitudes of excitation, although close to BO the single jet flame appeared to withstand higher excitation amplitudes during PLOR behaviour than the triple jet flames, which were influenced by each other's complexity and localized lift-off.
In figure 16, there was a clear difference in the cumulative modal energy associated with SOC behaviour as compared with transitional SOC/PLOR and full-scale PLOR behaviour. For SOC cases, whose characteristic signature was clearly delineated in phase portraits, more than 90 % of the energetic content could be represented by as few as 4 POD modes. In contrast, for PLOR or even transitional SOC/PLOR cases for the triple jet, 10 POD modes were barely capable of capturing 70 % of the flame dynamics’ energy. Hence, not only were characteristic signatures in phase portraits quite different for different types of acoustic–flame coupling, but the requirements for characterizing the flame dynamics in terms of numbers of modal components were quite different as well.
4. Concluding remarks
The present study investigated the response of single and triple methane microjet diffusion flames to acoustic forcing at various forcing amplitudes and jet Reynolds numbers. Several different regimes of flame–acoustic coupling were documented, including (i) SOC, demonstrating a clear flame response with linear–periodic coupling to the applied excitation frequency; (ii) in the case of the triple flame, transitional behaviour, with a partial lift-off of individual jets, leading to quasi-periodic dynamical response and coupling among different portions of the flame, with an associated alteration in the phase portrait extracted from POD mode coefficients; (iii) whole (or nearly whole) flame PLOR, with nonlinear response as evidenced via localized smearing of the non-symmetric phase portrait; and (iv) full-scale flame BO. While high-speed visible imaging determined the conditions for transition in flame behaviour, the observations were also associated with a clear alteration in the phase portrait topologies extracted from POD mode coefficients. Even a very small change in excitation amplitude near the transition condition could cause a dramatic alteration in the phase portrait, e.g. as in figures 11 and 12.
It is interesting to observe that the transition in both single and triple jet flames from SOC to PLOR appeared when the degree of flame deflection away from the PN became more significant. Given that the effective acoustic radiation force, thought to be responsible for the basic deflection, is in general analogous to a force arising due to buoyancy (Tanabe et al. Reference Tanabe, Morita, Aoki, Satoh, Fujimori, Sato, Tanabe, Aoki and Fujimori2000; Sevilla-Esparza et al. Reference Sevilla-Esparza, Wegener, Teshome, Rodriguez, Smith and Karagozian2014), this observation can aid in interpreting the periodic lift-off phenomenon. Unforced lifted buoyant flames at Reynolds numbers around 50 are documented to naturally produce very low frequency oscillations, of the order of a few Hz (per Won et al. Reference Won, Chung, Cha and Lee2000). This same frequency range was observed for periodic flame lift-off and reattachment in the present experiments. Although the present experimental diagnostics (visible imaging) were not able to detect natural flame oscillations, ongoing explorations with alternative diagnostics may provide the ability to detect any weak natural instabilities, with the potential for comparisons with PLOR phenomena.
In the present studies, cumulative modal energetic content for these different injectors under different excitation conditions, e.g. in figures 8 and 16, suggested that significantly fewer POD modes would be required to represent the dynamics of SOC. This implies that a ROM for this phenomenon would similarly require far fewer modes, although it likely would involve a different model for the single jet as compared with the triple jet. In contrast, for the acoustically coupled combustion process undergoing PLOR or transitional SOC/PLOR, many additional modes and associated complexity in the ROM would be required to capture the essential dynamics. Nevertheless, there are modelling approaches available, for example, the SINDy (sparse identification of nonlinear dynamical systems) methodology (Brunton, Proctor & Kutz Reference Brunton, Proctor and Kutz2016), which could be incorporated in representing the flame dynamics at least up to the transition condition, potentially enabling prediction of the transition to PLOR. This is the subject of ongoing research, with the aim of employing such models in developing active or even passive control approaches for combustion engines. The present analysis tools are helpful in enabling an understanding of the evolving flame dynamics and the physical mechanisms associated with it, in addition to other aspects of acoustically coupled combustion processes.
Supplementary movies
Supplementary movies are available at https://doi.org/10.1017/jfm.2023.714.
Funding
This research was funded by the Air Force Office of Scientific Research (AFOSR) under Award Nos. FA9550-19-1-0096 and FA9550-22-1-0190, with Dr M. Birkan as program manager. The authors acknowledge Kulite Semiconductor Products, Inc. and Elite Motion Systems, LLC (President L. Vladic) for their donation of pressure transducers and the lens used in this study, respectively. Special thanks are offered to Dr H.S. Sim and J. Guerrero for their contributions to the initial stages of this research project and to Mr F. Stanback for his donation of funds enabling the purchase of the high-speed camera.
Declaration of interests
The authors report no conflict of interest.


 Open access