

Breast cancer (BC) remains the highest incident cancer affecting women worldwide, with almost 1 670 000 cases registered in 2012. It is a major public health concern with mortality from BC accounting for over 522 000 deaths in 2012, including almost 198 000 deaths in Western countries and about 324 000 in less developed regions( Reference Bray, Ren and Masuyer 1 ). Established BC risk factors include age, genetic mutations, ethnicity, height, reproductive history, breast-feeding, hormone therapy and diabetes( Reference Key, Verkasalo and Banks 2 – Reference Anothaisintawee, Wiratkapun and Lerdsitthichai 6 ). Besides these, a number of modifiable lifestyle factors are associated with BC such as smoking( Reference McKenzie, Ellison-Loschmann and Jeffreys 7 , Reference Terry and Goodman 8 ), body fat and obesity( Reference Rohan, Heo and Choi 9 – Reference Amadou, Hainaut and Romieu 11 ), physical inactivity( Reference McCullough, Eng and Bradshaw 10 , 12 , Reference Monninkhof, Elias and Vlems 13 ), alcohol consumption( Reference Fagherazzi, Vilier and Boutron-Ruault 14 – Reference Zhang, Lee and Manson 16 ) and diet( Reference Chlebowski 5 , Reference Cui, Dai and Tseng 17 , Reference Levi, Pasche and Lucchini 18 ). Diet has been suggested to account for up to 25–40 % of preventable causes of cancers; in particular, 50 % of BC deaths are linked to diet, although the consensus around this estimate is not unanimous( 12 , Reference Doll 19 , Reference Anand, Kunnumakkara and Kunnumakara 20 ). Standard approaches customarily evaluate the risk of BC associated with one or a group of dietary items, i.e. food(s) or nutrient(s). Nevertheless, associations between diet and disease might be missed when one parses the effect of a limited list of dietary constituents. Although this simplified approach of examining a single food or nutrient at a time has led to important results on the role of an individual dietary component in BC aetiology, such as fibre from vegetables, alcohol, tea consumption, folate and other micronutrients( 12 , Reference Fagherazzi, Vilier and Boutron-Ruault 14 , Reference Levi, Pasche and Lucchini 18 , Reference Anand, Kunnumakkara and Kunnumakara 20 – Reference Shrubsole, Jin and Dai 23 ), research might benefit from a more comprehensive approach by exploring BC aetiology in terms of an integrated ensemble of dietary characteristics.
To capture the complexity of individuals’ dietary habits, dietary pattern analysis has emerged as a complementary holistic methodology focusing on sets of dietary variables and addressing their inherent interrelations( Reference Jacques and Tucker 24 ). This approach is justified as components of dietary exposure are not independent( Reference Hu 25 , Reference Jacobs and Steffen 26 ) and because it allows to account for complex relationships between nutrients in biological pathways( Reference Hu 25 ). In addition, BC is a multifactorial disease( Reference Key, Verkasalo and Banks 2 – Reference Levi, Pasche and Lucchini 18 ), the aetiology of which possibly depends on more than a restricted list of dietary items.
Recent investigations carried out in Western populations( Reference De Stefani, Deneo-Pellegrini and Boffetta 27 – Reference De Stefani, Boffetta and Ronco 32 ) have consistently identified two main dietary patterns: the prudent/healthy and the Western/unhealthy( Reference Nkondjock, Krewski and Johnson 29 , Reference Brennan, Cantwell and Cardwell 33 ). While diet is related to cultural background, common nutrients are present in different combinations of foods; hence looking into diet–disease associations on the nutrient scale could lead to the identification of specific nutritional profiles relevant to BC aetiology.
In the present study, nutrient patterns within the European Investigation into Cancer and Nutrition (EPIC) were related to BC risk. Nutrient patterns were obtained by applying the treelet transform (TT) that has recently been introduced into nutritional epidemiology( Reference Dahm, Gorst-Rasmussen and Crowe 34 – Reference Schoenaker DAJM and Soedamah-Muthu 36 ) and the well-known principal component analysis (PCA) was used for the sake of comparison( Reference Jolliffe 37 ). TT yields sparse components and reveals the intrinsic structure of the data, thus simplifying interpretability. Aspects related to the application of TT to dietary data in the context of a multi-centre study are described and discussed. The association between nutrient patterns and BC was evaluated using all BC cases and by taking into account the heterogeneity of BC subtypes by integrating information on menopausal and hormone receptor status.
Materials and methods
Study population and exclusion criteria
EPIC is a large prospective cohort of 521 330 healthy men and women designed to evaluate the relationships between dietary habits, nutrition, lifestyle factors and the incidence of cancer. The EPIC cohort includes participants from twenty-three centres in France, Germany, Denmark, Sweden, Norway, Greece, Italy, the Netherlands, Spain and the UK. In most centres, participants were recruited from the general population, the exceptions being France (women were enrolled from a national health insurance scheme covering teachers in the French education system employees), Italy (Turin and Ragusa: blood donors; Florence: screening programme participants), Spain (blood donors) and the Netherlands (Utrecht: women participating in BC screening). In Norway, only women from the general population were recruited and in the UK, one-half of the cohort (the Oxford sub-cohort) consisted of ‘health-conscious’ individuals from England, Wales, Scotland and Northern Ireland. The design of the study and its rationale along with the recruitment process have been described elsewhere( Reference Riboli, Hunt and Slimani 38 ).
Among the 521 330 EPIC participants, men were first removed (n 153 427). Women with prevalent cancers at any site at baseline (other than non-melanoma skin cancer; n 19 853) or lost to follow-up (n 2892) were excluded, as were women who did not complete any dietary questionnaire (n 3315) and those who did not complete a lifestyle questionnaire (n 26). To avoid including extreme values, participants in the top and bottom 1 % of the distribution of the ratio of reported total energy intake to energy requirement (n 6753) were excluded. After exclusion of non-first BC cases (n 2) the cohort included 335 062 women upon whom the dietary patterns were derived. An additional number of women (n 212) with missing information on BC status were excluded, which left 334 850 women retained for the statistical analyses.
Cancer assessment
Incident BC cases were identified through population cancer registries (Denmark, Italy, Netherlands, Norway, Spain, Sweden and UK) or through active follow-up (France, Germany, Naples and Greece), as detailed in Ferrari et al. ( Reference Ferrari, Rinaldi and Jenab 21 ). Information on oestrogen receptor (ER) and progesterone receptor (PR) statuses was provided by each centre on the basis of pathology reports.
Dietary assessment
Long-term usual dietary intake was assessed at baseline using country-specific and validated dietary questionnaires (self-administered FFQ, semi-quantitative or interviewer-performed)( Reference Riboli, Hunt and Slimani 38 – Reference Kaaks, Slimani and Riboli 40 ). In the validation studies, the dietary questionnaires were compared with a reference method which was in most centres 24 h dietary recalls, except in Sweden and the UK, where food records were used. Generally, the correlation coefficients were between 0·40 and 0·70 for all nutrients examined which was considered satisfactory( Reference Margetts and Pietinen 41 ). Individual intakes of twenty-three nutrients and total energy were estimated using a common food composition database, the EPIC Nutrient Database (ENDB), which was compiled from national food composition databases of the ten countries represented in EPIC following standardized procedures( Reference Slimani, Deharveng and Unwin 42 , Reference Bouckaert, Slimani and Nicolas 43 ).
Lifestyle questionnaires
Information on sociodemographic characteristics, including education, and lifestyle habits such as levels of physical activity, tobacco smoking, as well as consumption of alcohol and drinking habits, were collected using lifestyle questionnaires. In addition, anthropometric measures and past medical information were gathered at recruitment( Reference Riboli, Hunt and Slimani 38 ).
Nutrient pattern assessment
EPIC-wide nutrient patterns were derived among female participants in EPIC using TT in the main analysis and PCA in the sensitivity analysis. The sample covariance matrix of twenty-three log-transformed nutrient densities, computed using alcohol-free energy intake( Reference Willett, Howe and Kushi 44 ), was consistently used. The use of the sample covariance matrix allows variability to be informative in the pattern discovery phase. The distribution of nutrient consumption tends to be log-normal and may not be best described by the mean and variance on the original scale. Moreover micro- and macronutrients are expressed on different scales (micrograms, milligrams or grams). The nutrient densities were log-transformed to remove scale dependence and render their variance (or covariance) independent of the unit of measure. In line with previous work( Reference Edefonti, Bravi and Garavello 28 , Reference Moskal, Pisa and Ferrari 45 , Reference Imamura, Lichtenstein and Dallal 46 ), alcohol intake was not included and was considered as a lifestyle factor. Total fat was divided into MUFA, PUFA and SFA, and total carbohydrates were broken down into starch and sugar. The micro- and macronutrients studied were Ca, β-carotene, cholesterol, MUFA, PUFA, SFA, Fe, fibre, K, Mg, P, protein, retinol, riboflavin, starch, sugar, thiamin, vitamins B6, B12, C, D, E and folate. The list of nutrients as well as the approach described for their handling is consistent with the nutrient patterns initiative within EPIC described by Moskal et al.( Reference Moskal, Pisa and Ferrari 45 ).
Pattern extraction
The TT method used for pattern extraction is described in detail by Gorst-Rasmussen and co-workers( Reference Gorst-Rasmussen, Dahm and Dethlefsen 35 , Reference Gorst-Rasmussen 47 ). Briefly, TT is a dimension reduction technique aimed at converting a set of observations of possibly correlated variables into orthogonal components. TT scores, corresponding to the projection of data onto components, generally have a small degree of correlation, unlike PCA scores that are always uncorrelated. The number of retained components was based on the percentage of explained variance, scree plots and interpretability. The nutrient patterns were defined after the inspection of factor loadings, i.e. eigenvectors, expressing the contribution of nutrients to a given component. Score variables were determined for each component of TT and reflected adherence to a given type of diet/nutrient profile. TT combines the quantitative pattern extraction capabilities of PCA with interpretational advantages of hierarchical clustering of variables. In TT, the two variables displaying the highest correlation (or covariance) are identified, and a PCA is performed on them. The two variables are then replaced with the score of their first PCA component and a merge is indicated in the cluster tree. This operation is re-iterated until all variables have joined the cluster tree. In this way, TT produces a hierarchical grouping of variables which may reveal intrinsic characteristics of data structure. An important feature of TT is that it introduces sparsity into factors, making many factors loadings exactly equal to zero, potentially simplifying the interpretation. Alongside the cluster tree dendrogram produced by TT (as exemplified in Fig. 1), TT yields a coordinate system for the data at each level of the cluster tree. Selecting a cluster tree level (cut-level) for the TT cluster tree amounts to choosing the level of detail desired in the dimension reduction of data. More variation can be explained at the cost of factor sparsity when the cluster tree is cut near its ‘root’. If the data have p variables, there are p – 1 possible cut-levels. After deciding on the number of components to retain, we performed a tenfold cross-validation to identify the optimal cut-level, i.e. the point at which increasing the cut-level does not substantially increase the variation of the retained patterns. We also performed a sensitivity analysis to assess the effect of different cut-levels( Reference Gorst-Rasmussen, Dahm and Dethlefsen 35 , Reference Meinshausen and Bühlmann 48 ).
Cluster tree produced by the treelet transform algorithm applied to twenty-three log-transformed nutrient densities for 335062 women in the European Prospective Investigation into Cancer and Nutrition (EPIC). The dashed line indicates the chosen cut-level (16) to extract components. The highest-variance factors, i.e. treelet components at this level of the tree, are indicated with numbered circles. The nutrients related to these nodes have non-zero loadings on the given component. Components 1 and 3 share the same node but the variable loadings differ

Consistently, a PCA was also applied for the sake of comparison( Reference Jolliffe 37 ). This technique yields orthogonal components that are invariant to the number of subsequent components retained. PCA identifies the best linear combination of the variables accounting for the most variance observed in the original data, producing components with uncorrelated scores. Results of TT analysis were compared with findings obtained with the more classic PCA method. To make the comparison easier, and because TT returns sparse vectors, only nutrients with absolute loadings greater than 0·2 were retained to identify a given pattern in PCA.
Patterns and breast cancer risk
The associations between nutrient patterns and risk of BC were investigated by using Cox proportional hazards regression models to estimate hazard ratios (HR) and 95 % confidence intervals. Breslow’s method was adopted for handling time ties( Reference Thiébaut and Bénichou 49 ). The time at entry was the age at recruitment and the time of exit was the age at cancer diagnosis, death, loss or end of follow-up, whichever happened first. Models were stratified by centre, to control for differences in questionnaire designs, follow-up procedures and other centre-specific effects, as well as for age at recruitment (1-year categories)( Reference Ferrari, Day and Boshuizen 50 ). Analyses were performed by considering the TT (and principal component (PC)) scores in quintiles to appreciate potential departure from linearity. Statistical analyses were adjusted for baseline menopausal status (premenopausal and perimenopausal (reference) or postmenopausal and women who underwent an ovariectomy), baseline alcohol intake (never drinkers (reference), former drinkers, drinkers only at recruitment, lifetime drinkers, unknown), height (continuous), BMI (below (reference) or above 25 kg/m2), schooling level (none, primary (reference), technical/professional/secondary, longer education, unknown/unspecified), age at first full-term pregnancy (nulliparous (reference), ≤21 years, 21–30 years, >30 years, unknown or missing), age at menarche (≤12 years (reference), 12–14 years, >14 years, missing), age at menopause (≤50 years (reference), >50 years, premenopausal or missing), use of hormone replacement therapy (never (reference), ever, unknown), level of physical activity (categorical, metabolic equivalents of task (MET)/h: inactive (reference), moderately inactive, moderately active, active, unknown) and alcohol-free energy (continuous). Use of oral contraceptive pills (never (reference), ever or unknown) and smoking status (never smokers (reference), ex-smokers, current smokers, unknown) were evaluated but not retained in the final models, due to limiting confounding exerted by these variables.
The overall significance of a score variable in categories was evaluated using the likelihood ratio test statistics (P LRT) with df=4. Additionally, P values for trend (P trend) were computed by modelling a score variable with quintile-specific medians as continuous. The association between nutrient patterns and BC risk was evaluated in pre- and postmenopausal women and according to BC hormonal receptor status (ER/PR status). Interaction between menopausal status and pattern scores was explored. In addition, tests of heterogeneity of associations according to receptor status were performed using the data-augmentation method( Reference Lunn and McNeil 51 ) by comparing the difference in the log likelihood between a model with receptor status-specific variable and a model with a single HR estimate for the two categories of receptor status to a χ 2 distribution with df=1 (P heterogeneity).
Departure from linearity was explored with restricted cubic splines( Reference Heinzel and Kaider 52 ), using five knots corresponding to the 1st and 99th percentiles and medians of the centred scores of quintiles 1, 3 and 5. Spline plots were produced by taking the median of the first quintile as reference. Departures from linearity were assessed via an evaluation of the joint significance of variables other than the linear one included in the model using Wald’s test on df=3. Associations between all of the PC and BC were investigated in a consistent way.
Statistical tests were two-sided, the per-test significance level was set to α=0·05. All analyses were performed using the SAS statistical software package version 9·3; the ‘tt’ package in the STATA statistical software package release 12 was used to perform TT.
Results
A total of 11 576 BC cases were recorded in 11·5 years of median follow-up time and 3 670 439 person-years. Based on the information obtained at baseline, 2827 cases were premenopausal, 5872 were postmenopausal, 2548 were perimenopausal and 328 cases had a bilateral ovariectomy. Among incident cases, information on hormone receptor status for ER and PR was available only in 62 % and 52 % of total cancer cases, respectively, and was distributed as follows: 81 % ER+ and 19 % ER− tumours and 63 % PR+ and 37 % PR− tumours. Descriptive information of the study sample by EPIC country is available in Table 1.
Numbers of women and breast cancer (BC) cases (first tumours only) in the European Prospective Investigation into Cancer and Nutrition (EPIC) cohort by country

* Median is given for follow-up time and age at enrolment.
Identification of nutrient patterns
Inspection of factor loadings allowed an initial identification of four nutrient patterns with TT, explaining 62 % of total nutrient intake variability within individuals. After a tenfold cross-validation along with a sensitivity analysis strategy and after evaluating the interpretability of each pattern, we chose to cut the cluster tree at level 16. Loadings of components 1 and 2 are shown in Table 2. TT yielded a dendrogram shown in Fig. 1, with numbered nodes indicating the four highest-variance factors, where factors 1 and 2 were identified as the first two components after setting the cut-level to 16 indicated by the dashed line. This dendrogram reveals the correlation structure of the log-transformed nutrient densities. The first treelet component (TC1) loaded on vitamin D, vitamin B12, cholesterol, protein and retinol, suggesting a diet rich in animal products. The second treelet component (TC2) presented high positive loadings on β-carotene, thiamin, fibre, vitamin C and folate, and singled out some nutrients with mild loadings (<0·2), i.e. Fe, Ca, K, Mg and P (Table 2). TC2 may evoke a diet rich in vegetables, fruits and cereals. While the third treelet component (TC3) was largely driven by vitamin D, the fourth treelet component (TC4) was less straightforward to characterize, as displayed in the online supplementary material, Supplemental Table 1. Distributions of known risk factors for BC by quintiles of TT scores for the first two components are displayed in Table 3.
Loadings of the first two components from treelet transform (TT; cut-level 16)

TC1, treelet component 1; TC2, treelet component 2.
* Log-transformed nutrient variables.
Lifestyle and dietary baseline characteristicsFootnote * according to the lowest, middle and highest quintiles of treelet transform (cut-level 16) scores for the first and second components among 334 850 women in the European Prospective Investigation into Cancer and Nutrition (EPIC)
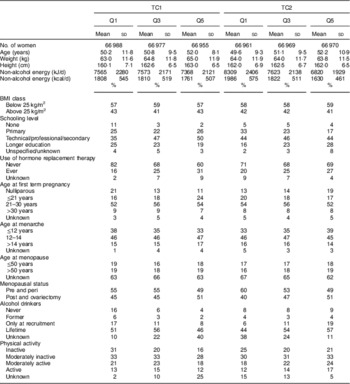
TC1, treelet component 1; TC2, treelet component 2; Q1, quintile 1; Q3, quintile 3; Q5, quintile 5.
* Means and standard deviations are presented for continuous variables, and frequencies are presented for categorical variables.
PC loadings are displayed in the online supplementary material, Supplemental Table 2. PCA produced patterns similar to TT with respect to the amount of variability explained and the nutrients contributing to the definition of each component: with PC1 displaying high loadings for cholesterol, retinol, vitamin B12 and vitamin D and negative loadings for vitamin C and β-carotene; and PC2 suggesting a micronutrient-dense pattern rich in fruits, vegetables, plant foods and dairy. The first two components (in TT and PCA) explained the most variability and were the most informative with respect to capturing meaningful nutrient patterns, and thus were further related to BC risk in disease models.
Nutrient patterns and breast cancer risk
Scores of nutrient patterns were related to BC risk. TC1 showed no statistically significant association with BC risk with HRTC1 Q5 v. Q1=1·05 (95 % CI 0·98, 1·13, P trend=0·36, P LRT=0·39), while TC2 was significantly associated with BC risk with HRTC2 Q5 v. Q1=0·89 (95 % CI 0·83, 0·95, P trend<0·001, P LRT=0·02), as shown in Table 4. The relationship between TT scores and BC risk was modelled through restricted cubic splines (RCS) and is presented in Fig. 2. Overall, there was a significant progressive decrease in BC risk for the second component. TC2 scores showed a linear decrease in BC risk (RCSTC2 P trend=0·02). However, no departure from linearity was observed (P Wald non-linearity=0·94 and 0·77, respectively, in TC1 and TC2; Fig. 2). Analyses of interaction between TC (or PC) scores and menopausal status were not statistically significant (results not shown).
Relationship between nutrient patterns derived from treelet transform and breast cancer risk (———, hazard ratio (HR); – – – – –, associated 95 % CI), obtained by using restrictive cubic splines with values of 1st and 99th percentiles and medians of quintiles 1, 3 and 5 used as knots, among 334 850 women in the European Prospective Investigation into Cancer and Nutrition (EPIC): (a) first treelet component (TC1), P non-linearity=0·94, P trend=0·88; (b) second treelet component (TC2), P non-linearity=0·77, P trend=0·02. Models were stratified by study centre and age in 1-year categories and adjusted for baseline menopausal status (premenopausal and perimenopausal (reference) or postmenopausal and women who underwent an ovariectomy), baseline alcohol intake (never drinkers (reference), former drinkers, drinkers only at recruitment, lifetime drinkers, unknown), height (continuous), BMI (below (reference) or above 25 kg/m2), schooling level (none, primary (reference), technical/professional/secondary, longer education, unknown/unspecified), age at first full-term pregnancy (nulliparous (reference), ≤21 years, 21–30 years, >30 years, unknown or missing), age at menarche (≤12 years (reference), 12–14 years, >14 years, missing), age at menopause (≤50 years (reference), >50 years, pre-menopause or missing), use of hormone replacement therapy (never (reference), ever, unknown), level of physical activity (inactive (reference), moderately inactive, moderately active, active, unknown) and alcohol-free energy (continuous). P trend was obtained by evaluating the joint significance of variables other than the linear one in the model by using Wald’s test with df=3

Hazard ratios (HR) and 95 % confidence intervals for breast cancer (BC) by quintiles of pattern scores (first and second components of treelet transform, cut-level 16) for overall, oestrogen receptor-positive (ER+) and oestrogen receptor-negative (ER−) tumours in 334 850 women in the European Prospective Investigation into Cancer and Nutrition (EPIC)

TC1, treelet component 1; TC2, treelet component 2; Q1, quintile 1; Q2, quintile 2; Q3, quintile 3; Q4, quintile 4; Q5, quintile 5; Ref., reference category.
* Models were stratified by study centre and age in 1-year categories and adjusted for baseline menopausal status (premenopausal and perimenopausal (reference) or postmenopausal and women who underwent an ovariectomy), baseline alcohol intake (never drinkers (reference), former drinkers, drinkers only at recruitment, lifetime drinkers, unknown), height (continuous), BMI (below (reference) or above 25 kg/m2), schooling level (none, primary (reference), technical/professional/secondary, longer education, unknown/unspecified), age at first full-term pregnancy (nulliparous (reference), ≤21 years, 21–30 years, >30 years, unknown or missing), age at menarche (≤12 years (reference), 12–14 years, >14 years, missing), age at menopause (≤50 years (reference), >50 years, pre-menopause or missing), use of hormone replacement therapy (never (reference), ever, unknown), level of physical activity (inactive (reference), moderately inactive, moderately active, active, unknown) and alcohol-free energy (continuous).
† P LRT, P values for the likelihood ratio test (LRT) that was used to evaluate the overall significance of a score variable in quintile categories compared with a χ 2 distribution with df=4.
‡ P trend, P values obtained by modelling score variables with quintile-specific medians as continuous variables.
§ P heterogeneity, P values for BC risks across ER status with df=1 obtained using a data augmentation method.
Hormonal receptor status
In ER− tumours, no significant association with BC risk was observed for TC1 and TC2 scores (Table 4). For ER+ tumours there was a decrease in BC risk in the fourth and fifth quintiles of TC2 scores with HRQ4 v. Q1=0·90 (95 % CI 0·83, 0·99) and HRQ5 v. Q1=0·89 (95 % CI 0·81, 0·98, P trend=0·02; Table 4). Regarding PR− tumours (see online supplementary material, Supplemental Table 3), the second component TC2 showed a decreased BC risk with HRQ5 v. Q1=0·84 (95 % CI 0·72, 0·98). For PR+ tumours, TC2 was linked with a decreased BC risk in participants in the fifth quintile with HRQ5 v. Q1=0·87 (95 % CI 0·77, 0·98). No significant association was seen for ER−/PR− tumours (Table 5). TC2 was linked with a decreased BC risk trend in ER+/PR+ tumours with HRQ5 v. Q1=0·86 (0·76, 0·98, P trend<0·01; Table 5). Tests of heterogeneity yielded no significant results.
Hazard ratios (HR) and 95 % confidence intervals for breast cancer (BC) by quintiles of pattern scores (first and second components of treelet transform, cut-level 16) for oestrogen receptor-positive+progesterone receptor-positive (ER+/PR+) and oestrogen receptor-negative+progesterone receptor-negative (ER−/PR–) tumours in 334850 women in the European Prospective Investigation into Cancer and Nutrition (EPIC)

TC1, treelet component 1; TC2, treelet component 2; Q1, quintile 1; Q2, quintile 2; Q3, quintile 3; Q4, quintile 4; Q5, quintile 5; Ref., reference category.
* Models were stratified by study centre and age in 1-year categories and adjusted for baseline menopausal status (premenopausal and perimenopausal (reference) or postmenopausal and women who underwent an ovariectomy), baseline alcohol intake (never drinkers (reference), former drinkers, drinkers only at recruitment, lifetime drinkers, unknown), height (continuous), BMI (below (reference) or above 25 kg/m2), schooling level (none, primary (reference), technical/professional/secondary, longer education, unknown/unspecified), age at first full-term pregnancy (nulliparous (reference), ≤21 years, 21–30 years, >30 years, unknown or missing), age at menarche (≤12 years (reference), 12–14 years, >14 years, missing), age at menopause (≤50 years (reference), >50 years, pre-menopause or missing), use of hormone replacement therapy (never (reference), ever, unknown), level of physical activity (inactive (reference), moderately inactive, moderately active, active, unknown) and alcohol-free energy (continuous).
† P LRT, P values for the likelihood ratio test (LRT) that was used to evaluate the overall significance of a score variable in quintile categories compared with a χ 2 distribution with df=4.
‡ P trend, P values obtained by modelling score variables with quintile-specific medians as continuous variables.
§ P heterogeneity, P values for BC risks across ER/PR status with df=1 obtained using a data augmentation method.
PCA derived components displayed a significant increase in BC risk for PC1 in participants in the highest quintile and a decreasing trend of BC risk for PC2, as shown in the online supplementary material, Supplemental Table 4 and Supplemental Fig. 1. Results of associations of PC with tumours by hormone receptor status are displayed in the online supplementary material, Supplemental Tables 4 and 5.
Discussion
In the present study, the role of nutrient patterns in the aetiology of BC was explored through the use of TT, a multivariate method recently introduced to the landscape of nutritional epidemiology( Reference Dahm, Gorst-Rasmussen and Crowe 34 – Reference Schoenaker DAJM and Soedamah-Muthu 36 ). The association was evaluated in the context of the EPIC study, characterized by large variability of dietary habits and by a large number of incident cancer cases across participating centres( Reference Riboli, Hunt and Slimani 38 ).
In recent years, dietary pattern analysis has emerged as a promising technique, complementary to methods focusing on individual foods or food components, to investigate the relationships between diet and risk of disease( Reference Hu 25 ). A systematic review and meta-analysis on dietary patterns in BC aetiology( Reference Brennan, Cantwell and Cardwell 33 ) selected eighteen relevant studies from case–control and cohort studies that used combinations of foods and micronutrients to identify dietary patterns( Reference Cui, Dai and Tseng 17 , Reference De Stefani, Deneo-Pellegrini and Boffetta 27 , Reference Männistö, Dixon and Balder 53 – Reference Edefonti, Decarli and La Vecchia 66 ). Two a posteriori defined patterns emerged consistently: the Western/unhealthy (in seventeen studies) and the prudent/healthy (eighteen studies)( Reference Brennan, Cantwell and Cardwell 33 ). In the aforementioned meta-analysis( Reference Brennan, Cantwell and Cardwell 33 ), the prudent/healthy dietary pattern, rich in intakes of vegetables, leafy vegetables, legumes and fish, was associated to decreased BC risk (relative risk comparing top v. bottom categories=0·89, 95 % CI 0·82, 0·99), while the Western/unhealthy pattern, characterized by intakes of high-fat dairy products, red meat, processed meats and French fries, was not associated with BC risk. A recent study of the California Teachers Cohort identified a plant-based pattern, which was related to a reduction of BC risk( Reference Link, Canchola and Bernstein 67 ). In parallel, increasing evidence is accumulating that adherence to the a priori defined Mediterranean pattern is associated with a decreased BC risk( Reference Trichopoulou, Bamia and Lagiou 68 – Reference Buckland, Travier and Cottet 70 ), although results from these studies are not totally consistent, particularly for premenopausal women( Reference Buckland, Travier and Cottet 70 , Reference Couto, Sandin and Lo 71 ).
The dimension reduction techniques used herein were applied to nutrient densities. Nutrients are present in different combinations of foods, are less country-specific and are directly involved in biological reactions( Reference Edefonti, Hashibe and Ambrogi 72 ). By exploring macro- and micronutrients, the present study aimed to provide an exhaustive representation of individuals’ diet. Log-transformation was used to address scaling issues that can arise because macro- and micronutrients are expressed in different units. In this way, the variance and the components’ decomposition are invariant to the unit of measure. Dietary normalization was achieved using equal energy, i.e. by dividing nutrient intakes by energy intake, minus energy from alcohol intake( Reference Willett, Howe and Kushi 44 ). Most nutrients are associated with total energy because either they contribute to total energy directly or because people with higher energy values tend to display larger intakes of specific nutrients( Reference Willett, Howe and Kushi 44 , Reference Freedman, Hartman and Kipnis 73 ).
The first two patterns were retained as they were the most interpretable and depicted realistic nutrient patterns that could ultimately be linked with disease risk. The first pattern identified a diet characterized by animal products as opposed to a vegetarian diet, and was associated with a non-significant increase of 5 % in BC risk (TT). TC1 was quite comparable to a Western pattern. Two recent reviews on dietary patterns and BC( Reference Edefonti, Randi and La Vecchia 74 , Reference Albuquerque, Baltar and Marchioni 75 ) showed that diets rich in high-fat foods and processed meats were associated with an increased BC risk, although the findings described in both reviews have not been conclusive in this respect with most results reporting a positive association between Western-like dietary pattern and BC being not statistically significant( Reference Edefonti, Randi and La Vecchia 74 , Reference Albuquerque, Baltar and Marchioni 75 ). In our study, the micronutrient-dense pattern characterized by a diet rich in vitamins and minerals, akin to a prudent pattern, was associated with an 11 % reduction in BC risk (TT), in line with previous findings( Reference Brennan, Cantwell and Cardwell 33 , Reference Edefonti, Randi and La Vecchia 74 , Reference Albuquerque, Baltar and Marchioni 75 ). The protective effect may come from the anti-carcinogenic properties of nutrients such as β-carotene, vitamins C and E, that may exert an antioxidant effect on oestrogen metabolism and reduce cell proliferation( Reference Albuquerque, Baltar and Marchioni 75 ). The TT components were highly correlated with those of PCA (ρTC1,PC1=0·91, ρTC2,PC2=0·86). TT and PCA provided overall consistent findings in terms of pattern identification and amount of total variability explained. Further analyses were conducted by menopausal status at cohort enrolment, showing no differential association in pre- and postmenopausal women. Analyses carried out by hormonal receptor status showed that the second TT nutrient pattern was related to a significant decrease in BC risk for ER+, PR+, PR− and ER+/PR+ tumours. These results are complementary to previous literature findings on dietary patterns and hormonal defined risk of BC( Reference Fung, Hu and Holmes 58 , Reference Link, Canchola and Bernstein 67 , Reference Buckland, Travier and Cottet 70 , Reference Albuquerque, Baltar and Marchioni 75 ). Indeed, Fung et al. found that a prudent dietary pattern was linked with decreased ER− risk (relative risk=0·62, 95 % CI 0·45, 0·91)( Reference Fung, Rimm and Spiegelman 76 ). ER−/PR− tumour risk was reduced in postmenopausal women among participants in the highest quintiles of a plant-based pattern and an a priori defined Mediterranean diet by 34 % and 20 %, respectively( Reference Link, Canchola and Bernstein 67 , Reference Buckland, Travier and Cottet 70 ). Results from the Pooling Project of Prospective Studies of Diet and Cancer found a protective association between total fruit or fruit and vegetable consumption in ER− tumours but not in ER+ tumours or overall BC risk( Reference Jung, Spiegelman and Baglietto 77 ).
Whereas a large portion of the scientific literature on dietary patterns has used factor analysis or principal component factor analysis( Reference Edefonti, Randi and La Vecchia 74 ), the current paper promotes the use of TT. While PCA produces patterns that are eigenvectors of a covariance/correlation matrix of starting variables, TT is a multivariate technique that yields components by aggregating variables according to covariance/correlation( Reference Gorst-Rasmussen, Dahm and Dethlefsen 78 ), while at the same time exploring the clustering structure of variables, combining features of PCA with those of cluster analysis. Eventually, TT produces a cluster tree revealing the hierarchical grouping structure of variables. The dendrogram allows a visual inspection of the way different nutrients cluster, possibly easing interpretability of patterns. In addition, loadings are sparse, i.e. some of them are equal to zero as they do not pertain to the clustering node of the component so that a limited number of variables contributes to each treelet component.
In line with other clustering techniques( Reference Krzanowski 79 ), TT users are confronted with subjective decisions to select the appropriate cut-level for the cluster tree. Information on the grouping structure of variables that have joined (or not) the tree are specific to each level of the TT tree. By choosing a cut-level, the user decides on how much information to extract and the degree of sparsity of the components. If the tree is cut near the ‘root’, all nutrient variables join the tree. The information would be comparable to PCA output, i.e. all variables would contribute to treelet components. If the tree is cut closer to the ‘leaves’, i.e. when the cut-level is lower, loadings are sparse as many are equal to zero, possibly making the interpretation easier. By contrast, this may lead to components that do not capture dietary complexity and are therefore not informative. As pointed out by Meinshausen and Bühlmann, the use of TT leads to a trade-off between amount of variability explained and sparsity. The objective is to ‘make the results as sparse as possible but not any sparser’( Reference Meinshausen and Bühlmann 48 ). To identify an optimal cut-level, cross-validation can be used. Once the cut-level is chosen, the loadings computed are invariant to the number of components to be retained; hence keeping n components is an a priori parameter to be specified in the cross-validation step.
The present study relied on dietary questionnaires to assess nutrient intakes, which are prone to measurement errors and may lack information on some relevant nutrients. Questionnaires were country-specific, potentially introducing systematic between-country differences in nutrient assessment. However, in the EPIC study, harmonized composition tables across European countries were used to translate food into nutrient intakes( Reference Slimani, Deharveng and Unwin 42 ), thus sizeably improving the comparability of nutrient intakes.
One key element in pattern literature is reproducibility of patterns across populations. With twenty-three centres from ten countries, EPIC accounts for a wide heterogeneity in diet( Reference Freisling, Fahey and Moskal 80 , Reference Slimani and Margetts 81 ). Previous findings in Moskal et al.’s study( Reference Moskal, Pisa and Ferrari 45 ) on the EPIC data showed that more than 75 % of the variance that would be captured by centre-specific PC was captured by PC from overall PCA. This evidence suggested that overall PCA combining data from all EPIC centres allows capturing a good proportion of the variance explained by each EPIC centre. This motivated the choice of applying pattern decomposition on the overall data.
Conclusion
The current study presented results of a nutrient pattern analysis in an international setting using a new tool, TT, and subsequently related the patterns to risk of developing BC. TT is a complementary method to PCA in nutritional epidemiology as it produces readily interpretable sparse components. In the EPIC study, nutrient patterns characterized by a diet rich in macronutrients of animal origin, such as cholesterol or SFA, were associated with a non-significant increase in BC risk while a diet rich in vitamins, minerals and β-carotene, indicating a more plant-based diet, was associated with a significant decreased BC risk. This decrease was also significant for ER+, PR+, PR− and ER+/PR+ tumours.
Acknowledgements
Acknowledgement: The authors thank Dr Anders Gorst-Rasmussen (Department of Cardiology, Aalborg University Hospital) for his critical input and useful discussions about the manuscript. Financial support: The coordination of the EPIC study is financially supported by the European Commission (Directorate General for Health and Consumer Affairs) and the International Agency for Research on Cancer (IARC). The national cohorts are supported by: the Health Research Fund (FIS) of the Spanish Ministry of Health RTICC ‘Red Temática de Investigación Cooperativa en Cáncer (grant numbers Rd06/0020/0091 and Rd12/0036/0018), the Regional Governments of Andalucía, Asturias, Basque Country, Murcia (project 6236) and Navarra, and the Instituto de Salud Carlos III, Redes de Investigacion Cooperativa (RD06/0020) (Spain); the Danish Cancer Society (Denmark); the Ligue Contre le Cancer, the Institut Gustave Roussy, Mutuelle Générale de l’Education Nationale and the Institut National de la Santé et de la Recherche Médicale (France); the Deutsche Krebshilfe, the Deutsches Krebsforschungszentrum and the Federal Ministry of Education and Research (Germany); the Hellenic Health Foundation, the Stavros Niarchos Foundation and the Hellenic Ministry of Health and Social Solidarity (Greece); the Italian Association for Research on Cancer (AIRC) and the National Research Council (Italy); the Dutch Ministry of Public Health, Welfare and Sports, the Netherlands Cancer Registry, LK Research Funds, Dutch Prevention Funds, Dutch Zorg Onderzoek Nederland, the World Cancer Research Fund and Statistics Netherlands (Netherlands); the European Research Council (2009-AdG 232997) and the Nordforsk, Nordic Centre of Excellence programme on Food, Nutrition and Health (Norway); the Swedish Cancer Society, the Swedish Research Council and the Regional Governments of Skåne and Västerbotten (Sweden); Cancer Research UK, the Medical Research Council, the Stroke Association, the British Heart Foundation, the Department of Health, the Food Standards Agency and the Wellcome Trust (UK). The work undertaken by N.A. was supported by a Université de Lyon doctoral grant (EDISS doctoral school). Conflict of interest: None. Authorship: The authors’ responsibilities were as follows. N.A. performed statistical analyses; N.A. and P.F. interpreted the findings and developed a first draft of the manuscript; A.M., N.S., V.V., V.C., H.F., S.M., S.K., J.F., E.W., L.L.-B. and I.R. contributed to the writing of the manuscript; P.A., E.A., E.M.-M., D.S., J.R.Q., A.O., A.Tj., C.C.D., K.O., L.D., A.F., L.B., R.T.F., R.K., A.Tr., C.B., P.O., M.S.D.M., G.M., C.A., F.R., R.Tu., H.B.B.d.M., M.F.B., P.H.M.P., G.S., T.B., A.W., I.J., K.-T.K., N.J.W., T.K., R.Tr., J.A.S., M.A.M. and E.R. substantially contributed to the interpretation of results and critically revised the content of the manuscript; and all authors contributed to the planning, execution and interpretation of the submitted manuscript, and read and approved the final manuscript. Ethics of human subject participation: This study was conducted according to the guidelines laid down in the Declaration of Helsinki and all procedures involving human subjects were approved by the IARC and the local ethical review committees. Written informed consent was obtained from all participants.
Supplementary material
To view supplementary material for this article, please visit http://dx.doi.org/10.1017/S1368980015000294


