


1. Introduction
Scale interactions in turbulent flows can be studied using the filtering approach, in which a spatial filter separates large from small scales (Leonard Reference Leonard1975; Germano Reference Germano1992; Pope Reference Pope2000). Such studies are of particular interest in the context of large-eddy simulations (LES) of turbulent flows (Pope Reference Pope2000; Sagaut Reference Sagaut2001), where some but not all scales are solved for explicitly. The effect of scales smaller than the filter size is modelled by modifying the stress tensor in the equations. Most existing subfilter (or subgrid-scale (SGS)) models used in practical LES today rely on the concept of eddy viscosity, which models the interaction between small- and large-scale turbulent structures in analogy to molecular viscosity. The subfilter-scale stress tensor is set to be proportional to the strain-rate tensor of the resolved (filtered) motions at the same spatial position and time. While various models differ in how the proportionality factor, the eddy viscosity, is specified (e.g. Smagorinsky (Smagorinsky Reference Smagorinsky1963), dynamic Smagorinsky, (Germano et al. Reference Germano, Piomelli, Moin and Cabot1991), Vreman (Vreman, Geurts & Kuerten Reference Vreman, Geurts and Kuerten1996), wall adapting local eddy-viscosity model (WALE, Nicoud & Ducros Reference Nicoud and Ducros1999)), the approach is in essence a spatially and temporally local closure model.
In recent years, several approaches to including non-local effects for turbulent stresses have been proposed. In the context of Reynolds averaged Navier–Stokes (RANS), non-local models for the Reynolds stresses and scalar fluxes have been explored by Hamba (Reference Hamba1995, Reference Hamba2004, Reference Hamba2005), following the ideas of Kraichnan (Reference Kraichnan1987), and by Nazarenko, Kevlahan & Dubrulle (Reference Nazarenko, Kevlahan and Dubrulle2000) in the context of rapid distortion theory. These works derived explicit non-local in time and space expressions for the Reynolds stresses and scalar fluxes using Green's functions on the equations for the fluctuating velocity, then validated their results based on a priori tests. More in general, closures with temporal memory arise from the Mori–Zwanzig formalism (Zwanzig Reference Zwanzig2001; Li et al. Reference Li, Lee, Darve and Karniadakis2017; Parish & Duraisamy Reference Parish and Duraisamy2017) for deriving evolution equations for the coarse-grained dynamics. Spatially non-local expressions for the Reynolds stresses have also been obtained recently by the ‘macroscopic forcing method’ (Shirian & Mani Reference Shirian and Mani2019) or by treating turbulence dissipation as caused by singular spatio-temporal events interspersed in Euler equation evolution (Pomeau & Berre Reference Pomeau and Berre2019).
Aiming to represent non-locality using compact representations has led to consideration of fractional operators to represent fluxes and stress tensors. Fractional differential operators can be roughly understood as operators that, when applied iteratively a certain number of times, coincide with a given integer differential operator (Samko Reference Samko1993; Lischke et al. Reference Lischke2019). When their order is not an integer, they can be understood as an operation lying somewhere in between differentiation and integration and they are thus inherently non-local. Several definitions exist, each suited to different problems. Traditionally, fractional derivatives have been used successfully to model anomalous diffusion and complicated materials (Caputo Reference Caputo1967; Carpinteri & Mainardi Reference Carpinteri and Mainardi1997). In turbulence, the application of non-local Levy walks to model intermittency (Shlesinger, West & Klafter Reference Shlesinger, West and Klafter1987; Dubrulle & Laval Reference Dubrulle and Laval1998) has led to RANS models based on fractional Laplacians (Chen Reference Chen2006; Lischke et al. Reference Lischke2019). The RANS modelling can also be achieved via other types of fractional operators (Egolf & Hutter Reference Egolf and Hutter2017; Epps & Cushman-Roisin Reference Epps and Cushman-Roisin2018). In particular, recent developments of channel flow modelling using the Caputo derivative (Song & Karniadakis Reference Song and Karniadakis2018) to model the entire stress (viscous and Reynolds shear stress) show universal behaviour of the fractional order as function of wall distance in viscous units. For LES, a recent paper (Samiee, Akhavan-Safaei & Zayernouri Reference Samiee, Akhavan-Safaei and Zayernouri2019) proposes to model the SGS stress tensor using fractional derivatives motivated by considerations of non-Maxwellian (Levy-flight) equilibrium distributions of a Boltzmann equation.
Data-driven approaches have also been on the rise in many areas of science and in turbulence in particular (Duraisamy, Iaccarino & Xiao Reference Duraisamy, Iaccarino and Xiao2019). Analysing and predicting the performance of an SGS model a priori based on turbulence data requires careful consideration of statistical measures of interest. It is possible to establish several statistical necessary and sufficient conditions that a subfilter model for LES must satisfy (Meneveau Reference Meneveau1994). These conditions arise from analysing balance equations for various statistical properties of the flow and establishing how the subfilter stress tensor affects the statistical property of interest. It is generally accepted that a most important statistical feature of turbulent flow and LES is the mean kinetic energy in the resolved flow. Hence, a particularly important necessary condition for a subfilter model states that the rate at which a model extracts the kinetic energy from the large scales must be the same as the rate of energy that is transferred from the large to the small scales in the exact equations. Already Lilly (Reference Lilly1967) proposed an energy dissipation balance condition to relate the Smagorinsky coefficient to the Kolmogorov constant and, since then, satisfying the condition that a subgrid model dissipate resolved kinetic energy at the correct rate lies at the heart of most eddy-viscosity models. The rate of dissipation is a single-point statistical property.
In this work we focus on basic two-point statistical features of turbulence. Our aim is to study non-local properties in the physics of multiscale interactions in turbulence. G.K. Batchelor's influential treatise ‘The Theory of Homogeneous Turbulence’ (Batchelor Reference Batchelor1953) provides all the requisite conceptual background regarding the evolution of two-point statistics of velocity fluctuations in homogeneous turbulence and its various mathematical representations. Correctly capturing two-point correlations is of the utmost importance in turbulence modelling for LES, since these correlations and the concomitant energy spectral density describe the relative amplitudes of velocity fluctuations in the hierarchy of resolved structures in the flow simulated using LES. Motivated by the importance of two-point correlations, in § 2 we formulate statistical conditions that SGS models must satisfy regarding their two-point structure. In § 3, using direct numerical simulation (DNS) data from isotropic and channel flow turbulence, we examine such a two-point structure and compare it with results from a canonical eddy-viscosity closure. Then, inspired by two-point statistically necessary conditions, we propose to include non-local effects by relying on the compact expressivity of fractional derivative operators in the definition of the eddy-viscosity closures in § 4. Using again DNS data from isotropic and channel flow turbulence, we evaluate how well such non-local eddy-viscosity closures can satisfy the two-point correlation statistical conditions mentioned above, as compared to the classical local versions § 5. No a posteriori tests (i.e. implementation as SGS models in actual LES) are included since the closure operators proposed here are not yet sufficiently developed or efficient for numerical implementation in simulations. Conclusions are provided in § 6.
2. Two-point correlations of filtered-velocity fields
As summarized above, certain statistical conditions that an LES subfilter model must satisfy can be derived by analysing the evolution equations for the different order statistics of the fields, such as single-point moments, multi-point moments, and so on (Meneveau Reference Meneveau1994). We review conditions based on two-point statistics as developed by Meneveau (Reference Meneveau1994) and rephrase the results more conveniently in terms of the filtered strain-rate tensor as opposed to the filtered velocity, as was done in Meneveau (Reference Meneveau1994). We also generalize the prior derivations to the case of non-homogeneous flow. Here, we briefly summarize the derivation of the Karman–Howarth equations (the evolution equations for the two-point velocity correlations) for the case of filtered-velocity fields without assuming homogeneity or isotropy, using the two-point method proposed by Hill (Reference Hill2002).
Starting from the Navier–Stokes equations for a divergence-free velocity field  $\boldsymbol {u}$ with viscosity $\nu$, the LES equations for the filtered fields $\tilde {\boldsymbol {u}} = \mathcal {F}(\boldsymbol {u})$, where $\mathcal {F}$ is a spatial filtering operation, read as follows:
 \begin{equation} \frac{\partial \tilde{u}_i}{\partial t} + \tilde{u}_k \frac{\partial \tilde{u}_i}{\partial x_k} = - \frac{\partial \tilde{p}}{\partial x_i} + \nu \frac{\partial^2 \tilde{u}_i}{\partial x^2_k} - \frac{\partial \tau_{ki}}{\partial x_k}, \end{equation}
where
 \begin{gather} \tau_{ij} = \widetilde{u_i u_j} - \tilde{u}_i \tilde{u}_j - \tfrac13 \left( \widetilde{u_k u_k} - \tilde{u}_k^2 \right) \delta_{ij}, \end{gather}
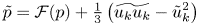 \begin{gather}\tilde{p}=\mathcal{F}(p) + \tfrac13 \left( \widetilde{u_k u_k} - \tilde{u}_k^2 \right) \end{gather}
are the deviatoric part of the SGS stresses and the modified pressure (where  $p$ is the fluid pressure divided by the density), respectively.
Defining velocities at two points,  $\tilde {u}^{(1)}_i = \tilde {u}_i(\boldsymbol {x}^{(1)})$, $\tilde {u}_i^{(2)} = \tilde {u}_.(\boldsymbol {x}^{(2)})$, and midpoint position (Hill Reference Hill2002) $\boldsymbol {x}^{(0)}=(\boldsymbol {x}^{(2)}+\boldsymbol {x}^{(1)})/2$, where $\boldsymbol {x}^{(2)}=\boldsymbol {x}^{(1)}+\boldsymbol {r}$ and $\boldsymbol {r}$ is the displacement vector between the two points, one can multiply their corresponding evolution equations by each other, sum them, rearrange and perform a statistical averaging operation (details are provided in the supplementary material). The result is the evolution equation for the velocity two-point correlation function $C_{uu}(\boldsymbol {r},\boldsymbol {x}^{(0)})= \left\langle {\tilde{u}_i^{(1)} \tilde{u}_i^{(2)} } \right\rangle$
 \begin{align} \frac{\partial C_{uu}}{\partial t} &= - T\left(\boldsymbol{r},\boldsymbol{x}^{(0)}\right) + P_0\left(\boldsymbol{r},\boldsymbol{x}^{(0)}\right)+V\left(\boldsymbol{r},\boldsymbol{x}^{(0)}\right) - \frac{\partial }{\partial x^{(0)}_k} \left\langle \tilde{u}^{(2)}_i \tau^{(1)}_{ki} +\tilde{u}^{(1)}_i \tau^{(2)}_{ki}\right\rangle\nonumber\\ &\quad- \left\langle \tau^{(1)}_{ki} \tilde{S}^{(2)}_{ki} + \tau^{(2)}_{ki}\tilde{S}^{(1)}_{ki} \right\rangle, \end{align}
where
 \begin{equation} \tilde{S}_{ik} = \frac{1}{2} \left( \frac{\partial \tilde{u}_i}{\partial x_k} + \frac{\partial \tilde{u}_k}{\partial x_i} \right) \end{equation}
is the filtered strain rate and
 \begin{gather} \hspace{-2.5pc}T(\boldsymbol{r},\boldsymbol{x}^{(0)}) = \frac{\partial }{\partial r_k} \left(\left\langle \tilde{u}^{(1)}_i \tilde{u}^{(2)}_i \tilde{u}^{(2)}_k\right\rangle - \left\langle\tilde{u}^{(1)}_i \tilde{u}^{(2)}_i \tilde{u}^{(1)}_k \right\rangle \right)\nonumber\\ \hspace{6pc}- \frac{1}{2} \frac{\partial }{\partial x^{(0)}_k} \left( \left\langle \tilde{u}^{(1)}_i \tilde{u}^{(2)}_i \tilde{u}^{(2)}_k\right\rangle + \left\langle \tilde{u}^{(1)}_i \tilde{u}^{(2)}_i \tilde{u}^{(1)}_k \right\rangle \right), \end{gather}
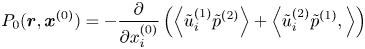 \begin{gather} P_0(\boldsymbol{r},\boldsymbol{x}^{(0)}) = - \frac{\partial }{\partial x^{(0)}_i} \left( \left\langle \tilde{u}^{(1)}_i \tilde{p}^{(2)} \right\rangle + \left\langle\tilde{u}^{(2)}_i \tilde{p}^{(1)}, \right\rangle\right) \end{gather}
and
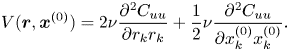 \begin{equation} V(\boldsymbol{r},\boldsymbol{x}^{(0)}) = 2 \nu \frac{\partial^2 C_{uu}}{\partial r_k r_k} + \frac{1}{2} \nu \frac{\partial^2 C_{uu}}{\partial x^{(0)}_k x^{(0)}_k}. \end{equation}
 This equation holds for velocity fields  $\tilde {u}_i$ obtained from first solving the Navier–Stokes equations and then filtering the results, and also for velocity fields $\tilde {u}^{LES}_i$ arising from solving LES equations in which the SGS stresses are replaced by a subgrid model, i.e. $\tau _{ij}^{LES}$. For LES and filtered Navier–Stokes to yield the same two-point statistical moment evolution of $\left\langle {\tilde{u}_i^{(1)} \tilde{u}_i^{(2)} } \right\rangle$ as well as the two-point third-order moments $\langle \tilde {u}^{(1)}_i \tilde {u}^{(2)}_i \tilde {u}^{(2)}_k\rangle$ requires as a statistically necessary condition (Meneveau Reference Meneveau1994) that
 \begin{equation} \left\langle \tau^{(1), LES}_{ki} \tilde{S}^{(2)}_{ki} \right\rangle + \left\langle \tau^{(2), LES}_{ki} \tilde{S}^{(1)}_{ki} \right\rangle = \left\langle \tau^{(1)}_{ki} \tilde{S}^{(2)}_{ki} \right\rangle + \left\langle \tau^{(2)}_{ki} \tilde{S}^{(1)}_{ki} \right\rangle, \end{equation}
and
 \begin{equation} \frac{\partial }{\partial x^{(0)}_k} \left(\left\langle \tilde{u}^{(2), LES}_i \tau^{(1), LES}_{ki} \right\rangle +\left\langle \tilde{u}^{(1), LES}_i \tau^{(2), LES}_{ki}\right\rangle \right) = \frac{\partial }{\partial x^{(0)}_k} \left(\left\langle \tilde{u}^{(2)}_i \tau^{(1)}_{ki} \right\rangle + \left\langle \tilde{u}^{(1)}_i \tau^{(1)}_{ki}\right\rangle \right). \end{equation}
 If the flow is spatially homogeneous and isotropic, all derivatives with respect to  $\boldsymbol {x}^{(0)}$ vanish and (2.10) is irrelevant while the last term in (2.9) simply becomes $2\langle \tau ^{(1)}_{ki} \tilde {S}^{(2)}_{ki}\rangle$. In addition, in isotropic flow, terms only depend on $|\boldsymbol {r}|$ (also, tensor contractions may be simplified in terms of single components, but these consequences will not be utilized explicitly here since data from DNS will be used for which all components are available). Equation (2.4) then becomes
 \begin{equation} \frac{1}{2} \frac{\partial C_{uu}(r)}{\partial t} = - \frac{\partial }{\partial r_k} \left\langle \tilde{u}^{(1)}_i \tilde{u}^{(2)}_i \tilde{u}^{(2)}_k\right\rangle + \nu \frac{\partial^2 C_{uu}(r)}{\partial r_k r_k} - \left\langle \tau_{ki}({\boldsymbol{x}}) \tilde{S}_{ki}({\boldsymbol{x}}+{\boldsymbol{r}}) \right\rangle, \end{equation}
so that a necessary condition for LES to correctly predict two-point moments of the resolved field reduces to
 \begin{equation} \left\langle \tau^{LES}_{ki}({\boldsymbol{x}}) \tilde{S}^{LES}_{ki}({\boldsymbol{x}}+{\boldsymbol{r}}) \right\rangle = \left\langle \tau_{ki}({\boldsymbol{x}}) \tilde{S}_{ki}({\boldsymbol{x}}+{\boldsymbol{r}}) \right\rangle. \end{equation}
For the case of kinetic energy, i.e. for the single-point case  ${r} = 0$, the familiar condition is recovered where LES should correctly predict the SGS rate of dissipation, i.e. $\langle \tau _{ki}^{LES} \tilde {S}^{LES}_{ki} \rangle = \langle \tau _{ki} \tilde {S}_{ki} \rangle$. The Fourier transformed version of this expression (involving $\langle \hat {\tau }_{ki}(\boldsymbol {k}) \hat {\tilde {S}}^*_{ki}(\boldsymbol {k})\rangle$, where a hat denotes three-dimensional (3-D) Fourier transform and $\boldsymbol {k}$ is the wavenumber vector) was used by Cerutti, Meneveau & Knio (Reference Cerutti, Meneveau and Knio2000) to measure spectral eddy-viscosity distributions. In the present work we focus attention on physical space descriptions to highlight the strength of spatial correlation at various distances.
The case of channel flow is statistically homogeneous in the two wall-parallel directions but inhomogeneous in the wall-normal direction. And the presence of walls and a mean pressure gradient breaks isotropy. Due to the special importance of mean shear to this flow, it is convenient to separate the resolved flow also into its statistical mean and fluctuating variables according to  $\tilde {u}_i = \langle \tilde {u}_i \rangle + \tilde {u}_i'$. In channel flow, taking the $x_1$ direction to be streamwise and $x_2$ to be wall normal, the averaged flow variables do not depend on $x_1$, $x_3$, and $\langle \tilde {u}_2 \rangle = \langle \tilde {u}_3 \rangle = 0$. Taking these facts into consideration and restricting the displacement between the two points in the correlations to be in the horizontal direction (i.e. ${r} = (r_1,0,r_3)$), (2.4) becomes
 \begin{align} \frac{\partial \left\langle \tilde{u}'^{(1)}_i \tilde{u}'^{(2)}_i \right\rangle}{\partial t} &= - T'\left(\boldsymbol{r},\boldsymbol{x}^{(0)}\right) + P_0'\left(\boldsymbol{r},\boldsymbol{x}^{(0)}\right) + V'\left(\boldsymbol{r},\boldsymbol{x}^{(0)}\right) + \mathcal{P}\left(\boldsymbol{r},\boldsymbol{x}^{(0)}\right)\nonumber\\ &\quad - \frac{\partial }{\partial x^{(0)}_2} \left\langle \tilde{u}'^{(2)}_i \tau'^{(1)}_{2i} + \tilde{u}'^{(1)}_i \tau'^{(2)}_{2i}\right\rangle - \left\langle \tau'^{(1)}_{ki} \tilde{S}'^{(2)}_{ki} + \tau'^{(2)}_{ki} \tilde{S}'^{(1)}_{ki} \right\rangle, \end{align}
where
 \begin{equation} \mathcal{P}\left(\boldsymbol{r},\boldsymbol{x}^{(0)}\right) = \langle{\tilde{u}'^{(2)}_1 \tilde{u}'^{(1)}_2}\rangle \frac{\partial \langle {\tilde{u}'_1}}{\partial x^{(0)}_2} \rangle \end{equation}
and the primed terms  $T'$,
$T'$,  $P_0'$ and $V'$ correspond to the previously defined $T$,
$T$,  $P_0$ and $V$ but for the primed fields, respectively. We note that the last two terms in (2.13) may also be combined and re-expressed in terms of the total variables (without decomposing into fluctuating and mean quantities) if the displacement is taken in the horizontal plane, since then $\langle \tilde {S}_{ki} \rangle$ and $\langle \tau _{ki} \rangle$ are the same at locations 1 and 2. Therefore, again we can state that a necessary condition for LES to generate each of the terms involving filtered velocities and mean velocities in the above equation accurately requires that the equality in (2.12) must hold.
3. Stress–strain-rate correlations in isotropic and channel flow data
Having established the relevance of the stress–strain-rate correlation function for understanding interactions between scales in turbulence, we examine such correlations in two canonical datasets and compare the results to the correlations arising from classic local eddy-viscosity models. We first start by describing the datasets, then the way in which we process the data and finally measure and report the aforementioned correlation functions.
The homogeneous and isotropic turbulence data come from a simulation of the Navier–Stokes equations including a forcing term performed on a periodic grid of  $1024^3$ grid points using a pseudo-spectral parallel code (Li et al. Reference Li, Perlman, Wan, Yang, Meneveau, Burns, Chen, Szalay and Eyink2008). The viscous term was integrated analytically using an integrating factor, while all other terms were integrated using a second-order Adams–Bashforth scheme. A combination of phase shift and $2\sqrt {2}/3$ truncation was used to de-alias the simulation. The forcing term is such that kinetic energy in modes with wavenumber less than or equal to 2 was kept constant. The Kolmogorov length $\eta \sim (\epsilon ^3/\nu )^{1/4}$, where $\epsilon$ is the mean energy transfer rate and $\nu$ the molecular kinematic viscosity, was approximately half of the grid spacing. The averaged Taylor-scale Reynolds number of the simulation is ${Re}_{\lambda } \sim 433$. The data are available on the public Johns Hopkins Turbulence Database (JHTDB) server (for more information, see Li et al. (Reference Li, Perlman, Wan, Yang, Meneveau, Burns, Chen, Szalay and Eyink2008)). For our analysis, we use data from eleven independent snapshots distributed over approximately five large-eddy turnover times. All two-point correlations were performed along a given Cartesian direction and correlation functions were then averaged over the three Cartesian directions and over the 11 snapshots in time.
The channel flow data come from two different friction Reynolds numbers,  ${Re}_{\tau } \sim 1000$ and ${Re}_{\tau } \sim 5200$. Both simulations solve the Navier–Stokes equations in a domain with periodic boundary conditions in two directions (the horizontal directions parallel to the walls) and no-slip boundary conditions in the other direction (the vertical direction). The data are also available at JHTDB. For more detailed information regarding both channel flow datasets, see Graham et al. (Reference Graham2016) and Lee & Moser (Reference Lee and Moser2015), respectively.
We filter the velocity using a top-hat box filter with different filter lengths. Results using different types of filters (Gaussian and spectral) are also presented although the focus will be on results from the most spatially local filter (box filter). For the case of the channel flows, the filtering is performed only in the horizontal directions. The true SGS stresses (their deviatoric part) are calculated using their usual definition
 \begin{equation} \tau_{ij} = \widetilde{u_i u_j} - \tilde{u}_i \tilde{u}_j - \tfrac{1}{3}( \widetilde{u_k u_k} - \tilde{u}_k \tilde{u}_k) \delta_{ij}, \end{equation}
while the filtered strain rates are calculated using (2.5) and where the derivatives are calculated using a second-order centred finite difference scheme.
When considering predictions from eddy-viscosity models, in order to avoid introducing model-dependent effects from various possible choices of eddy viscosity (e.g. Smagorinsky (Smagorinsky Reference Smagorinsky1963), dynamic Smagorinsky, (Germano et al. Reference Germano, Piomelli, Moin and Cabot1991), Vreman (Vreman et al. Reference Vreman, Geurts and Kuerten1996), WALE (Nicoud & Ducros Reference Nicoud and Ducros1999)), we focus on the simplest version, namely a ‘constant eddy-viscosity’ model. Specifically,
 \begin{equation} \tau^{LES}_{ij} = -2 \nu_{LES} \, \tilde{S}_{ij}, \end{equation}
with  $\nu _{LES}$ a constant. Since all the two-point correlation functions to be shown below are normalized by their value at zero displacement, the value of $\nu _{LES}$ does not affect the results. We recall that models of the eddy viscosity are typically formulated to properly reproduce the dissipation rate (i.e. the one-point correlations between the strain rate and the stresses), while here we are focused on the non-local properties of the filtered strain rate. The comparisons to be presented were also repeated for the traditional Smagorinsky model (i.e. when $\nu _{LES}$ has spatial fluctuations given by $|\tilde {\boldsymbol {S}}|$) but have led to essentially the same results as when using a spatially constant $\nu _{LES}$, and are thus not shown.
In order to evaluate two-point correlation functions from the data, the averaging operation is performed in the three Cartesian spatial directions and over time snapshots when analysing isotropic turbulence data, while for the case of channel flow no averaging is performed in the vertical direction. Then, the two-point correlations between either the true SGS stresses and the filtered strain rates, and the modelled subgrid stress and the strain rates are obtained by averaging the product of the displaced fields and normalizing to unity at  $r=0$. In other words, we normalize each correlation function by its own rate of SGS dissipation rate so as to focus on the spatial correlation structure independent of the mean dissipation rate (hence rendering the value of $\nu _{LES}$ irrelevant for our analysis).
In figure 1(a) we show the two-point correlations using both the true SGS stress tensor and the modelled one extracted from the homogeneous isotropic turbulence data using two different filter sizes  $\varDelta =31\eta$ and $\varDelta =53\eta$ (the insets show the same plots but in semi-log scale to better visualize the long-distance tails). While close to the origin both the real and the local eddy-viscosity cases behave similarly, the correlation function for the real subfilter stress sustains correlations with the strain rate for longer distances than the case of the local eddy viscosity. A similar result is seen in figure 1(b) where such correlation functions are shown for the $Re_{\tau }=1000$ channel flow at some height in the logarithmic region $y^+ = 1000$, for two points separated along the streamwise direction.
Two-point correlations between different subgrid stresses and the filtered strain rates in (a) homogeneous isotropic turbulence and (b) channel flow at  $Re_{\tau } = 1000$ at $y^+ = 90$. Data are filtered using a top-hat filter at two different filter sizes and in all three directions for the homogeneous isotropic case (a), while only one filter size and horizontal filtering was used for the channel flow case (b), at $\varDelta ^+=49$ (or $\varDelta /h=0.049$).
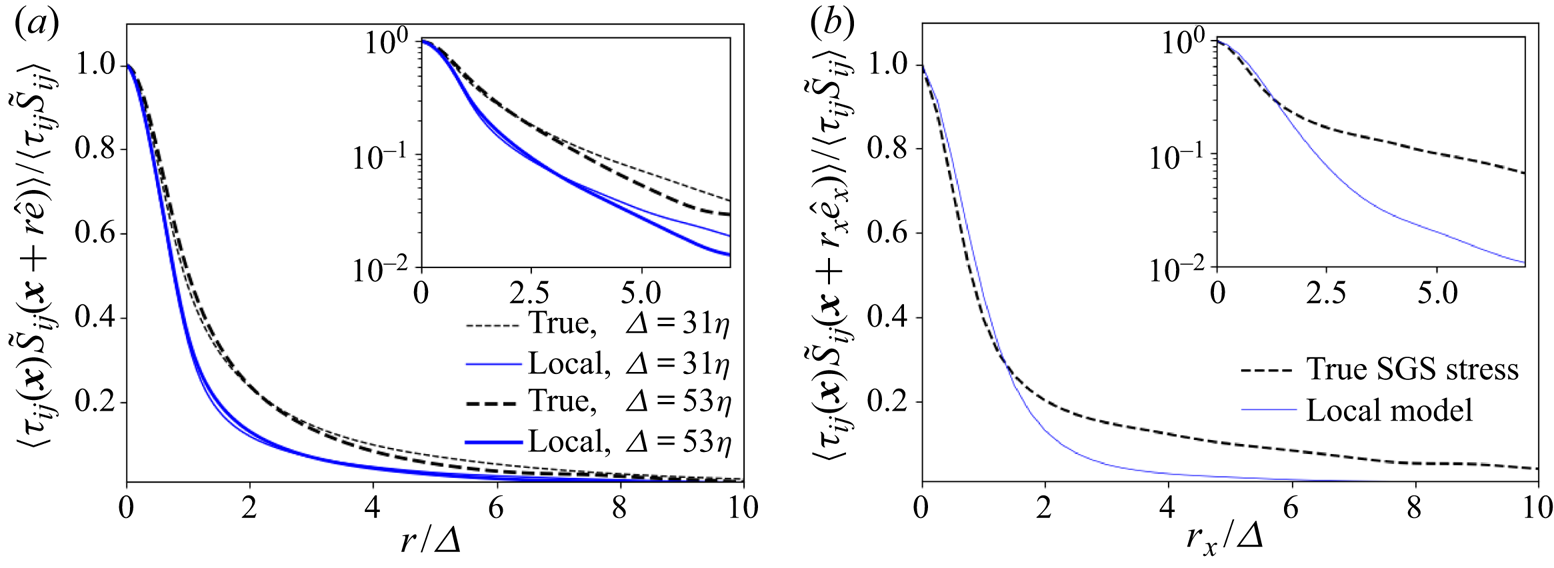
As we have seen before, if one wishes an LES to provide realistic predictions of filtered-velocity correlation functions (or spectra) down to distances as close as possible to the filtering scale  $\varDelta$, a model should be such that the two-point correlation between subfilter stress and strain rate are correctly reproduced during a priori data analysis. Present results demonstrate that local models cannot correctly capture the relatively long tails in these two-point correlations. Correlations between distances $r=\varDelta$ to approximately $5\varDelta$ are underestimated by local models, yielding only approximately 50 % of the real correlation. Interestingly, we recall that it was already observed that the correlations between subgrid stresses and velocity increments also decay faster in LES than in the true cases (Linkmann, Buzzicotti & Biferale Reference Linkmann, Buzzicotti and Biferale2018). It is important to emphasize that, since we are normalizing the correlations by their value at the origin, the dependence on any constant scalar prefactor is eliminated. We have tested that even if the scalar prefactor is position dependent, as it is with various variants of the eddy-viscosity model (e.g. classical Smagorinsky model), the normalized correlations remain very similar to our present results and thus are not presented here.
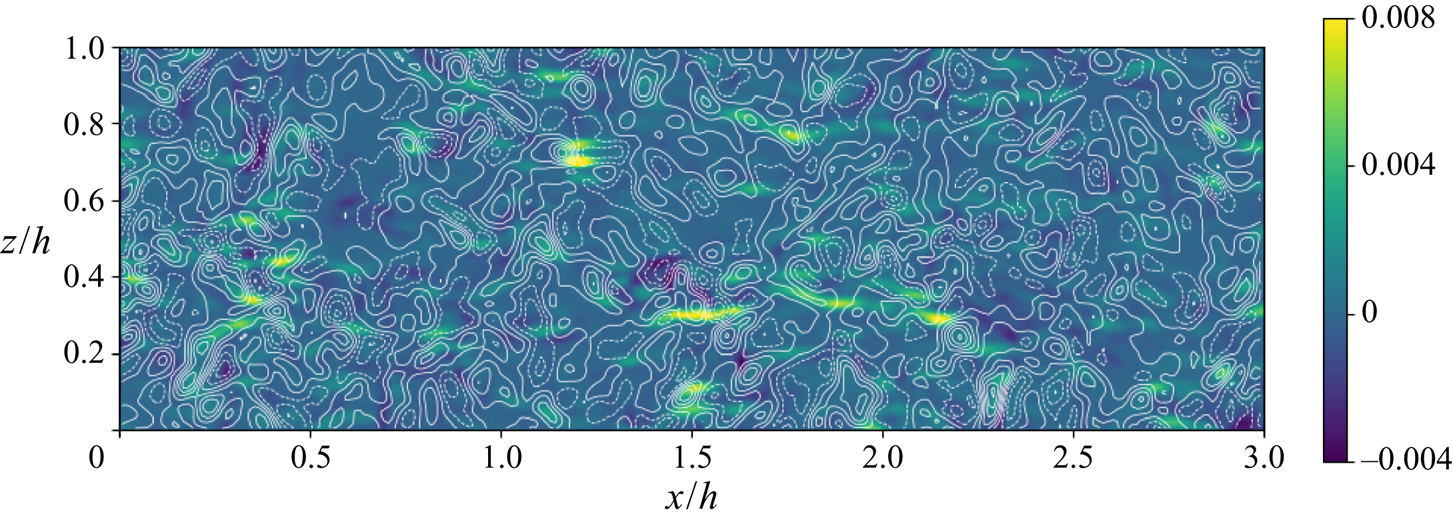
Figure 2 shows a sample contour plot of  $\tau _{11}$ (filled colours) superimposed with a contour plot (lines) of $-\tilde {S}_{11}$ on a horizontal plane at $y^+=90$ of the channel flow data at $Re_{\tau }=1000$. The elongated features of the real stress are apparent, extending over distances far exceeding the filter scale ( $\varDelta /h \sim 0.05$). The features of $-\tilde {S}_{11}$ appear more isotropic with less ‘non-locality’ in the $x$-direction compared to
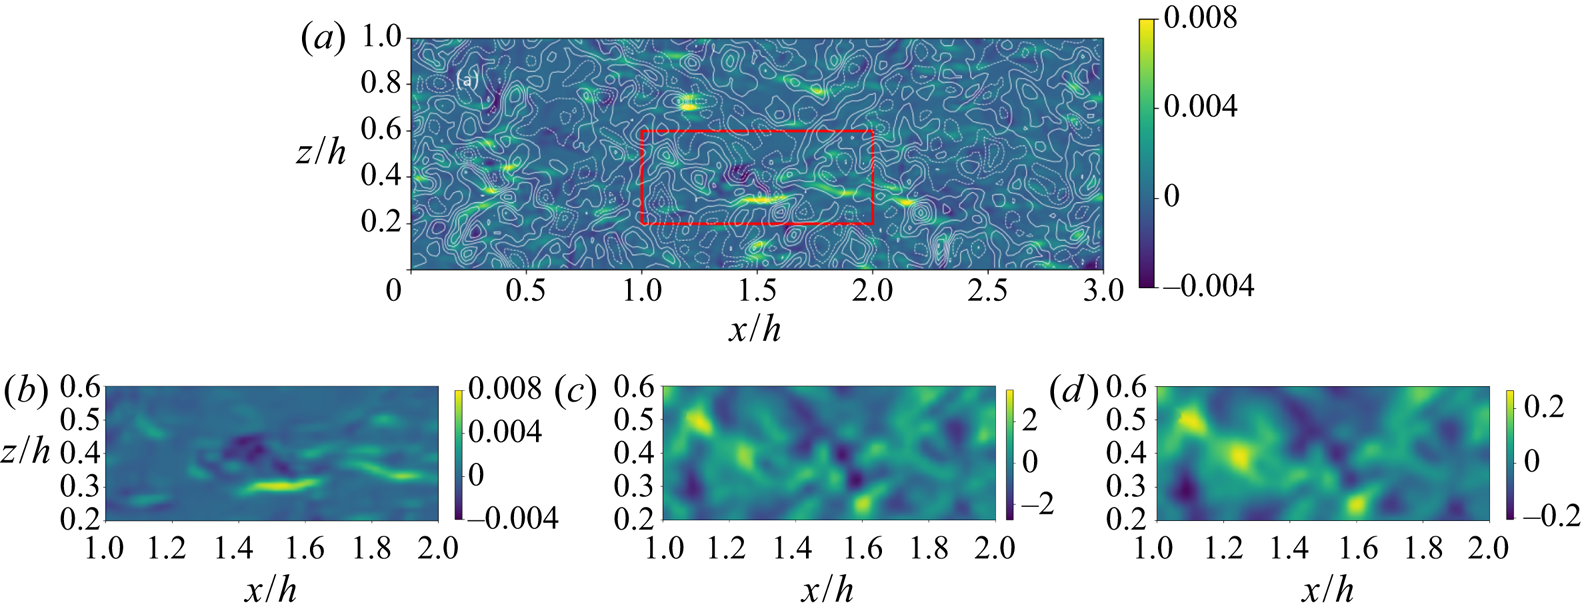
  $\tau _{11}$. As is well known, pointwise comparisons between instantaneous distributions of real and modelled SGS stresses using variants of eddy-viscosity models typically lead to very low correlation coefficients (typically less than 20 %). But such instantaneous a priori tests have little prognostic power regarding the statistics resulting from LES. Hence, the main focus of this work is on the two-point correlations (statistical a priori tests for which the interpretation is clear, following the discussion in § 2). For the sake of completeness, we also perform pointwise comparisons below, while recalling the known limitations of interpreting such pointwise comparisons.
Contour plot of streamwise normal deviatoric SGS stress  $\tau _{11}$ (filled colours, in simulation units) superimposed with contour lines of $-\tilde {S}_{11}$ on a horizontal plane of the channel flow at $y^+=90$. The filtering scale is $\varDelta ^+=49$ ( $\varDelta /h = 0.049$). The maximum contour line of $-\tilde {S}_{11}$ shown is at $4.8$ (in simulation units), all other have an equal spacing of $0.8$, dashed lines indicate negative values.
4. Non-local eddy-viscosity modelling
4.1. Motivation for non-local eddy-viscosity modelling
It is instructive to begin by discussing kinetic energy dissipation. One possible motivation for the classic local eddy-viscosity modelling in LES is provided directly by the condition of matching SGS energy dissipation rates. Specifically, suppose we wish to ensure that energy will be dissipated at some ‘true’ rate  $-\langle \tau _{ki} \tilde {S}_{ki} \rangle$. The LES will generate fluctuations including fluctuating filtered strain rates. Thus, one can be sure that its variance, i.e. the quantity $\langle \tilde {S}^{LES}_{ki} \tilde {S}^{LES}_{ki} \rangle$, will be positive. Its magnitude will depend on the fluctuation amplitudes of $\tilde {S}^{LES}_{ki}$ but will not involve any subtle cancellations of oppositely signed values. Hence, if one sets the SGS stresses $\tau _{ki}^{LES}$ (where we are always working with the traceless tensor) proportional to $-\tilde {S}^{LES}_{ki}$, i.e. $\tau _{ki}^{LES} \sim - \tilde {S}^{LES}_{ki}$, one will be guaranteed a mean dissipation rate that will be proportional to the non-zero $\langle \tilde {S}^{LES}_{ki} \tilde {S}^{LES}_{ki} \rangle$ value resulting in LES. The actual value can be controlled by choices of SGS eddy viscosity, as in the standard model $\tau _{ki}^{LES}=-2 \nu _{LES} \tilde {S}^{LES}_{ki}$.
Now, we wish to generalize this statement to the case of ensuring that two-point moment between the subfilter stress and the filtered strain-rate tensor at some particular displaced position  $\boldsymbol {r}^{\prime }$ is predicted correctly. A possible way to guarantee that the two-point correlation $\langle \tau ^{LES}_{ki}(\boldsymbol {x}) \tilde {S}^{LES}_{ki}(\boldsymbol {x}+\boldsymbol {r}^{\prime }) \rangle$ is non-zero with its magnitude set by some prefactor, is to select $\tau ^{LES}_{ki}(\boldsymbol {x})$ to be proportional not to the local value of the filtered strain rate, but to $\tilde {S}^{LES}_{ki}(\boldsymbol {x}+\boldsymbol {r}^{\prime })$ at the desired point, i.e. $\tau ^{LES}_{ki}(\boldsymbol {x}) \sim - \tilde {S}^{LES}_{ki}(\boldsymbol {x}+\boldsymbol {r}^{\prime })$. In general we will want to enforce such a condition for all possible $\boldsymbol {r}^{\prime }$, and so a weighted superposition of strain rates at different locations can be envisioned
 \begin{equation} \tau^{LES}_{ki}(\boldsymbol{x}) = - \int K(\boldsymbol{r}^{\prime}) \, \tilde{S}^{LES}_{ki}(\boldsymbol{x}+\boldsymbol{r}^{\prime}) \,\,d^3 \boldsymbol{r}^{\prime}, \end{equation}
where  $K(\boldsymbol {r}^{\prime })$ represents an eddy viscosity appropriate for displacement $\boldsymbol {r}^{\prime }$.
Multiplying (4.1) by  $\tilde {S}^{LES}_{ki}(\boldsymbol {x}+\boldsymbol {r})$ and ensemble averaging yields the two-point correlation relevant to correctly predicting two-point velocity correlations. The result, for homogeneous turbulence, can be written as
 \begin{equation} -\left\langle \tau^{LES}_{ki}(\boldsymbol{x}) \tilde{S}^{LES}_{ki}(\boldsymbol{x}+\boldsymbol{r}) \right\rangle = \int K(\boldsymbol{r}^{\prime}) \, \left\langle \tilde{S}^{LES}_{ki}(\boldsymbol{x}+\boldsymbol{r}) \tilde{S}^{LES}_{ki}(\boldsymbol{x}+\boldsymbol{r}-\boldsymbol{r}^{\prime}) \right\rangle \, d^3 \boldsymbol{r}^{\prime}, \end{equation}
i.e. a convolution between a kernel and the strain-rate two-point correlation function. Assuming that the latter decays as function of displacement differently than the true correlation  $\langle \tau ^{d}_{ki}(\boldsymbol {x}) \tilde {S}_{ki}(\boldsymbol {x}+\boldsymbol {r}) \rangle$ (as figure 1 shows occurs in turbulence), then the convolution with a kernel $K(\boldsymbol {r}^{\prime })$ enables one to generate a SGS model that may display improved two-point correlations between stress and strain rate.
Many options for the kernel  $K(\boldsymbol {r}^{\prime })$ could be envisioned, and many ways to optimally find it from data can be developed. Here, we propose to explore the applications of fractional calculus since such operators enable compact representations and we may express the model without introducing length scales a priori into the problem (as we shall see later on, effectively we will be introducing modelling length scales anyhow, but at a later stage). In the next section, we set the stage for definitions of fractional gradients that can be applied in three dimensions to gradient vector fields.
4.2. Fractional-gradient-based non-local eddy viscosity
Most applications of fractional derivatives are essentially one-dimensional, e.g. in time to represent memory effects, for spatially one-dimensional problems, or using fractional Laplacians that do not discriminate between different directions. Recent efforts to develop fractional vector calculus and directionally dependent gradient operators include Meerschaert, Mortensen & Wheatcraft (Reference Meerschaert, Mortensen and Wheatcraft2006) and Tarasov (Reference Tarasov2008). Here, we use a multidimensional generalization of the Caputo fractional derivative (Caputo Reference Caputo1967; Samko Reference Samko1993). In one dimension, the Caputo fractional derivative usually takes the form
 \begin{equation} {}_C D^{\alpha}_{0,x}\, f(x) = \frac{1}{\varGamma(1-\alpha)} \int^x_0 \frac{\dfrac{\textrm{d}f}{\textrm{d}\kern0.7pt x} (x')}{(x-x')^{\alpha}}\,{\textrm{d}\kern0.7pt x}'. \end{equation}
While this non-symmetric definition, where the limits of integration go from 0 (or some other finite limit) to the point of evaluation, is useful for many problems, and has been used in non-local closures of channel flow RANS (Song & Karniadakis Reference Song and Karniadakis2018), it is not applicable to flows in three dimensions, where there may be various important directions. The need to constrain the domain of integration also arises, as in practice integrating over the whole physical domain would be prohibitively expensive. A symmetrized and truncated version of the Caputo derivative may be written as
 \begin{equation} {}_{symC} D^{\alpha}_{R}\, f(x) = \frac{1}{2\varGamma(1-\alpha)} \int^{x+R}_{x-R} \frac{\dfrac{\textrm{d}f}{\textrm{d}\kern0.7pt x} (x')}{|x-x'|^{\alpha}}\,{\textrm{d}\kern0.7pt x}'. \end{equation}
 Next, a definition of a vector gradient is required. Some definitions of fractional gradients resort to just taking a one-dimensional fractional derivative along each dimension (Meerschaert et al. Reference Meerschaert, Mortensen and Wheatcraft2006; Tarasov Reference Tarasov2008). Such a definition would, however, not be useful in general, as the gradient operation would not be invariant under arbitrary rotations of the coordinate system. Instead, we keep the directionally sensitive derivative inside the integral in one direction (as in the Caputo derivative), but integrate in all directions over a ball of radius  $R$ Caputo & Fabrizio (Reference Caputo and Fabrizio2015), according to
 \begin{equation} D^{\alpha}_i u_j (\boldsymbol{r}) = \frac{1}{\varOmega_d \varGamma(1-\alpha)} \int_{|\boldsymbol{r}-\boldsymbol{r}'|\leq R} \frac{\dfrac{\partial u_j}{\partial x_i} (\boldsymbol{r}')}{ |\boldsymbol{r} - \boldsymbol{r}'|^{\alpha+d-1}} d^d \boldsymbol{r}', \end{equation}
where  $\varOmega _d$ is the $d$-D solid angle. In three dimensions, this definition becomes
 \begin{equation} D^{\alpha}_i u_j (\boldsymbol{r}) = \frac{1}{4 {\rm \pi}\varGamma(1-\alpha)} \int_{|\boldsymbol{r}-\boldsymbol{r}'|\leq R} \frac{\dfrac{\partial u_j}{\partial x_i} (\boldsymbol{r}')}{ |\boldsymbol{r} - \boldsymbol{r}'|^{\alpha+2}} d^3 \boldsymbol{r}'. \end{equation}
The result depends also on the radius  $R$, which in practice will be chosen ‘large enough’ to capture non-locality and generate results that do not depend strongly on $R$.
$R$.
It is possible to show by performing integration by parts (following Li & Deng Reference Li and Deng2007) that, as long as the field  $u$ has a well-defined second derivative, this definition complies with the following limiting behaviour at $\alpha$ approaching unity from below:
 \begin{equation} D^{\alpha}_i u_j (\boldsymbol{r}) \xrightarrow[\alpha \to 1^-]{} \frac{\partial u_j}{\partial r_i} (\boldsymbol{r}). \end{equation}
That is to say, traditional gradient operation corresponds to  $\alpha = 1$.
In the limit of  $\alpha \to 0^+$, we obtain
 \begin{equation} D^{\alpha}_i u_j (\boldsymbol{r}) \xrightarrow[\alpha \to 0^+]{} \frac{1}{4{\rm \pi}} \int^{\rm \pi}_0 \int^{2{\rm \pi}}_0 \int^R_0 \frac{\partial u_j}{\partial r_i}(\boldsymbol{r} - \tilde{\boldsymbol{r}})\,\textrm{d}\tilde{r} \sin \theta\,\textrm{d}\theta\,\textrm{d}\phi \end{equation}
(when expressed in spherical coordinate system). For example, for a spatially constant velocity gradient within the sphere of radius  $R$, the gradient in the limit $\alpha \to 0^+$ becomes
 \begin{equation} D^{\alpha}_i u_j (\boldsymbol{r}) \xrightarrow[\alpha \to 0^+]{} R \, \frac{\partial u_j}{\partial r_i}, \end{equation}
similar to a velocity increment (structure function) over a distance  $R$.
$R$.
The units of the fractional gradient are velocity divided by (length) $^{\alpha }$. In a turbulent flow with weak mean gradients, and as long as $\alpha > 0$, the definition of the derivative is expected to converge for sufficiently large $R$, as contributions from different directions will mostly cancel. But possible dependencies on $R$ will be examined quantitatively during the analysis since a priori some dependence on $R$ cannot be excluded.
Now that we have defined a fractional-gradient operator, we can also define the symmetric part, i.e. the fractional strain-rate tensor, according to
 \begin{equation} \tilde{S}^{\alpha}_{ij} = \tfrac{1}{2} \left(D^{\alpha}_i \tilde{u}_j+D^{\alpha}_j \tilde{u}_i \right). \end{equation}
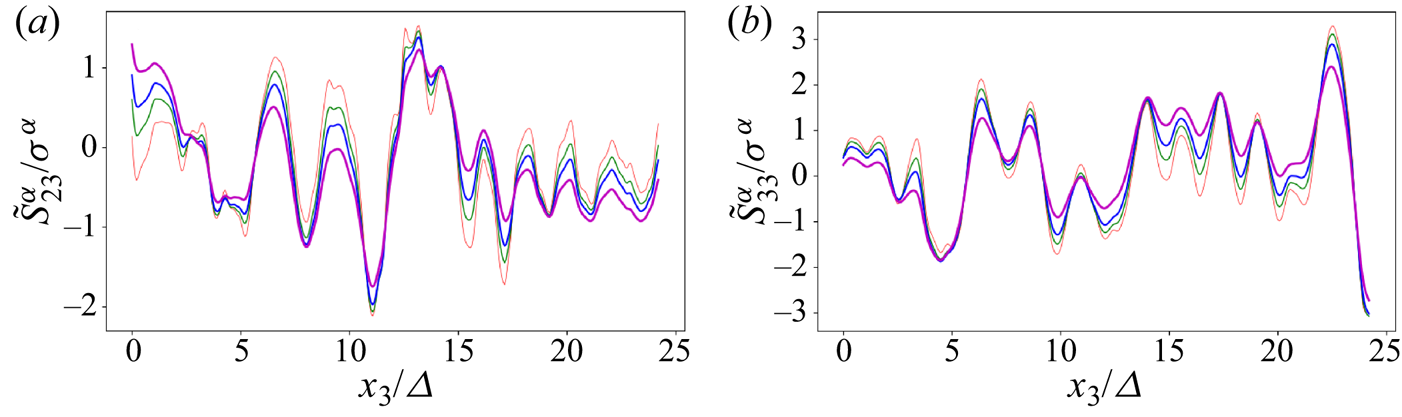
 In order to provide qualitative insights regarding the fractional gradient, we apply the gradient operator to filtered-velocity fields from the isotropic turbulence data from DNS described before (at  $\varDelta = 31 \eta$). Details on the numerical calculation of the fractional strain rate are presented in appendix A. Sample signals of transverse $\tilde {S}^{\alpha }_{23}$ and normal $\tilde {S}^{\alpha }_{33}$ velocity gradient tensor elements across parts of the computational domain are shown in figure 3. Each of the curves are normalized by their respective standard deviations $\sigma _{\alpha }$. The standard gradient tensor signals ( $\alpha = 1$) are shown as the light curve. The signals corresponding to lower values of $\alpha$ display smaller excursions in general, consistent with the idea that they are more non-local. It is interesting to note that even if subtle, the most non-local case ( $\alpha =0.2$) still retains significant small-scale structure in the signal (at the filter scale $\varDelta$) even though it is the most non-local case considered.
Effects of  $\alpha$. Representative signal of two components of the fractional strain rate tensor $\tilde {S}_{ij}^{\alpha } = (D^{\alpha }_i \tilde {u}_j+D^{\alpha }_j \tilde {u}_i)/2$ normalized by its respective standard deviation for different fractional orders. Data are from DNS of isotropic turbulence at $Re_{\lambda } \sim 433$; (a) is for $ij=23$ while (b) is for $ij=33$. The curves correspond to $\alpha = 1, 0.7, 0.5$ and 0.2, from light to dark colour, respectively.
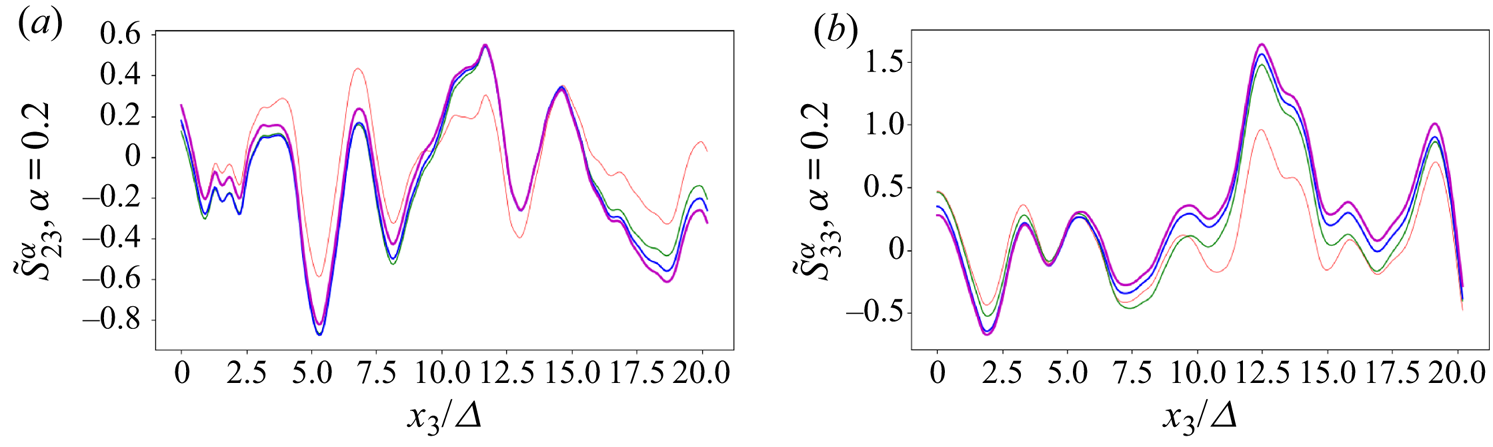
In figure 4 we present plots of the same two components of  $\tilde {S}^{\alpha }_{ij}$ for a fixed value of $\alpha =0.2$ but calculated using different cutoff radius $R$. As mentioned earlier, the fractional derivative (4.6) is not independent of $R$, but we can expect results from turbulent flow with weak mean gradients to vary less and less as $R$ increases. The strain-rate signals shown in figure 4 are consistent with such behaviour, with relatively small sensitivity to $R$ for $R\geq 5\varDelta$ in these examples. Note that these results are for a small value of $\alpha$ (0.2). For larger values of $\alpha$ the sensitivity to $R$ is less marked.
Effects of  $R$. Two components of the fractional strain-rate tensor $\tilde {S}_{ij}^{\alpha } = (D^{\alpha }_i \tilde {u}_j+D^{\alpha }_j \tilde {u}_i)/2$ for the same fractional order $\alpha =0.2$, but different cutoff radius $R$; (a) is for $ij=23$ while (b) is for $ij=33$. The different curves correspond to $R = 1\varDelta , 3\varDelta , 5\varDelta$ and $7\varDelta$, from light to dark colour, respectively.
For completeness, we also provide a pointwise qualitative comparison in figure 5 showing a sample contour plot of  $\tau _{11}$ (filled colours) superimposed with a contour plot (lines) of $-\tilde {S}^{\alpha }_{11}$ on a horizontal plane at $y^+=90$ of the channel flow data at $Re_{\tau }=1000$ for $\alpha =0.2$. Similar to the local case shown in figure 2, the non-local filtered strain rate does not match the true subgrid stresses. In quantitative terms, the one-point correlations for both cases are approximately $12\,\%$.
(a) Contour plot of streamwise normal deviatoric SGS stress  $\tau _{11}$ (filled colours, in simulation units) superimposed with contour lines of $-\tilde {S}^{\alpha }_{11}$ on a horizontal plane of the channel flow at $y^+=90$ for $\alpha =0.2$. The filtering scale is $\varDelta ^+=49$ ( $\varDelta /h = 0.049$). The maximum contour line of $-\tilde {S}^{\alpha }_{11}$ shown is at $0.36$ (in simulation units), all other have an equal spacing of $0.06$, dashed lines indicate negative values. Zoomed in views of the region marked with the red square are shown in panels (b,c,d). (b) Zoomed in view of $\tau _{11}$. (c) Zoomed in view of $-\tilde {S}_{11}$. (d) Zoomed in view of $-\tilde {S}^{\alpha }_{11}$.
Based on the fractional strain-rate tensor, we may now define a fractional eddy-viscosity closure for the deviatoric part of the SGS stress, according to
 \begin{equation} \tau^{\alpha}_{ij} = -2 \nu_{\alpha} \tilde{S}^{\alpha}_{ij}, \end{equation}
where  $\nu _{\alpha }$ is the $\alpha$-dependent SGS eddy viscosity, having units of velocity times (length) $^{\alpha }$. The form based on the fractional gradient defined as in (4.6) has the following desirable properties: it is Galilean invariant, it is rotationally invariant and the stress enters as a divergence in the momentum equation so that it obeys a traditional Gauss theorem (i.e. its volume integral only leaves surface fluxes).
For the purposes of data analysis in this paper, similarly to what we showed in the previous section for local models, we will take  $\nu _{\alpha }$ to be constant. Practical applications of such models will of course require specification of $\nu _{\alpha }$, which would indirectly involve specification of a length scale (e.g. setting $\nu _{\alpha } \sim \varDelta ^{2\alpha } |\tilde {S}^{\alpha }|$). Notice that non-local models allow for backwards energy transfer even if $\nu _{\alpha }$ is always positive, since $\tilde {S}^{\alpha }_{ij} \tilde {S}_{ij}$ is not strictly positive. Backwards energy transfer should not be expected if $\alpha$ is close to unity since the non-local strain rate will be very similar to the local one. However, some negative energy transfer (backscatter) could occur for lower values of $\alpha$. Therefore, we also perform an analysis of the energy transfer rate in the section below.
5. Results
In this section, we test the effectiveness of fractional-gradient-based eddy-viscosity modelling to reproduce the desired two-point correlation structure of subgrid stresses and filtered strain-rate tensors in isotropic and channel flow turbulence.
5.1. Homogeneous and isotropic turbulence
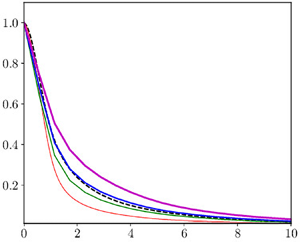
Figure 6 shows the two-point correlation between the filtered strain rates and the different SGS stresses: the true one coming from the DNS (dashed line), the one modelled by the traditional local eddy-viscosity model ( $\alpha =1$) and three cases using the fractional-gradient-based model at different fractional orders (but same cutoff radius $R=5\varDelta$) for two different filter sizes in the inertial range of turbulence. As can be seen, the fractional models generate longer correlations than the local model. The fractional order of $\alpha = 0.5$ reproduces the degree of non-locality found in the DNS case well, for both filter scales analysed. As was observed in figure 1, the decay of correlations seems to scale with $r/\varDelta$ also for the fractional models.
Two-point correlations between different subgrid stresses and the fractional filtered strain rates of different orders in homogeneous isotropic turbulence. Results are for a top-hat filter at  $\varDelta = 31\eta$ (a), and $\varDelta = 53\eta$ (b). In both we use $R=5\varDelta$.
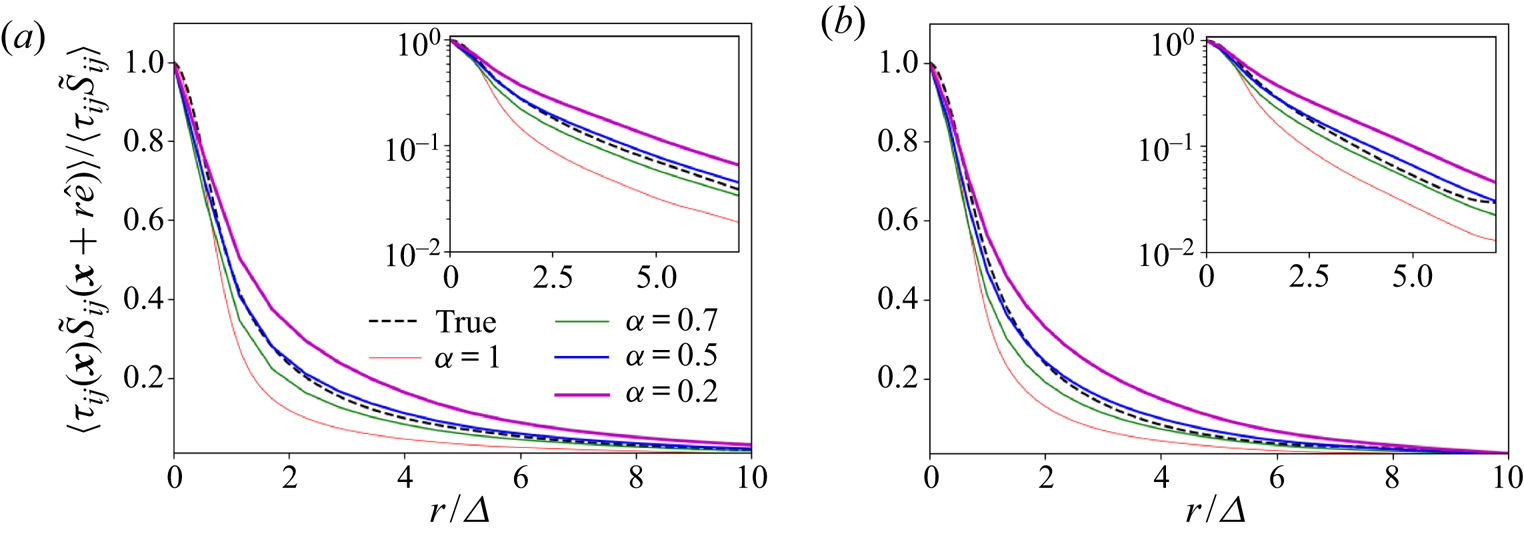
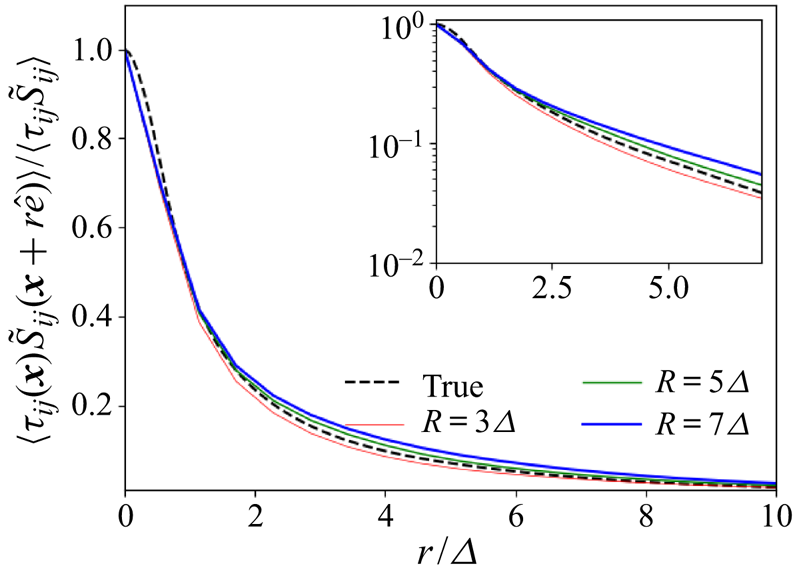
Figure 7 presents the two-point correlations functions for the true case and for the fractional case using the fractional order  $\alpha =0.5$ and same filter size and type, but using different cutoff radii $R$. As expected from the results shown in figure 4, the behaviour of the fractional models does depend slightly on $R$. When using a smaller cutoff radius, the models behave moderately more ‘locally’ for the same fractional order, as less non-local information is used. This indicates that when fine-tuning practical applications of fractional models, both the order and the domain of integration will have to be considered. Differences in the correlations produced by the different parameters do appear to get smaller the larger the cutoff radius, again suggesting that although the fractional derivatives do not formally converge for any arbitrary field, they might do so in a turbulent flow.
Two-point correlations between different subgrid stresses and the filtered strain rates in homogeneous isotropic turbulence. The modelled stresses were all calculated using  $\alpha =0.5$ but different values of $R$.
$R$.
In figure 8(a,b) we study the dependence of the two-point correlations on the filter type. The results using a Gaussian filter are essentially the same as those for a box filter (we use the usual definition of  $\varDelta$ as summarized in Pope (Reference Pope2000)). Remarkably, when using a spectral cutoff filtering (with cutoff filter equal to $k_{\varDelta } = {\rm \pi}/\varDelta$ Pope (Reference Pope2000)), the spatial correlations with the true SGS stresses decay much more rapidly than for the Gaussian and top-hat box filters. This is somewhat surprising since the spatial non-locality associated with a spectral filtering operation is more than for the box or Gaussian filters (in physical space the spectral cutoff filter's decay is slow, according to $1/r$). The oscillatory behaviour is as expected. As a consequence, for the spectral cutoff filter the traditional local modelling appears the most appropriate. Still, as discussed in Meneveau & Katz (Reference Meneveau and Katz2000), Eyink & Aluie (Reference Eyink and Aluie2009) and Aluie & Eyink (Reference Aluie and Eyink2009), the spectral cutoff filter kernel has some undesirable features (e.g. non-positiveness in physical space kernel) and hence for the reminder we continue to focus on the physical space local box filter. We have checked that results with the Gaussian filter lead to very similar results.
Two-point correlation functions between stresses and fractional filtered strain of different orders in homogeneous and isotropic turbulence using two filter types, namely a Gaussian filter (a) and a spectral cutoff filter (b).

Figure 9 shows the probability density functions of the true and modelled local instantaneous SGS dissipation  $\varPi = - \tau _{ij} \tilde {S}_{ij}$, for the isotropic turbulence flow using a box filter and $\varDelta =31\eta$. As is well known (Cerutti & Meneveau Reference Cerutti and Meneveau1998), the true distribution exhibits very long tails to both sides while the eddy-viscosity model with $\alpha = 1$ is, by definition, purely dissipative (i.e. has only positive values and much shorter tails). The results for non-local fractional eddy viscosity with $\alpha <1$ are almost the same as the $\alpha =1$ case but for very small probability events where $\varPi <0$ visible especially for the $\alpha = 0.2$ case. As mentioned before, occurrences of backscatter are expected for small values of $\alpha$. However, as can be seen in figure 9, the probability of such occurrences remains quite small and does not appear likely to be associated with the changes in the two-point correlations observed in figure 6. We note too that in an actual implementation of a non-local LES model, backscatter events may lead to numerical instabilities and should be treated carefully.
Probability density functions (PDF) of the true and modelled subgrid dissipation  $\varPi = - \tau _{ij} \tilde {S}_{ij}$ for the isotropic turbulence flow using a box filter and $\varDelta =31\eta$. The bottom $x$-axis and left $y$-axis (labelled ‘ $\alpha$’) correspond to the modelled cases using the fractional-gradient eddy-viscosity models, while the top $x$-axis and the right $y$-axis (labelled ‘True’) correspond to the subgrid dissipation rate evaluated using the measured SGS stress.
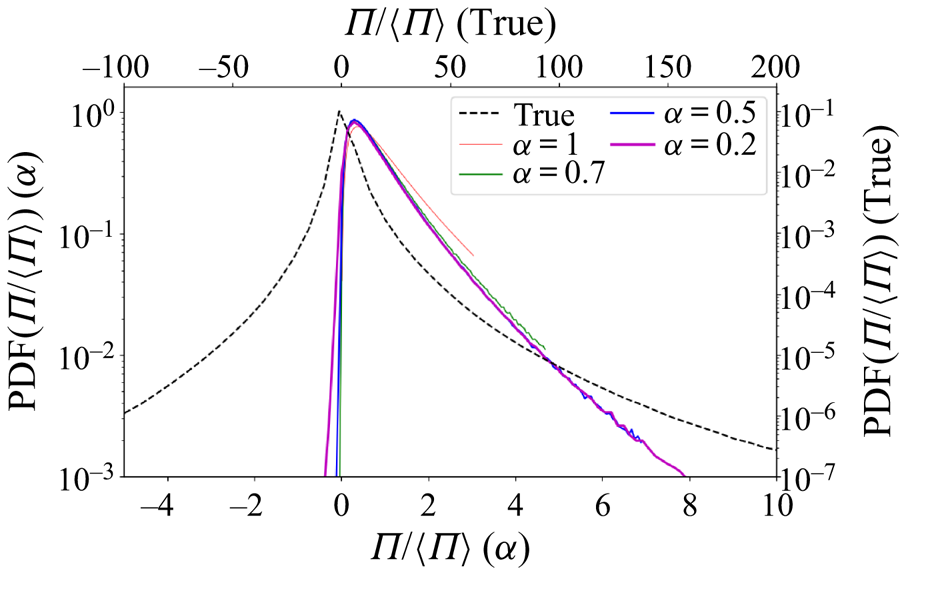
5.2. Channel flow
For analysis of channel flow, we first focus on two-point correlations in the streamwise and spanwise directions. We use a top-hat filter at a scale of  $\varDelta ^+ = 49$ and the filtering is performed only in the $x-z$ horizontal directions. Data are analysed in the logarithmic and outer regions $y^+=90, 260$ and at the centreline ( $y^+=1000$ for the ${Re}_{\tau }=1000$ dataset). Figure 10 shows the different two-point correlations along the streamwise direction at these three different locations from the wall. Compared to the homogeneous and isotropic case, the true correlations between the stresses and the strains along the streamwise direction first decay rapidly and then carry on for very long distances. For distances $r>\varDelta$ the local eddy-viscosity model again fails to capture these long lasting correlations, while the introduction of non-locality via $\alpha <1$ can remedy the situation. However, there appear variations in the optimal fractional order at different heights with $\alpha = 0.2$ appearing to provide more realistic correlations at $y^+=260$ while at $y^+=90$ even lower values of $\alpha$ would appear to be needed. At the centreline the true correlation function has a faster initial decay and it appears that no single fractional order has the appropriate trends.
Streamwise two-point correlations between different subgrid stresses and the filtered strain rates calculated from the channel flow at  ${Re}_{\tau }=1000$; data at different distances from the wall. Results are for top-hat filtering at $\varDelta ^+ = 49$ various $\alpha$ values as indicated and $R=5\varDelta$; (a) $y^+=90$, (b) $y^+=260$, (c) $y^+=1000$.

The correlations on the spanwise direction, shown in figure 11, are quite different than the ones in the streamwise direction. While a first guess would suggest that spanwise correlations should look more similar to the homogeneous and isotropic case, this is not the case. The behaviour of the exact correlations is not correctly captured by neither the local nor the non-local models. At the centreline, interestingly, the results for the true stress–strain rate correlations are very similar to the streamwise correlations.
Spanwise two-point correlations between different subgrid stresses and the filtered strain rates calculated from the channel flow at  ${Re}_{\tau }=1000$ data. Results are for top-hat filtering at $\varDelta ^+ = 49$, various $\alpha$ values as indicated and $R=5\varDelta$; (a) $y^+=90$, (b) $y^+=260$ and (c) $y^+=1000$.

Finally, we present the two-point stress–strain-rate correlation functions calculated using the channel flow data at  ${Re}_{\tau }=5200$. Results are shown in figure 12 at two different heights. The results at $y^+=1000$ are similar to the results at $y^+=260$ for the ${Re}_{\tau }=1000$ dataset. We note that in outer units these two datasets are at similar heights $y/h \sim 0.2$ and 0.26 respectively. Also at $y^+=5200$ (the centre of the channel in this case), results are similar to the centreline results at ${Re}_{\tau }=1000$, with the true stress–strain correlation decaying much faster at small distances and then breaking onto a very long tail. Again, none of the fractional models reproduce these trends since their decay appears to be more gradual throughout.
Streamwise two-point correlations between different subgrid stresses and the filtered strain rates calculated from the channel flow at  ${Re}_{\tau }=5200$; data at different distances from the wall. Results are for top-hat filtering at $\varDelta ^+ = 49$, various $\alpha$ values as indicated and $R=5\varDelta$; (a) $y^+=1000$, (b) $y^+=5200$.
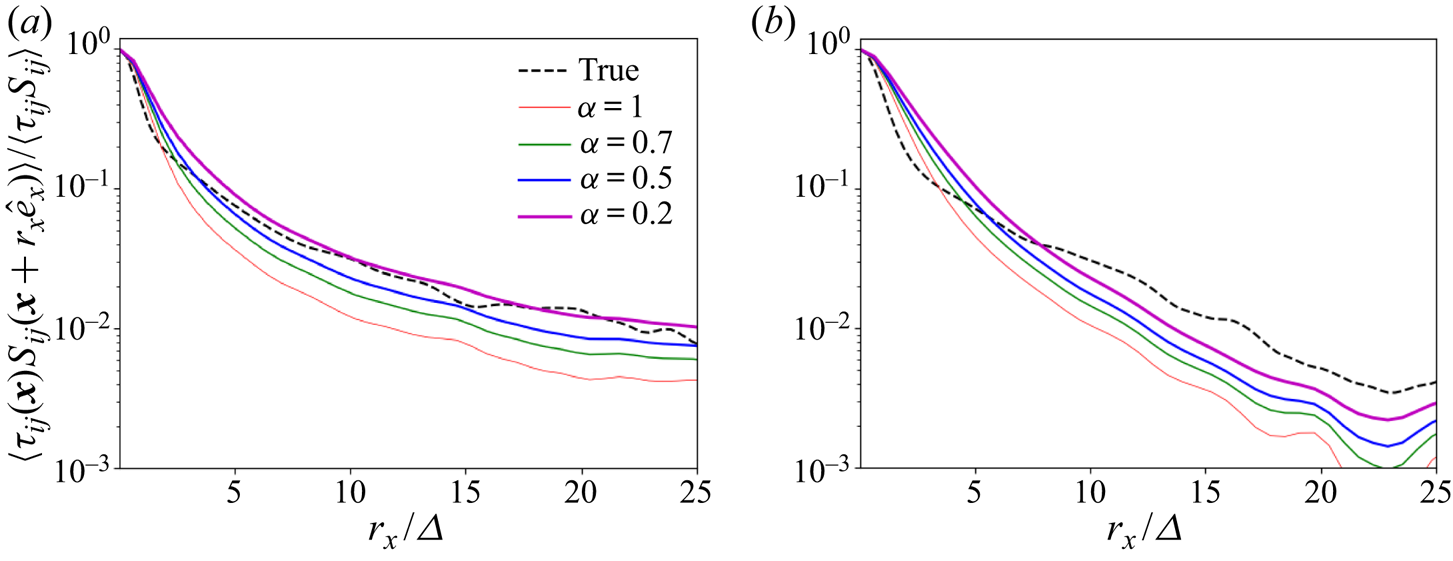
6. Conclusions
In this paper we show that for a LES to be able to reproduce the two-point correlations of filtered-velocity fields in turbulence, the subgrid stress tensor should correctly capture the two-point correlations between the filtered strain-rate tensor and the SGS stress tensor. This necessary statistical condition comes from the analysis of the Karman–Howarth equation for filtered-velocity fields. We also generalize the derivation of Meneveau (Reference Meneveau1994) from homogeneous to non-homogeneous turbulence. In either case, the special importance of the correlation function  $\langle \tau _{ki}({\boldsymbol {x}}) \tilde {S}_{ki}({\boldsymbol {x}}+{\boldsymbol {r}}) \rangle$ becomes apparent.
Using data from DNS of homogeneous isotropic turbulence and channel flows, we show that the correlations developed by local eddy viscosity, such as the Smagorinsky model (strictly speaking with constant eddy viscosity), decay faster than those observed in the analysis of the true SGS stress. In order to include non-local dependencies in the model, it is argued that a convolution of the strain-rate tensor with a non-local eddy-viscosity kernel can be invoked. A mathematically compact special case of non-locality is provided by fractional differentiation. We first propose a generalization of the Caputo fractional derivative applicable to 3-D problems that is amenable to vector calculus.
As a first step exploring the properties of such a modelling approach, we perform statistical a priori testing based on DNS data from isotropic and channel flow turbulence. The analysis focuses on the behaviour of predicted strain rate–stress correlation functions that had been identified as necessary condition for LES to generate accurate predictions of two-point statistics (correlations, spectra) of filtered velocities. Different parameters are considered, such as filter size, type, wall distance (in the channel flow case) and integration radius  $R$.
$R$.
The main conclusion is that for many of the cases tested (filter size, type, flow), the fractional model provides more realistic predictions of the long tails in the observed two-point correlations compared to the local eddy-viscosity approach. In isotropic turbulence, a value of  $\alpha \sim 0.5$ appears to provide good predictions, although we do not have a theoretical explanation for such a value. We note that this conclusion applies to the spatially local filters such as top-hat and Gaussian filters. For the spectral filter, it was found that the local modelling appeared appropriate. In channel flow, strong directional dependence was observed, with very strong non-locality in the streamwise direction, which is not surprising given the existence of elongated streamwise structures in this flow. The behaviour in the longitudinal direction was much more local. Interestingly, at the channel centreline while the streamwise and spanwise behaviours became more similar, they differ markedly from the behaviour of isotropic turbulence. While the results show promise for non-local LES modelling, our aim in this paper has been to focus on the physics of scale interactions and not to present such models as ready yet for applications in LES.
Clearly much more work is required before these findings can be channelled into a working subgrid model for practical applications in LES. Also, present results suggest that the fractional order  $\alpha$ should be direction dependent in anisotropic flow, as well as depend on position (e.g. distance to the wall) in non-homogeneous flow. How to prescribe such dependencies in prognostic, general-purpose LES where one typically wishes to avoid having to use non-local information unless it arises from prognostic transport equations, is an open question. Since no unique clear value for the parameter $\alpha$, valid across various regimes, has emerged from the present a priori analysis, options such as prescribing $\alpha$ as function of wall distance (as is done when using wall damping functions), or exploring dynamic approaches based on the Germano identity (Germano et al. Reference Germano, Piomelli, Moin and Cabot1991) are worth exploring.
In terms of numerical implementation, we point out that without special treatments and accelerations, the numerical evaluation of non-local gradients has high operations count, proportional to  $R^3$ which can be quite expensive even if $R$ is restricted to $R \sim 5\varDelta$. New tools based on neural networks (Lu, Jin & Karniadakis Reference Lu, Jin and Karniadakis2020) or the sum-of-exponentials approximation (Jiang et al. Reference Jiang, Zhang, Zhang and Zhang2017) that are currently being developed show great potential to accelerate the costly calculations required by non-local operators. Further efforts should be directed at accelerating the evaluation of non-local operators to enable practical applications of non-local modelling.
Acknowledgement
The authors are grateful to the IDIES staff supporting JHTDB.
Funding
Funding was provided by the AIRA (Artificial Intelligence Research Associate) programme of the Defense Advance Research Projects Agency (DARPA).
Declaration of interests
The authors report no conflict of interest.
Author contributions
P.C. performed the statistical data analysis. All authors contributed to deriving theories, reaching conclusions and writing the paper.
Appendix A. Numerical technique for non-local operators
We adapted an L-scheme technique Yang, Liu & Turner (Reference Yang, Liu and Turner2010) to our definition of the fractional gradient. The idea behind the method is to perform the radial integration very accurately in small discrete intervals. In that way the singularity in the integral and in the gamma function can be taken care of simultaneously. The method is as follows: let  $\tilde {\boldsymbol {r}} = \boldsymbol {r} - \boldsymbol {r}'$, $g(\tilde {\boldsymbol {r}}) = ({\partial u}/{\partial r_i}) (\tilde {\boldsymbol {r}})$, $d=3$, and use spherical coordinates in $\tilde {\boldsymbol {r}}$
 \begin{align} D^{\alpha, R}_i u(\boldsymbol{r}) &= \frac{1}{4{\rm \pi} \varGamma(1-\alpha)}\int_{\varOmega} \int^R_{0} g (\tilde{\boldsymbol{r}}) \tilde{r}^{-\alpha}\,\textrm{d}\tilde{r}\,\textrm{d}\varOmega,\nonumber\\ &= \frac{1}{4{\rm \pi} \varGamma(1-\alpha)} \int_{\varOmega} \left[ \sum^{N-1}_{i=0} \int^{(i+1)h}_{ih} g (\tilde{\boldsymbol{r}}) \tilde{r}^{-\alpha}\,\textrm{d}\tilde{r} \right]\,\textrm{d}\varOmega, \nonumber\\ &\approx \frac{1}{4{\rm \pi} \varGamma(1-\alpha)} \int_{\varOmega} \left[ \sum^{N-1}_{i=0} g(ih,\theta,\phi) \int^{(i+1)h}_{ih} \tilde{r}^{-\alpha}\,\textrm{d}\tilde{r} \right]\,\textrm{d}\varOmega,\nonumber\\ &= \frac{h^{1-\alpha}}{4{\rm \pi} \varGamma(2-\alpha)} \sum^{N-1}_{i=0} \left[ \int_{\varOmega} g(ih,\theta,\phi)\, \textrm{d}\varOmega \right] ((i+1)^{1-\alpha} - i^{1-\alpha}). \end{align}
Doing this deals with both the singularity coming from the  $\varGamma$ function and from the integration kernel.
The last ingredient needed for the method is to calculate the integral over the solid angle. To do this, we first discretize the area (sphere) over where the integration takes place following the algorithm proposed by Saff & Kuijlaars (Reference Saff and Kuijlaars1997), which generates equally spaced points on the sphere by following a spiral connecting one pole to the other. The number of integration points over each sphere,  $N_i$, is chosen so that $N_i h^2 \approx 4{\rm \pi} (ih)^2$, where $h$ is the desired spatial resolution. The values of the field required at all the different locations (in our case the filtered-velocity gradient tensor) are obtained via trilinear spatial interpolation. The integration step $h$ is approximately equal to the grid size of the simulations from which the data were gathered, in our case comparable to the filter size $\delta$.


