


“Probablemente Ícaro creía tocar el cielo cuando se hundió en el mar epónimo”.
Julio Cortázar.
1. Introduction
From 1959 onwards, the tourism industry has become one of the main engines of the Spanish economy. It is frequently recognised for its key role in the pattern of economic development, with a particular incidence in the labour market and the balance of payments (Balaguer and Cantavella-Jordá, Reference Balaguer and Cantavella-Jordá2002). The prominent role of this sector can be seen clearly in the archipelagos and areas of the Mediterranean coast, where it became the main sector of specialisation. However, this association with tourism services has also been related to considerable negative social, economic and ecological impacts (Manera and Navinés, Reference Manera and Navinés2018). Despite these claims, tourism labour markets in Spain are still scantly explored from a contemporary and historical perspective (Walton, Reference Walton2012).
Most main theories in social science and tourism studies note that the process shaping the foundational characteristics of regions and their institutions, such as labour markets, industrial structures or legal systems, can constrain the capacity for change by increasing future costs of adaptation and restructuration (David, Reference David1994). Similarly, the Tourism Area Life Cycle, which defines different stages in the evolution of tourism destinations, considers that the period of “development”, where the tourism destination shapes its structure, affects the capacity for future restructuring (Agarwal, Reference Agarwal2002). Thus, from a labour market perspective, both theoretical frameworks emphasise the process of labour market formation as a critical stage for understanding the development of tourism regions.
In this paper, I study the stage of labour market formation mentioned by these theories in Spain with a specific focus on the case of the Balearic Islands. The so-called Spanish tourism boom represented a turning point in the Spanish economy. During this period, the tourism industry became the critical sector of the key tourism regions of Spain, adapted to a mass tourism model and structured its labour market, factors which characterise the development stage of these theories. The areas of higher tourism incidence experienced profound structural change leading to intense migrant assimilation shaped by circular migratory flows. Afterwards, between 1973 and 2008, this model, based on sun and beach tourism and low prices, expanded strongly in these regions and to other provinces.
Following this aim, the paper analyses the characteristics of the labour market formation during this foundational period. By analysing how the labour market functions, I want to improve understanding of posterior developments by showing the patterns established by this process. I hypothesise that the Spanish tourism boom shaped a pattern of labour-intensive growth with a limited capacity to rely on local labour which could be significant in understanding the long-term trajectory of Spanish tourism-related regions. Besides, I consider that the key role of temporary migratory flows could be an additional factor that helps to understand labour market structure and social cohesion. Thus, firstly the study focuses on the capacity of attraction of local labour by the different regions and the way the labour market functioned. Secondly, it analyses the response of the main agents to the main socio-economic constraints posed by tourism growth, particularly on distinct levels of labour shortages, seasonality and housing. Finally, the study explores how this response, mainly channelled by the attraction of circular migrants, affected the labour market structure.
Therefore, this analysis can also contribute to our knowledge of the impact of circular migrations in labour markets. A scarce but growing research is noting the differential role of temporary migrations during the assimilation process (Dustmann and Görlach, Reference Dustmann and Görlach2016; Chabé-Ferret et al., Reference Chabé-Ferret, Machado and Wahba2018; Adda et al., Reference Adda, Dustmann and Goerlach2022). However, although a differential impact of circular migrants is often recognised, our knowledge of their effects on the structure of the host labour market is still limited. Given the importance of circular migratory flows in the formation of the tourism labour market in Spain, our investigation constitutes an exceptional case study to analyse the influence of this typology of migration from a historical perspective.
Studies on tourism labour markets and circular migrations are usually hard to develop due to the difficulty of fully capturing these socio-economic phenomena (Walton, Reference Walton2012; Dustmann and Görlach, Reference Dustmann and Görlach2016). In this paper, I opt for an alternative and complementary approach by using descriptive quantitative analysis of this process in combination with the current theoretical and empirical evidence on the impact of migration in labour markets. To do so, I relied on a novel and unique employer–employee micro-dataset of more than 10,000 observations of men and women working in the tourism sector in 1969. I combine this source with multiple quantitative and qualitative sources from reports, archival work and oral testimonies from the main Spanish tourist regions.
The article is divided as follows. Section 2 examines the current research on tourism specialisation and the role of temporary migrations in labour markets. In section 3, I describe the sources utilised in this paper. Section 4 explores the main characteristics of the Spanish tourism boom. In section 5, I analyse the capacity of recruitment of local labour by the regional labour markets. In section 6, I discuss the role of circular migration in the process of labour market formation. Section 7 concludes.
2. Tourism specialisation, labour markets and circular migration
Studies on the role of tourism in promoting economic growth in Spain consider this industry the main source of economic development and employment generation. The Spanish tourism boom, 1955–1973, established a socio-economic process that situated Spain as one of the leading tourism destinations in the world. Since then, it has been key in fostering the accumulation of foreign trade earnings pushing a faster rate of capital accumulation (Balaguer and Cantavella-Jordá, Reference Balaguer and Cantavella-Jordá2002). Besides, the specialisation in tourism services has augmented considerably in the last four decades; tourism reached 12% of the total GDP and 14% of employment in 2019.
However, this apparent success has been accompanied by increasing externalities, especially related to its competitiveness and socio-economic sustainability. Since the mid-1970s, Spanish tourism destinations have undergone intense restructuring. Based on the Fordist model of sun and beach, with low prices as the main competitive advantage, Spanish destinations faced considerable constraints in adapting to diversifying international demand and increasing competition from developing countries.
This has also hindered the capacity to transform the tourism supply and compete in higher value-added markets. Tourism agents have often emphasised the role of the labour market. For example, in interviews with heads of human resources from prominent hotel chains, high turnover rates and rapid training and configuration of their staff during the Spanish tourism boom were seen as constraining factors that limited their capacity to compete with higher value-added destinations (Homs, Reference Homs1987). Thus, although the tourism supply in Spain expanded considerably and agents managed to increase tourist arrivals, the tourism destinations showed clear signs of maturity between 1985 and 2008. Consequently, the negative gap between tourism receipts in nominal and real terms and the number of arrivals increased significantly (Perles-Ribes et al., Reference Perles-Ribes, Ramón-Rodríguez, Rubia-Serrano and Moreno-Izquierdo2016).
The evolution of the competitiveness of Spanish tourism could be closely linked to the characteristics of the socio-economic development of the leading tourist regions. These destinations, which played a crucial role during the Spanish tourism boom, have experienced a steady decline in GDP per capita in recent decades. Between 2000 and 2015, GDP per capita in the Balearic Islands and the Canary Islands fell by −11.1% and −3.8% (constant 2010 prices), and between 2000 and 2018 by −0.4% and +1.4% (constant 2015 prices). In the same period, GDP per capita in Spain grew by +7.3% between 2000 and 2015 (constant 2010 prices) and by +15.8% between 2000 and 2018 (constant 2015 prices) (Ministerio de Hacienda y Función Pública, 2023). Similarly, Spanish cities with lower GDP per capita in 2018 include tourist cities such as Fuengirola and Marbella in Málaga and Benidorm and Torrevieja in Alicante (INE, 2021). In Catalonia, Lloret de Mar and similar tourism-related localities are among those with a lower standard of living in the region (Idescat, 2018).
According to Capó et al. (Reference Capó, Riera and Rosselló2007), who examined the long-term evolution of the Balearic Islands and the Canary Islands, this dynamic is rooted in the labour-intensive economic development registered by these regions that resulted in a slowdown of productivity since the recovery from the 1970s oil crisis. In the same vein, Prados de la Escosura and Rosés (Reference Prados De La Escosura and Rosés2021) argue that the increasing specialisation of the Spanish economy in non-tradable sectors, such as low-skill services and the construction sector, could be one of the explanations for the productivity slowdown experienced by the country since 1985.
This labour-intensive development was mainly possible by attracting migration from other provinces of Spain and, particularly since the late 1990s, foreign countries. Table 1 suggests this pattern by showing that since 1970 tourism provinces have become the regions with the highest rates of non-native population in relative terms. While historical recipient regions related to diversified economies, such as Madrid, Barcelona, Valencia and Basque Country provinces, barely increased the ratio of non-local population, tourism provinces became the main recipient regions in relative terms.
Share of the population born in another Spanish province or a foreign country, 1950–2019
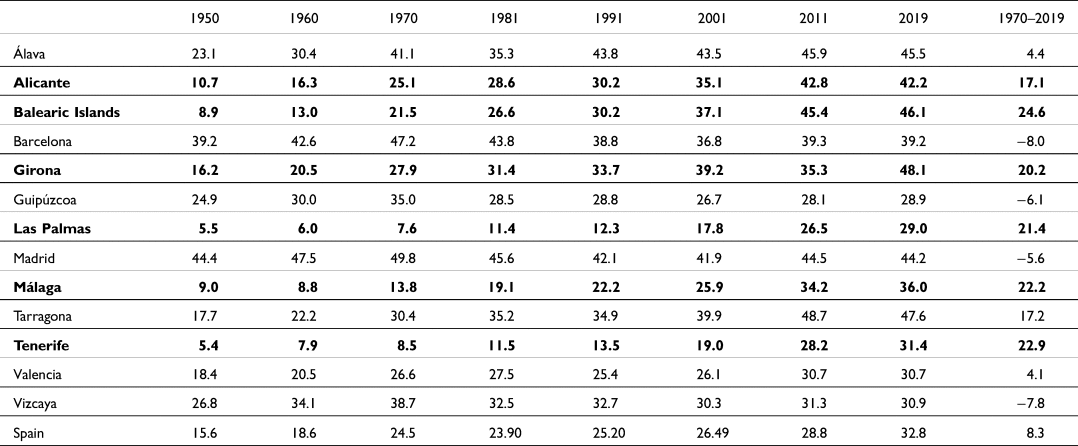
Source: INE. Censos de Población 1950–2011; INE. Padrón Continuo. January 2020.
Note: Tourism provinces are in bold.
As a result, the processes of migrant assimilation and the management of population growth have become crucial for the sustainable development of Spanish tourism regions. On the one hand, some authors have highlighted the externalities associated with population growth and the floating population (tourists, residential tourists and temporary migrants), particularly the increased pressure on water consumption, health systems and waste generation (Murray, Reference Murray2012). On the other hand, other scholars have pointed out the potential effects on labour and housing markets, such as lower human capital accumulation, especially since the abundance of low-skilled jobs encourages school dropouts among the young population, and on housing prices, linked to the higher demand for housing and residential tourism (Amer, Reference Amer2011; Blázquez-Salom et al., Reference Blázquez-Salom, Blanco-Romero, Vera-Rebollo and Ivars-Baidal2019).
In this regard, temporary migrations and, especially, circular migrations have played a considerable role, given the characteristics of tourism jobs and levels of seasonality in these labour markets. Although data on this phenomenon is limited (Dustmann and Görlach, Reference Dustmann and Görlach2016), diverse evidence suggests its vital role in labour market developments after 1973. For example, Tabares (Reference Tabares1989) estimated that approximately more than half a million seasonal jobs were occupied by Spanish migrants within Spain and in European countries in the late 1980s. According to this author, coastal tourism was a significant migrant destination for these workers. In ethnographic studies conducted during the 1980s and early ‘90s, Lever and Valero suggest that although circular migration could have declined since the mid-1970s, these fluxes were significant among very low-income occupations in the Costa Brava and Costa Blanca regions (Lever, Reference Lever1987; Valero, Reference Valero1991). Since the mid-1990s, the number of circular international migrants working in agriculture, tourism, construction, health care and domestic work in the Mediterranean started to increase significantly (Solé et al., Reference Solé, Parella, Sordé-Martí, Nita, Solé, Parella, Sordé-Martí and Nita2016). Thus, in Spain, 30.7% of total foreign migrations coming from outside the European Union for work were temporary in 2007. In the same year, temporary migrants with stays of more than three months comprised 18% of the stock of migrants in the Balearic Islands (OECD, 2007; Salvà, Reference Salvà2008).
Temporary migrants differ from permanent migrants in their location preferences (Dustmann and Görlach, Reference Dustmann and Görlach2016). Since temporary migrants intend to return, they can have lower incentives to acquire host-specific human, social and physical capital. Moreover, the temporary nature of migration is associated with lower reservation wages, that is, the lowest wage rate the worker is willing to accept for working at a specific job, increasing the propensity to accept low-income jobs related to higher labour intensity and precariousness. Thus, an influx of temporary migrants could also imply differential sociological and political consequences since research has shown that temporary migrants are usually less interested in host politics or in creating networks with natives (Chabé-Ferret et al., Reference Chabé-Ferret, Machado and Wahba2018; Adda et al., Reference Adda, Dustmann and Goerlach2022).
Temporary migrations can also have a distinctive impact depending on the characteristics of the migratory path and time spent in the host region. Within this broad typology, circular migrations are characterised by their singular and differential nature. Constant et al. (Reference Constant, Nottmeyer, Zimmermann, Zimmermann and Constant2013) define them as a continued and repeated informal or formal migratory movement that covers more than one migration cycle between their homelands and other areas—one or more—of the country or foreign countries for work purposes. It can be distinguished from return migration which comprises only one trip and an eventual and definitive return. Other studies stress that circular migration can imply a higher level of attachment to the place of origin. In many studies, this is associated with lower marginal utility from consumption and investment in the destination and higher incentives for the accumulation of savings during the stay in the host region (Dustmann and Görlach, Reference Dustmann and Görlach2016).
Similarly, circular migration involves short-term moves, sometimes related to seasonal or life-cycle movements, while return migration involves longer periods spent at the destination. This also differentiates it from cross-border migrations, generally assumed to cover very short periods. Some scholars also emphasise the crucial differentiation between spontaneous and managed circular migrations. While de facto circular movements take place without the control of any formal policy framework, sometimes involving illegal migration, those managed imply migration under and constrained by the channels and objectives established by the governments which signed the migration scheme (Wickramasekara, Reference Wickramasekara2012; Solé et al., Reference Solé, Parella, Sordé-Martí, Nita, Solé, Parella, Sordé-Martí and Nita2016).
Therefore, circular migration can represent an alternative dynamic on how migrants interact with natives and host labour markets. Constant et al. (Reference Constant, Nottmeyer, Zimmermann, Zimmermann and Constant2013) argue that circular migration could represent a triple-win scenario for sending and receiving countries, as well as for circular migrants. From a host labour market perspective, receiving countries satisfy short-term labour shortages allowing firms to fill their vacancies without increasing wages and preventing inflationary wage increases in the rest of the job hierarchy. Moreover, the short-term stay of these migrants would attenuate any friction with natives and reduce labour market competition.
In this context, natives would have an easier path to move up on the occupational ladder, particularly if the decline in labour shortage led to an expansion of the industry. Moreover, the higher flexibility of circular migrations would facilitate the adjustment of labour; a decrease in the firm's production could easily be compensated by not recruiting the same number of circular migrants the following season. Hence, a decline in the local labour demand would not affect the host society but the area of origin (Constant et al., Reference Constant, Nottmeyer, Zimmermann, Zimmermann and Constant2013).
Researchers have also noted negative consequences for the agents involved in the migratory process. Circular migrants can find in migration a great chance to overcome household income constraints, improve well-being and achieve upward mobility. However, they could also experience negative consequences, particularly if circular migration perpetuates over time, being trapped in very low-income occupations or facing abuse, discrimination or exploitation in the host society (Skeldon, Reference Skeldon2012; Wickramasekara, Reference Wickramasekara2012; Constant et al., Reference Constant, Nottmeyer, Zimmermann, Zimmermann and Constant2013).
From the perspective of the host region, some authors have remarked that a substantial increase in temporary migration may be associated with higher inequality and segregation, particularly if most end up becoming permanent residents (Chabé-Ferret et al., Reference Chabé-Ferret, Machado and Wahba2018). Since most circular migrants would contribute to the firm's expansion and would mainly complement natives, this could widen the income distribution. In this regard, researchers have emphasised the critical role of public provision of housing, subsidies, educational services and job assistance to prevent this potential negative impact (Constant et al., Reference Constant, Nottmeyer, Zimmermann, Zimmermann and Constant2013). Furthermore, an intense inflow of circular migrants can impact the level of capital investment. In this scenario, firms could be particularly incentivised to adopt labour-intensive technologies at the expense of capital-intensive ones, leading to lower productivity (Clemens et al., Reference Clemens, Lewis and Postel2018).
3. Sources
Empirical work on seasonal labour markets and circular migration faces important methodological challenges (Dustmann and Görlach, Reference Dustmann and Görlach2016), especially in low-skilled services, such as the tourism industry (Walton, Reference Walton2012). In this paper, I computerised a unique and novel employer–employee micro-database of 10,761 observations of men and women working in the tourism industry of the Balearic Islands in 1969 (AGA, Sindicato Nacional de Hostelería, caja 62). Staffs from 200 hotels, 130 hostels, 200 bars and restaurants, 10 nightclubs, 13 travel agencies and one transport company were interviewed. This data includes a broad range of variables, including individual, professional and firm characteristics for each worker,
This source includes three crucial variables for analysing circular migrant flows and labour markets. Firstly, it informs about the specific occupation of each worker, years of seniority and labour experience in the sector. Secondly, this data captures the occupations of natives during the summer season. This is important because circular migrants and seasonal jobs of natives were highly unreported in labour market-related statistics and censuses of population or municipality registers. These reports were taken in periods of the year that did not coincide with many seasonal peaks of labour in Spain, including the tourism season (Silvestre, Reference Silvestre2007). Thirdly, firms were asked to report the current residence of the workers at the time of the interview. This allows us to identify circular migrants using as a proxy those workers with more than zero years of labour experience who indicate in the interview their address of origin as a current residence or report receiving accommodation from the firms.
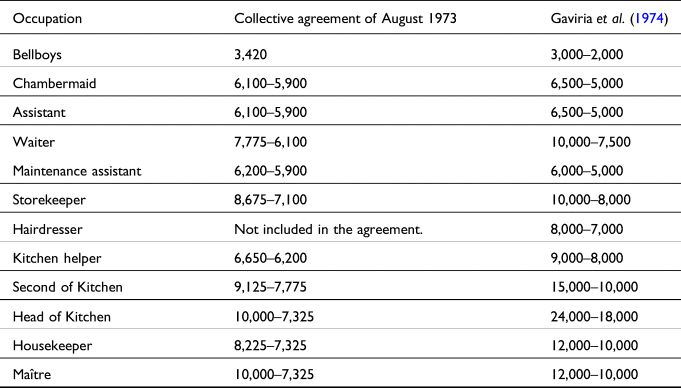
I use this database to construct an individual-occupation-based income score. I follow the recommendations of Inwood et al. (Reference Inwood, Minns and Summerfield2019) to impute to each observation of the Census of 1969 the monthly wage corresponding to its occupational category established in the provincial labour agreement of August 1973. This makes it possible to overcome the main problems of income scores noted by these authors. I use a multilevel hierarchy that takes into account the multilevel disaggregation within occupations and firm categories. I also employ ancillary information about changes in skill returns within professions to estimate real wages more effectively. This information comes from interviews with 157 workers about their real wages in 1973 in the Balearic Islands and mainland Spain tourism destinations (Gaviria et al., Reference Gaviria, Iribas, Monterde, Sabbah, Sanz and Udina1974). Additionally, I include the extra pay for tenured workers as specified in the labour agreements (see Tables 12 and 13 in the Appendix).
I combine this data with complementary information about labour conditions and living standards. This comprises multiple quantitative and qualitative data: from government reports and oral testimonies to labour agreements, labour inspections and surveys. To study household income inequality compared with the rest of the economy, I rely mainly on two sources. On the one hand, I use the Spanish Household Budget Survey of 1973, which provides information on household spending of 455 households and 1,565 individuals registered in the Balearic Islands in this year. On the other hand, I employ provincial average labour costs by branch reported by Fundación BBV (1999) and labour agreements at a sector and provincial level for the period 1955–1973.
4. The Spanish tourism boom, 1955–1973
Since the mid-1950s, and especially stimulated by the reforms launched by the 1959 Stabilisation Plan, the tourism sector became a key engine of the Spanish economy. Franco's dictatorship, with the assistance of international institutions, understood the tourism industry as a tool to solve the trade imbalances that afflicted the country (Prados De La Escosura et al., Reference Prados De La Escosura, Rosés and Sanz-Villarroya2012).
Thus, the arrival of international tourists, mainly from European countries such as the United Kingdom, Germany and France, was the main agent of transformation: 77.5% of total tourism consumption in Spain corresponded to foreign tourists in 1967, covering 72% of the total deficit of the commercial balance. As is well known, the number of international tourist arrivals rose from 400,000 in 1950, to 1 million in 1955, to 2 million in 1958 and to 31 million in 1973. This process took place as part of the recovery of the Spanish economy to pre-war levels and the end of international isolationism in the mid-1950s and ended with the 1973 oil crisis. The number of tourists fell by 15% and tourism expenditure by 14% between 1973 and 1974. Tourist arrivals did not recover until 1983 (Vallejo, Reference Vallejo2002; Pack, Reference Pack2009).
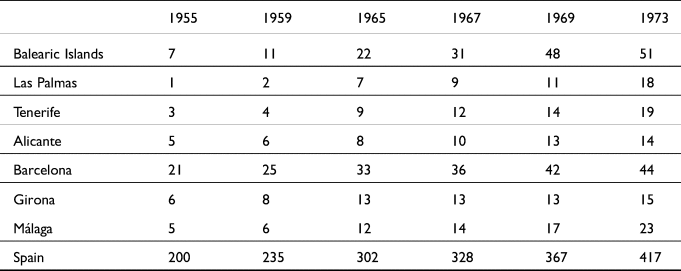
In response to the growing demand for tourism services, the number of hotels and hostels skyrocketed from 2,200 to 9,200 in the same period and the number of hotel beds from 57,000 in 1955 to almost 700,000 in 1973. This process was accompanied by an intense growth of tourist flats and second homes; a total of 123,000 legal holiday flats and 1,923,000 illegal holiday flats or second homes were registered in 1970 (Tables 2–4).
Hotel beds by main destinations in Spain, 1950–1975 (thousands)
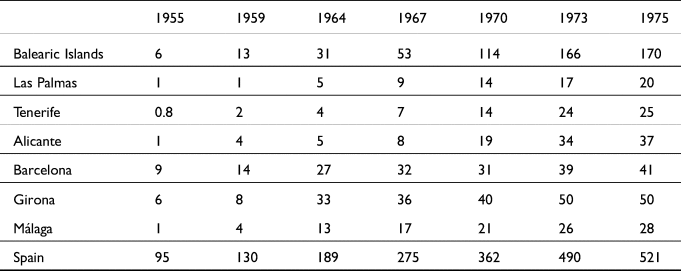
Source: INE (1950–1975).
Hostel beds by main destinations in Spain, 1963–1975 (thousands)
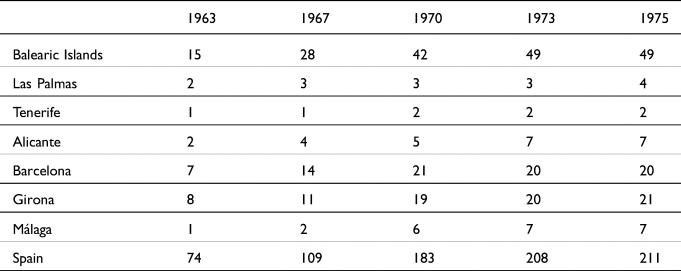
Source: INE (1955–1975).
Note: No data on hostel beds prior to 1963.
Total beds by typologies of touristic accommodation in 1970 (thousands)
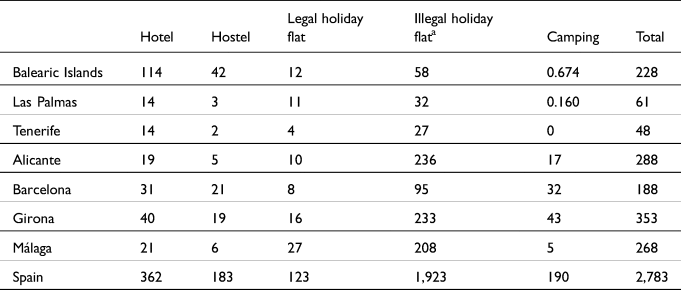
Source: CPDES (1975).
a It comprises second homes that can accommodate tourists but are not legally declared as part of the tourism supply.
The country had positioned itself among the top international destinations in the world, while tourism became a key contributor to GDP growth (Balaguer and Cantavella-Jordá, Reference Balaguer and Cantavella-Jordá2002). This achievement was driven by the growth of a hotel supply based on low prices that could compete downwards with other Mediterranean destinations such as Italy or Yugoslavia. Thus, although the number of luxury hotels increased, the growth was based on the inauguration of new hotels or hostels and the increase of hotel beds, both of low category (Cals, Reference Cals1974). In Spain, 49% of the total growth in hotel and hostel accommodation between 1963 and 1973 corresponded to one-star hotels or hostels.
The tourism boom took place on the Spanish Mediterranean coast and the archipelagos. The epicentre of this process was the Balearic Islands (Tables 2–4), followed by Catalonia, Alicante and Málaga, and the late but intense growth of the Canary Islands. In the Mediterranean archipelago, tourist arrivals rose from 300,000 in 1958 to 3.5 million in 1973. In parallel, the number of hotels and hostels increased from 112 to 1,534. As a result, accommodation in the hospitality industry changed from 3,000 beds to 200,000. The growth was particularly intense between 1963 and 1970. In this period, 114 hotels or hostels were inaugurated annually on average.
This process also meant a revolution for regional labour markets under the context of Spain's rural exodus and the completion of the modernisation of the Spanish economy. During this period, more than 15% of Spaniards changed residence, moving from rural agricultural areas to urban industrial centres of Madrid, Barcelona, Bilbao and Valencia. Similarly, Europe also became an important migrant destination. Approximately two million Spaniards emigrated to other European countries such as Germany, Switzerland and France. Andalusia, Castile-La Mancha, Castile and Leon, Extremadura and Galicia were the main sending regions. Internal and international circular migrations persisted as a significant phenomenon, particularly in southern Spain, although declining in relative terms, associated with seasonal crops in rural areas and temporary employment in urban migrant destinations (Tabares, Reference Tabares1989; Ródenas, Reference Ródenas1994).
In this context, tourism districts were an alternative destination for migrants and local workers. More than 200,000 new salaried jobs were created if we only consider the category of hospitality and restaurants (Table 5). During the 1960s, approximately one million Spaniards started to work in tourism-related sectors or opened a tourism business, often without any previous knowledge or preparation (Pack, Reference Pack2009). This meant a profound process of structural change in the areas involved. In the Balearic Islands, the growth of tourism-related services triggered an intense transformation of the provincial economy. Between 1960 and 1970, this region completed its structural change towards tourism-related services by almost doubling the number of workers in services. Job vacancies attracted migrants from mainland Spain who increased from 43,000 to 178,000 approximately. As a result, the non-native population changed from 8.9% in 1950 to 26.7% in 1981.
Salaried workers in hospitality and restaurants by tourism region in Spain, 1955–1973 (thousands)
Source: Fundación BBV (1999).
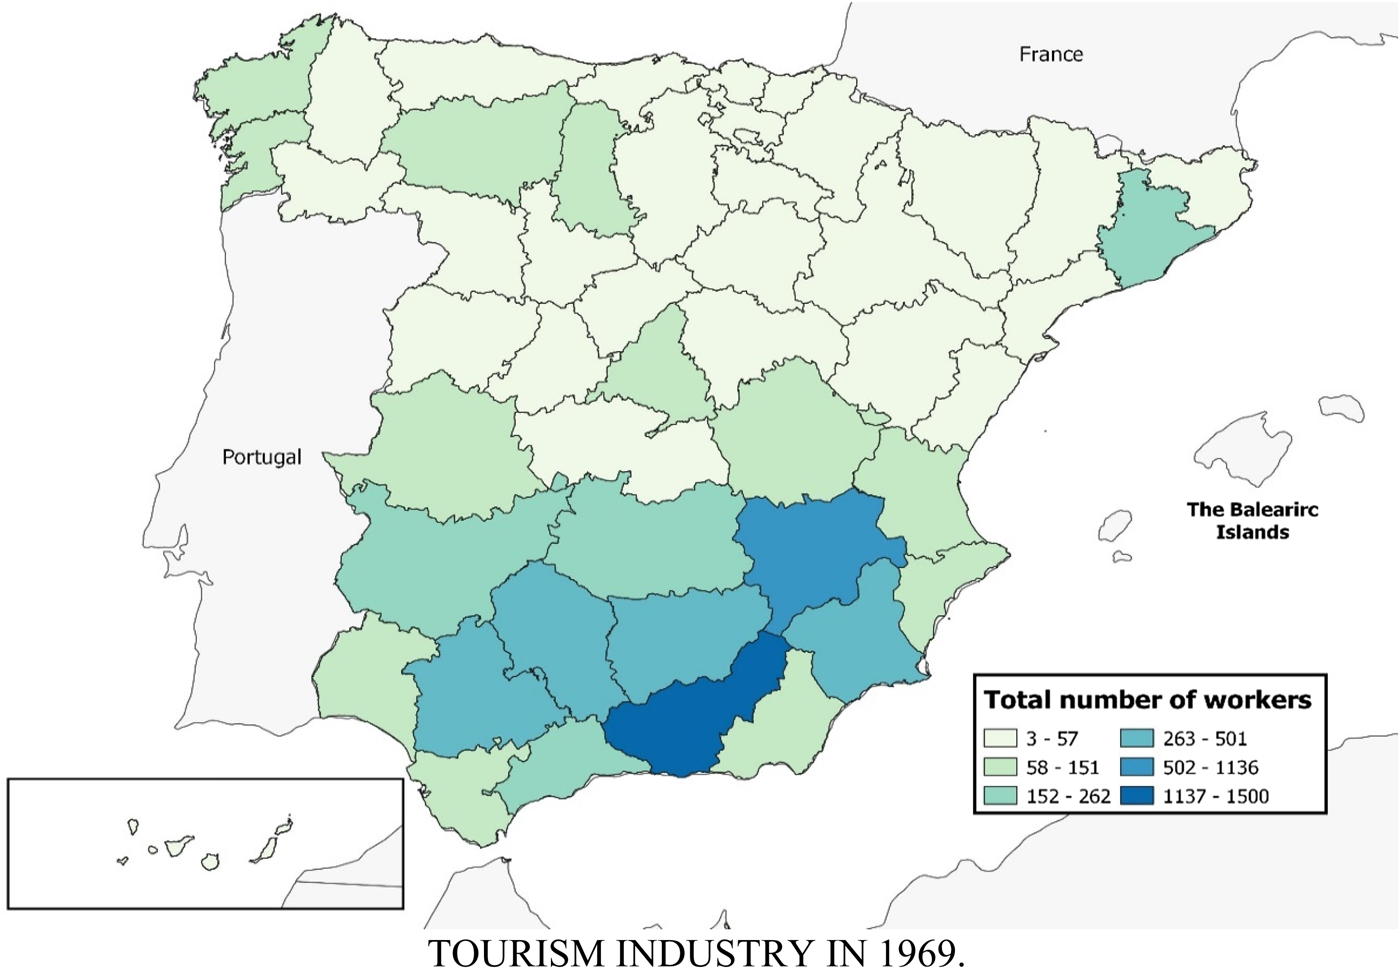
The significant role of circular flows to these areas biases the pool of migrants registered in Census data. However, using the employer–employee micro-dataset we can show an approximation of the actual origins of these migrants. As can be seen in Figure 1, migrants attracted by occupations directly associated with the tourism boom came mainly from southern Spain, especially from Andalusia, Castile-La Mancha and Murcia.
Spanish non-native workers by place of birth in the Balearic tourism industry in 1969.
Source: Census of the Balearic Tourism Industry of 1969.
According to estimates, in the Balearic Islands, 37.5% of the total workforce in the summer season was working in the tourism sector by 1973. Approximately 50% of the active population worked in tourism-related activities during the high season if we include the construction sector, which increased by more than 10,000 jobs between 1960 and 1970 (AHRM, Sindicats, box 392). Similar figures have been suggested for the coastal districts of mainland Spain in the Costa del Sol, Andalusia and Costa Brava, Catalonia (Pack, Reference Pack2009).
5. Local labour and recruitment capacity
As a low-wage labour-intensive industry, the tourism industry, particularly its core branch, the hospitality sector, was very reliant on its capacity to recruit workers from the local labour market. In these branches, labour costs represent a significant and crucial share of total exploitation costs and, therefore, levels of firm expansion are crucially constrained by the availability of labour and its costs (Andersson et al., Reference Andersson, Holzer and Lane2005). Therefore, our first step in analysing the labour market functioning during this period will focus on investigating the relationship between local labour and firms' recruitment capacity.
The institutional framework conditioned a particular model of industrial relations. Political and trade union association was illegal, and workers were obliged to belong to the dictatorship's sole trade union, the Organización Sindical Española. Collective bargaining was under the control of the dictatorship. This meant that workers had very limited scope to negotiate labour demands through institutional means. The Francoist dictatorship implemented a labour policy based on a low minimum wage with a scant influence on wage-setting (Maluquer de Motes and Llonch, Reference Maluquer De Motes, Llonch, Carreras and Tafunell2005). Moreover, employers could not formulate permanent seasonal contracts to retain their seasonal workers. Despite these regulations being present in other sectors, such as the fish-canning industry, employers from the tourism industry could only hire workers by using permanent or temporary contracts (Consell Econòmic i Social de les Illes Balears, 2003; Muñoz, Reference Muñoz2006).
Demographic factors and migratory policies conditioned the size of the labour supply at the beginning of the tourism explosion in most tourist destinations, especially in the archipelagos. On the one hand, the cohorts that accessed the labour market were comparatively smaller due to the lack of births and excess mortality derived from the Spanish Civil War and the post-war period (Nicolau, Reference Nicolau, Carreras and Tafunell2005). Besides, during this period, Catalonia and the Balearic Islands were characterised by lower fertility rates than the Spanish average (Cabré and Pujadas, Reference Cabré and Pujadas1987). On the other hand, the dictatorship implemented migratory restrictions to control and reduce population movements. This was part of policies formulated by Franco's regime to fight social unrest and guerrilla resistance under the economic and social crisis resulting from the Spanish post-war. Internal migrations required explicit permission from the provincial governments, which were particularly restrictive in the archipelagos. After 1955 these policies were abandoned once the regime achieved internal security, the Spanish economy recovered to pre-war levels and gained international recognition (Díaz, Reference Díaz2020).
Thus, provincial unemployment and the size of the agricultural sector explain that the attraction of local labour differed sharply between tourism regions. Two groups of tourist destinations can be described as shaped by the role of migrant workers in their labour markets (Table 6). Firstly, areas characterised by the low attraction of local labour. In these regions, natives mostly filled intermediate and skilled occupations in the hospitality and tourism-related sectors. The bottom of the income distribution was occupied by migrant labour from other provinces of Spain, mainly southern Spain. The combination of long-distance interior migration, local housing shortages and high levels of seasonality resulted in a significant share of circular migrants and workers having to receive accommodation from the firms. This was the case of the Balearic Islands, Costa Blanca (Alicante) and coastal Catalonia (Duocastella, Reference Duocastella1969; Barbaza, Reference Barbaza1988; Valero, Reference Valero1991).
Indicators of the capacity of attraction of local labour by province
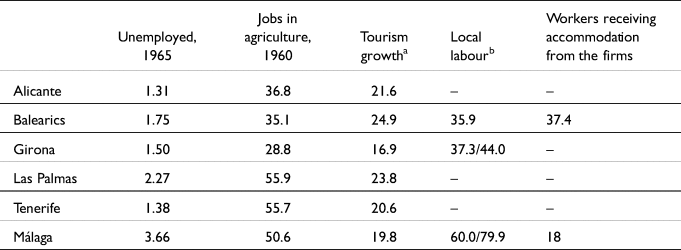
Source: Unemployment in 1965 from Fundación BBVA (2007). Jobs in agriculture in 1960 from Fundación BBV (1999).
a Compound annual growth rate of the number of hotel beds between 1955 and 1973. Girona shows the share of natives and all Catalans in services in the main tourism municipalities of Costa Brava. Málaga reports natives in the hospitality industry in 1975 and Andalusians in 1970.
b Data on local labour in Balearics from the Census of the Balearic Tourism Industry of 1969; Girona in 1967 from Duocastella (Reference Duocastella1969); Málaga in 1975 from Galán et al. (Reference Galán, Martín, Ruiz and Mandly1977) and in 1970 from Fuster (Reference Fuster1971).
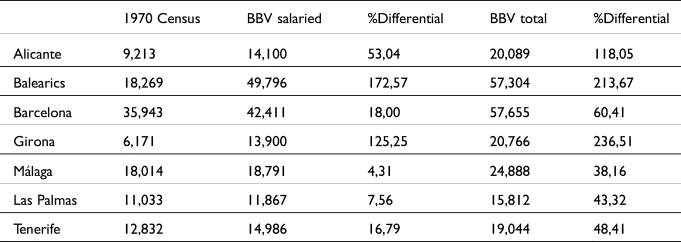
Conversely, the Costa del Sol and the Canary Islands experienced a process of labour market formation mainly based on their own provincial or regional workforce. Unlike the previous model, while the top of the income distribution in these labour markets was formed by foreign workers from northern European countries, migrants from other regions of Spain, and urban natives, the bottom mainly comprised natives and provincial internal migrants (Galán et al., Reference Galán, Martín, Ruiz and Mandly1977; Márquez, Reference Márquez2018). As a result, in Málaga and the Canary Islands, the predominance of short-distance migration and lower tourism seasonality, since in these areas, and especially in the Canary Islands, the tourism season was much longer, resulted in a lower share of circular migrants and workers receiving accommodation from the firms. For example, while the percentual variation of labour between the 1970 Census and the annual average in Girona was 236%, in the Canary Islands the figure was only 43–48% (see Table 6 and Table 11 in the Appendix).
Studies developed between 1970 and 1976 showed that only 20–30% of the workers in the Costa del Sol were from outside the province of Málaga, mostly from Andalucia, while 15% of skilled workers and managers were native-born (Fuster, Reference Fuster1971; Galán et al., Reference Galán, Martín, Ruiz and Mandly1977). The lack of qualified workers in the region and the considerable role of investors from northern Spain, mostly Catalonia, Valencia, the Basque Country and Madrid (Cirer-Costa, Reference Cirer-Costa2014), meant that a significant share of skilled workers was imported from these regions (Pack, Reference Pack2009). Similarly, migration from mainland Spain was low and comprised a considerable percentage of skilled workers in the Canary Islands (Table 1 and Díaz, Reference Díaz1990).
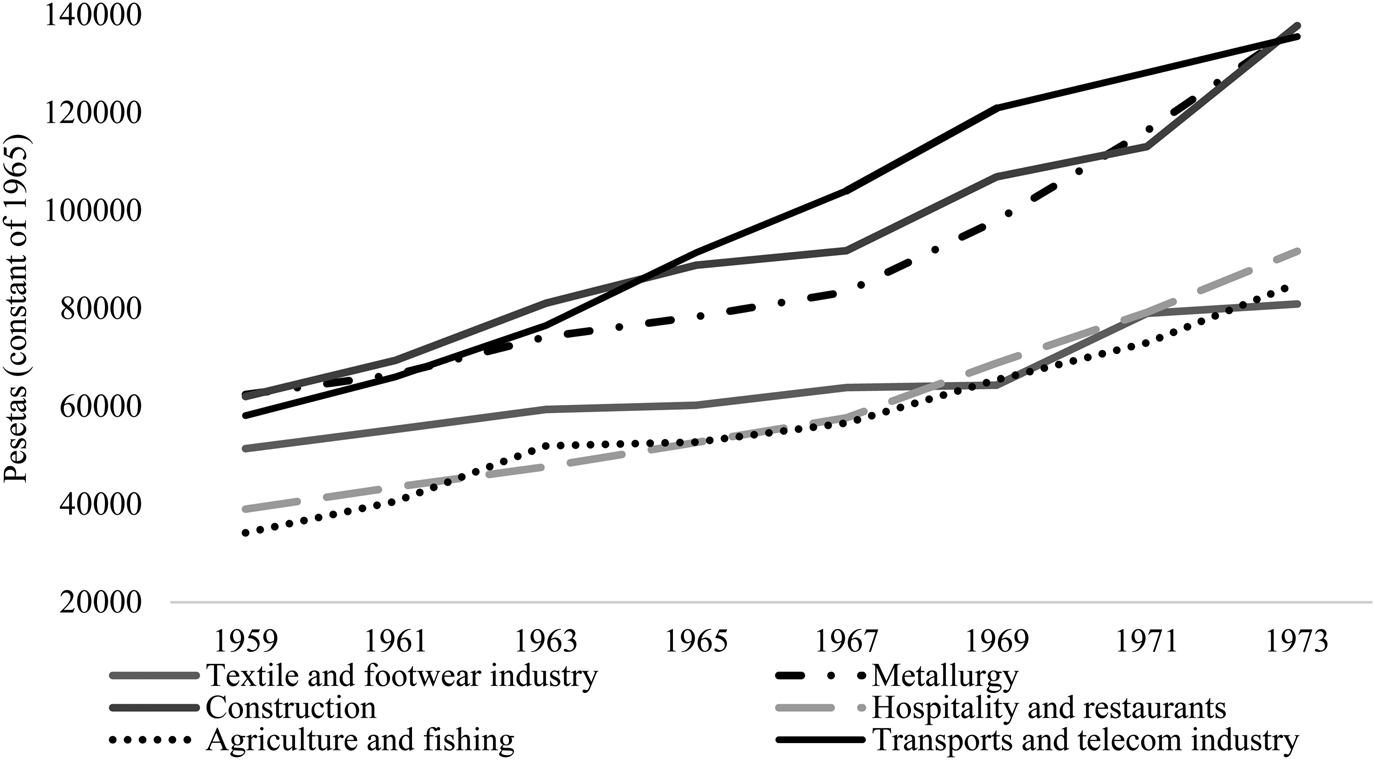
An in-depth analysis of the case of the Balearic Islands can depict the importance of the spillover effects in playing an essential role in the level of attraction of local labour. The growth of tourism expenditure in the archipelago increased the number of workers in industries and services interrelated with the tourism industry. Sectors such as construction, transport and telecom, and ancillary industries like carpentry and plumbing, metallurgy or real estate and banking offered numerous better-paid job vacancies (Figure 2). The spillover effects of this growth were crucial in increasing the economic constraints to attract and retain local workers. As contemporary observers summarised, tourism growth undermined the recruitment capacity of the local workforce by the hospitality industryFootnote 1.
Aside from the differential wages, seasonality of the jobs and labour conditions were other factors that undermined the attractiveness of the job vacancies in tourism occupations, particularly hospitality, in comparative terms. Contemporaries often described how in the Balearics and similar regions such as Catalonia, seasonality and hard work were increasingly negatively valued among the native population (Duocastella, Reference Duocastella1969; Economía Balear, 1970a). As Figure 3 shows, most occupations in the hospitality industry registered rates of temporary contracts that reached 70% of total contracts, while skilled jobs registered 40% of the total. Meanwhile, indirect jobs created by the tourism expansion offered higher job stability. Thus, for example, travel agencies only reached 2.5% of temporary contracts in 1969. The growth in management tasks related to the supply chain of tourism, which would potentially register similar labour stability, and tourism-driven industries should negatively affect hospitality's capacity to attract local labour. Besides, in the case of migration within the archipelago, firms could offer accommodation to their workers. However, as explained in more depth below, the accommodation provided by the firms was very precarious in most cases.
Employment situation in hospitality and restaurants in the Balearic Islands by occupational category in 1969.
Source: Census of the Balearic Tourism Industry of 1969.
Note: Share of temporary contracts includes a total of 6,754 individuals reporting the typology of their contracts. Turnover data pertain to a sample of 4,157 individuals reporting seniority and years of labour experience.
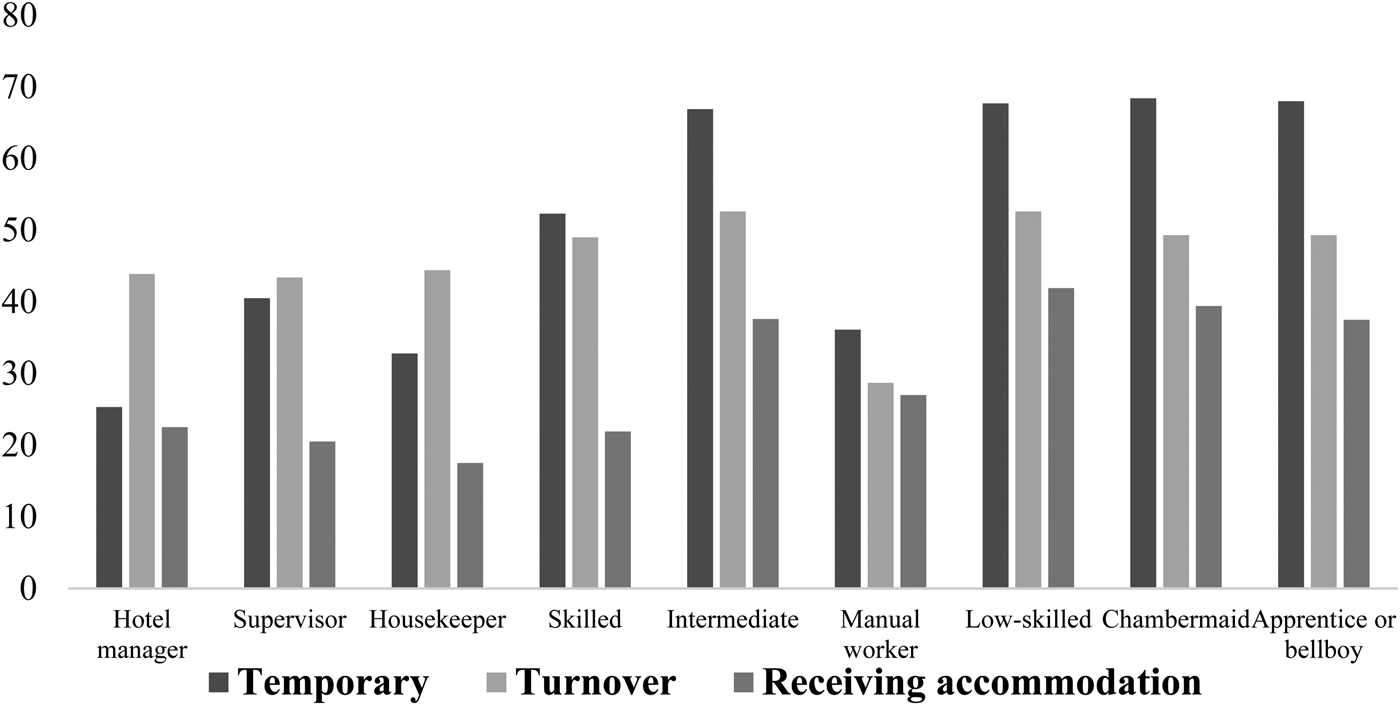
Firms also faced high labour turnover among skilled staff. As seen in Figure 3, labour turnover rates, defined as the share of workers who had moved to another firm within the last two years, reached 40% in all occupational categories. The high atomisation of the tourism firm structure triggered incentives to recruit workers almost at any cost, particularly among qualified employees (García-Barrero and Manera, Reference García-Barrero and Manera2021). Contemporary regional planners explained this pattern in the Balearic Employer's Association newspaper (Economía Balear, 1970b, p. 23):
“In the middle of the tourism season, once implemented the regular mechanisms of labour recruitment (…) the diverse firms without category distinction compete among themselves to attract the labour force to fill their vacancies, a recruitment process which often involves offering higher remunerations, usually considerably superior to those earned in other tourism destinations of mainland Spain where the tourism industry is less dynamic”.
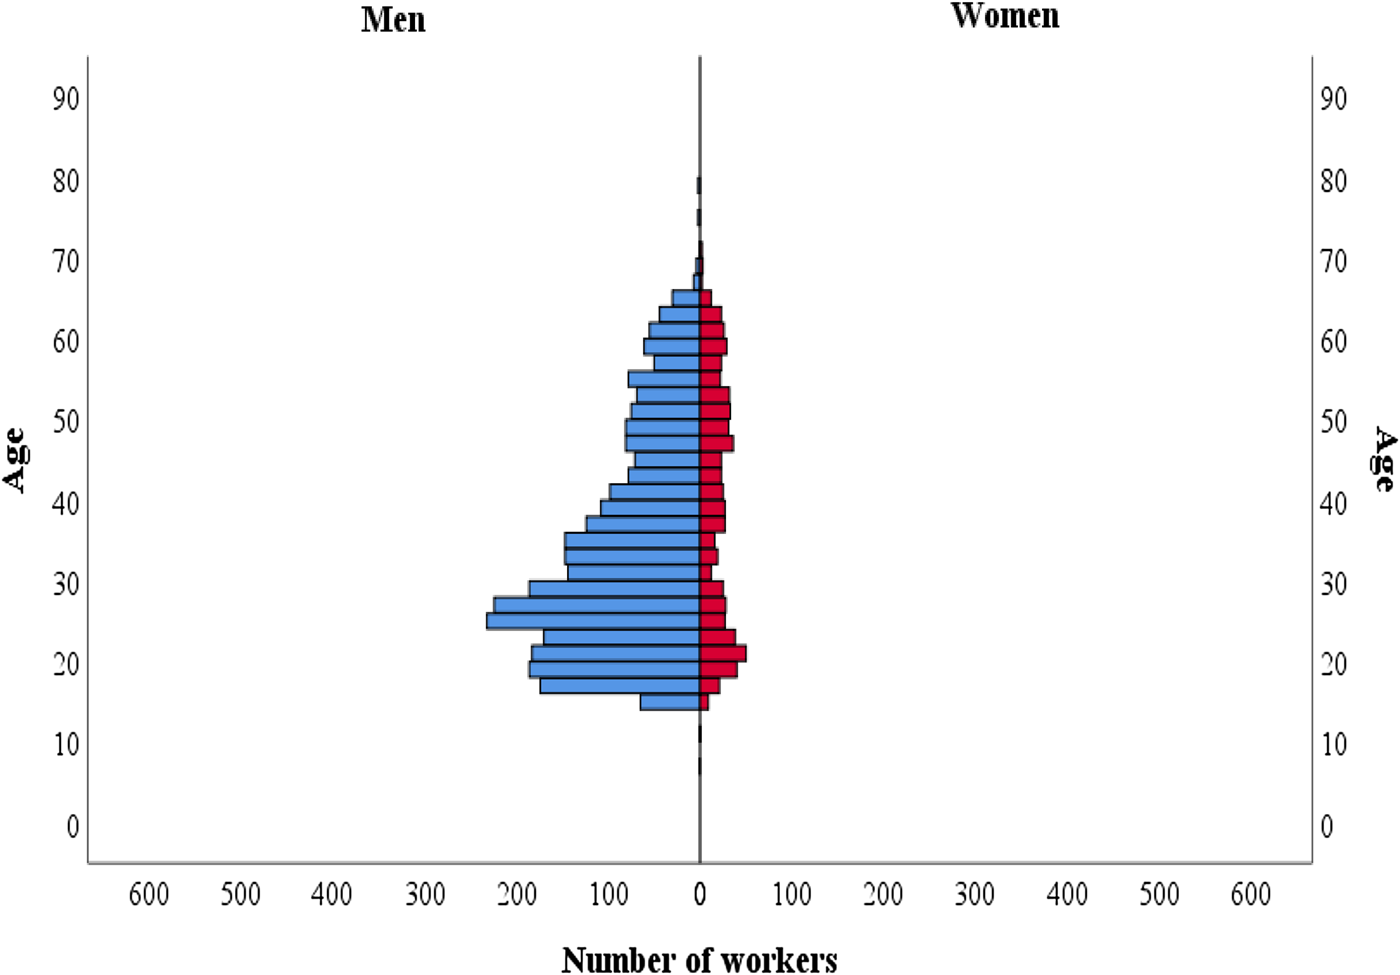
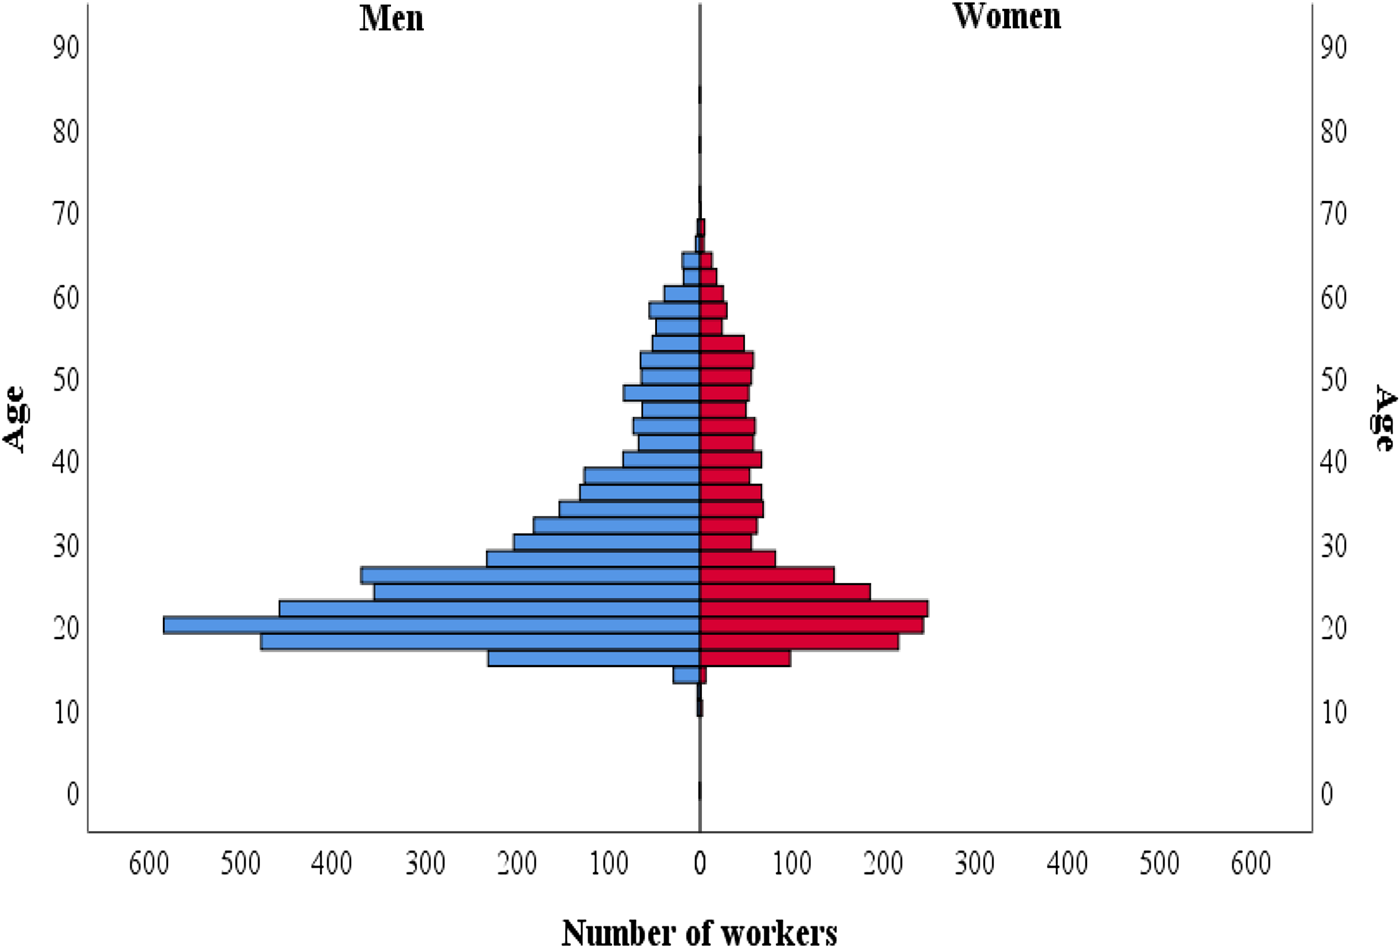
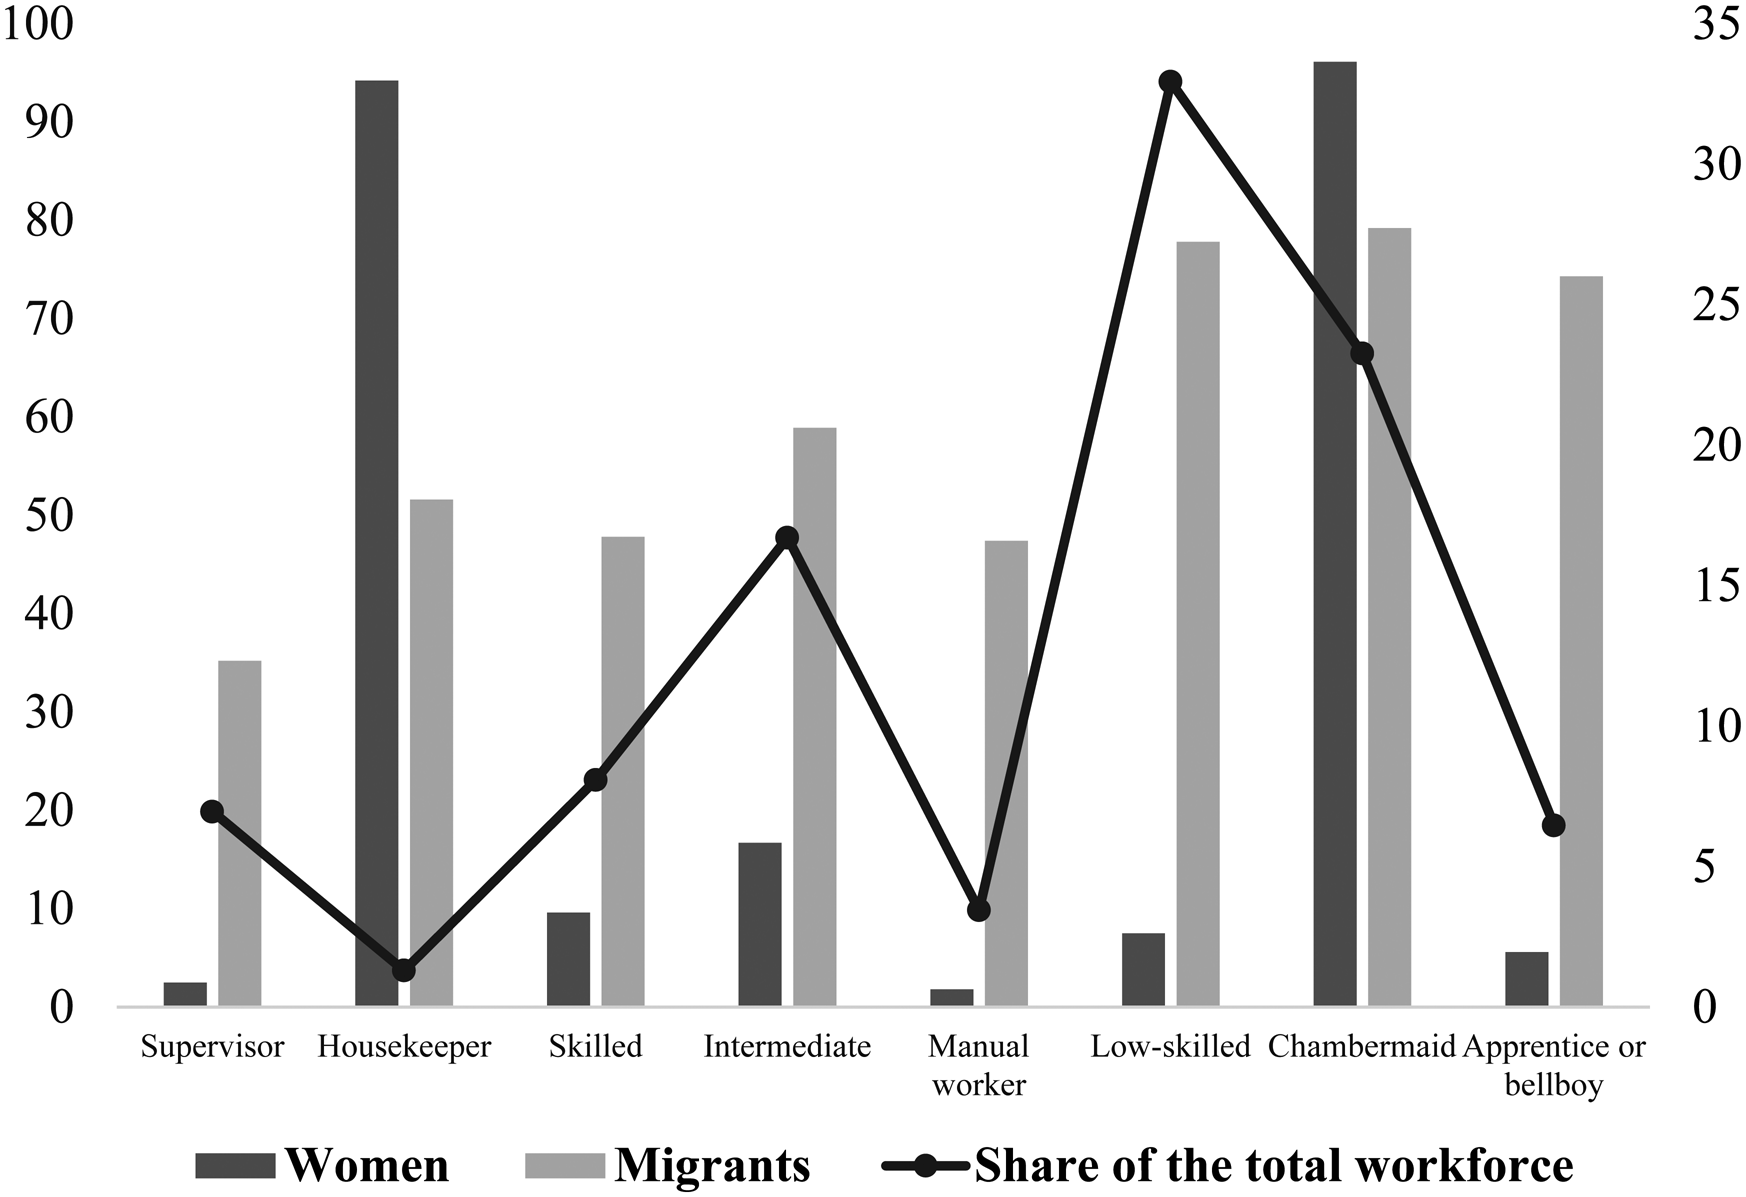
As a result, the composition of the workforce of the main sectors of the tourism industry was characterised by the large share of non-native workers born in mainland Spain (Figures 4 and 5). These figures also show that the sector suffered a particular lack of attraction among young locals and women. Thus, natives and qualified long-term permanent migrants with higher reservation wages than recent migrants entered or were ultimately promoted into intermediate and well-paid tourism occupations where seasonality was lower or higher wages compensated for seasonality (Figure 6). For instance, the share of native and north European workers in travel agencies was 67% and 19% in 1969. Similarly, in the public transport company, ATESA, the share of natives reached 80% of the total workforce.
Age and gender among natives in the Balearic Tourism industry in 1969.
Source: Census of the Balearic Tourism Industry of 1969.
Age and gender among non-natives in the Balearic Tourism industry in 1969.
Source: Census of the Balearic Tourism Industry of 1969.
Occupations by place of birth and gender in hospitality and restaurants in the Balearic Islands in 1969 (%).
Source: Census of the Balearic Tourism Industry of 1969.
Therefore, the low number of local workers in the hospitality industry would not only result from the growth of the tourism supply but also be a consequence of the interaction of the tourism expansion with the rest of the economy. Local workers could enter the sector during the beginning of the tourism boom, from 1955 to 1965, or perceive it as a source of contingent jobs but ultimately climb up the occupational ladder or move out from core tourism activities.
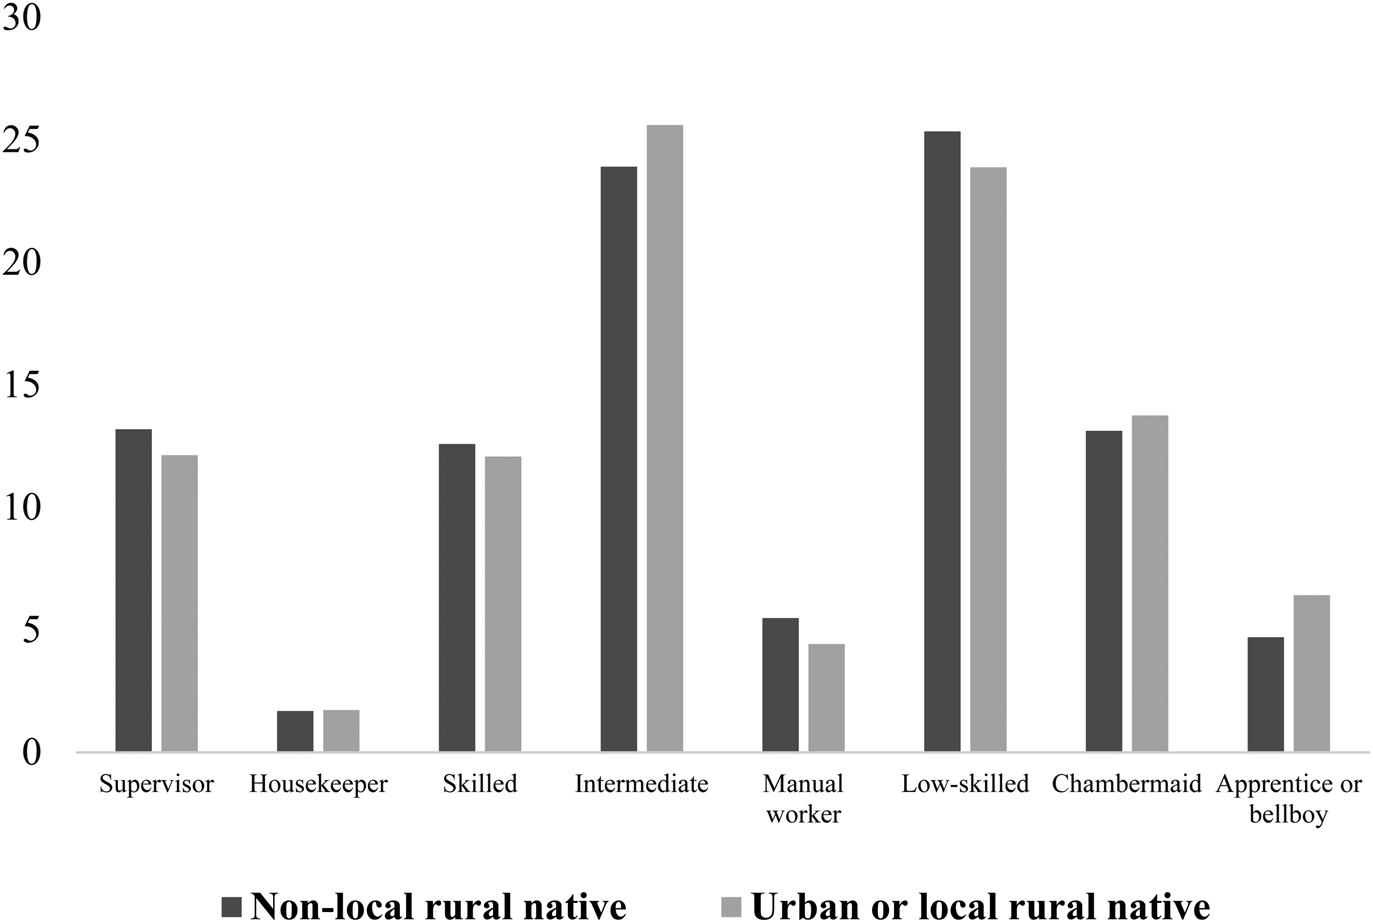
The intense process of structural change also pushed the migration of natives from rural areas to tourist destinations and the capital city. By 1981, 24.6% of natives lived in a different municipality from where they were born, a total of 118,489 individuals. However, in contrast with the previous patterns, few occupational differences are found among natives regarding their origin. In Figure 7, I depict the occupational distribution of natives in the tourism industry for 1969. It differentiates non-local rural natives; rural natives who were not born in the municipality of their workplace, and urban or rural natives; urban natives or rural natives born in the municipality of their workplace. The results suggest that native rural migrants had very low penalisation in their access to jobs when they migrated to tourism areas. Both groups were sorted into middle or well-paid occupations, comprising a total of 51% of natives who were in these jobs. Similarly, only 25–23% were low-skilled, and 18–19% were women.
Occupations of natives regarding their place of birth in hospitality and restaurants in the Balearic Islands in 1969 (%).
Source: Census of the Balearic Tourism Industry of 1969.
According to contemporaries, the period was characterised by the rapid upward mobility of workers and labour turnover as the tourism industry increased dramatically (Homs, Reference Homs1987). However, these observed wage and occupational gaps depict the differential capacity of the different groups to take advantage of the process of rapid structural change. The descriptive analysis suggests that natives and most migrants did not behave as perfect substitutes in the labour market. Instead, natives and migrants were sorted into different occupational scales. Thus, once the capacity of recruitment of local labour and labour market outcomes is studied, we will focus on how tourism agents solved this issue and shaped a specific labour market structure.
6. Circular migrant labour and inequality
6.1. The development of circular migratory networks
The dramatic growth of the tourism sector posed considerable economic constraints for firms wanting to keep exploitation costs low. In this context, different mechanisms contributed to a more efficient trade-off between supply and demand. On the one hand, private recruitment agencies, acting as intermediaries between employers and workers and competing with the public recruitment agency, are documented in the province despite being illegal according to the labour legal corpus of the dictatorial regime (Delegación Provincial de Sindicatos de Baleares, 1965). On the other hand, firms developed active recruitment practices to seek workers and hire them in mainland Spain and foreign countries, establishing networks of circular migration (García-Barrero and Manera, Reference García-Barrero and Manera2021)Footnote 2. Besides, employers and groups of migrants facilitated means of transport to reduce migration costs by, for example, arranging bus lines (González, Reference González2017; Servera, Reference Servera2021)Footnote 3.
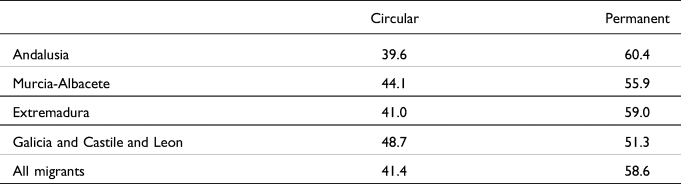
Given the low attraction of local labour, tourism growth had to rely on the availability and labour costs in some regions of mainland Spain. The core role of the low-wage occupations from the hospitality industry made the capacity to fill these vacancies essential for the overall expansion of the tourism industry and tourism-driven activities. In this regard, circular migrant labour played a crucial role in shaping the level of tourism development. Although circular migration became a significant share of the workforce in all the tourist regions, in the Balearic Islands, coastal Catalonia and Alicante, these migrations became essential, triggering a selective transition in which migrants moved from circular to permanent migrationFootnote 4.
In the case of the Balearic Islands, Table 7 shows that among migrants with at least one year of labour experience in hospitality and restaurants, around 40% were circular migrants in 1969Footnote 5.
Migration status by place of origin in hospitality and restaurants in the Balearic Islands, 1969
Source: Census of the Balearic Tourism Industry of 1969.
Note: Circular corresponds to workers with at least one year of labour experience reporting an address outside the Balearics or receiving accommodation from the employer. Permanent corresponds to workers with at least one year of labour experience reporting an address in the Balearic Islands. Due to the lack of data in some variables, it corresponds to 6,534 observations.
In a similar vein, experts on Balearic tourism noted in 1973 that the impact of circular migrants was significant (AHRM, Sindicats, box 392b):
“In the hospitality sector, 64% of workers are non-resident migrants who at the same time represent a total of 22.4% of the total active population in the archipelago. This non-resident population is the highest among all the Spanish provinces in absolute and relative terms and earns 15.3% of the total salaried earnings of the provincial service sector […]. In previous years this gap was absorbed by the return of these circular migrants to their places of origin and by the mobility of the rest to the construction sector”.
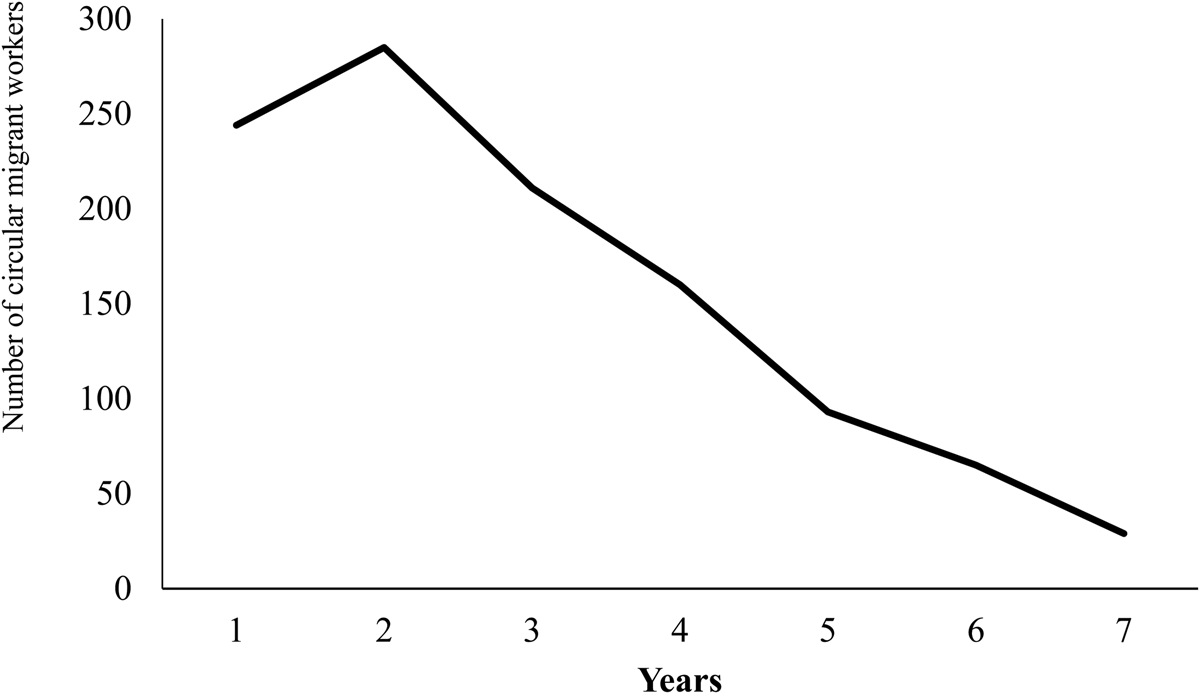
As these experts explained, the transition from circular to permanent migrant was far from immediate. By 1969, most circular migrants had accomplished between 2 and 4 years of cyclical migration, while a few migrants were still circular after more than five years (Figure 8).
Survival curve among circular workers from mainland Spain in hospitality and restaurants in the Balearic Islands, 1969.
Source: Census of the Balearic Tourism Industry of 1969. Due to the lack of data in some variables, it corresponds to 6,534 observations.
For those willing to remain in the archipelago, substantial obstacles arose. Firstly, most of the labour demand was seasonal, forcing migrants to deal with a lack of job opportunities in the winter. Moreover, the mentioned lack of adequate measures to alleviate this scenario by the dictatorship, related to labour regulation, unemployment subsidies and housing provision, constrained the permanent settlement of migrants in most of these regions. In this context, in most tourism destinations, the construction sector and related subsectors became the main occupational path for those wanting to settle permanently. The construction of the tourism infrastructure during the rest of the year provided accessible jobs outside the summer season that helped them establish permanent residence. However, in cases such as the Balearic Islands, this sector offered fewer jobs in comparison to the hospitality industry, creating an excess of labour supply among those who attempted to settle in the host regions (Barbaza, Reference Barbaza1988; Ruiz, Reference Ruiz1999; Consell Econòmic i Social de les Illes Balears, 2003)Footnote 6.
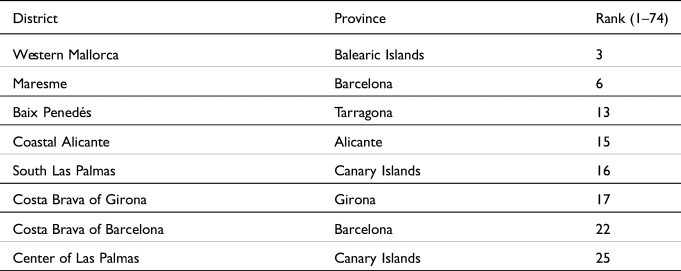
Secondly, the massive transformation of the tourism infrastructure and local land uses, often in relatively isolated and low-populated areas lacking essential public services, led to significant housing shortages. According to my estimates, most tourist destinations of coastal Catalonia, Alicante, Las Palmas, and the western region of Mallorca were among the recipient areas with the highest housing deficit per capita in Spain in 1962 (Table 8). These results are even more significant since housing shortages would intensify during the high season with the arrival of short and long-distance migrants to work in these districts.
Housing deficit per capita among districts of the main recipient provinces, 1962 (main tourism destinations)
Source: CPDES (1963).
Note: I included as a recipient province, all districts from Asturias, Balearic Islands, Catalonia, Euskadi, Madrid, Navarra and Valencian Autonomous Community. The Canary Islands is included due to intense migration within the region associated with tourism registered during the period. I could not include Bilbao due to a lack of data.
The intense population growth of tourism areas after 1962 suggests that this issue was not resolved but increased its incidence and expanded to other tourism districts during the period. Reports of the provincial government in the Balearic Islands in 1967 noted that these problems not only affected migrants but were among the main concerns of the total population (Ginard, Reference Ginard1998). As regional planners claimed in 1966 and contemporary anecdotal evidence also pointed out for the Balearic Islands, Catalonia and the Canary Islands (Duocastella, Reference Duocastella1969; Márquez, Reference Márquez2018), housing shortages were an additional element that hindered the transition from circular to permanent migration (Ginard, Reference Ginard1998, pp. 59–60)Footnote 7:
“Probably, more than half of the workers from mainland Spain and the Canary Islands are circular migrants between April and October, returning to their places of origin and facing severe accommodation problems. However, this problematic scenario becomes more critical when these migrants attempt to settle permanently in the province, due to the serious housing shortage”.
Employers responded to problems of housing that could undermine the attraction of migrant labour by providing accommodation for their workers. Anecdotal evidence points out that these practices were shared in all touristic destinations of the Mediterranean basin (Duocastella, Reference Duocastella1969; Fuster, Reference Fuster1971; Valero, Reference Valero1991). In the Balearic Islands, our data provide empirical evidence showing that they represented almost half of the migrant workers and were significant across the archipelago. This phenomenon was particularly intense in low-populated areas experiencing intense tourism growth (Figure 9).
Share of non-native workers receiving accommodation in 1969 and work incidences in hospitality and restaurants in the Balearic Islands.
Source: Census of the Balearic Tourism Industry of 1969; Labour inspection of the hospitality industry of 1972: (AHRM, Govern Civil, box 1993).
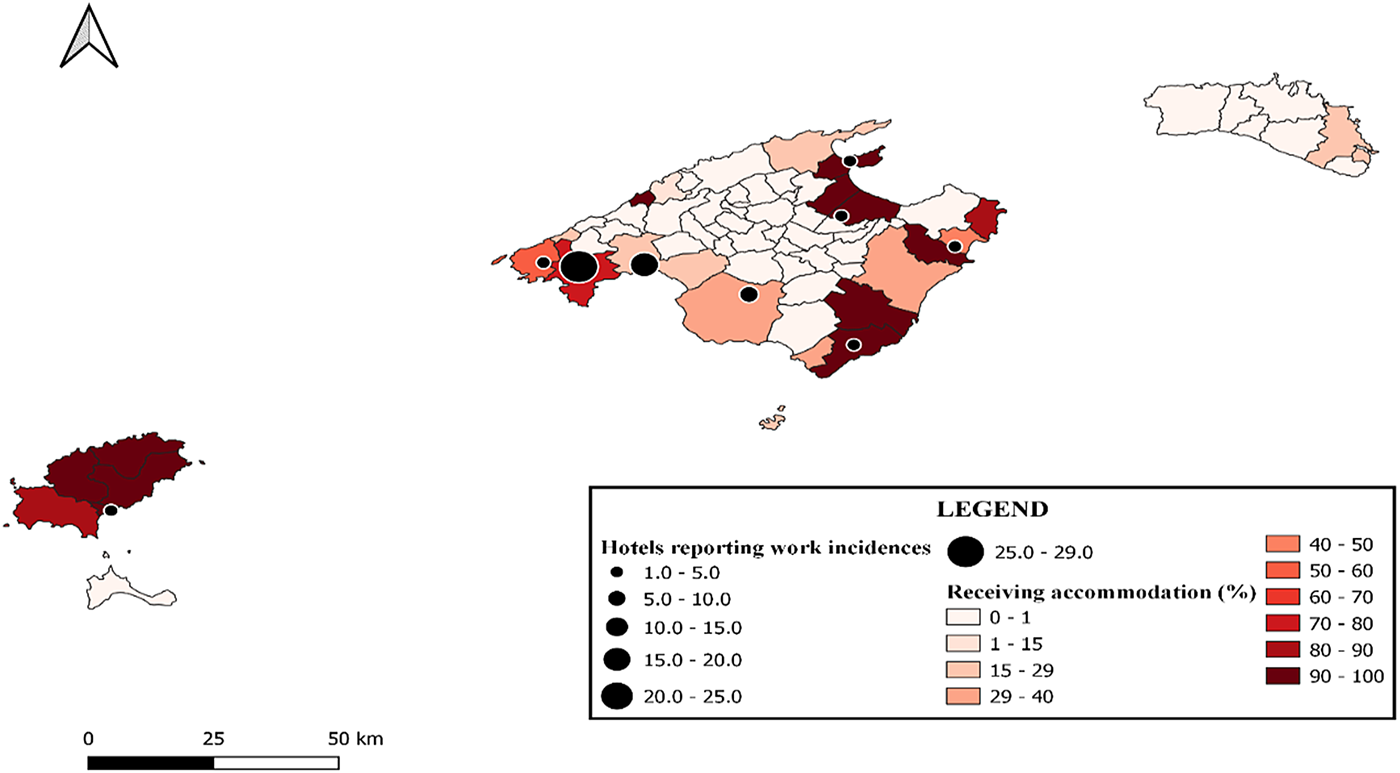
Numerous qualitative and quantitative data point out the precarious conditions of the accommodation provided by the employers. According to one labour inspection conducted in 1972, most migrants lived in insalubrious and overcrowded places in hotel basements or improvised rooms. Inspectors detected these precarious living conditions regardless of hotel or hostel category and tourism area, except for luxury hotels (Figure 9)Footnote 8, Footnote 9.
6.2. Circular migration and labour market inequality
Several pieces of evidence support the idea that circular migrants arriving in the Balearics behaved as noted by theoretical and empirical research on temporary and circular migrations. For example, contemporaries observed that circular migration exerted a cushioning effect on host labour markets. Thus, when the oil crisis started to impact tourism demand in 1974, some contemporaries remarked that unemployment levels were lower than expected because most of the circular migrants stayed in their areas of origin. Due to the decline in labour demand, firms stopped calling them for work at the beginning of the summer season. The networks of circular migration created by the firms and the migrants themselves during the previous decade behaved as a flexible mechanism of labour supply (Consell Econòmic i Social de les Illes Balears, 2003). Oral testimonies from the areas of origin also suggested the same labour market behaviour, remarking that although circular migration to the Balearics and recruitment at origin had been substantial, it had declined with the start of the economic crisis increasing unemployment in the districts of origin (Lara, Reference Lara1977).
Contemporaries also noted that circular migrants were more prone to prioritise their areas of origin in economic and socio-political terms than other migrants. They reduced consumption at the destination and were particularly willing to send remittances to their relatives (Duocastella, Reference Duocastella1969). More significantly, they maintained their socio-political duties in their areas of origin. In this regard, reports and oral testimonies show that the circularity of the migration constrained the formation of a tourism-related working-class movement. The Communist party and the main clandestine Spanish union, Comisiones Obreras, saw how most of their newly recruited members often returned to their places of origin at the end of the season. Besides, they regretted that these migrants had little interest in local politics and prioritised leisure after work (Ginard, Reference Ginard1998; Arxiu Històric de CC.OO. Illes Balears, Serveis, box 4)Footnote 10.
Similarly, as Table 9 suggests, circular migrants experienced lower income growth than their permanent counterparts with the same number of years of labour experience. Although the data cover different cohorts, these results could also highlight that the income gap between the two groups widened as more years were spent in the labour market. Therefore, the massive arrival of circular migration could have consequences on the degree of substitutability with natives and levels of labour market inequality.
Males' average wage by migrant status in 1973 (migrants from southern Spain and Galicia)
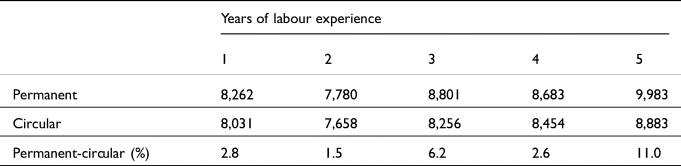
Source: Information about occupations: Census of the Balearic Tourism Industry of 1969; information about wages from Provincial Labour Agreements of 1973 (Gobierno Civil de Baleares, 1973) weighted using the reported real wages and average tips from 157 workers provided by Gaviria et al. (Reference Gaviria, Iribas, Monterde, Sabbah, Sanz and Udina1974).
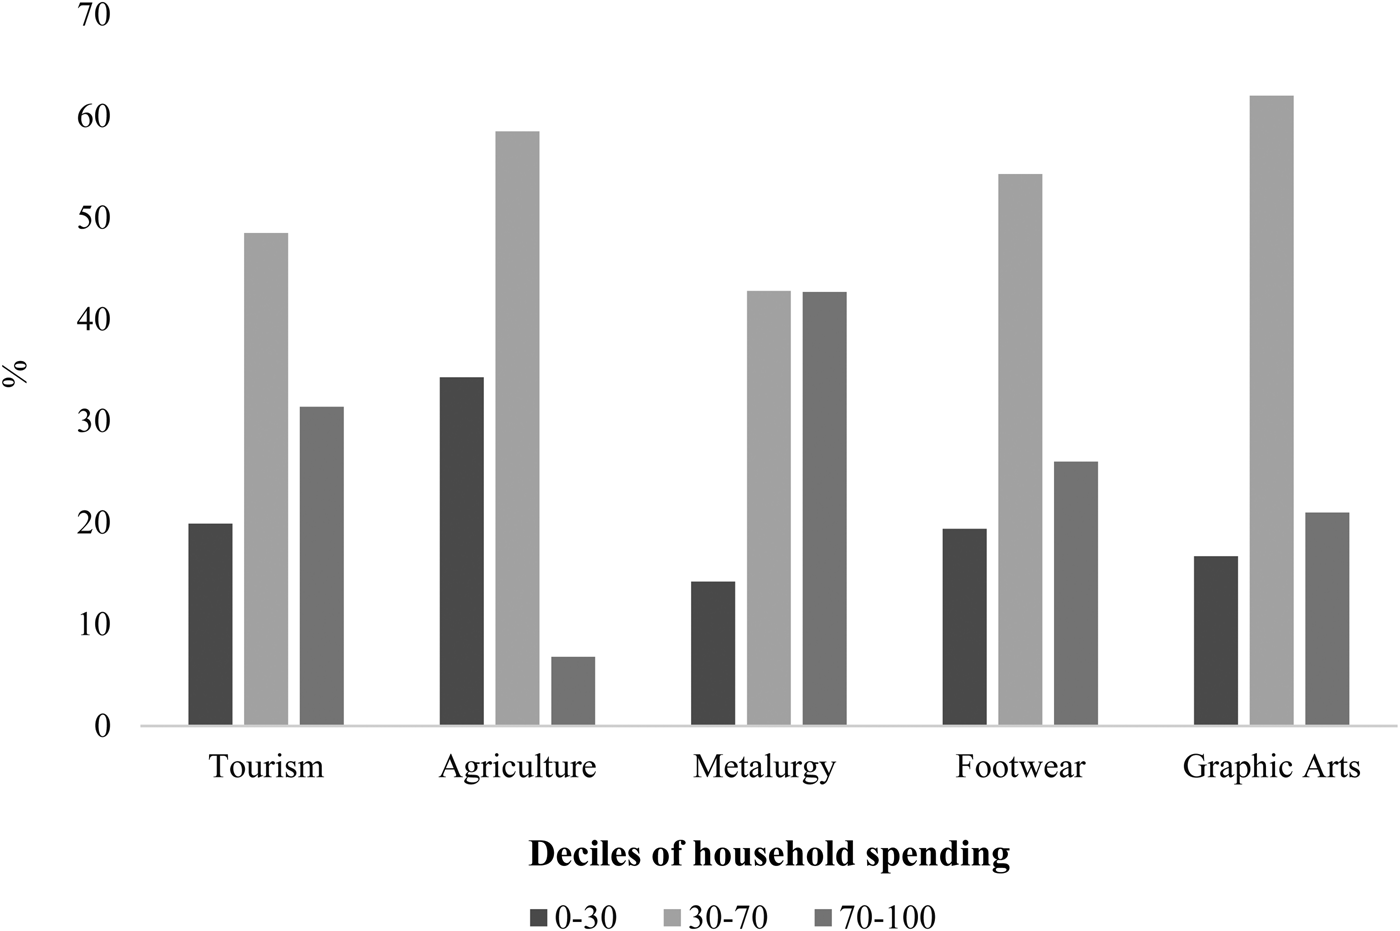
Analysing the structure of the labour market from a broader perspective can contribute to a better understanding of the impact of circular migration on the labour market. In Figure 10, I focus on this issue by showing the distribution of household spending in the Balearics in 1973 by the occupation of the head of the household. It shows that the tourism labour market was the most unequal within the provincial economy. Concretely, it shows that those households where the head of the household worked in the hospitality industry registered a lower share of middle incomes and a considerable percentage of workers in the bottom and top deciles. If we consider the potential underreporting of circular and other permanent migrants, the actual rate of inequality among households could have been even higher.
Distribution of the reported household annual spending in deciles by the occupation of the head of the household in 1973–1974 (%).
Source: INE. Spanish household budget survey of 1973–1973.
Note: Household spending was weighted using the number of working members of each household.
Indeed, although other factors operated during the period, the permanent establishment of this volatile migrant population after the 1973 oil crisis coincides with the increasing inequality of the overall host society. As we can observe in Table 10, the Balearic Islands was the region which registered the higher GINI increase between 1973 and 1981, becoming the second province in the country in terms of social inequality. Given the observed similarities, an analogous dynamic could have operated in tourism districts from other regions reliant on circular migration, such as Catalonia or Alicante.
Gini index in 1973/74 and 1980/81 among provinces with higher inequality in 1980–81 in Spain
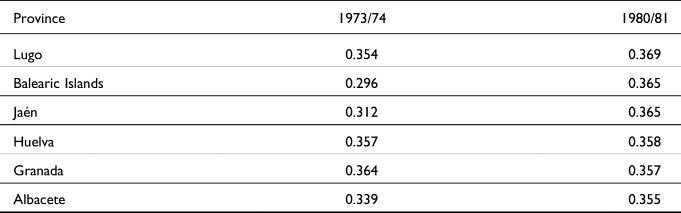
Source: Goerlich and Mas (Reference Goerlich and Mas2002).
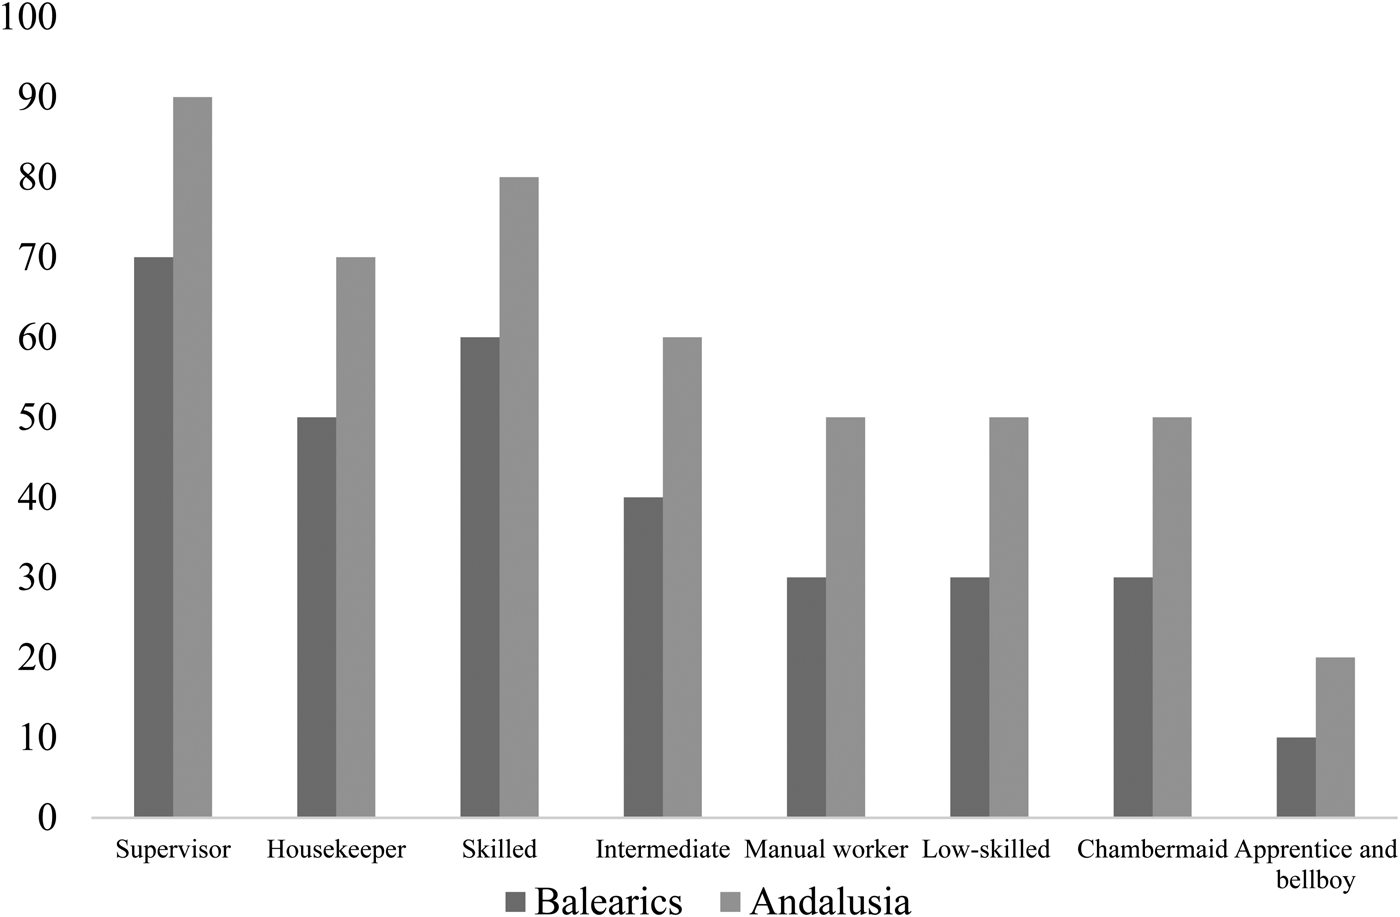
The inequality observed in the previous figure can be analysed more deeply by looking at the internal structure of the labour market. As Figures 11 and 12 suggest, the labour market was very unequal. Managers and supervisors, mostly comprised of natives and European foreigners, could earn wages that reached top income deciles of the regional labour market. For example, the average wages earned by the supervisors were in the 70% decile of the income distribution of the Balearic Islands and 90% in Andalusia, one of the main source regions. Conversely, most migrant workers could earn wages equivalent to lower incomes in the host region. Thus, a low-skilled worker earned, on average, the equivalent of the 30% decile of the income distribution in the Balearic Islands and the middle average income in Andalusia.
Monthly wages in deciles by main occupational categories within the provincial income distribution in the Balearic Islands and Andalusia in 1973.
Source: Information about occupations in the Census of the Balearic Tourism Industry of 1969; information about wages from Provincial Labour Agreements of 1973 (Gobierno Civil de Baleares, 1973) weighted using reported real wages and average tips from 157 workers provided by Gaviria et al. (Reference Gaviria, Iribas, Monterde, Sabbah, Sanz and Udina1974). Household budgets and provincial average earnings from INE. Spanish household budget survey of 1973–1973 was weighted using the ratios provided by Torregrosa-Hetland (Reference Torregrosa-Hetland2015).
Monthly wages in deciles by main occupational categories within the mode of household spending in the Balearic Islands and Andalusia in 1973.
Source: See Figure 11.
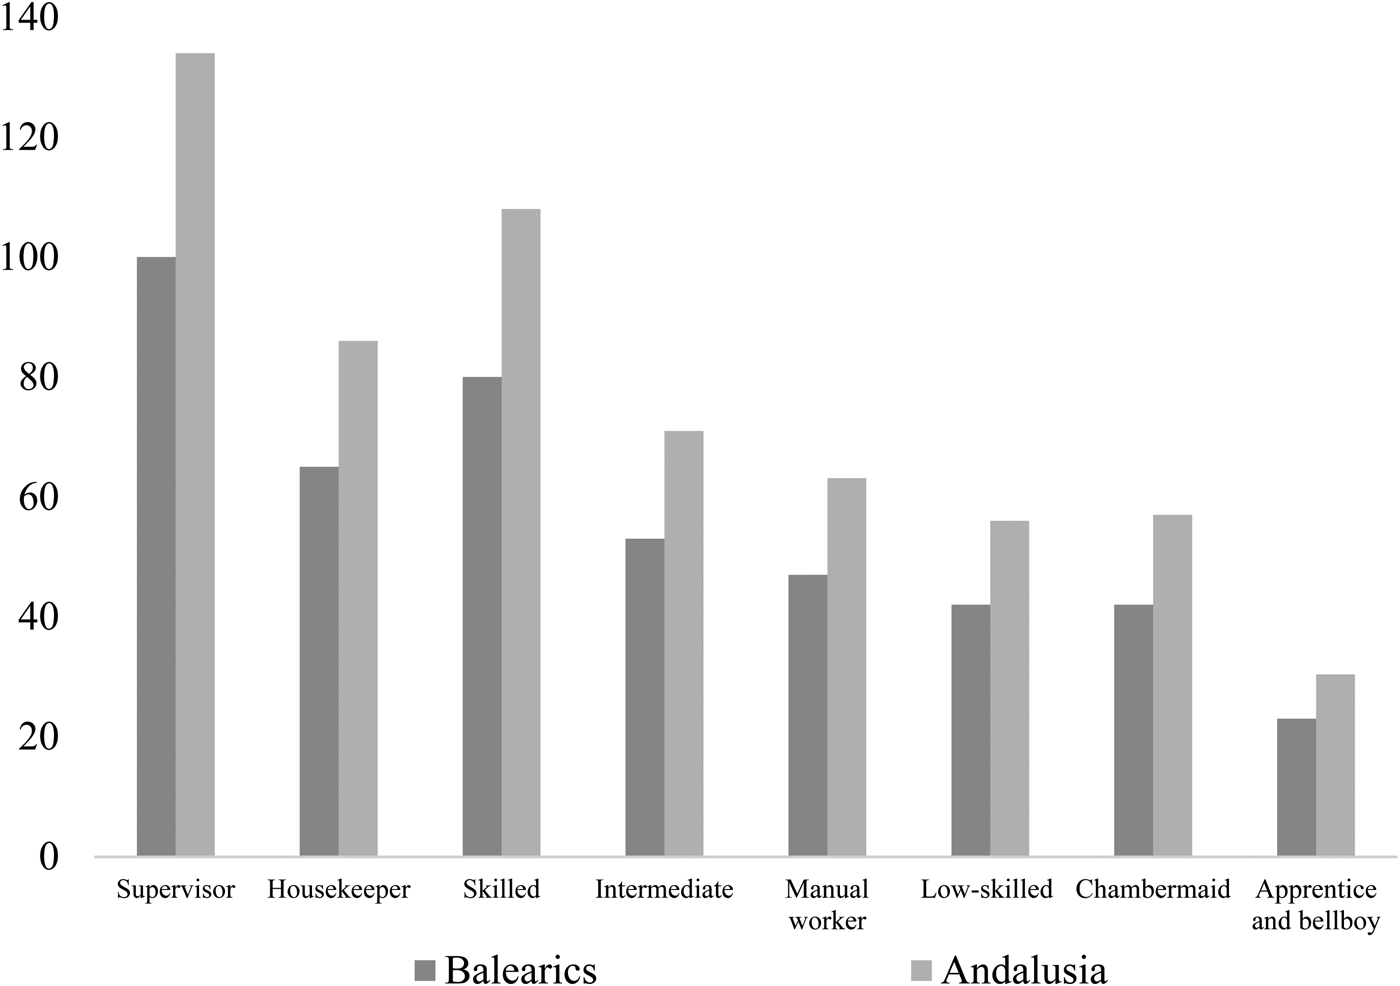
Although most migrants were at the bottom of the host-income distribution, they earned considerably higher wages compared to those in their areas of origin. Thus, wages earned on the Balearic Islands by a low-skilled Andalusian worker represented 56% of the mode of monthly household expenditure in Andalusia. Thereby, if a household had three members in the sector, one as a middle-income worker and two sons as low-income workers, they would earn, on average, the equivalent of 174% of the mode of housing expenditure in Andalusia (Figure 12).
These results are consistent with the triple-win theory of circular migration applied to the case of the two agents studied: migrants and host society (Constant et al., Reference Constant, Nottmeyer, Zimmermann, Zimmermann and Constant2013). Circular migrants behaved as a flexible labour force that exerted two main effects on the host labour markets. Firstly, by alleviating labour costs, they helped firms expand their production and tourism infrastructure, increasing the number of relatively well-paid occupations in the tourism sector and tourism-driven economy. Secondly, as a result, natives, qualified and long-term migrants, benefited from lower labour market competition and higher access to these new job opportunities.
This dynamic would explain why some occupations in the hospitality industry were in the top earnings percentiles of the labour market. Contemporary reports highlighted this issue by showing that skilled natives and migrants benefited from this dynamic by having higher market power. According to these authors, these groups of workers were always in an “auction” of their labour and managed to climb up the occupational ladder very quickly. Regional social planners often regretted that “this workforce that lacked any formal preparation turns increasingly more expensive, while the qualified workers continue in an auction of their wages” (Sindicato Provincial de Hostelería y Actividades Turísticas de Baleares, 1967, p. 3). In a similar vein, they remarked that (Sindicato Provincial de Hostelería y Actividades Turísticas de Baleares, 1970, p. 26):
“Firms have no other option than rewarding their qualified workers, e.g. workers at the top of the occupational hierarchy. […] As far as firms are increasing their dimension, family workers are losing their relative weight in the payroll. Therefore, qualified and trusted workers have to be retained at any cost and with certain incentives”.
Therefore, this process could imply an increase in local labour market inequality and social inequality by the interaction of two mentioned factors: firstly, by the effect of the lower competition and high skill premium for natives and long-term migrants in a period of rapid structural change. Secondly, through the downward wage pressure at the bottom by the influx of circular migrants with lower reservation wages than natives and permanent migrants.
7. Conclusions
This paper has explored the process of labour market formation in the Spanish tourism industry. Results show that this process shaped a labour-intensive labour market with a limited capacity to attract local labour. This implied distinct paths of labour market formation. Under this model, interprovincial migration became essential for tourism growth in more developed regions where industry and services were significant. Natives and foreign workers from northern European countries filled intermediate and skilled occupations, while the most numerous, those offering low incomes, were occupied mainly by migrants from southern Spain. However, in regions where agriculture was still significant, firms relied on intra-provincial labour. Native workers occupied most of the jobs in the sector, while migrants from the rest of Spain and northern European countries comprised a considerable share of the well-paid staff. Thus, these regions only became intensive on interprovincial labour and foreign migration in the late ‘80s or early ‘90s.
In regions registering local labour shortages, the characteristics of the intense economic growth posed considerable socio-economic constraints for attracting interprovincial migrants. Tourism areas were adversely affected by housing shortages and seasonality that hampered permanent migration from other provinces. The lack of an adequate legal framework able to alleviate the externalities of the seasonality of labour meant an additional and significant constraint. The different agents of the tourism industry responded to this scenario by implementing a range of strategies to promote circular migration.
The intense arrival of circular migrants had a differential impact on the host labour market and society. Most circular migrants behaved as a flexible labour force that responded to changes in the labour demand, had higher investment preferences in the area of origin and earned lower wages than their permanent counterparts. The impact of circular migration on the host labour market and migrants themselves was consistent with some of the characteristics of the triple-win scenario theory on circular migrations but also with some of the disadvantages and caveats noted by the literature. Circular migrants were imperfect substitutes in production. Thus, natives benefited from higher economic expansion and lower labour market competition. Migrants achieved significant capital accumulation and improved living standards by earning higher wages than in their areas of origin. However, since most of these migrants stayed permanently, socio-economic inequality increased in the host society.
In light of these findings, future research is needed in two key areas. First, this research could contribute to future investigations devoted to the long-term effects of tourism specialisation in the Spanish economy. Three main factors have emerged as potential interrelations to be explored in future research. This historical process allowed the development of a massive low-quality tourism supply which faced considerable difficulties following the oil crisis in adapting to the changes in international markets. Besides, this paper has highlighted the labour-intensive systems established during the labour market formation. Therefore, the continuity of this dynamic may have posed significant obstacles to achieving social cohesion in the long term. In this regard, this paper highlighted the temporary nature of migration as a relevant and often unobserved factor in understanding socio-economic outcomes in tourism economies. Lastly, the intense demographic growth and low income per capita growth experienced during the last decades could indicate the increasing negative externalities of this model over ecological sustainability and social structure.
Second, anecdotal evidence suggests that a share of the income earned by temporary migrants during Spain's rural exodus could have been invested in entrepreneurial projects in the hospitality sector and agro-industrial cooperatives in the municipalities of origin (Lara, Reference Lara1977). Therefore, studies on the impact of circular migration in the source regions and its role in reducing rural depopulation and fostering economic diversification in the medium term would be particularly welcome.
Acknowledgements
I am indebted to Ramón Molina de Dios, Rafael Vallejo Pousada, Blanca Sánchez-Alonso, Javier Silvestre Rodríguez and Vicente Ramos Mir for their help and insightful comments. I am also grateful for the generous funding and support of the project HAR2015-64769-P, funded by the Ministry of Economy and Competitiveness, especially to its principal investigator, Jordi Catalan Vidal. I acknowledge the personal and academic support of my PhD supervisors, Montserrat Llonch Casasnovas and Carles Manera Erbina. Finally, I thank the anonymous reviewers for their valuable feedback and constructive criticism.
Sources and official publications
MINISTERIO DE HACIENDA Y FUNCIÓN PÚBLICA (2023). Bases de datos regionales de la economía española. BD.Mores.
INSTITUTO NACIONAL DE ESTADÍSTICA (2021). Indicadores urbanos. Edición 2021.
IDESCAT (2019). Anuari estarístic de Catalunya.
INSTITUTO NACIONAL DE ESTADÍSTICA (1950–2021). Censo de Población de España. 1950–2020 and Padrón Contínuo de la Población. Enero 2020.
OECD (2008): International Migration Outlook 2008. Paris: OECD Publishing.
ARCHIVO GENERAL DE LA ADMINISTRACIÓN (AGA). Alcalá de Henares.
INSTITUTO NACIONAL DE ESTADÍSTICA. Anuarios Estadísticos de España. 1954–1975.
GOBIERNO CIVIL DE BALEARES (1973): Boletín Oficial de la Provincia de Baleares. Convenio Colectivo de Hostelería, 12 de agosto de 1973.
INSTITUTO NACIONAL DE ESTADÍSTICA (1974): Encuesta de Presupuestos Familiares de 1973–1974.
ARXIU HISTÒRIC DEL REGNE DE MALLORCA (AHRM) Palma.
CPDES. (1975): III Plan de Desarollo Económico y Social.Turismo e Información y Actividades Culturales. Madrid: Imprenta Nacional del Boletín Oficial del Estado.
ARXIU HISTÒRIC DE CC.OO DE LES ILLES BALEARS. Palma.
CONSELL ECONÒMIC I SOCIAL DE LES ILLES BALEARS. (2003): El treball fix discontinu a les Illes Balears. Palma: Govern de les Illes Balears.
ECONOMÍA BALEAR (1970a): “Problemas que nos plantea el turismo en nuestra economía”, March, Palma, pp. 27–28.
ECONOMÍA BALEAR (1970b): “La formación profesional en la Hostelería balear”, December, Palma, pp. 23–25.
DELEGACIÓN PROVINCIAL DE SINDICATOS DE BALEARES (1965): “I Consejo Económico Sindical Insular de Ibiza y Formentera. Boletín Informativo de la Delegación Provincial de Sindicatos de Baleares”. Palma: Organización Sindical de Baleares.
ECONOMÍA BALEAR (1971a): “El activo Alcalde de Ibiza: una gestión diaria”, September, Palma, pp. 30–32.
ECONOMÍA BALEAR (1971b): “La invasión turística ha sido inesperada nos dice el Alcalde de San Antonio”, September, Palma, pp. 41–42.
CPDES. (1963): Anexo al Plan de Desarrollo Económico y Social. 1964–1967. Factores humanos y sociales. Madrid: Imprenta Nacional del Boletín Oficial del Estado.
SINDICATO PROVINCIAL DE HOSTELERÍA Y ACTIVIDADES TURÍSTICAS DE BALEARES (1967): Dossier sobre los problemas de actualidad relacionados con la industria hotelera en Baleares, febrero 1967. Palma: Organización Sindical de Baleares.
SINDICATO PROVINCIAL DE HOSTELERÍA Y ACTIVIDADES TURÍSTICAS DE BALEARES (1970): Análisis socio-económico de la hostelería en Baleares. Palma: Organización Sindical de Baleares.
Appendix
Seasonality of the labour demand in hospitality and restaurants in the main tourism destinations in 1970
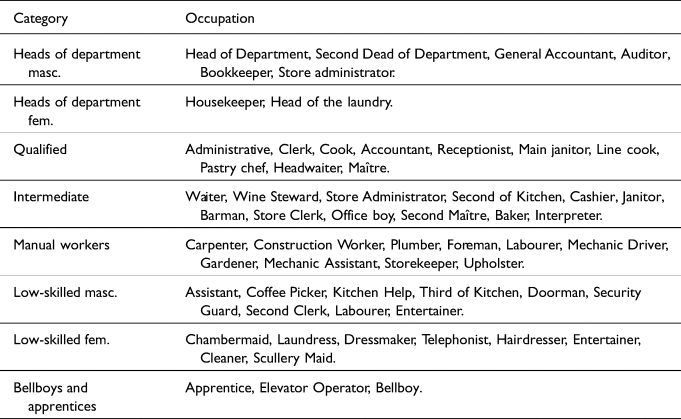
Occupational categories in the labour census of the Balearic tourism sector of 1969 and the labour agreement of august 1973
Wage differentials between the labour agreement of august 1973 in the Balearic Islands and the poll conducted by Gaviria et al., Reference Gaviria, Iribas, Monterde, Sabbah, Sanz and Udina1974 in the summer of 1973 in the Spanish tourism destinations


 Open access