


Introduction
Predictions of snowmelt rate distributions in mountain areas are important not only for water resource development, but also for watershed management. Changes of snowmelt rates with changes in altitude are not marked during mid-melting seasons (Reference Yamada, Nishimura, Suizu and WakahamaYamada and others, 1978; Reference Koike, Takahashi and YoshinoKoike and others, 1985). Snowmelt rates, in practical application, are usually calculated from the air temperature, using the degree-day method. It is necessary to calculate the energy balance in a watershed to improve snowmelt models. An energy balance method was recently applied to the prediction of the amount of snowmelt in a mountain watershed (Reference Nakamura, Yamazaki and KondoNakamura and others, 1991), and a lumped-parameter model was used to calculate the amount of snowmelt in the basin.
Effects of forest operations on snowmelt rates have recently become important in Japanese mountain watersheds. A distributed-parameter model for the prediction of snowmelt rates is needed to understand the influence of a forest and topography on snowmelt rates. A new distributed-parameter snowmelt prediction model has been developed, and changes of snowmelt rates and snowmelt runoff from a watershed caused by timber harvests are simulated by the model presented in this paper.
Study area, observation method and results
Study area
The sludy area is the southern face of Mount Iwate, northern Honshu Island, 39°50′N, 140°50′E. Mount Iwate is a volcano, and the basement consists of Quaternary volcanic rocks. Major soils are anodosols. Soil depth was not measured. The topography of the area (32.9 km2) is shown in Figure 1. The lowest, highest and mean altitudes are 400, 1780 and 1140m, respectively. There are four watersheds in the area (Fig. 1 ) with a total area of 10.6 km2.
Annual mean precipitation is 1940 mm, of which 45% occurs during winter (November-May). Annual mean temperature is 8.7°C at an open site at 490 m a.s.l.
Deciduous broad-leaved forests and man-made forests of Japanese larch are typical vegetation types below 1200 m a.s.l. The zone between 1200 and 1500 m a.s.l. is mainly covered with deciduous broad-leaved forests and oshirabiso-fir forests, and there is alpine grassland over 1500 m a.s.l.
Topography of the study area and the location of observation sites.

Observations
The meteorological observation sites were located at 490 m a.s.l. (Fig. 1), one in deciduous forest, the other on open ground. Observed variables were air temperature, relative humidity, wind speed, solar radiation, albedo of the snow surface and the net all-wave radiation. These elements, except wind speed, were measured every five minutes and hourly means were recorded by data loggers. The hourly wind run was recorded to obtain the hourly mean wind speed. Observations began in October 1989. In addition to these observations, atmospheric long-wave radiation was measured from August to November 1992. The downward long-wave radiation in four forests was measured at this observation site and other sites located at Moshiri, Hokkaido. The four forests included deciduous and evergreen forests.
Water equivalent of snow was measured at eight points, which are shown in Figure 1. As it was difficult for observers to climb to the watershed areas, the snow survey route was located in a more accessible site. A snow sampler with 0.046 m diameter and 2.0 m length was used. Three measurements at least were carried out at each place, every 10 to 15 days from December 1989 to April 1992.
Discharge was measured at four basins: observation sites are shown in Figure 1. The observations were carried out from October 1985 to July 1991. Water levels at four weirs were recorded every hour. As the water budget was not balanced in each watershed, the total of discharge for the four watersheds was analyzed.
Results
Meteorological variables at an open and a forested site
The relationship of meteorological variables, except longwave radiation, between an open site and a forested site were described as follows,

where Xf and Xo are the hourly values of meteorological variables at a forested and an open site respectively, and c and d are coefficients. Table 1 shows average values of c and d and coefficients of correlations during the three melting seasons. Solar radiation, net all-wave radiation and wind speed decreased in the forested site. Similar results were reported by Reference Koike, Takahashi and YoshinoKoike and others (1985), Price
Parameters on linear relations of meteorological variables between a deciduous forest and an open site. Note: r is the coefficient of correlation

(1988) and Reference Hashimoto, Ohta and IshibashiHashimoto and others (1992).
Long-wave radiation was greater in forests than at the open site, and long-wave radiation under leafed canopies was greater than that under leafless canopies.
Distributions of the water equivalent of snow
Figure 2 shows examples of the relations between altitude and the water equivalent of snow (black dots). The relations were presented by linear functions written as:
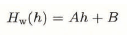
where Hw(h) is the water equivalent (mm) at the altitude h(m), and A and B are coefficients. Table 2 shows the values of A and B and coefficients of correlations just before the three melting seasons.
Parameters on linear relations between altitude and the water equivalent of snow. Note: r is the coefficient of correlation

Relationships between the altitude and the observed and estimated water equivalents during the 1991 melting season.

Comparison of the predicted hydrograph with the actual Hydrograph during the 1991 melting season

Snowmelt runoff
Figure 3 displays an example of a hydrograph of the sum total of discharge for the four watersheds (thin line). Snowmelt runoff began in the middle of March and ended at the end of May. Similar results were shown during other melting seasons.
Model for melt rate
The model developed in this paper focused On the snowmelt season. The hourly energy balance was computed.
Basic equation
A model which could calculate the snowmelt rate, the snow surface temperature and the freezing depth was presented by Reference Kondo and YamazakiKondo and Yamazaki (1990). The following is an outline of the basic equations in this method.
Figure 4 shows schematic profiles of the snow temperature T and water content W in the model. Liquid water content W is assumed as

Schematic snow temperature and water content profiles in the model (after Reference Kondo and YamazakiKondo and Yamazaki, 1990). Note: Ts, snow temperature at the present time step; Tsn, snow temperature at the next time step; Z; freezing depth at the present time step; Zn; freezing depth at the next time step; W0, water content in the melting depth.

where W0 is the maximum water content defined as the ratio of the mass of liquid water to the mass of the wet snow; z is the depth at any point (m) and z is the freezing depth at the present step (m). The value of W0 is 0.15 in this study. After a unit of time dt passes, the snow surface temperature Ts changes to Tsn and Z to Zn. The energy for the entire snow cover is described by

where Cs is the specific heat of ice (J kg−1); ρs is the snow-density (kg m −3); Ts and Tsn are the snow surface temperatures (°C) at the present and next time step, respectively; Z and Zn are the freezing depths (m) at the present and next time step, respectively; lf is the heat of fusion for ice (J kg−1) and M0 is the energy required to create runoff from the snow pack (J). Here, T0 is 0°C and di is 1 hour. G is written as

where a is the albedo on the snow surface; I is the solar radiation (W m−2); L is the atmospheric long-wave radiation (W m −2); δ is the Stefan-Boltzmann constant (W m −2K−4) and H, lE and QR are the sensible heat, the latent heat and the heat given by rainfall (W m−2), respectively. Here, ϵ is the emissivity of the snow and its value is assumed to be 1.0. H and lE are described by the following bulk transfer equations;


where Cp is the specific heat of air at constant pressure (J kg−1); ρ is the air density (kg m −3); U is wind speed (ms−1); Ta is the air temperature (°C); l is the latent heat of w ater (J kg−1) and h is the relative humidity. qs(Ta) is the saturated specific humidity at temperature Ta and Δ is dqs/dTa. Ch and Ce are the bulk exchange coefficients for the sensible heat and the latent heat, respectively, and these values are 0.002.
The heal balance equation of a snow surface with an infinitesimal thickness can be written as

where Rs is the thermal conductivity (W m−1−C−1).
Substituting (6) and (7) into (9), the snow surface temperature, the freezing depth and the snowmelt rale can be obtained by solving (4) and (9).
A distributed snowmelt model
Topography of the area
Topography was represented by a digital map with a cell size of 125 × 125 m, and the study area was divided into 2107 cells. Slope angle, slope aspect of a cell and elevation around a cell were calculated from the digital map. The surface-cover cells were divided into three types; deciduous forest, evergreen forest and deforested. The energy balance was solved on each pixel by the method described above. Advection between cells was ignored.
Albedo on the snow surface
The snow density in the 0-0.03 m thick layer affected albedo, and snow surface albedo was decreased with increased density (Reference KojimaKojima, 1979). The relationship between albedo and density is written as
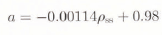
where ρss is the density (kg m−3) of the surface layer (0-0.03m) (Ohla, 1992). ρss is obtained by the viscoelastic theory of the snow (Reference KojimaKojima, 1957), and is written as

where Ei(X) is the integral exponent, ρss0 is the surface layer density (kg m −3) at t = 0 and Ws is the weight of the layer (kg). The values offe and E0 are 0.021 m 3 kg−1 and 10.0 kg d m−2, respectively. A0 is the decrease factor of E0 with temperature (Reference Kondo, Numata and YamazakiKondo and others, 1988).
Snow density of the freezing layer
The snow density of the freezing layer which is ρs in Equation (4) may often differ from the value of ρss. ρs therefore, is assumed as

where ρsd is the snow density below 0.03 m depth (kg m−3). The value of ρsd is supposed to be 450 kg m−3.
Solar radiation on each pixel under a deforested condition
Solar radiation on each pixel was calculated for a clear dav from the topographical data of the digital map and the sun's orbit. If a daily ratio of the actual solar radiation and the calculated clear day's solar radiation was given at an observation site, the actual solar radiation on each cell would be written as

where I and If are the actual and calculated radiation on a cell (W m−2), respectively, and x is the daily ratio of the actual and clear day's radiation ai the observation site. The value of x is constant on one day, although in reality the values may change continuously, if is calculated by the following equations:



where Ifd and Ifs are direct solar radiation and sky solar radiation (W m−2) on a slope with θ angle (°) and b aspect (°), respectively; P is the atmospheric transmitlance; I0 is solar constant (W m−2); hs is sun elevation (°); D is sun azimuth (°). D and b equal zero at due south, and the values are positive in western sector. The value of P was 0.77 and constant in the study area during the melting seasons. This value was decided by simulation of yearly variations in solar radiation. hs and D are written as follows:


where Cx is the latitude at a point, S is the sun declination and tx is the hour angle. There is no direct solar radiation on a cell when sun elevation is lower than the elevation around this cell.
Atmospheric long-wave radiation under a deforested condition
Monteith (1973) showed an equation to estimate the atmospheric long-wave radiation:

where L and Lf are respectively atmospheric long-wave radiation on a cloudy day and a clear day (W m −2); e is the vapor pressure (hPa); C is the cloudiness (0-10) and n is a constant determined by cloud type. The parameter n allows for the decrease of cloud temperature with increasing height, with a maximum value of 0.2 for low-cloud cover.
The values of n and C are rarely observed. Equation (19) was recently further developed (Reference OhtaOhta, 1992) and a simplified equation can be written as

where It and Iv are the daily solar radiation on the top of the atmosphere and the daily observed solar radiation at an observation site (MJm−2), respectively. Here, the parameter F is the value of Iv/It, when the ratio of possible sunshine is 1.0. Its value is 0.74.
Distributions of other elements
Distributions of air temperature, humidity, wind speed, amount of precipitation and initial water equivalent of snow cover were estimated as follows.
Air temperature at any pixel was written as

where Ta(h) and Ta,(hb) are the air temperature at each cell, h m a.s.l. and the observation site (°C), hb m a.s.l., respectively. The parameter ft, is the air temperature lapse rate with the altitude and its value is −0.6 (°C/100m).
The relative humidity on each cell is supposed to be equal to that at the observation site.
Wind speed at high altitudes was usually greater than that at lower altitudes, although a clear relation between two observation points, whose altitude difference was about 900 m, could not be obtained by the observations. The relation between wind speed and altitude, therefore, was supposed by an approximate relation between wind speed at these two points. It was described as

The amount of precipitation increased with altitude in this aira during snowy seasons (Reference OhtaOhta. 1989) and its relation was written as

where P is the amount of precipitation and the parameter fp is an increased ratio of precipitation with the altitude. Values of fp, are 0.001 for snowfall (Reference OhtaOhta. 1989) and 0 for rainfall, respectively. The critical air temperature of snow fall in this area is 1.7.5°C (Reference OhtaOhta. 1989).
The distribution of the water equivalent of the snow is represented by the linear functions described above. The parameters of initial distributions are presented in Table 2.
Forest effects on meteorological variables
Meteorological variables, especiallv wind speed, solar radiation and net all-wave radiation, differed in forests from those at an open site as presented in Table 1.
The ratio of solar radiation on deciduous forest cells to open cells in the model was 0.7 from observation results shown in Table 1. This ratio on evergreen forested cells was estimated 0.35 by other reports (Reference Koike, Takahashi and YoshinoKoike and others, 1985, Reference Ohta, Hashimoto and IshibashiOhta and others, 1990). The ratio of wind speed on forested cells to open cells was 0.6 from the results presented in Table 1.
Downward long-wave radiation was also influenced by a forest, as described above. Downward long-wave radiation in forests consists of the atmospheric long-wave radiation and long-wave radiation emitted from wood. It was possible to assume that the transmittance of canopies for the atmospheric long-wave radiation equaled that for the reflected radiation (Reference Yamazaki, Kondo, Watanabc and SatoYamazaki and others, 1992). The values of c in Equation (1) were 0.04 and 0.57 at the 490 m a.s.l. site in August and December 1990. respectively. Those values were 0.05 and 0.58 on cloudy days only in these two months. Assuming from these results that the transmissivity of a forest for the atmospherie long-wave radiation equals that for the solar radiation, downward long-wave radiation in a forest can be written as:

where Lfo and Lop are the downward long-wave radiation in a forest and the atmospheric long-wave radiation (W m−2), respectively; Tfo is the surface temperature of trees (°C) and fi, is the iransmissivity for the atmospheric long-wave radiation in forests. Here, Tfo is assumed to be equal to air temperature Ta.
Runoff model
The Hydrological Clyde Model (HYCY Model) (Reference FukushimaFukushima, 1988) was used to analyze snowmelt runoff. The input for this model were two area-averaged components; one was snowmelt rates and the other was rainfall. Evapotranspiration from a cell in which snow cover had already disappeared was also calculated in the runoff model and the values were 0.0 in March, 0.031 in April and 0.076 mm in May, respectively (Reference Ohta and HirayamaOhta and Hirayama, 1991). Parameters in the runoff model were obtained by simulations during summer seasons when runoff was caused by rainfall. The testing periods were from June to October in 1986–90.
Simulation of snowmelt process and snowmelt runoff
The “relative error” is written as

where Vo and Vc, are observed and calculated values, respectively, and N is sample size.
Albedo and the downward long-wave radiation
Figure 5 shows changes of observed and calculated daily mean albedo on the snow surface during the 1989–90 winter. The trend of estimated albedo was similar to observed albedo. The opposite variation occurred sometimes, for example on March 2, and these errors were caused by mistakes in the estimation of precipitation types. The relative error was 0.124 and the average of absolute errors was 0.087 during the three winters analyzed.
Figure 6 shows the observed and calculated atmospheric long-wave radiation at the observation site. Calculated values reproduced observed values and the average error was 21.1 W m−2. The method described in Equation (20) was used to calculate atmospheric longwave radiation. Observed and calculated downward long-wave radiation in the four forests are shown in Figure 7. Atmospheric long-wave radiation, Lop in
Time variation of the observed and calculated albedo on the snow surface during the 1989–90 winter.

Observed and calculated atmospheric long-wave

Observed and calculated downward long-wave radiation in four forests

Equation (24), used in this simulation were observed values and were not estimated by Equation (20). The average error was 13.1 W m−2, so the prediction method in Equation (24) was also used to predict the downward long-wave radiation in forests.
Distributions of water equivalent of snow
Distributions of water equivalent of snow in the study area were predicted by the snowmelt model, because the energy balance was solved on each cell.
Relations between altitude and estimated water equivalents are shown in Figure 2 (open dots and dotted lines). Estimated equivalents were values on cells in which actual observation points of snow surveys were located. Estimated relationships showed the same tendency as observed ones. Similar results were obtained during the other two melting seasons.
Daily snowmelt runoff from the watershed
The relative error on daily runoff during the testing periods was 0.188. The relative error on the total amount of runoff from June to October was 0.095.
The estimated daily hydrograph during the 1991 melting season is displayed in Figure 3 (thick line). The dotted line shows a calculated base flow. Relative errors on daily runoff during the 1990 and the 1991 melting seasons were 0.204 and 0.196, respectively. Relative errors on the total amount of runoff during the analyzed periods were 0.092 and 0.097. Reproducibility during the melting seasons was not inferior to that during seasons with no snow cover.
Forest influence on snowmelt process and snowmelt runoff
The effects of deforestation on the snowmelt process and the snowmelt runoff were investigated by the model. The energy balance under deforested conditions was solved on all cells without forest cover, (see ‘Forest effects on meteorological variables’ above). Although the distribution of snow pack may be actually changed by deforestation, simulations in this study focused only on the snowmelt process. Initial distributions of snow, therefore, were not changed under deforested conditions.
Changes in a snow cover area
Two predicted snow cover area ratios in the study watersheds during the 1991 melting seasons are displayed in Figure 8; one is under the present forested condition, and the other deforested.
The disappearance date of the snow under the deforested condition was about 10 days earlier than that under the present condition. Percentages of the snow cover area under the present condition were 10-30% greater than those under the deforested condition on the same day. The same results were obtained during the 1990 and the 1992 melting seasons.
Snowmelt processes are delayed by forests. Therefore, the influence of forests on snowmelt process should not be ignored in this area.
Estimated percentages of the snow cover area under the forested and deforested conditions.

Changes in snowmelt runoff from a watershed
Figure 9 displays the predicted hydrograph under the present forested condition and under the deforested condition during the 1991 melting season. Parameters in the HYCY Model under the deforested condition were not changed, as this analysis focused upon forest influences on the snowmelt. The snowmelt runoff was advanced and the peak discharge, especially, was greater during the first half of the snowmelt runoff period.
Not only errors on the daily runolf, but also those on the total amount of runoff during the 1990 and 1991 melting seasons became greater, forest influences on the snowmelt being ignored. Relative errors on daily runoff during the 1990 and 1991 melting seasons were 0.338 and 0.411, respectively, and those on the total amount of snowmelt runoff were 0.113 and 0.128.
Estimated hydrographs under forested and deforested conditions.

Summary
A new distributed snowmelt model based on an energy balance method was developed in this paper. The snowmelt process and the snowmelt runoff were simu-lated, and forest influences on the snowmelt were also investigated by this model.
The daily mean albedo on the snow surface was calculated in the model. Atmospheric long-wave radiation and downward long-wave radiation in forests were also reproduced.
Changes of water equivalents with the altitude were reproduced effectively during three melting seasons. Daily discharge from the watershed was also predicted by combining the snowmelt model with a runoff model, and the accuracy of the estimated snowmelt discharge did not fall behind that during the testing periods. Tt was predicted by this model that deforestation would advance the snowmelt period and the snowmelt runoff from the watershed by about two weeks.
Acknowledgements
I thank the Resources and Energy Section of Iwate Prefecture for the offer of the water level data, and members of Amihari Skiing Ground for their kindness during the observations. A part of this work was aided by Grant-in-Aid for Scientific Research (No. 02454069, chief; Dr Y. Fukushima) from the Ministry of Education, Science and Culture, Japan.



