




Saliba-Logea (ISO-639-3 sbe) is an Oceanic (Austronesian) language spoken primarily on the islands of Saliba and Logea (also known as Sariba and Rogeia), and the surrounding area in Milne Bay Province, Papua New Guinea (Figure 1). It is classified as a Suauic language within the Papuan Tip cluster within Western Oceanic and has approximately 2,500 speakers (Lewis Reference Lewis2009). The language, often referred to only as Saliba, has two varieties, Saliba and Logea. The differences between Saliba and Logea are mainly lexical and there appears to be little evidence of phonological differentiation (cf. Oetzel & Oetzel Reference Oetzel and Oetzel2003). Mutual intelligibility is unproblematic, confirmed by the fact that speakers are not necessarily in agreement about whether lexical items sometimes identified as dialect-specific belong properly only to Saliba or Logea.Footnote 1
Mosel (Reference Mosel1994: 4–5) provides a brief overview of the phonology and orthography of Saliba- Logea, including a short summary of stress and syllable structure. Oetzel & Oetzel (Reference Oetzel and Oetzel2004a and Reference Oetzel and Oetzel2004b) provide much more extensive information about the phonology of the language, while detailed information specifically about its grammar is given by Mosel (Reference Mosel1994) and Margetts (Reference Margetts1999).
The description we provide here is based primarily on the speech of two native speakers (one female and one male, both in their late thirties at the time of recording). The sound files provided for this illustration were captured either in a soundproof studio using a Charter Oak E700 dual diaphragm solid state condenser microphone or in a quiet room using a Zoom H4 portable stereo/4-track recorder. Most recordings were taken from a male speaker aged 35 at the time in 2009.
Map of Papua New Guinea showing the location of Saliba and Logea Islands within Milne Bay Province (shaded area). Inset map shows a close-up of the location of Saliba and Logea Islands (referred to as Sariba and Rogeia respectively). Adapted from https://commons.wikimedia.org/wiki/File:Milne_Bay_in_Papua_New_Guinea_(special_marker).svg

Figure 1 Long description
The map of Papua New Guinea highlights the location of Saliba and Logea Islands within Milne Bay Province, which is shaded for emphasis. The inset map provides a close-up view of the area, showing Saliba Island and Logea Island, also referred to as Sariba and Rogeia respectively. The map is adapted from a Wikimedia Commons source and includes detailed geographic boundaries and labels to indicate the specific islands and their surrounding regions.
Consonants


Saliba-Logea has 19 consonantal phonemes. The system is relatively straightforward, with the added presence of five labialized consonants. All phonemes occur word-medially between vowels, and, with the potential exception of /ʔ/, also occur regularly in word-initial position (see below).
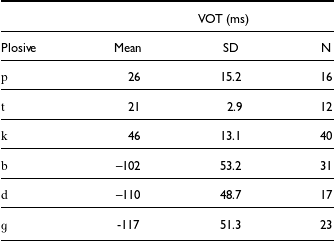
Mean, standard deviation (SD), and number of tokens for voice onset time (VOT) for 139 plosive tokens produced by two speakers in words in isolation in absolute initial position

Table 1 Long description
The table presents data on voice onset time (VOT) for plosive sounds produced by two speakers in isolation. It includes six rows for different plosive sounds: p, t, k, b, d, and g. Each row lists the mean VOT in milliseconds, the standard deviation (SD), and the number of tokens (N) for each sound. The sounds p, t, and k have positive VOT values, while b, d, and g have negative VOT values. The mean VOT ranges from 21 milliseconds for t to -117 milliseconds for g. The standard deviation varies, with the highest being 53.2 for b and the lowest being 2.9 for t. The number of tokens ranges from 12 for t to 40 for k.
The language has six plain oral plosives (/p b t d k ɡ/), which are paired by a voicing distinction, and a glottal plosive /ʔ/. The voicing distinction is cued by a clear voice onset time (VOT) contrast in absolute initial position as shown in Table 1. Voiceless /p t/ are typically unaspirated, with short-lag positive VOT while /k/ appears to be optionally post-aspirated, with an average VOT of 46 ms. Voiced /b d ɡ/, on the other hand, are generally strongly prevoiced as they exhibit long average values of negative VOT. In connected speech, the plosives are subject to some variability, in particular some post-aspiration (or even post-frication) of voiceless stops and optional lenition of voiceless and voiced stops in intervocalic position, as can be heard in the reading of the ‘North Wind and the Sun’ text (see further below). Examples of variation include, for instance, /haikawajaɡala/ [haikxawajaƔala] haikawayagala ‘they are angry with each other’ and /taubada/ [tauβ̞aða] taubada ‘(old) man’.
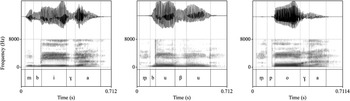
In word-initial position, voiced plosives are often prenasalized, consistent with a similar process found in many other Melanesian languages (Foley Reference Foley1986). In our corpus of words produced in isolation, 39 out of 71 voiced plosive tokens (55%) were prenasalized, with slightly higher rates for /b/ (18/31, 58%) and /d/ (10/17, 59%) as compared to /ɡ/ (11/23, 48%). Seven out of 39 prenasalized instances (18%) lacked prevoicing during nasalization, e.g., /bubu/ [m̥buβu] ‘granny’, with one prenasalized /b/ token extending this lack of prevoicing throughout closure (/boɡa/ [m̥poƔ̞a], ‘type of banana’), making prenasalization an essential cue to voicing in this instance. Visual illustrations of these prenasalized tokens are provided in Figure 2.
Annotated examples of prenasalized tokens showing full prevoicing (left), prevoicing of closure only (middle), and no prevoicing (right).

Figure 2 Long description
The image contains three spectrograms side by side, each representing different prenasalized tokens. The first spectrogram on the left shows full prevoicing, the middle spectrogram shows prevoicing of closure only, and the right spectrogram shows no prevoicing. Each spectrogram has a waveform at the top and a frequency plot below, with time on the x-axis ranging from 0 to 0.712 seconds and frequency on the y-axis ranging from 0 to 8000 Hertz. The labels under each spectrogram indicate the specific phonetic segments analyzed: 'm b i γ a' for the left, 'm b u β u' for the middle, and 'm p o γ a' for the right. The spectrograms illustrate the variation in prevoicing of voiced plosives in word-initial position, consistent with processes found in many Melanesian languages. All values are approximated.
The voiceless coronal plosive /t/ is most commonly alveolar, although a dental articulation is also possible, e.g., /tata/ [t̪at̪a] ‘slide’. Its voiced congener /d/ is regularly alveolar.
The glottal plosive occurs very infrequently as a phoneme, and may in fact be a loan from Suau, a closely related language (Oetzel & Oetzel Reference Oetzel and Oetzel2004a). While its phonemic status in intervocalic position within words is accepted by all, opinions differ as to what happens in word-initial position. Mosel (Reference Mosel1994) identifies only a small number of words with /ʔ/, including in initial position, e.g., /ʔaʔa/ ’a’a ‘to clean’ and /ʔunai/ ’unai ‘in, at, on’. However, Oetzel & Oetzel (Reference Oetzel and Oetzel2004a, Reference Oetzel and Oetzel2004b) argue that the word-initial glottal stop is not at all phonemic. Instead, in their view, it results from a regular phonetic process of insertion that always occurs before a word-initial vowel, e.g., /aʔa/ [ʔaʔa] a’a ‘to clean’. Our data provides somewhat conflicting evidence. The word-initial glottal stop is found to be variable in strength of articulation, and can also be deleted (see below). Moreover, unlike the word-medial glottal plosive, it is not usually marked in the spelling. However, productive morphological processes of prefixation allow the predictable initial glottal to surface between vowels, as seen in the following pair, e.g., /aʔa/ ‘to be clean’; /heʔaʔa/ he’a’a ‘to make clean’.
Figure 3 shows two realizations of /anka/ ‘anchor’ from a male speaker, without (left-hand panel) and with (right-hand panel) clear word-initial glottal plosive insertion. Note the evident glottalization following the glottal plosive in the latter as opposed to modal voicing throughout the initial vowel in the former example.
Saliba-Logea has four labialized plosives (/pw bw kw ɡw/) and one labialized nasal (/mw/), almost all of which occur only before the vowel /a/. To date, only three exceptions to this rule have been found:

Labialized consonants are a common areal feature of the Milne Bay province (Hajek Reference Hajek2010) and occur regularly in the phoneme systems of many different languages related to Saliba- Logea, including Tawala (Ezard Reference Ezard1997) and Dobu (Lithgow Reference Lithgow and Loving1977). In Saliba-Logea and related languages, for reasons of analytical parsimony, they are treated as unit phonemes (e.g., /mw/) rather than as clusters (e.g., /mw/), as clusters are avoided in syllable-onsets in the native lexicon. Saliba-Logea has only three nasals, two of which are plain and one labialized. There is also an additional allophone: a plain voiced velar nasal, [ŋ], which occurs very rarely and only before velar stops in English loans, e.g., /anka/ [aŋka] anka ‘anchor’. The plain bilabial nasal is otherwise the only consonant that occurs in coda-position word-medially (see below) and in word-final position in native words, e.g., /kamkam/ kamkam ‘chicken’.
Annotated examples of /anka/ [aŋka] and [ʔaŋka] ‘anchor’ (in order from left to right) produced by the same male speaker.

Figure 3 Long description
The image contains two annotated spectrograms side by side. Each spectrogram shows a waveform at the top and a frequency analysis below. The left spectrogram is labeled with the phonetic transcription /anka/ and the right spectrogram is labeled with the word anchor. Both spectrograms display time on the x-axis ranging from 0 to approximately 0.75 seconds and frequency on the y-axis ranging from 0 to 8000 Hertz. The annotations below the waveforms indicate the phonetic segments of the spoken words. The left spectrogram shows the segments a, n, g, k, a, while the right spectrogram shows a question mark, a, a, n, g, k, a. The waveforms and frequency analyses illustrate the differences in sound patterns between the two spoken words.
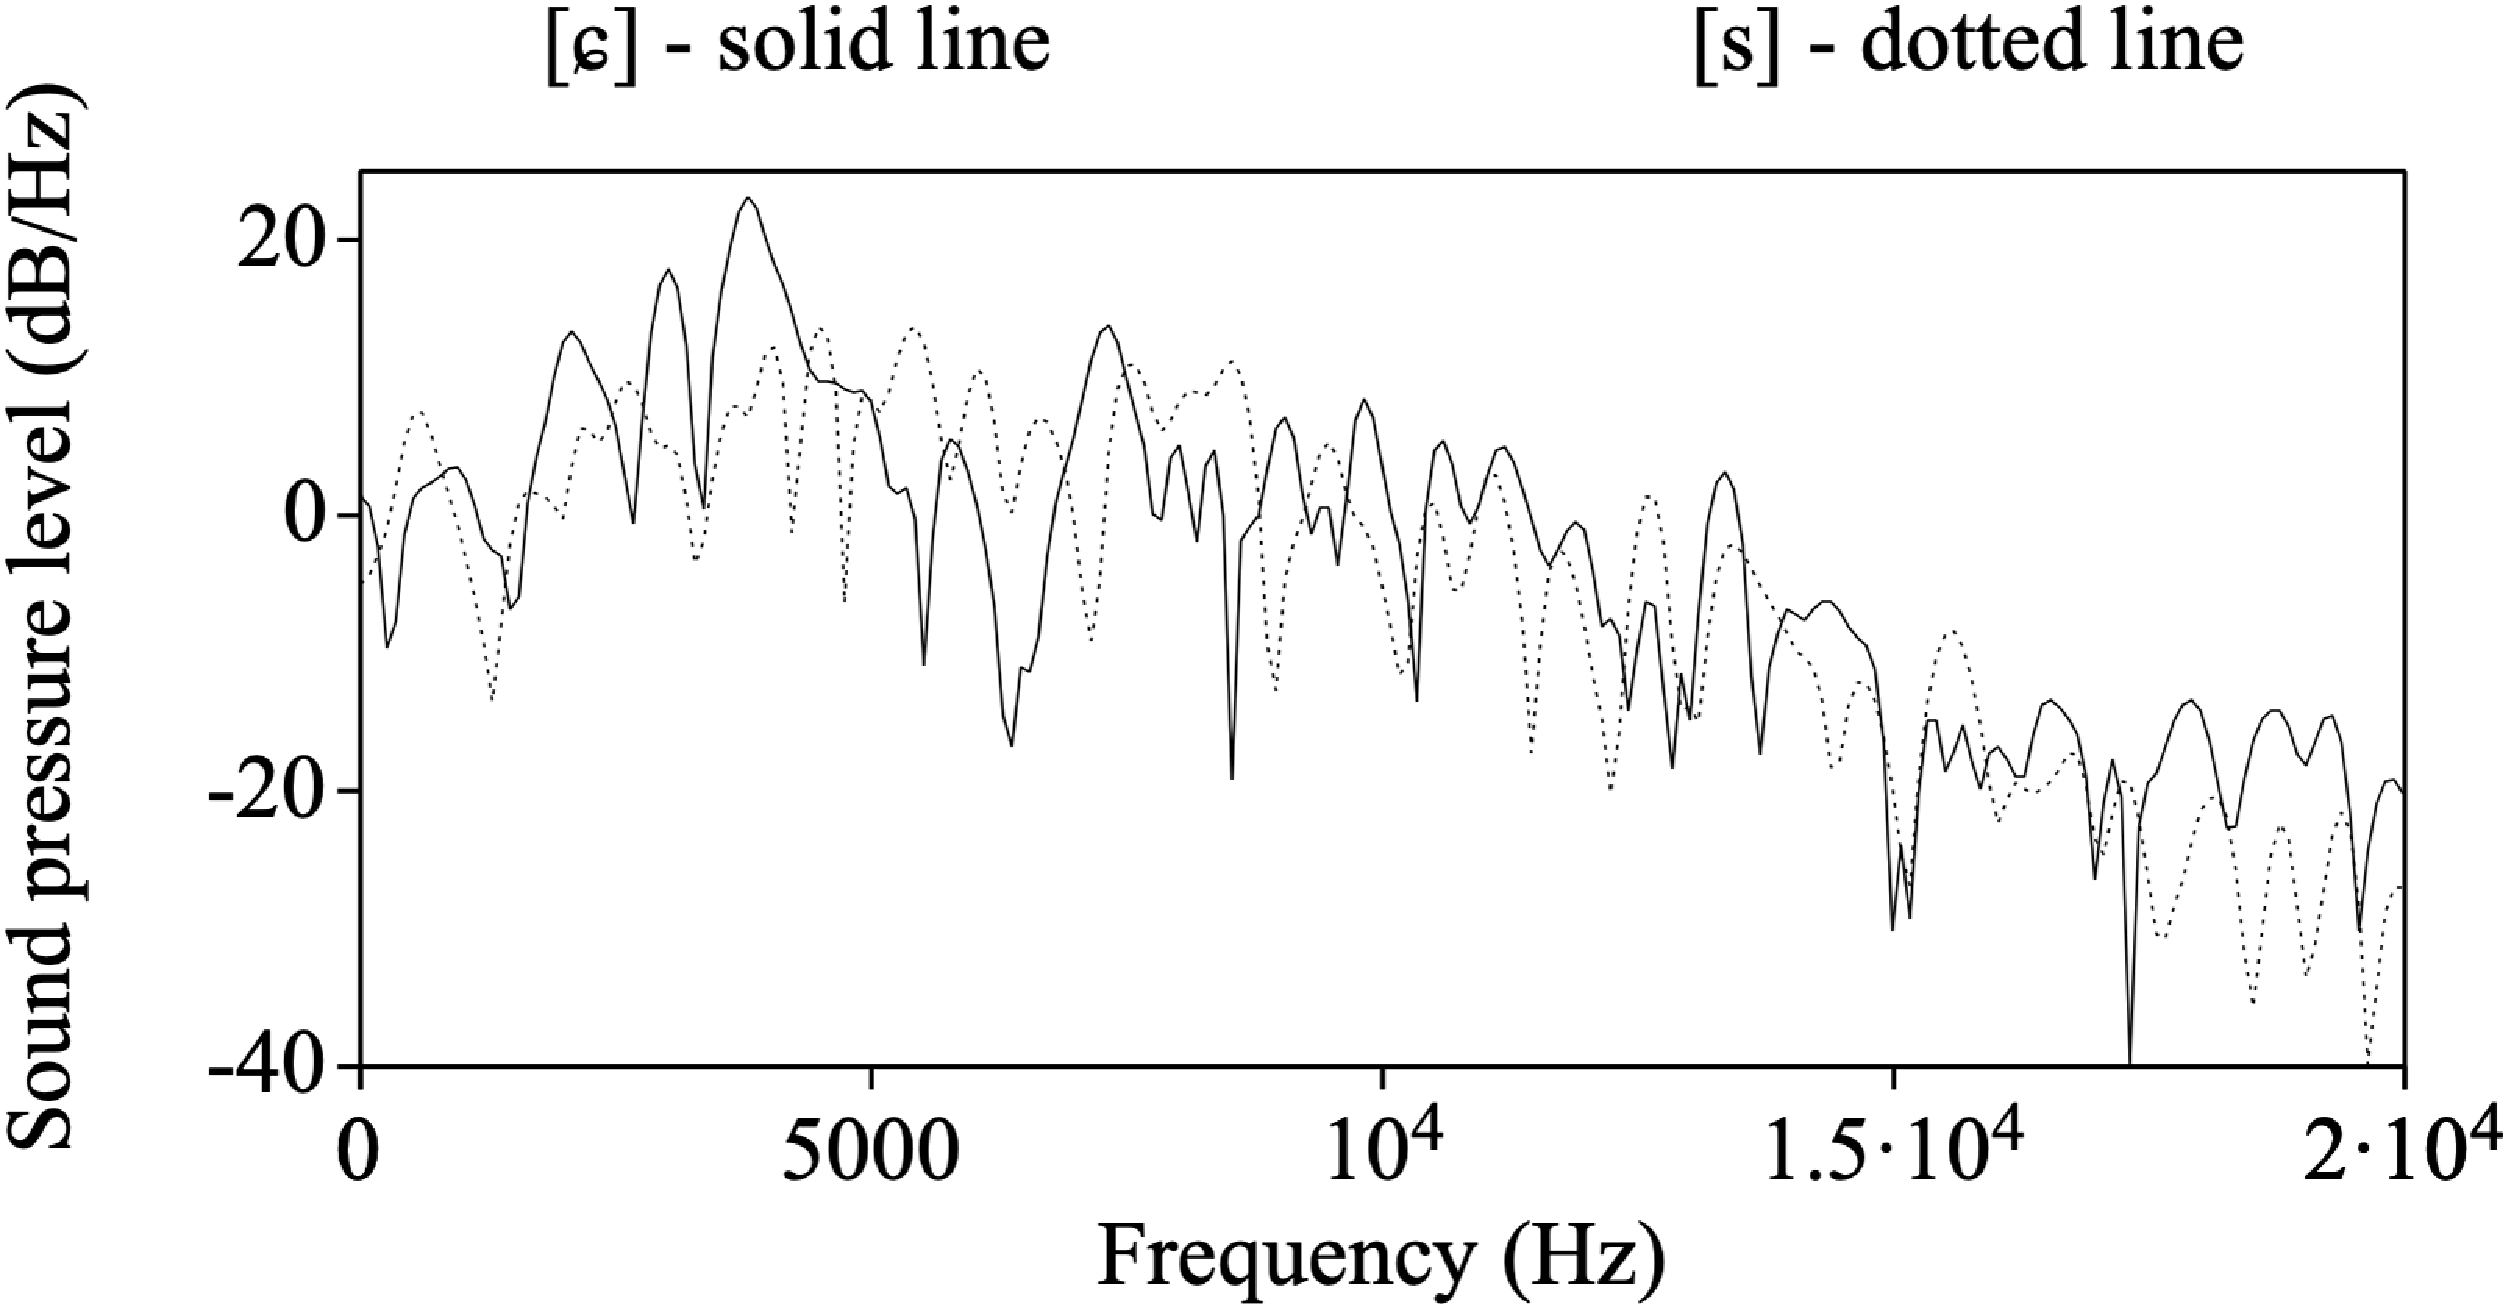
FFT spectra of one alveolar [s] and one alveolopalatal [ɕ] token, as perceived impressionistically, measured at the midpoint of frication.

Figure 4 Long description
A line graph displays sound pressure level in decibels per hertz against frequency in hertz, comparing two data sets represented by solid and dotted lines. The x-axis ranges from 0 to 20000 hertz, and the y-axis ranges from -40 to 20 decibels per hertz. The solid line represents one set of data, while the dotted line represents another. The graph shows variations in sound pressure levels across different frequencies for both data sets. All values are approximated.
Saliba-Logea has only two fricatives. One is a voiceless glottal fricative /h/ and the other a voiceless alveolar fricative /s/. /h/ may be voiced between vowels, e.g., /lohe/ [loɦe] lohe ‘to look’. /s/ may be retracted in the corpus and exhibit the quality of an alveolopalatal [ɕ], as observed auditorily and visually through an inspection of fast Fourier transform (FFT) spectra. Possible causes of variation between [s] and the assumed [ɕ] variant are not explored here but deserve future investigation. Figure 4 illustrates a comparison between spectra of /s/ in the examples for /simai/ [ɕimai] ‘cat’, given in the ‘vowels’ section below, and for /sala/ [saɾa] ‘dig’, presented above. The figure shows a higher concentration of spectral energy below 5 kHz for [ɕ] and above the same threshold for [s], consistent with previous acoustic investigations on these sounds (e.g., Bukmaier & Harrington (Reference Bukmaier and Harrington2016) on Polish; Lee-Kim (Reference Lee2011) and Ladefoged & Wu (Reference Ladefoged and Wu1984) on Mandarin Chinese), whereas energy distributions remain comparable across tokens above roughly 7.5 kHz.
Saliba-Logea has three approximant phonemes. The first is a voiced alveolar lateral approximant /l/. Our observations indicate that in intervocalic position it is more typically realized as a lateral flap [ɺ] or a tap [ɾ]. In less careful speech it can be realized as a central coronal approximant [ɹ] or an approximant tap [ɾ̞], as shown in the North Wind and the Sun transcription below. This variability results in alternations such as /polohe/ [polohe] ∼ [poɾohe] polohe ‘heavy’ for instance.Footnote 2 The second approximant phoneme is a voiced palatal central approximant /j/, while the third is a voiced labial-velar central approximant /w/.
Mosel (Reference Mosel1994: 4) claims that the phonemic status of /w/ and /j/ is debatable due to evidence of complementary distribution with their vocalic counterparts [u] and [i]. We follow instead Oetzel & Oetzel (Reference Oetzel and Oetzel2004a, Reference Oetzel and Oetzel2004b) who assign phonemic status to /w/ and /j/. We agree with them that it is not the case that the appearance of [w] and [j] is completely predictable nor without unexpected consequences.
Critically, the treatment of [w] and [j] as allophones of high vowels /u/ and /i/ is problematic in relation to the surface interaction between syllable structure and segment assignment. If /wabu/ ‘widow’ were treated as underlyingly /uabu/, we would expect it to surface as *[(ʔ)uwabu], rather than actual [wabu] with word-initial /w/, as a result of a marked tendency for a homorganic glide to be inserted in vowel hiatus contexts in which the first vowel is high or mid-high, i.e. [w] after /u/ or /o/ and [j] after /i/ or /e/, respectively. This process also, however, shows some variability, as reflected by occasional orthographic variation in the written form of the language, e.g., gonoa ∼ gonowa ‘ability’. Other examples include dua ‘give present’, guawana ‘type of shark’ which can also be spelt duwa and guwawana respectively. Oetzel & Oetzel (Reference Oetzel and Oetzel2004a, Reference Oetzel and Oetzel2004b) give additional reasons in favor of the phonemic status of /w/ and /j/, including the observation that treating glides as phonemic is also consistent with the general preference in the language for syllables with onsets (see also below).
Vowels
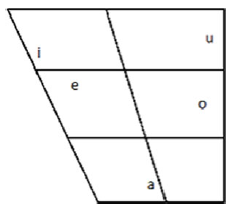
Saliba-Logea has a simple five vowel system, /a e i o u/, with /a/ representing a low central vowel. Figure 5 shows an F1/F2 vowel plot for the five vowels. It is based on 118 tokens from two speakers (one male, one female) with no normalization. Ellipses represent two standard deviations around the mean. We see that the two mid-vowels are relatively high and close, partly overlapping with high vowels /i u/, while low central /a/ has a more vertical distribution.
F1–F2 plot of the five Saliba-Logea vowels from two speakers (one male, one female).

Figure 5 Long description
A scatter plot displays the relationship between two vowel formants, F1 and F2, measured in Hertz. The plot includes five labeled vowel clusters: i, e, a, o, and u. Each cluster is color-coded and enclosed in an elliptical boundary. The x-axis represents F2 in Hertz, ranging from approximately 500 to 2500 Hertz, while the y-axis represents F1 in Hertz, ranging from approximately 250 to 750 Hertz. The clusters are positioned as follows: i and e are close to each other in the upper left, a is in the lower center, o is in the middle right, and u is in the upper right. The plot likely represents data from two speakers, one male and one female, of the Saliba-Logea language. All values are approximated.
The five vowels can be contrasted as seen in the following examples.

Vowel clusters with final non-low vowel surface with diphthongal effect in Saliba-Logea. Diphthongization in Saliba-Logea is not as tightly knit as in English and other European languages and vowel sequences are readily pronounced as almost disyllabic in careful speech.

Orth. = Orthography.
Identical vowel sequences occur rarely as a result of morphological processes, but surface as long vowels as seen in the second example below.

Phonotactic structure
The phonotactic structure of Saliba-Logea is relatively straightforward, with an overwhelming tendency towards CV syllable structure. Phonemic V syllables occur much less frequently and most consistently in word-initial position (cf. Oetzel & Oetzel Reference Oetzel and Oetzel2004a, Reference Oetzel and Oetzel2004b). As discussed previously, they also tend to resolve at the surface with glottal stop insertion. CVV syllables on the other hand are not uncommon (see examples cited above as well as in the section related to stress below). Syllable-initial CC clusters are very marginal and occur only in rare English loans, such as /stoli/ stoli ‘story’. These unusual non-native clusters are also unstable as speakers can also resolve them through insertion of /i/ evident in orthographic variation, e.g., stoli ∼ sitoli Footnote 3 . CVC syllables occur rarely and in native vocabulary the rhyme consonant is always /m/. As a result, a small number of /mC/ clusters occur in word-medial position in native vocabulary. Heterorganic clusters are often the result of reduplication, as shown in some of the following examples.

An additional set of word-medial clusters (with nasal place assimilation of /n/ before velar stops) occurs in loans, almost all directly from English.

Stress or prominence
Identifying stress is the most problematic part of Saliba-Logea phonology, with indications that Saliba-Logea may not in fact be a stress language. However, this is an issue that requires much more investigation than is possible here, and it may be wiser in the interim to refer to prominence instead. The current difficulties we encounter in understanding Saliba prosody relate in part to a pattern previously noted across different Austronesian languages, whereby basic stress cues (pitch, length and amplitude) often appear displaced differently across syllables rather than appearing together on the same syllable (see, e.g., Palmer (Reference Palmer2008) on Kokota, and Rehg (Reference Rehg, Edmondson and Gregerson1993) on several Micronesian languages).
This phenomenon of cue dispersal certainly occurs in Saliba-Logea, as Oetzel & Oetzel (Reference Oetzel and Oetzel2004a) also note specifically. While they provide useful data on what they understand to be stress placement, their results do not always coincide with our own observations. Detailed experimental exploration is still required to understand better these discrepancies.Footnote 4 What is clear at this stage is that investigators have responded differently to the spreading of stress-related auditory cues (see also Eades & Hajek (Reference Eades and Hajek2006) on similar issues in Gayo, an Austronesian language spoken in Eastern Indonesia).
We also acknowledge the potential existence of some phrase-level prominence patterns in Saliba-Logea, based on impressionistic observation of the North Wind and the Sun passage below. However, due to the present analysis being restricted primarily to words produced in isolation, we cannot for the moment draw any conclusive findings in this regard.
Impressionistically, as corroborated by participants during recording, certain patterns of syllable prominence resembling lexical stress emerge. In our corpus, the initial syllable in disyllables is always prominent when the final syllable is light (CV), e.g., HEsa ‘name’. If the final syllable is heavy (CVC, CVV), it is prominent in citation form, e.g., heSAM ‘your name’ and kaDAU ‘travel’ (but cf. HEsau INDEF in the North Wind and the Sun transcription), except in the case of reduplicated forms where both parts appear fairly evenly prominent, e.g., KAMKAM ‘chicken’. Figures 6 and 7 illustrate acoustic differences between HEsa and heSAM. Relative to the duration of the vowel in the second syllable, the duration of /e/ is clearly longer for HEsa than for heSAM. The duration of the first syllable relative to that of the second syllable is also clearly longer for HEsa. Furthermore, there is a steep decrease in intensity in the second syllable for HEsa but not for heSAM. Figure 8 shows a similar trend of the intensity track in kaDAU ‘travel’ as compared to heSAM (Figure 7). Intensity in the second syllable stays relatively level across syllable duration and is slightly higher than in the first syllable in both cases.
Waveform and spectrogram of hesa ‘name’ produced by a male speaker. The dotted line is the f0 track, and the solid line is the intensity track. Note the comparable duration of the modal voicing portions of the two vowels and the steep decrease in intensity in the second vowel.

Figure 6 Long description
The line graph shows the waveform and spectrogram of the phrase hesa name produced by a male speaker. The x-axis represents time in seconds, ranging from 0 to 0.8608 seconds. The y-axis on the left represents frequency in Hertz, ranging from 0 to 200 Hertz, while the y-axis on the right represents intensity in decibels, ranging from 0 to 100 decibels. The waveform at the top shows the amplitude of the sound wave over time, with notable peaks and troughs. The spectrogram below the waveform displays the frequency content of the sound over time, with darker areas indicating higher intensity. The dotted line superimposed on the spectrogram represents the f0 track, which shows the fundamental frequency of the sound. The solid line represents the intensity track, indicating the loudness of the sound over time. The graph highlights the comparable duration of the modal voicing portions of the two vowels and the steep decrease in intensity in the second vowel. All values are approximated.
Waveform and spectrogram of hesam ‘your name’ produced by a male speaker. The dotted line is the f0 track, and the solid line is the intensity track. Note the longer duration of the second vowel relative to the first vowel and the smaller, less steep decrease in intensity in the second vowel as compared to Figure 6.

Figure 7 Long description
The line graph displays the waveform and spectrogram of the word hesam your name produced by a male speaker. The dotted line represents the f0 track, while the solid line represents the intensity track. The x-axis is labeled Time in seconds, ranging from 0 to 0.8605 seconds. The y-axis on the left is labeled f0 in Hertz, ranging from 0 to 200 Hertz. The y-axis on the right is labeled Intensity in decibels, ranging from 0 to 100 decibels. The graph is divided into five segments labeled h, e, s, a, and m. The waveform shows variations in amplitude over time, with notable peaks and troughs. The spectrogram displays frequency content over time, with darker regions indicating higher intensity. The dotted f0 track shows the fundamental frequency, while the solid intensity track shows the overall intensity of the sound. The second vowel has a longer duration compared to the first vowel, and the intensity decrease in the second vowel is smaller and less steep compared to the first vowel.
Waveform and spectrogram of kadau ‘travel’ produced by a male speaker. The dotted line is the f0 track, and the solid line is the intensity track. Note the much longer duration of /au/ in the second syllable relative to /a/ in the first syllable and the level intensity track for most of the duration of the diphthong in the second syllable.

Figure 8 Long description
The image displays a waveform and spectrogram of the word kadau travel produced by a male speaker. The waveform at the top shows the amplitude of the sound over time, with two distinct peaks corresponding to the syllables. The spectrogram below the waveform illustrates the frequency content of the sound, with the y-axis representing frequency in hertz and the x-axis representing time in seconds. The dotted line on the spectrogram represents the fundamental frequency (f0) track, while the solid line represents the intensity track. The spectrogram shows two main sections labeled k, a, d, and au, corresponding to different phonetic segments. The /au/ in the second syllable has a much longer duration compared to the /a/ in the first syllable. The intensity track remains relatively level for most of the duration of the diphthong in the second syllable. The spectrogram also shows variations in frequency content, with higher concentrations of spectral energy below 5 kilohertz for certain segments and above the same threshold for others.
Figure 9 shows that the average duration and vowel intensity of the final syllable in disyllables are much higher when this syllable is heavy compared to when it is light, suggesting that these parameters may play a more consistent role in cueing prominence in Saliba-Logea. By contrast, no clear changes in average vowel f0 can be seen across final syllable types (Figure 10).
Mean syllable duration (including onset C) and mean vowel RMS amplitude + error bars for disyllabic words ending in a heavy (CVV) vs. light (CV) syllable. The two plots are based on 68 and 116 tokens from one male and one female speaker respectively.

Figure 9 Long description
The image contains two sets of line graphs. The first set on the left shows mean syllable duration in milliseconds for heavy and light syllables across two syllable positions. The heavy syllable duration increases sharply from syllable 1 to syllable 2, while the light syllable duration decreases. The second set on the right shows mean intensity in decibels for heavy and light syllables across two syllable positions. The heavy syllable intensity slightly decreases from syllable 1 to syllable 2, while the light syllable intensity drops significantly. Error bars are present on all data points, indicating variability. The graphs are based on 68 and 116 tokens from one male and one female speaker respectively.
Mean vowel f0 + error bars for disyllabic words ending in a heavy (CVV) vs. light (CV) syllable based on 117 tokens. The top row and the bottom row show the data from one male and one female speakers, respectively.

Figure 10 Long description
The image contains four line graphs comparing the mean vowel f0 in heavy (CVV) and light (CV) syllables for disyllabic words. The top row shows data from a male speaker, while the bottom row shows data from a female speaker. Each graph plots syllable number on the x-axis and mean vowel f0 in Hertz on the y-axis. The heavy syllable data is on the left, and the light syllable data is on the right. Each graph shows two data points connected by a red line, with error bars indicating variability. The male speaker's data ranges from approximately 60 to 80 Hertz for heavy syllables and 60 to 80 Hertz for light syllables. The female speaker's data ranges from approximately 100 to 120 Hertz for heavy syllables and 100 to 120 Hertz for light syllables. The graphs illustrate the differences in vowel f0 between heavy and light syllables for both speakers.
In longer words, identifying consistent prominence patterns is often more problematic, lending further support to the hypothesis that lexical stress may be absent in Saliba-Logea. As illustrated by the keDEwa and KEdewa ‘dog’ realizations in Figures 11 and 12 below, stress cue displacement becomes even more apparent in this context. Additionally, while final heavy syllables frequently exhibit stress-like prominence, this is not consistently the case.
Waveform and spectrogram of kedewa ‘dog’ produced by a male speaker. The dotted line is the f0 track, and the solid line is the intensity track. Note the peak intensity and greater duration in the penultimate vowel, but similar f0 in both the antepenultimate and penultimate vowels.

Figure 11 Long description
A line graph showing the waveform and spectrogram of kedewa dog produced by a male speaker. The x-axis represents time in seconds, ranging from 0 to 0.7013 seconds. The y-axis on the left represents frequency in Hertz, ranging from 0 to 200 Hertz, and the y-axis on the right represents intensity in decibels, ranging from 0 to 100 decibels. The waveform at the top shows the amplitude of the sound over time. The spectrogram below the waveform displays the frequency components of the sound, with darker areas indicating higher intensity. The dotted line represents the f0 track, showing the fundamental frequency of the sound, while the solid line represents the intensity track, indicating the loudness of the sound. The graph highlights a peak intensity and greater duration in the penultimate vowel, with similar f0 in both the antepenultimate and penultimate vowels. The segments are labeled as k, e, d, e, w, and a along the x-axis. All values are approximated.
Waveform and spectrogram of kedewa ‘dog’ produced by a male speaker. The dotted line is the f0 track, and the solid line is the intensity track. Note the peak f0 and greater duration in the antepenultimate vowel, but similar intensity in both the antepenultimate and penultimate vowels.

Figure 12 Long description
A line graph showing waveform and spectrogram of kedewa dog produced by a male speaker. The x axis represents time in seconds, ranging from 0 to 0.7017 seconds. The y axis on the left represents frequency in Hertz, ranging from 0 to 200 Hertz. The y axis on the right represents intensity in decibels, ranging from 0 to 100 decibels. The waveform at the top shows the amplitude of the sound over time. The spectrogram below shows the frequency components of the sound over time, with darker areas indicating higher intensity. The dotted line represents the f0 track, and the solid line represents the intensity track. The graph highlights the peak frequency and greater duration in the antepenultimate vowel, but similar intensity in both the antepenultimate and penultimate vowels. All values are approximated.
Furthermore, vowel duration differences across syllables tend to be minimal, with a frequent tendency for vowels outside the expected locus of stress or prominence to lengthen, even when they might otherwise be classified as unstressed or not prominent.
The perceptual effect is such that monomorphemic words often sound as if they have two equally prominent syllables, e.g., BAGOdu ‘wave’. In longer multimorphemic words it is difficult to establish which syllable is most prominent – it can appear to be equal or shift from syllable to syllable on repeated testing. This ambiguity in the placement of potential correlates of stress is shown in Figure 11 through to Figure 16 below. As previously mentioned, these observations highlight the need for further experimental research to better understand the prosodic patterns of Saliba-Logea. Detailed analyses of connected speech and larger datasets would be essential to clarify the role of prosodic cues in this language (cf. Himmelmann Reference Himmelmann, Ewing and Klamer2010).
Waveform and spectrogram of bagodu ‘wave’ produced by a male speaker. The dotted line is the f0 track, and the solid line is the intensity track. Note a similar peak intensity, peak f0, and vowel duration between antepenultimate and penultimate vowels.

Figure 13 Long description
The image displays a waveform and spectrogram of a bagodu wave produced by a male speaker. The waveform is shown at the top, illustrating the amplitude of the sound over time. Below the waveform, the spectrogram provides a visual representation of the frequency spectrum of the sound, with time on the x-axis and frequency on the y-axis. The dotted line represents the f0 track, indicating the fundamental frequency of the sound, while the solid line represents the intensity track, showing the loudness of the sound over time. The spectrogram is divided into sections labeled b, a, g, o, d, and u, corresponding to different segments of the sound. The image highlights a similar peak intensity, peak f0, and vowel duration between the antepenultimate and penultimate vowels.
Given the complexity also of the interaction between number, weight and prosody of syllables in longer words we now provide a simple descriptive quantitative analysis, focusing on words up to four syllables in length composed of CV (light) syllables only, which, as we have seen, is the most frequent syllable type in Saliba-Logea. Figure 14 shows that the average duration of syllables in trisyllables remains stable across our corpus of CVCVCV words.
Mean syllable duration (including onset C) + error bars for words of two to four syllables composed of light (CV) syllables only. The plots show data based on 100 tokens from one male and one female speaker.

Figure 14 Long description
The image contains three separate line graphs, each representing words with two, three, and four syllables respectively. The x-axis of each graph indicates the syllable number, while the y-axis shows the mean syllable duration in milliseconds. Each graph includes error bars to represent variability in the data. The first graph shows a decreasing trend in syllable duration from the first to the second syllable for two-syllable words. The second graph indicates relatively stable syllable durations across the three syllables for three-syllable words. The third graph displays a U-shaped pattern, with syllable duration decreasing from the first to the third syllable and then increasing again for four-syllable words. All values are approximated.
However, in quadrisyllabic CVCVCVCV words the first and the last syllables appear to have longer duration.
As Figure 15 demonstrates, mean vowel intensity does not seem to signal stress in our target words as intensity decreases across syllables and no specific patterns can be detected. The same can be said for mean vowel f0 (Figure 16). The only obvious difference here is that the female speaker tended to produce a terminal rise in trisyllables and the male speaker a fall, possibly due to a stylistic difference in reading word lists.
Mean vowel RMS amplitude + error bars for words of one to four syllables composed of light (CV) syllables only. The plots show data based on 178 tokens from one male and one female speaker.

Figure 15 Long description
The image contains four separate line graphs, each representing the mean vowel RMS amplitude in decibels for words with one to four syllables composed of light syllables. The x-axis of each graph represents the syllable number, ranging from 1 to 4, while the y-axis represents the mean intensity in decibels, ranging from 70.0 to 77.5. Each graph shows data based on 178 tokens from one male and one female speaker. The first graph shows a single data point for syllable 1, indicating a mean intensity around 75.0 decibels. The second graph shows a decreasing trend from syllable 1 to syllable 2, with mean intensities around 76.0 and 73.0 decibels, respectively. The third graph shows a slight decrease from syllable 1 to syllable 2, followed by a more significant drop at syllable 3, with mean intensities around 74.0, 73.5, and 71.0 decibels, respectively. The fourth graph shows a decreasing trend from syllable 1 to syllable 4, with mean intensities around 76.0, 75.0, 74.0, and 72.0 decibels, respectively. Error bars are included to indicate variability in the data. All values are approximated.
Mean vowel f0 + error bars for words of one to four syllables composed of light (CV) syllables only. The plots show data based on 178 tokens from one male (top) and one female (bottom) speaker.

Figure 16 Long description
The image contains two sets of four line graphs each, showing mean vowel f0 in Hertz across syllables for male and female speakers. The top row represents data from a male speaker, while the bottom row represents data from a female speaker. Each graph corresponds to words with one to four syllables composed of light (CV) syllables only. The x-axis of each graph indicates the syllable number, ranging from 1 to 4, while the y-axis indicates the mean vowel f0 in Hertz, ranging from 70 to 110. The graphs show data based on 178 tokens. For the male speaker, the graphs show varying trends in mean vowel f0 across syllables, with some graphs indicating an increase and others a decrease or stability. For the female speaker, the graphs also show varying trends, with some indicating an increase and others a decrease or stability. Error bars are included to show the variability in the data. The graphs highlight the complexity of identifying stress in Saliba-Logea phonology, suggesting that it may not be a stress language and that prominence might be a more appropriate term.
Transcription
The following presents both broad and narrow phonetic transcriptions of the passage ‘The North Wind and the Sun’ read by a male speaker of Saliba-Logea. These are followed by the orthographic version of the story and the glossed text. Prominence patterns in the read passage show even greater variability than in isolated utterances as described above. We find, for instance, not only different prominent syllables in the word mahana ‘sun’ as both MAhana and maHAna, but also cases of prominence on short CV syllables that precede final heavy syllables, e.g., HEsau INDEF and BAyao ‘strong’. Unsurprisingly, there is also much greater phonetic segmental variability in connected speech in comparison to isolated speech, seen in such things as full nasalization of underlying /bw/ in /bwauli/ in one case below, i.e. [ˈmwauɺi]. The speaker also produced a false start in the second line of the passage, indicated by a dash.

Orthographic version
Pilipilidai hesau mahana yo bwauli.
Bwauli yo mahana mayadai hesau se haikawayagala kaiteya ye bayao kalili bwauli o mahana.
Haikawayagala na taubada hesau ye laoma ye taitaihile na kouti ye likwa.
Se koitalaliyu ede se wane ‘kabo kaiteya taubada ne yona kouti ye hai gabae meta iya ye bayao’ ede.
Ede bwauli ye hetubu ye towa, ye towa meta ye bayao palapa.
Ye towa ye bayao iyamo taubada wa yona kouti ye kabi hekahini palapai.
Bwauli ye towa ye bayao palapa ye kaipate kasaya ede ye kaiyawasi.
Kabo mahana wa hinage kana huya ye hetubu ye sina na ye sina bayao.
Ye sina bayao ede taubada wa yona kouti ye hai gabae.
Ede bwauli ye hedede lau i wane ‘Oh kowa ku bayao kalili’.





 Open access


.svg)