




1. Introduction
Interest in women’s historic occupations has taken hold in Britain, where the impact of industrialization on women’s work and living standards is debated.Footnote 1 In the United States, women’s participation rates derived from censuses have been revised by Goldin (Reference Goldin and Schultz1995).Footnote 2 The under-recording of women’s work is thus well known in nineteenth and twentieth century censuses, as has been demonstrated in different European countries.Footnote 3 There is also a rich literature on the issue in Spain, where women’s participation rates have been reconstructed and their main determinants identified. The latest research takes a regional and local perspective for the analysis of labor markets and women’s participation rates, exploring the industrial activity that spurred women’s participation. These studies provide new sources, data, and methodologies to correct the under-recording of women’s economic activity. In Spain, under-recording occurred mainly because of a social norm: the widespread acceptance of the “domesticity model,” according to which women should dedicate themselves to household work and family care, leaving men to work outside the home. This norm conditioned women not to declare their occupations to census takers, especially when they worked in seasonal occupations. As a result, those charged with carrying out censuses might only record the occupations of women who were heads of household, widows, or whose husbands were absent. As has been shown in previous research, Spain’s first national population census, published in 1857, hid women’s labor. In those studies, women’s participation rates were calculated based on a population sample that included urban and rural municipalities of Galicia (Muñoz-Abeledo et al., Reference Muñoz-Abeledo, Taboada-Mella and Verdugo-Matés2015, Reference Muñoz-Abeledo, Taboada-Mella and Verdugo-Matés2019, Reference Muñoz-Abeledo and Verdugo-Matés2023); Catalonia (Camps, Reference Camps1995; Borderías, Reference Borderías2013; Borderías and Ferrer-Alòs, Reference Borderías and Ferrer-Alòs2017); the Basque Country (Pérez-Fuentes, Reference Pérez-Fuentes2013); and Andalusia (Campos, Reference Campos2014). All of these studies use similar methodologies. Essentially, they link municipal enumerator books with other sources (such as workers rolls, company records, and tax registries) for different localities during two periods—the mid-nineteenth century and the first third of the twentieth century. Their results show that women’s participation rates were surprisingly high, surpassing 80 percent in some industrial localities. However, these studies’ focus on local and regional economies does not allow us to see the impact of women’s work at a national level. A wider focus could change the narrative of national economic growth and shed light on regional disparities in labor markets.
Historical analysis of Spain’s occupational structure has been based on uncorrected census data, with the consequent underestimation of women’s work, especially in agriculture. Several authors have detected the problem. Erdozáin and Mikelarena (Reference Erdozáin and Mikelarena1999) provided long-run figures for employment in the agrarian sector, including a regional breakdown and a detailed analysis of the reliability of the censuses. They did not analyze the secondary or tertiary sectors. Using census data from 1860 to 2000, Nicolau (Reference Nicolau1985, Reference Nicolau, Carreras and Tafunell2005) calculated men’s and women’s participation rates, pointing out that censuses hid women’s work, particularly in agriculture. To analyze employment in contemporary Spain, Prados de la Escosura has revised figures for structural change by using census data with some corrections. In the case of agriculture, data for the active population of women seems to be inconsistent over time, so he decided to exclude the problematic numbers. To get consistent figures for the economically active population in agriculture, he does not attempt gender disaggregation; instead, he excludes the census figures for women and simply assumes that women’s labor represented a stable proportion of the male labor force in agriculture. This allows him to find total agricultural labor by increasing the number of days assigned to each man by the given factor (Prados de la Escosura, Reference Prados de la Escosura2017, p. 194).
Spain’s economic modernization began in the second half of the nineteenth century (Álvarez-Nogal and Prados de la Escosura, Reference Álvarez-Nogal and Prados de la Escosura2013; Carreras and Tafunell, Reference Carreras and Tafunell2018) and included forces that would lead to greater regional inequalities (Beltrán Tapia and Martínez-Galarraga, Reference Beltrán Tapia and Martínez-Galarraga2020). By the end of the nineteenth century, the national marketplace was largely integrated, and an industrial sector had grown up in various judicial districts within regions such as Catalonia and Basque Country. Some geographers and sociologists have analyzed women’s and men’s occupations in the 1860 census (the first to listed occupations) in order to correct the total number of workers in economic sectors. They argue that present-day regional economic differences originated during the industrialization process (Esteban-Oliver, Reference Esteban-Oliver2017; Esteban-Oliver et al., Reference Esteban-Oliver, San José and Martí-Henneberg2017). This view has been bolstered by economic historians who point to increasing differences in per-capita GDP across Spanish provinces during the first stages of industrialization, roughly 1860 to 1920, followed by a trend on convergence (Tirado et al., Reference Tirado, Díez-Minguela and Martinez-Galarraga2016).
In this article, we correct women’s industrial employment by judicial district (where sources allow), which gives a more realistic picture of men and women’ contributions to the industrialization process. We have three main research objectives: (1) correct the under-recording of women’s work in industry in Spanish censuses, (2) calculate labor participation rates for women and men in judicial districts that we can correct, (3) show the spatial arrangement of women’s occupation rates. Our main source is the population census of 1887. We have also used several new sources, such as Reseña Geográfica y Estadística de España, 1888 (Geographical and Statistical Review of Spain, 1888), Reformas Sociales[:] Información oral y escrita publicada de 1889 a 1893 (Social Reforms: Oral and written information published from 1889 to 1893), Estadística minera y metalúrgica de España, 1887–1890 (Spanish Mining and Metalurgic Statistics, 1887–1890), Boletín Comercial e Industrial de Galicia, 1885, (Commercial and Industrial Bulletin of Galicia, 1885), El trabajo de las mujeres y los niños[:] Estudio sobre sus condiciones actuales (Women and children’s work[:] Study of their current conditions) by Sallarès I Pla (Reference Sallarès i Pla1892), Guía Indicador de La Coruña y Galicia para 1890–1891 (Guide for Corunna and Galicia for 1890–1891), trade and industrial directories, such as Anuario del Comercio, de la Industria, de la Magistratura y de la Administración, 1886 (Yearbook of Trade, Industry, Judiciary and Civil Administration, 1886), Memorias sobre la industria fabril redactadas por los ingenieros al servicio de la investigación de la Hacienda Pública, 1900 (Records on the manufacturing industry written by engineers in the service of research for the Public Treasury, 1900), and other contemporary publications and reports.
The rest of this paper is organized as follows. First, we explain the methodology and sources employed. Then we construct a new picture of women’s industrial work by correcting the census numbers in 1887 for those judicial districts where sources are available. Further, we calculate women’s labor force participation rates by judicial district. Finally, we support our census correction by calculating the Moran index and the local indicators of spatial association (LISA), an analysis that enables us to detect spatial patterns that help explain the geographical distribution of women’s employment.
2. Methodology and sources
Early Spanish censuses generally classified residents of each province and capital according to their sex, age, civil status, elementary education, and profession, but presented the demographic and professional data differently in each publication. The census of 1887 gives information on occupations at a judicial district level using the following structure: primary sector (agriculture), secondary sector (crafts, industry, and mining), and tertiary sector (trade, transportation, “liberal professions,” arts, and “diverse occupations”). The 1887 census also records the ages of the employed: from 12 to 20 years of age, from 21 to 40, from 41 to 60, and over 60.
We correct the under-recording of women’s activity in the main industries that employed women: textiles (cotton and wool), food (fish processing and canned vegetables), leather (shoes), and tobacco (cigar making). We also correct industries in which women workers were less common, such as mining. Since the 1887 census did not gather information about family relationships, it is not possible to correct women’s labor in agriculture because we do not know how many spouses and daughters worked in farming. Correcting the under-recording in agriculture only became possible with the census of 1900, which recorded occupations by gender and civil status.
The fishing and maritime industries (including auxiliary activities and the processing industry) were a key sector for coastal Spain in the north and southwest. We use the Reseña Geográfica y Estadística de España, 1888 to estimate women’s labor participation in salting and canning industries in judicial districts where factories were located. This document gives the number of fish salting and canning factories—as well as the number of workers in each one—by maritime districts. We use other sources, such as trade directories and commercial and industrial bulletins for the 1880s, to identify the number of workers by municipality and judicial district. Although statistics from these sources are not disaggregated by sex, we know that women made up at least 80 percent of the labor force in salting and fish canning factories (Muñoz-Abeledo, Reference Muñoz-Abeledo2010, Reference Muñoz-Abeledo2012).
For the tobacco industry, we look at women’s employment in cities that had factories belonging to the Spanish tobacco monopoly (Compañía Arrendataria de Tabaco, CAT). Founded in 1887, this company was the largest single industrial employer of the country. That year, CAT’s tobacco factories employed 32,000 workers, of which 95 percent were women.Footnote 4 We compare various sources to correct the numbers of women employees in CAT’s factories in Corunna, Gijón, Santander, Bilbao, Madrid, Alicante, Valencia, Málaga, Cádiz, and Sevilla. More specifically, we compare the estimates made by Alonso Álvarez (Reference Alonso Álvarez1993, pp. 38–42) with the data published by Gálvez (Reference Gálvez2000) for Seville and Candela Soto (Reference Candela Soto1997) for Madrid. We use the report of the Comisión de Reformas Sociales, which disaggregates the number of single, married, and widowed women (Información Oral y escrita, Tomo III p. 154) for Valencia, and the same source for Gijón (Tomo V p. 480). For Corunna, we consult a local industrial guide that provides detailed data for all factory workshops. For other factories, we use Alonso’s estimates (Reference Alonso Álvarez1993, pp. 38–42).Footnote 5
According to census data, women were mainly occupied in the textile industry (mostly in cotton manufactures). To correct these statistics, we located all of the cotton textile factories in the mountain and inland areas of Catalonia, the industry’s leading region. We used Sallarès i Pla (Reference Sallarès i Pla1892) as a primary source and Enrech (Reference Enrech2003) as a secondary source. Together, they give us a detailed description of cotton companies and work organization in the region. We also used Sallarès i Pla to estimate the number of workers in the wool industry. We know data on spindle mechanisms and the proportion of men and women workers in a typical factory dedicated to wool yarn and drapery fabrics (in Sabadell in 1890). To estimate the number of women workers in the most important Spanish wool areas, we relied on data from the dissertation of Benaul (Reference Benaul1991).
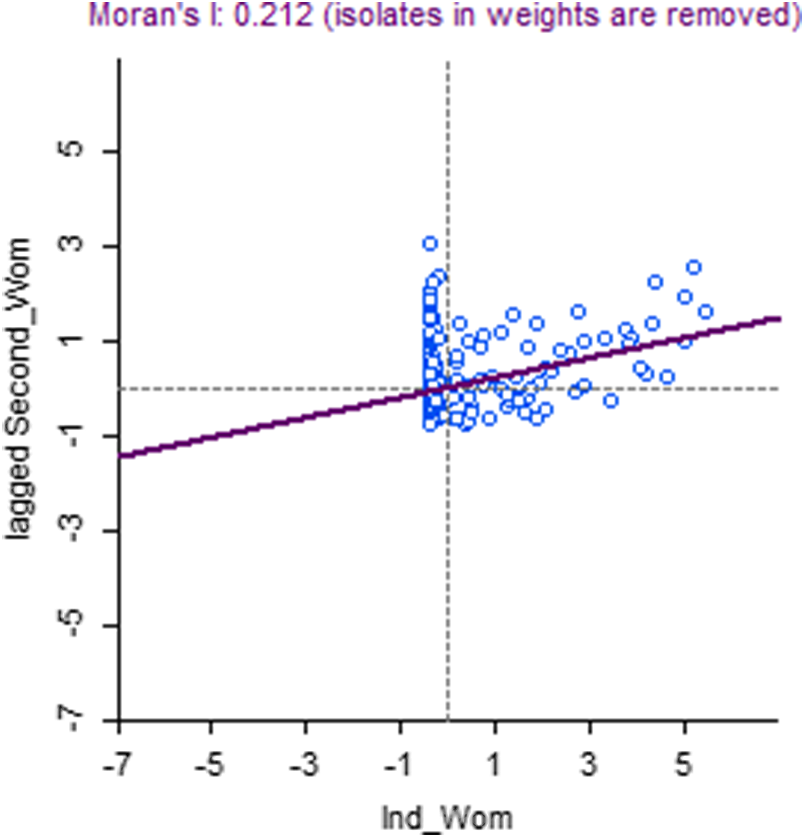
This analysis of census undercounting is complemented with a spatial analysis of census data in order to understand another well-known phenomenon in regional studies—spatial autocorrelation.Footnote 6 Women’s labor market participation was a key indicator of socio-economic status at the time. Spatial analysis of women’s occupation rates can reveal how this participation was distributed geographically and how it influenced regional economic growth. To test the existence of spatial clustering in the data, we applied the exploratory spatial data (ESDA) analysis method, which provides useful summary information about the spatial arrangement of women’s occupation rates. This approach has been previously employed to explain the geographic patterning of per capita income in Spain (Tirado et al., Reference Tirado, Díez-Minguela and Martinez-Galarraga2016). ESDA tools allow for the detection of global and local spatial autocorrelation. One of the most frequently used measures of global spatial autocorrelation is Moran’s index (Moran, Reference Moran1950).Footnote 7 The Moran Index is used to measure the spatial autocorrelation of women’s occupation rates in different judicial districts (Figure 1). This index can indicate whether there is a tendency for judicial districts with similar employment rates for women to be geographically close to each other. If the Moran Index shows positive autocorrelation, it suggests that judicial districts with high women’s employment rates are clustered together. This may indicate the presence of industrial clusters where women’s employment was significant due to labor demand, for example, in textile factories or other industries. This index ranges between −1 and 1; where 0 means no spatial correlation, 1 means positive autocorrelation, and −1 means negative autocorrelation. Calculating the index requires applying a matrix of spatial weights (W). The formulation of this matrix is critical in the estimation of spatial models since the neighborhood relationship has to be specified. To construct the matrix, the criteria most often used are based on geography or geometry, using the concepts of contiguity and distance. In this work, the spatial weights-matrix for the distance criterion is constructed by means of an inverse distance function using the coordinates for latitude and longitude.Footnote 8
Moran’s index of female occupation rate in industry out of total occupation in industry.

Moran’s index measures clustering, the tendency of similar values to concentrate in space. In our case, the index shows to what degree a judicial district with a given women’s occupation rate is surrounded by neighboring judicial districts with similar rates. The idea is to determine whether women’s occupation rates in one judicial district affect occupation rates in adjoining judicial districts. The presence of textile factories in one district could, over time, create a skilled workforce that attracts factories to neighboring districts. High occupation rates would then tend to cluster. For instance, this happened in medium size Catalan industrial cities such as Sabadell, Tarrasa, and Manresa that received short-distance migrants (Camps, Reference Camps1995, p. 60). Alternatively, low occupation rates in a given judicial district could cause residents to move to neighboring districts in search of employment, thus leading to higher occupation rates in the bordering districts.
The index is complemented by a LISA, initially proposed by Anselin and Florax (Reference Anselin and Florax1995), which offers a more precise view of local spatial autocorrelation characteristics. In our case, LISA refers to the propensity of an area to group similar high or low values of women’s occupation rates—or, on the contrary, diverse values. It evaluates the null hypothesis (a random distribution) by comparing the values of each location with the values of neighboring locations.Footnote 9
We use global spatial autocorrelation to measure how women’s occupation rates in the secondary sector (industry, plus craftswoman) in each judicial district compare with those of its neighbors—and with those of more distant areas. This gives an indication of the degree of spatial concentration of occupation rates across judicial districts in Spain. We have chosen the secondary sector for two reasons. First, Sarasúa (Reference Sarasúa2019) has documented that manufacturing employment declined throughout the country in the nineteenth century, even in regions that experienced industrialization. Second, industry’s weight in the 1887 Census is not very high.
3. New evidence of women’s work in industry by judicial district
In this section, we first examine the Spanish occupational structure by gender according to census data in 1887. Then we correct the census data to get a more realistic picture of women’s work in industry.
3.1. Men and women’s employment according to census data
According to data from the 1887 census, the employed population between the ages of 12 and 60 comprised 6.3 million people, of which 1.2 million were women, barely a fifth of the total. The Spanish economy was still extremely rural. Table 1 shows the main labor categories recorded in the census.Footnote 10 The primary sector occupied 67 percent of the employed population, the secondary 16 percent (4 percent in industry, and 12 percent as artisans), and the tertiary 17 percent.Footnote 11
Occupational structure by gender in Spain in 1887 (without correction)

Source: Censo de la Población de España, 1887.
The main difference in occupational structure for men and women occurred in the tertiary sector, where 29 percent of women were employed but only 15 percent of men. This is not surprising because domestic service remained women’s principal occupation, accounting for a quarter of women’s employment.
Table 1 shows that men’s employment was heavily concentrated in the primary sector, where their presence would continue to grow until the beginning of the twentieth century—a trend contrary to what was occurring in countries in northern and central Europe (Soto Carmona, Reference Soto Carmona1989, p. 57; Sarasúa, Reference Sarasúa, Matés Barco and González Enciso2006, p. 418). Several factors help explain this trend. Agriculture’s tariff protections and low capitalization, as well as the nation’s weak industrial development, strengthened the sector, which was where most men found employment. However, the weight of those employed in agriculture was surely overestimated to some degree, since the census only included one occupation for each person. In northern Spain (the judicial districts of Galicia, Asturias, Cantabria, and Basque Country), farmers often combined their agriculture work with activities in rural manufacture and transportation during periods when demand for farm labor slackened.
According to the 1887 census, women were also heavily represented in the primary sector. Not only was Spain still an agrarian country, but the northern judicial districts were characterized by smallholder agriculture in which all family members worked. A report of the Social Reforms Commission describes women’s participation: “In general, for field tasks, the proportion of women was about half, and for some tasks, such as the hoeing of corn, it was more than that.”Footnote 12 However, like their male counterparts, rural women also combined agricultural labor with other activities, such as manufacturers (linen goods), processing of dairy products, and sales of agricultural products and small livestock (chickens, eggs, and rabbits).
Table 1 shows that the second most important occupational category for women was domestic service, accounting for 25 percent of women’s total occupation in Spain. Domestic service did not become feminized until the nineteenth century—in the eighteenth century, it had been men’s work. Generally, rural girls moved into cities to work in domestic service (Sarasúa, Reference Sarasúa1994; Pallol et al., Reference Pallol, Carballo and Albarrán2010; Dubert and Gourdon, Reference Dubert and Gourdon2017; Muñoz-Abeledo, Reference Muñoz-Abeledo, Dubert and Gourdon2017; Martínez López and Villa Gil-Bermejo, Reference Martínez López and Villa Gil-Bermejo2021). Even in Barcelona, the core textile city of Spain, domestic service was the main activity for women, occupying 41 percent of women according to the census. The true figure was probably higher, given the underreporting of this occupation (Borrell, Reference Borrell2016). In Spain’s capital, Madrid, women in domestic service made up 66 percent of women’s total employment. This sector has been studied in Madrid at the end of the nineteenth century by Otero Carvajal and Pallol Trigueros (Reference Otero Carvajal and Pallol Trigueros2009), among others. We also know there is census under-recording of other service sector women’s occupations, such as wet nurses. In Spain, there were thousands of wet nurses who worked for foundling hospitals as “externals,” taking children into their own houses, and generally living in the countryside (Sarasúa, Reference Sarasúa2021; Sarasúa et al., Reference Sarasúa, Erdozain and Hernández2023).
Commerce was the next most important occupation for women in the tertiary sector—about 2 percent of women’s employment for Spain. Women participated in family businesses and created their own small business, such as shops selling food, textiles, shoes, hardware, or notions (Kwolek-Folland and Walsh, Reference Kwolek-Folland and Walsh2007; Gálvez and Fernández Pérez, Reference Gálvez and Fernández Pérez2007; Hernández-Nicolás and Martínez-Rodríguez, Reference Hernández-Nicolás, Martínez-Rodríguez, Aston and Bishop2020; Ulianova, Reference Ulianova, Aston and Bishop2020; Craig, Reference Craig, Aston and Bishop2020). Some widows ran maritime businesses, such as fishing ships, canning factories, and trading enterprises. The under-recording of women in commerce has been corrected for certain Spanish cities through business registries and municipal enumerator books (Pareja, Reference Pareja2012).
In commerce, the main difference between men and women was that men tended to work in wholesale markets while women worked in retail trade. In city directories for the main Spanish coastal cities (Barcelona, Bilbao, and Valencia), we found men in a variety of trade occupations, including purchasing agent and commercial traveler. Women were lower on the occupational ladder in this sector, taking jobs in the retail segment (street vendor, shopkeeper, ironmonger, and grocery seller).
In the secondary sector, occupation percentages for men and women over total employment were similar, with industry accounting for only 4 percent of each group’s employment. The secondary sector was made up by crafts and industry.
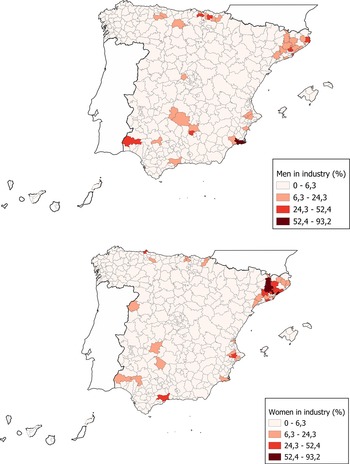
Map 1 shows men’s and women’s occupations in industry by judicial district. Manufacturing was concentrated in a limited number of judicial districts located mainly in Catalonia and Basque Country. The latter would achieve a considerable degree of industrial development, even by European standards (Carreras, Reference Carreras, Nadal and Carreras1990). It is worth noting that fewer than 14 percent of Catalan women were occupied in agriculture, a reflection of their high employment in industry.
Men and women in industry over total employment, 1887 (by judicial district).

Looking at industrial employment by gender and judicial district, we pointed out that many judicial parties from Catalonia hosted a quarter of the Spanish cotton industry.Footnote 13 The second important textile subsector was wool, mainly located in the districts of Sabadell and Terrasa. This location was due to a long tradition of preindustrial manufactures (Nadal et al., Reference Nadal, Benaul and Sudrià2003). As Map 1 shows, the sector mainly employed women. According to the 1887 census, 19,837 women were employed in Catalan industry, with more than half of them in three judicial districts: Barcelona, Manresa, and Mataró. For perspective, 66,607 men were working in the Catalan industry at that time. The silk industry was located in other Mediterranean judicial districts, especially in Valencia. Alcoy was a paper and wool center. These three industries also mainly employed women.
Most of mine workers were men. Mining was integrated in industry in the census of 1887. Thus, we must use another source, the Estadística Minera de España, in order to ascertain the labor force (men and women) working in this sector. Coal mining was important in the judicial districts of Labiana and Lena, both in Asturias. In 1887, Estadística Minera de España recorded 3,689 men working in Asturian coal mines, though the census recorded only 3,766 men across all Asturian’s industries that year. This discrepancy shows that men were also underreported in the industrial sector. “Mixed workers” (obreros mixtos) were recorded in the census as farmers but were in fact occupied in both mining and agriculture (Sierra, Reference Sierra1990). Women working in Asturian coal mines made up 12 percent of the region’s total coal-mining employment, the highest figure in Spain. In the early years of the coal sector, women worked mainly inside the mine, performing auxiliary activities such as loading and transporting ore. Outside, women carried water to workers leaving the mine, shoveled and loaded wagons with coal, and raised and lowered gates at crossings (García Velón, Reference García Velón2015, pp. 25–28).
The iron and steel industries were located mainly in the judicial districts of Bilbao, Valmaseda, Durango, and Vergara in Basque Country.Footnote 14 Much of Spain’s industry grew up around Biscayan steel plants, which enabled the creation of machinery establishments and the expansion of shipyards. Growth in the metal (and mining) industries opened new job opportunities for men, spurring migration from Spain’s interior (Silvestre, Reference Silvestre2005). Women represented just 4.5 percent of all ironworkers. They did haul and transportation tasks, as well as mineral washing (Pérez-Fuentes, Reference Pérez-Fuentes1993).
Mining was also important in some Mediterranean districts, such Cartagena (Murcia), whose lead and zinc mines provided the bulk of national output in 1890 (Pérez de Perceval and Sánchez Picón, Reference Pérez de Perceval and Sánchez Picón2001). The Estadística Minera de España in 1887 records 2,935 men working in Murcia’s mines. Spain’s largest copper mining company, Minas del Rio Tinto, was in the judicial district of Valverde del Camino (Huelva). The company employed 11,097 workers in 1887, of whom 3.4 percent were women.
Census data thus give us an image of gender division of labor according to industry as well as industrial employment that was concentrated in few Spanish judicial districts mainly located in industrial regions such as Catalonia and Basque Country. In the next part of this section, we will give a more realistic picture of women’s industrial work by correcting census data.
Women in industry over total employment, 1887 (selected judicial districts).

3.2. Women’s work in industry using corrected data
We can correct census figures for women’s work in 55 judicial districts—12 percent of Spain’s judicial districts—that had industrial subsectors with high concentrations of women workers: textiles (cotton, wool, lacemaking), food industry (vegetable and fish processing and canning), and tobacco.
Map 2 shows women’s industrial work over total women’s employment by judicial district according to census data; Map 3 shows women’s industrial work over total women’s employment using our corrected figures.
Women in industry over total employment, 1887 (corrected figures in selected judicial districts).

3.3. Textile industry
Most of women’s industrial employment was in textiles, particularly cotton manufactures, so under-recording here is a priority for correction. We selected the 60 Catalan towns where cotton manufactures were located—mainly coastal towns and nearby municipalities, as well as some towns in the mountainsFootnote 15. El Pla (The Flat) and La Muntanya (The Mountain) were two terms used to define geographical areas with two different manufacturing and labor organization models. The first refers to factories in the middle of the countryside that operated with hydraulic (river) power. The second refers to urban cotton factories of coastal areas that used steam and coal as a source of energy (Enrech, Reference Enrech2003, p. 11). Entrepreneurs sought to reduce production costs (energy and labor) by building textile colonies along rivers (the Ter and LLobregat) in the foothills of Catalan’s Pyrenees. By the 1880s an important technological change took place: “self-acting spinning machines” were replaced by “ring-frames spinning machines,” which were operated by women.Footnote 16 This modernization of machinery allowed employers to reduce the skilled men artisan workforce and employ more women and children.Footnote 17 By 1890, 53 percent of cotton workers were working in river mills in the interior of the country, while the remaining 47 percent worked in the judicial districts of coastal Catalonia.Footnote 18
For our correction of women’s work in the cotton industry we started with Sallarès i Pla’s (Reference Sallarès i Pla1892) data for cotton spinning and weaving in Sabadell’s factories. According to Sallarès i Pla, 74.6 percent of Sabadell’s cotton workers were women. We used this percentage to estimate women’s employment in the rest of the Catalan factories recorded by Sallarès I Pla (Reference Sallarès i Pla1892) and Enrech (Reference Enrech2003). This correction is realistic for the end of nineteenth century because by then the major technological changes in spinning and weaving had occurred (Nadal, Reference Nadal1978, p. 195; Enrech, Reference Enrech2003, p. 13).Footnote 19
Sabadell provides a good example of textile technology and labor organization at the end of the nineteenth century. It was an eminently industrial city by the middle of the nineteenth century, with cotton and wool factories accounting for 50 percent of men’s activity and 69.8 percent of women’s activity in 1860 (Camps, Reference Camps1995, p. 152). Sallarès i Pla, whose data for Sabadell’s factories in 1892 corroborate these figures, paints a remarkably detailed picture of the city’s textile sector. He published data about the workers in each factory—two cotton companies, four wool companies, one hemp and linen company, one velvet company, one silk company, and one jute company—while also recording information about the workers employed in each phase of production processes (Sallarès I Pla, Reference Sallarès i Pla1892, pp. 130–143). Since his data came just five years after the 1887 census, and since there were no significant technical changes during those years, we can safely assume that factories’ organizational structure remained about the same. A comparison of Maps 2 and 3 reveals the under-recording of women’s industrial activity in judicial districts across Spain. The textile industry, mostly cotton—was placed in different judicial districts from Catalonia (Barcelona, Berga, Granollers, Manresa, Villanueva y la Geltrú, Igualada, Sabadell, and Reus), but also there were important factories in Guipúzcoa, Málaga, and Cádiz. For Barcelona, the census records 6,541 women in industry, while our estimate puts 15,881 women in the cotton sector alone. For the entire Catalan region, we estimate that 55,038 women were occupied in the cotton textile industry, compared to 19,837 women recorded by the census for all industries.
We also correct the number of women in the wool industry based on figures from Sabadell’s factories. Sallarès i Pla’s data show that 48.7 percent of the city’s wool factory employees were women (Sallarès I Pla, Reference Sallarès i Pla1892, p. 137)—about the same as the figure published by Camps (Reference Camps1985, p. 46). We estimate women workers in the judicial districts of Sabadell, Terrasa, Alcoy, Antequera and Béjar, the most important wool districts at the end of the nineteenth century (Aracil and García Bonafé, Reference Aracil and García Bonafé1974; Parejo Barranco, Reference Parejo Barranco1987, Reference Parejo Barranco, de Molina M and Parejo Barranco2004; Benaul, Reference Benaul1991; Ros, Reference Ros1999). However, we only correct the data in Sabadell (1,407) and Antequera (281) because for Terrasa and Béjar, our corrected figures are lower than the numbers recorded by the 1887 census. For Alcoy, we used reports by the Social Reforms Commission to correct the number of women employed in the wool industry because Sallarés i Pla just provided data for Catalonia. According to the commission, 4,000 women were employed in Alcoy’s wool industry, yet the census recorded just 1,715 women in industry overall. It’s worth emphasizing that our figures show that women made up a third of Alcoy’s total industrial workforce.
Sarasúa has demonstrated that manufacturing production was widespread in preindustrial Spain and employed thousands of women (Sarasúa, Reference Sarasúa2019). By the middle of the eighteenth century, women in Castile were mostly occupied in nonagrarian activities—mainly textile manufacturing. Unsurprisingly, women’s labor in the lacemaking industry of Castile-La Mancha was also under-recorded in the 1887 census. We corrected women’s employment numbers for the region’s lacemaking industry, specifically in the judicial districts of Almagro, Almodóvar del Campo, and Ciudad Real.
3.4. Canning industries: fishing and vegetables
We also corrected the figures for the fish processing industry (salting and canning). Map 3 shows that women were concentrated in some judicial districts in the south of Galicia (Vigo, Pontevedra, Cambados) and in the North of Galicia (Vivero), which had a salting industry as well as a nascent canning industry (Carmona Badía and Nadal Oller, Reference Carmona Badía and Nadal Oller2005; Carmona Badía, Reference Carmona Badía2011). Indeed, Galicia, specializing in sardines, produced 60 percent of all Spanish canned products. Eighty percent of these industrial workers were women, though they were not recorded as cannery workers in the 1887 census (Muñoz-Abeledo et al., Reference Muñoz-Abeledo, Taboada-Mella and Verdugo-Matés2015, Reference Muñoz-Abeledo, Taboada-Mella and Verdugo-Matés2019). This happened in other fish-preserving áreas such as the jurisdictional districts of Laredo, Santoña and San Vicente de la Barquera (Cantabria), Elanchove (Basque Country), and Huelva (Andalusia). For those areas, we estimate an average of 46 women per salting factory (Ansola Fernández, Reference Ansola Fernández1997, p. 169).
In the interior of Spain, La Rioja, especially Calahorra with its vegetable canning industry, stand out. For the vegetable canning industry, we looked at the factories listed in the Yearbook of Commerce, Industry, Judiciary, and Administration of 1887. To estimate the number of women workers in each factory, we use the average number of women recorded in Industrial Statistics in canning establishments for the province of Logroño at the beginning of the twentieth century—40 women per factory. This allows us to estimate the number of women in the canning industry in the judicial districts of Cervera del Río Alhama, Haro, and Calahorra (Logroño). We also found this industry in Palma de Mallorca.
3.5. Tobacco industry
We corrected the number of women working in the tobacco industry for all of Spain—10 factories with more than 30,000 women workers. For Seville’s factory, we compared the estimates made by Alonso Álvarez L(Reference Alonso Álvarez1993, p. 38). For Madrid, we used data from Alonso Álvarez L (Reference Alonso Álvarez1993, p. 40) and Candela Soto (Reference Candela Soto1997). For Valencia, we use data from the Social Reforms Commission, which breaks down the number of single, married, and widowed women. We also used commission data for tobacco factories in Gijón. For Corunna, we found the number of women cigar makers in a local guide to industry and commerce, a document that provides detailed information about the factory’s departments (Faginas Arcuaz, Reference Faginas Arcuaz1890). For the rest of the CAT factories, we used Alonso’s numbers (Álvarez L, Reference Alonso Álvarez1993, pp. 38–42).
3.6. Footwear industry
For the footwear industry, we estimated factory and workshop workers on the Balearic Islands, Spain’s main shoe production center. Forty percent of Mallorca’s shoe production took place in the judicial district of Palma de Mallorca, which had 70 workshops and 10 factories in 1887 (Escartin, Reference Escartin1999, p. 412). We also correct the district of Mahón in Menorca based on Miranda (Reference J.A1996, p. 171) data, completed with another source, Memorias sobre la industria fabril redactadas por los ingenieros al servicio de la investigación de la Hacienda Pública (1900, p. 359). Our estimates of the number of women employed in the footwear industry do not include women who worked at home, who normally sewed the aparado (cut pieces of leather).
3.7. Mining
When we compared the census’s figures for women employed in mining with those of Estadística Minera de España, we found underreporting in a couple of mining areas. The two main zinc mining companies were in the Potes judicial district of Santander. Here, the 1887 census only counts 11 women working in industry, while Estadística Minera de España records 111 working in mining. We found 119 women working in lead mines of Ciudad Real—representing 6 percent of the total workforce—women who do not appear in the 1887 census.
Our corrected map of women’s work in industry shows their employment in relevant industrial districts in Catalonia. These results are in line with the research published by Nadal (Reference Nadal, Nadal, Carreras and C1987), Parejo Barranco (Reference Parejo Barranco2001), Paluzie et al. (Reference Paluzie, Pons and Tirado2004), and Martínez-Galarraga (Reference Martínez-Galarraga2012), who show that during the second half of the nineteenth century, there was a significant increase in the spatial concentration of industrial production (Map 3). Our contribution is to give more importance to the role that women play as predominant labor force in the textile industry by the last third of the nineteenth century. In addition, we discover more women´s work than the population census let us know. In addition, we correct food industry (canning) in judicial districts of the interior of Spain, such as Calahorra (Logroño), or coastal, such as Vigo, Cambados, Laredo, etc. Also, we corrected lace make manufactures in some judicial districts (Almagro and Ciudad Real), and tobacco in different places, being the factories places mainly in city ports.
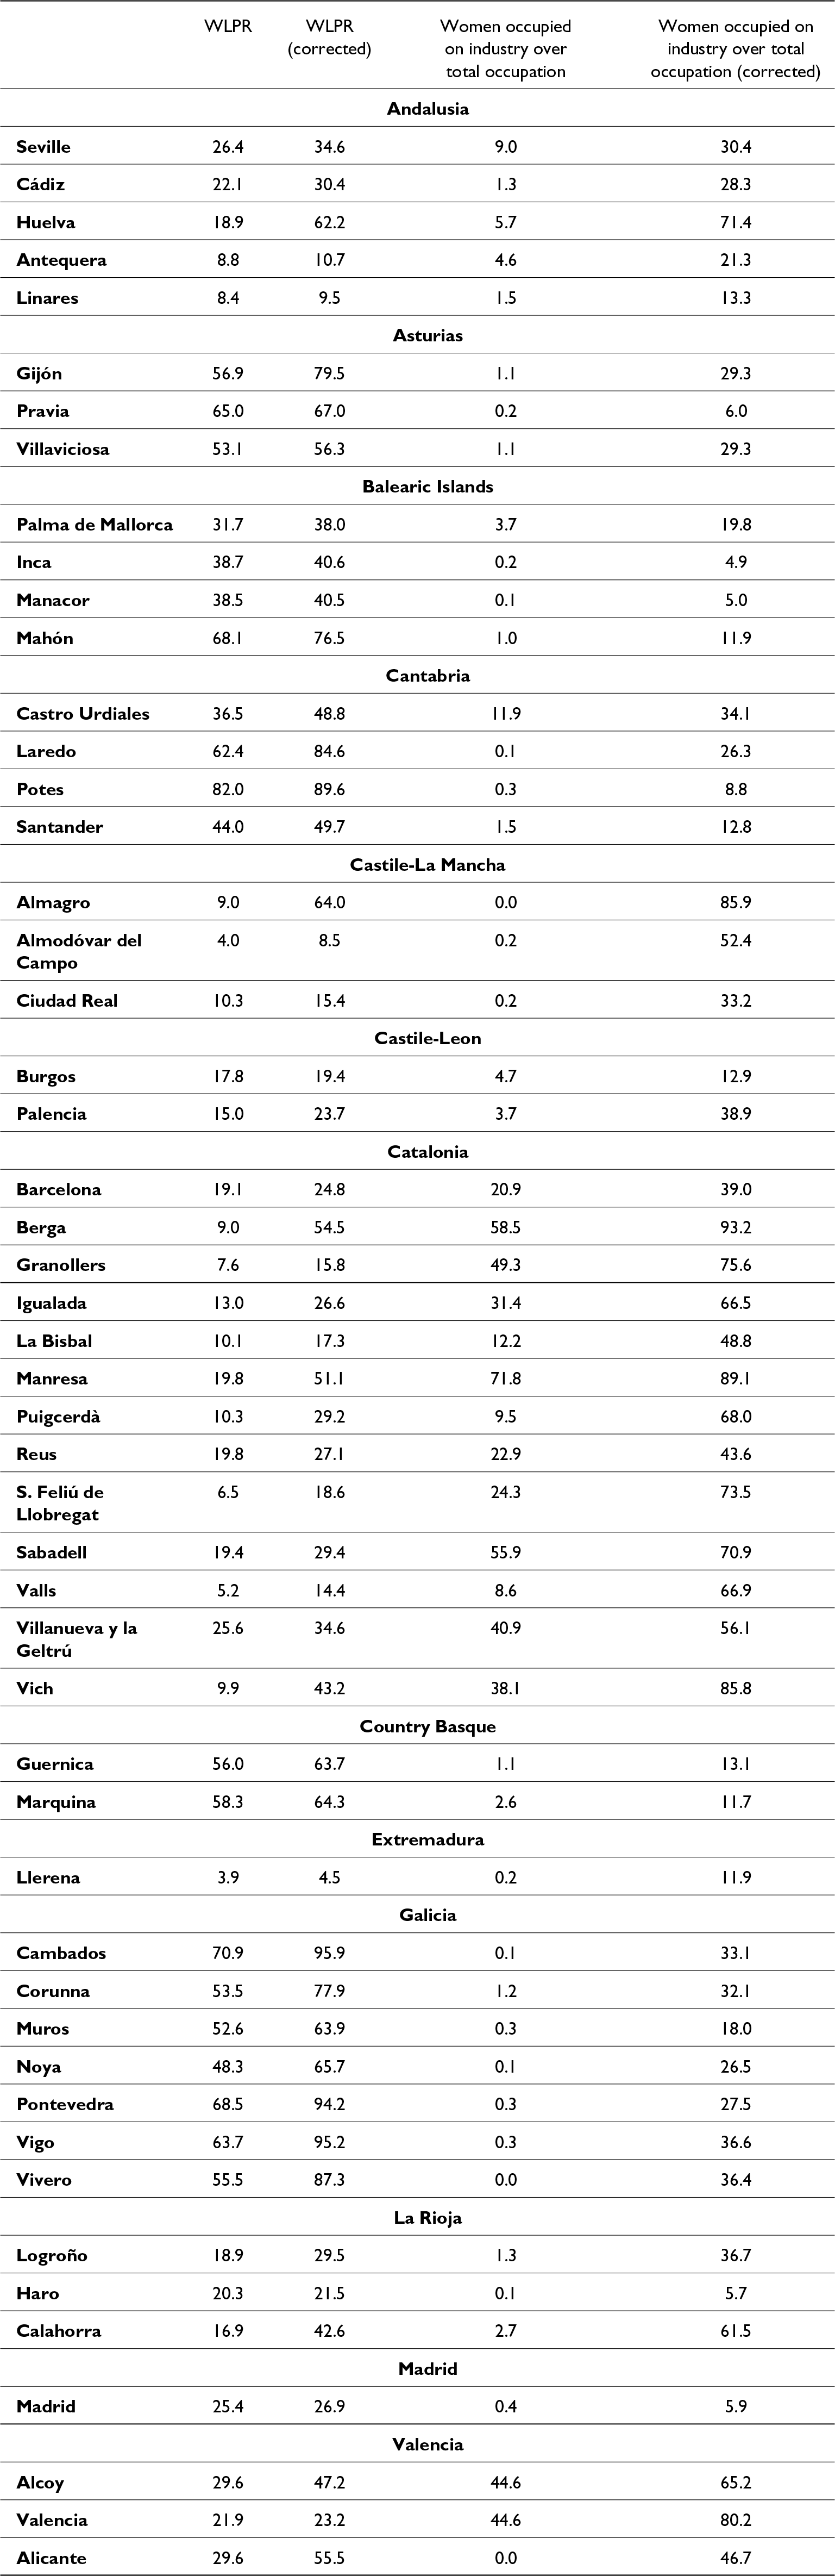
Table 2 shows women’s labor participation rates (WLPR) and industrial employment rates in selected judicial districts. Our corrected figures demonstrate significant increases in both sets of rates. Notably, the corrected WLPRs for 55 Spanish judicial districts are higher than the global Spanish rate published by Nicolau (Reference Nicolau, Carreras and Tafunell2005, p. 147) in Estadísticas Históricas de España.
Women’s labor participation rates by judicial districts, 1887 (uncorrected and corrected)
Sources: Censo de la Población de España, 1887; Sallarès I Pla (Reference Sallarès i Pla1892), Enrech (Reference Enrech2003); Escartin (Reference Escartin1999); Información oral y escrita publicada de 1889 a 1893; Estadística Administrativa de la Contribución Industrial y de Comercio: 1889–90; Reseña Geográfica y Estadística de España, 1888, Estadística Minera,1887; Memorias sobre la industria fabril redactadas por los ingenieros al servicio de la investigación de la Hacienda Pública, 1900; Anuario del Comercio, de la Industria, de la Magistratura y de la Administración, 1886.
Obviously, the corrected WLPR reinforces what Map 3 shows. The WLPR increase more than 10 points in those judicial districts where more than one industrial subsector was located, such as Corunna and Gijón (tobacco and fish-processing), Alicante (tobacco and shoes industry). Furthermore, in judicial districts specialized in textiles (Berga, Manresa, Puigcerdà) and fish-processing (Vigo, Cambados, Vivero, Laredo) the WLPR increase around 30 percent when census numbers are corrected. In sum, this section highlights women’s work in industry, emphasizing women’s contribution to the Spanish industrialization process from a spatial perspective using the judicial districts as the analysis unit.
4. Spatial patterns in women’s occupation rates
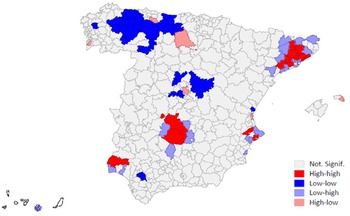
In order to determine whether spatial patterns in women’s occupation rates are randomly distributed or clustered, we used Moran’s index and the LISA. The Moran’s I value is highly significant (I = 0.212, P < 0.001) and indicates a strong degree of positive spatial autocorrelation. Judicial districts with high WLPRs tend to be located to other judicial districts with similarly high WLPRs, and judicial districts with low WLPRs tend to be close to others with low ones. Areas with a dominant industry that employs women, such as textile or canning, tend to cluster geographically. This creates spatial clusters with high WLPRs that influence adjacent judicial districts. We can see an example in judicial districts such as Berga, Vich, and Manresa in Catalonia; also Almagro and Puertollano in Castile-La Mancha (Map 4).
Spatial clustering of female rates in the secondary sector using inverse distance.

LISA maps are useful for identifying the geographic locations of judicial districts with high (or low) WLPRs and their degree of spatial autocorrelation. In these maps, the blue judicial districts have clusters with low WLPRs, while the red ones have clusters with high WLPRs. These regions, therefore, contribute significantly to the positive global spatial autocorrelation outcome.
Map 4 shows three main spatial clusters with important high-high association rates—one in the Mediterranean area (mentioned districts in Catalonia, Valencia, and Alicante); one in Ciudad Real, and one in the judicial district of Huelva. In the north, Vigo (Galicia), Laviana (Asturias), and Burgos (Castile-Leon) also have high women’s participation rates. These results reinforce our corrections of the 1887 census, showing not only that women’s participation rates are higher in judicial districts where industrial production or crafts were more developed, but also that they generate spillover effects on neighboring judicial districts. For example, if we compare the Ciudad Real cluster and with Map 3, we see that neighboring judicial districts have higher women’s employment rates than other judicial districts. This is the case of Almadén, Daimiel, Montoro, and Valdepeñas. In the Catalan cluster, Vilafranca del Penedés, Vic, Berga, Mataró, Manresa, Valls, Terrassa, and Granollers are examples of judicial districts with high WLPRs that are surrounded by districts that also have high rates—Tarragona, Ripoll, Martorell, Solsona, Figueres, Santa Coloma de Farnés, and Vendrell.
The case of Madrid is worth highlighting. The Madrid judicial district, which has high women’s occupation rates, is surrounded by districts with relatively low values. Guadalajara, Segovia, and Navalcarnero. Pallol et al. (Reference Pallol, Carballo and Albarrán2010) point out that from the mid-nineteenth century onwards, there were important short and medium distance migrations from neighboring provinces and of a temporary character. The more industrialized judicial districts would attract women from nearby rural areas, creating an observable migration pattern. In contrast, the mainly agrarian judicial districts might show clusters of low female occupation, with young women migrating to industrial cities in the north or to Madrid in search of better job opportunities. The results obtained from this analysis show significant evidence that the concentration of female labor is in those judicial districts with a long industrial tradition and also with commercial and administrative cities to be poles of population attraction, as is the case of Madrid and Barcelona (Perez-Moreda, Reference Perez-Moreda and Sanchez-Albornoz1987).
5. Conclusions
Based on official sources, conventional histories of women’s work are misleading. Economic and social historians must tackle the demanding but not impossible task of constructing alternative, more complete accounts using new historical sources. In this article, we improve our understanding of women’s labor participation rates and of labor markets by correcting records from the Censo de la Población de España 1887, starting with the industrial sector. We have done this exercise over 55 Spanish judicial districts. Population censuses such as this are commonly used to construct participation rates, even though they fail to reflect the actual dimensions of women’s economic activity in the past.
The 1887 census under-recorded the work of women, especially in industrial judicial districts in the region of Catalonia, in the northern Spanish coast, (Galicia, Asturias, Cantabria, and the Basque Country). Operating with alternative sources, it is possible to construct more accurate labor participation rates using the judicial districts as territory unit. In this article, we provide our own methodology, complementing information from censuses with alternative sources that demonstrate the extent of under-counting and can be used to correct women’s industrial occupational data in 1887. After examining a variety of documents—such as social and economic reports, mining and fishing statistics, trade and industrial directories, and industrial bulletins from the 1880s and 1890s—we were able to correct women’s labor participation rates in 55 judicial districts that together were representative of industrial Spain. We corrected four industrial activities in which women were traditionally employed—textiles, food industries, tobacco, and footwear industries—as well other activities in which women were less common, such as mining. Compared with conventional estimates of women’s labor participation rates, our corrected rates show notable increases—more than 20 points, and, in some judicial districts, more than 40 points.
Regarding textiles, we found many more women working in many Catalonia’s judicial districts (cotton and wool industries and other wool districts (Alcoy, Antequera). For fish processing, we found high women labor participation rates in Galicia and the Cantabrian and southwestern coasts, where fish processing was a crucial step toward economic modernization. Furthermore, we were able to correct the census figures for the tobacco industry increasing the women’ industrial work in all cities where the factories of CAT were placed, the made up 30,000 factory women working in tobacco factories (cigarreras).
We also found that women’s labor participation rates are unevenly distributed throughout Spain, that the Moran index presents significant values, indicating the existence of global autocorrelation; and finally, that there are judicial districts with similar patterns in terms of women’s labor participation rates. These results suggest that territory is influencing the values of the demands for female occupations, i.e., the highest participation rates for women are in traditionally industrial centers such as explained in this article.
Undercounting women workers distorts estimates of sectoral and aggregate labor forces and so biases productivity calculations. Such distortions can mislead economic historians, particularly when they use estimates of labor productivity to evaluate sector performance, nationally or internationally. Our new data are a first step toward more accurate women’s labor participation rates, which will help put economic history on a more solid footing.
Sources and Official Publications
Anuario del Comercio, de la Industria, de la Magistratura y de la Administración, 1886, Madrid: Editorial de D. Carlos Bailly-Bailliere
Anuario de la Renta de Tabacos de España, 1887
Boletín Comercial e Industrial de Galicia, 1885
Censo de la Población de España, 1887
Estadística administrativa de la contribución industrial y de comercio: 1889–1890. España Dirección General de Contribuciones. Imprenta de la Fábrica Nacional del Timbre, 1893.
Estadística minera y metalúrgica de España. Consejo de Minería y Metalurgia (ed).1861–1968.
Memorias sobre la industria fabril redactadas por los ingenieros al servicio de la investigación de la Hacienda Pública, 1900.
Reformas Sociales. Información oral y escrita practicada por la Comisión de Reformas Sociales en la provincia Tomos III, IV y V.
Reseña Geográfica y Estadística de España 1888. Dirección General del Instituto Geográfico y Estadístico; Imprenta de la Dirección General del Instituto Geográfico y Estadístico, impresor.
Acknowledgments
This research has been founded by Ministry of Economy and Competitiveness of Spain; FEDER, through the following project: Transformation of Occupational Structure in Spain, 1860–1970. New evidence for nonagrarian occupations revisiting Spanish Population Census. PID2021-123863NB-C22/AEI/10.13039/501100011033/ ERDF, EU. We thank Francisco Beltrán and Daniel Tirado for providing us with the shapefiles for the judicial districts and some data from the Census of 1887. A previous version of this paper was presented at the World Economic History Congress in Paris (2022) in the panel PA.050 | Occupation and Gender in 19th- and 20th-century Censuses. We would like to thank the participants for their comments, specially to Jane Humphries that was the discussant of this session. Any remaining errors are our own.






 Open access

